vertical profile of heavy metal concentration in core...
TRANSCRIPT

Indian Journal of Geo-Marine Sciences
Vol. 40(1), February 2010, pp.83-97
Vertical profile of heavy metal concentration in core sediments of Buckingham
canal, Ennore
Usha Natesan and B. Ranga Rama Seshan1
1Centre for Environmental Studies, Anna University Chennai, Chennai – 600 025. India
[E-mail: [email protected]]
Received 20 October 2009; revised 14 January 2010
Down core variations in heavy metal concentrations at every 2.5cm increment was determined. Four cores were
collected to assess the heavy metals - Cd, Cr, Cu, and Mn in the Ennore creek and one core was collected from the sea. Mn
is present in highest concentrations in all cores ranging 0.9 to 4ppm. Results were processed used correlation and factor
analysis. Results of statistical analysis show that positive correlation exists among fine grained particles and heavy metals.
Correlations of OM with heavy metals is also observed. Results confirm that fate of heavy metal in sediment is influenced
by many parameters. Sediment pollution assessment was carried out using geoaccumalation index, anthropogenic,
enrichment and contamination factor. Muller’s Igeo classification places Ennore under class
0 - uncontaminated except C3 which falls under class 6 (very highly contaminated). EF places Ennore under minimal
contamination. According to Pollution Load Index calculations Ennore shows low to moderate degree of contamination.
[Key words: Core, Ennore, Heavy metal, Pollution, Sediment]
Introduction Sea, and more particularly the aquatic systems
(e.g. estuaries), are the ultimate repository of
anthropogenic wastes. Highly dynamic nature of the
marine environment allows for very rapid assimilation
of these materials by processes such as dilution,
dispersal, oxidation, degradation or sequestration into
sediments. However, the capacity for such assimilation
is limited thereby leading to pollution. Increase in
urbanisation and industrialisation has led to increase in
marine discharges and, therefore, the total load of
pollutants being delivered to the sea1. These discharges
contain heavy metals among a host of other pollutants.
Various complex diagenetic processes can also
influence sedimentary trace metal concentration
profiles. Diffusion of metal to a sink located below
the sediment–water interface can occur if dissolved
metal concentrations are higher in the water column
than in porewaters2&3
; this can create subsurface peaks
in sedimentary metals that could be erroneously
attributed to variations in metal deposition. Trace
metals can also be mobilized after their deposition
and then either relocalized in the sediment column4-6
or diffuse to the water column7. The upper layers of
sediments can be mixed by physical processes due to
the burrowing and feeding activities of benthic
organisms; these mixing processes tend to
homogenize metal concentrations in the mixing zone8.
The geochemical mobility of toxic metals in
sediments depend on how and type of sediment phase
they are bound to and their chemical form, which, in
turn, is related to the physicochemical and biological
characteristics of the environmental system. In
general the mobility of heavy metals in sediment is
severely limited by strong sorption reactions between
metal ions and negatively charged particles of
sediments9. However, several long-term experiments
have evidenced an enhanced mobility of metal ions in
organic matter rich sediments10-13
.
Organic matter together with pH is the most
important parameter controlling heavy metal
behaviour in sediment. Heavy metals bound on
insoluble humic substances are relatively immobile.
On the other hand, binding onto smaller organic
molecules may increase metal mobility and
bioavailability14
. Humic carboxylic -COOH and
phenolic -OH groups are mainly involved in the
formation of metal-humic complexes15&16
.
With Ennore being a major industrial complex,
there is a need to assess the status of the marine
environment around Ennore. The study of core
________________
Corresponding author : Dr. Usha Natesan
E-mail: [email protected]
Phone : +91 44 22203195/ + 91 44 22203032
Fax: +91 44 24472547/ + 91 44 22354717
INDIAN J. MAR. SCI., VOL. 40, NO. 1, FEBRUARY 2011
84
samples gives an historical record of concentration of
heavy metal i.e bottom sediments and the surface
sediments representative of pre-industrial and recent
times respectively. Apart from analysis of heavy
metals, since the fate and transport of these metals are
governed by sedimentological parameters such as pH,
grain size, sediment composition and organic matter,
these were included in the study.
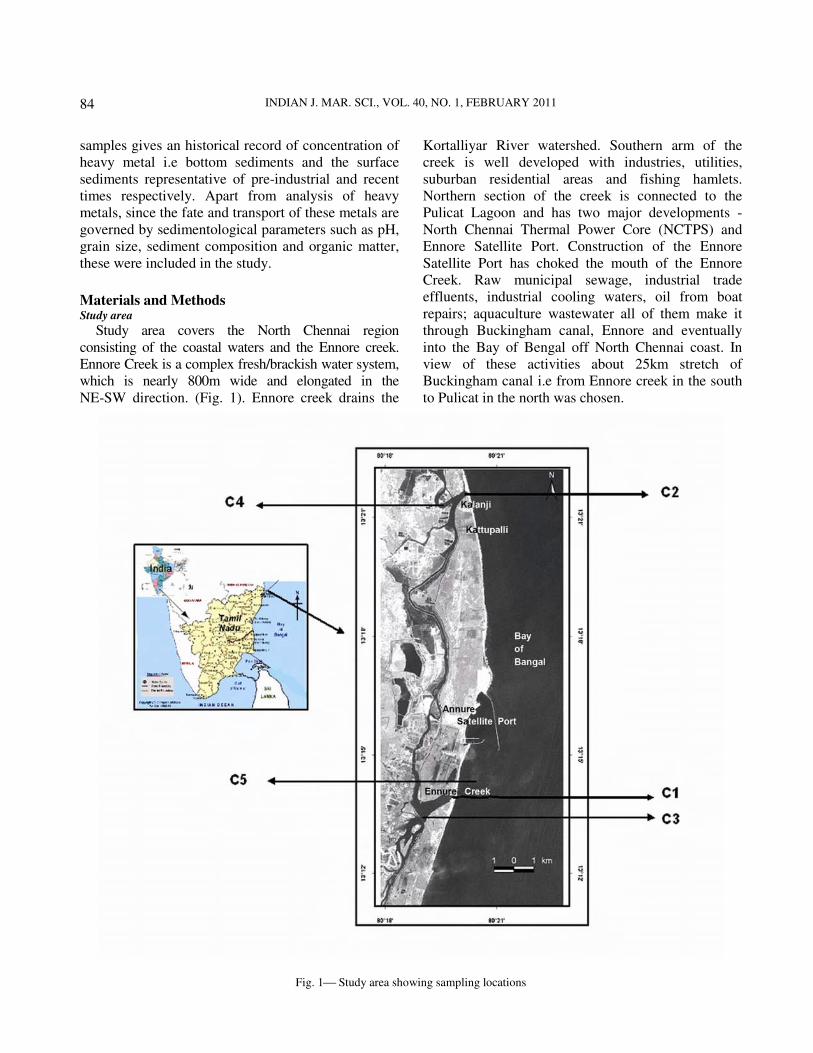
Materials and Methods Study area
Study area covers the North Chennai region
consisting of the coastal waters and the Ennore creek.
Ennore Creek is a complex fresh/brackish water system,
which is nearly 800m wide and elongated in the
NE-SW direction. (Fig. 1). Ennore creek drains the
Kortalliyar River watershed. Southern arm of the
creek is well developed with industries, utilities,
suburban residential areas and fishing hamlets.
Northern section of the creek is connected to the
Pulicat Lagoon and has two major developments -
North Chennai Thermal Power Core (NCTPS) and
Ennore Satellite Port. Construction of the Ennore
Satellite Port has choked the mouth of the Ennore
Creek. Raw municipal sewage, industrial trade
effluents, industrial cooling waters, oil from boat
repairs; aquaculture wastewater all of them make it
through Buckingham canal, Ennore and eventually
into the Bay of Bengal off North Chennai coast. In
view of these activities about 25km stretch of
Buckingham canal i.e from Ennore creek in the south
to Pulicat in the north was chosen.
Fig. 1 Study area showing sampling locations
USHA & SESHAN: VERTICAL PROFILE OF HEAVY METAL CONCENTRATION IN CORE SEDIMENTS
85
Core collection and analysis
Cores were collected from 5 locations as shown in
Figure 1. The sampling locations were selected based
on the prevailing stresses. Core 1 (C1) is close to the
creek where the coolant water and fly ash from
NCTPS is discharged. There is a second inlet to the
canal which is permanently closed and Core 2 (C2)
was collected close to this inlet. Discharges from
various industries can be seen at southern side of the
creek, this has been fixed as Core 3 (C3). Pulicat
where the environmental condition is relatively
pristine has been fixed as Core 4 (C4). Core 4 is
considered as reference for this study. A core was
collected from the Bay of Bengal, Core 5 is located
(C5) at a distance of about 2km from the coast to
determine if the heavy metals from Ennore have been
dispersed and deposited in the Bay of Bengal.
Core collection was done by acid washed PVC
coring tube of 10cm diameter and 1m length which
was presealed on one side was used. A boat was hired
and the sampling locations were fixed with Global
Positioning System (Table 1). The pre-labeled core
was inserted into water sediment interface. Pressure
was applied to ensure the core penetrates to the
maximum depth. After reaching the bottom, the core
was slowly retrieved back and closed. Core was
marked indicating the upward direction. Cores were
collected within the canal viz Ennore creek and
Second inlet inner side; from Pulicat Lagoon and
industrial discharge on 18.07.08. Sea core was
collected with the help of NIOT Research Vessel
Sagar Purvi on 03.06.08.
During sampling, the water depth was measured
using a tide pole. Salinity, temperature and dissolved
oxygen (DO) of surface water were recorded in the
field using a probe. DO was measured using WTW
Oxi 330/SET, salinity using Cyberscan Con/TDS with
0.1 mS resolution and temperature was measured
using a standard thermometer. The cores were frozen
for a period of four days and then sliced horizontally
at 2.5 cm interval. Sediment samples were stored in
clean labeled polythene covers.
Sediment samples were dried at 70-80°C for 48
hours prior to analysis. The shells present in the dried
samples were handpicked. The clumps present in the
samples were broken down with a help of mortar &
pestle. Sediments were analysed for their composition
with the help of the procedure adopted by Krumbein
and Pettijohn17
. Grain size analysis was carried out for
the surface subsamples using a set of 10 sieves spaced
from 2000mm to 45µ. Samples were sieved for
15minutes in Rotop sieve shaker. Sediment retained
on each sieve was carefully removed and weighed.
Cumulative weight % retained with the help of
GRADSTAT directly calculated the grain size
distribution18
. pH of the sediment samples were
determined using Cyberscan PCD 5500 pH meter
having a carbon glass electrode with resolution 0.01.
Determination of calcium carbonate and organic
matter in sediment were done following the procedure
of Loring and Rantala19
and Gaudette20
respectively.
Geoaccumalation index was calculated using an
equation given by Müller (1979). Anthropogenic
factor was calculated for the cores collected. With the
help of this it was possible to differentiate between
geogenic and anthropogenic input of heavy metals.
For digestion of heavy metals, the sediment
samples were sieved through 230µ mesh sieve and
was acid digested. The extraction was performed with
1g of sediment. Trace metals were determined by
digestion with HF, HNO3, and H2SO4 in a sealed
Teflon vessel (Teflon bomb) using a hot plate21&22
.
Digested samples were filtered with Whatman Grade
“A” filter paper and the filtrate was analyzed for Cd,
Cr, Cu and Mn in Optima emission spectrophotometer
Optima 2100 Dy. Chemicals of high purity (Merck,
Germany) were used for the analysis and standard
solutions were prepared from 1000mg/L stock
solution for each metal. Quality assurance testing
relied on the control of blanks and a yield for
chemical procedure was quantitative at 100 ± 5.2%.
Relative chemical standard solutions
(Merck’s Multielement Standard Solution IV,
Germany) were run to check the precision of the
Table 1 Core Details
Core Number Core
Latitude (N)
Longitude (E)
Water Depth in m
Core retrieval
depth in cm
Number of
subsamples
1 Ennore Creek 13°14.120' 80°19.896' 1.25 35.0 13
2 Second inlet inner side 13°22.296' 80°19.642' 1.68 35.0 13
3 Industrial discharge 13°13.413' 80°19.139' 0.16 42.5 16
4 Pulicat lagoon 13°24.411' 80°19.505' 0.9 40.0 15
5 Ennore Sea 13°14'5''.04 80°20'39''.33 20.0 8

INDIAN J. MAR. SCI., VOL. 40, NO. 1, FEBRUARY 2011
86
instrument throughout the analysis. Results obtained
for all analysed samples were within ± 2.25% error
limit with a precision of 95%.
Results And Discussion Surface Water Quality
Temperature, salinity and DO of surface water
details are outlined in Table 2. C1, records maximum
temperature (36°C) due to the discharge from
NCTPS. Kalaivani (2007)23
reported that this station
records remarkably higher temperature with an
average increase of 9°C compared to other stations.
Consistent high temperature is due to the coolant
water discharge from NCTPS. Minimum DO of
0.7mg/L is recorded at Industrial Discharge (C3).
Accumulated sludge could have contributed to the
reduction in DO by decreasing the rate of dissolution
of atmospheric oxygen which in turn may enhance the
rate of biochemical oxidation24
. DOD (2001)25
report
showed that Ennore creek is contaminated by sewage
released from Buckingham Canal with nil to low DO
and values of other elements were more or less within
limits. The salinity value recorded is less compared to
the other Cores. Surface water quality characteristics
could not be obtained for the core collected from
Ennore Sea.
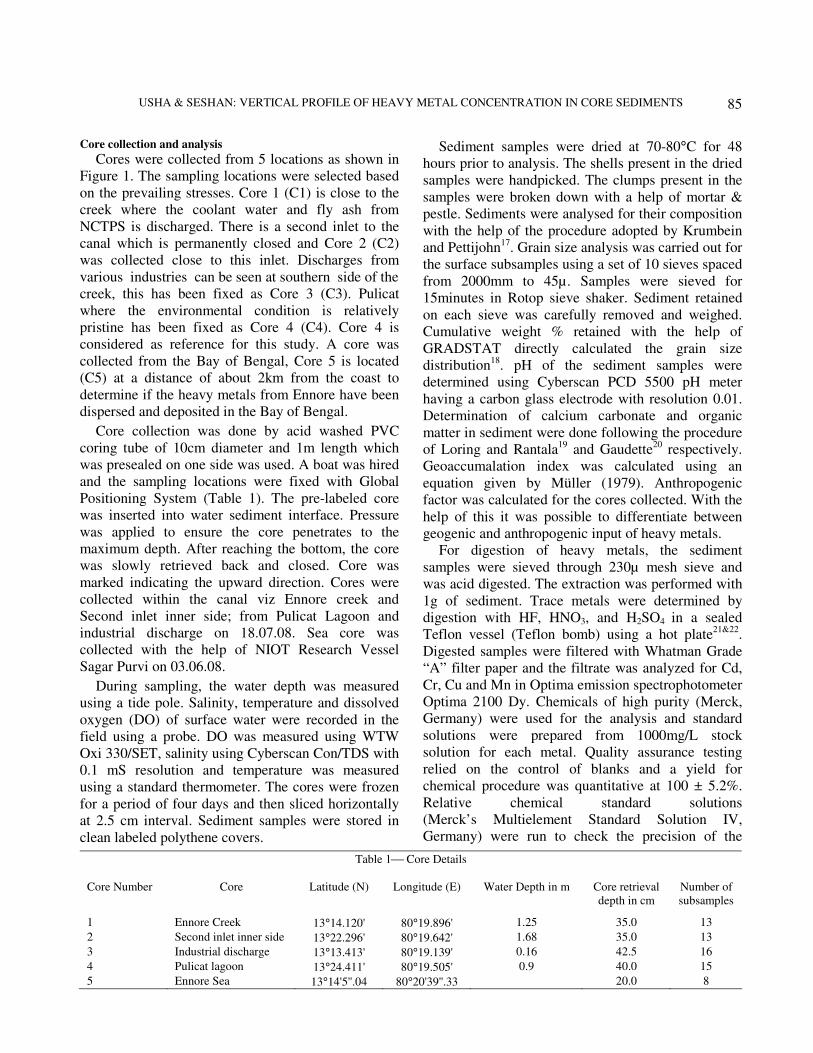
Sediment Texture And Composition
Grain size analysis using GRADSTAT software
shows that the sediment samples have a sandy texture.
Fig. 2 shows graphical variations in grain size for
each core. Ennore creek comprises of coarse sand
with a d50 value of 621.1µm. At C1 around 95 – 99%
of sand is recorded (Fig. 3). C1 is composed of coarse
sand due to the constant tidal exchange between the
creek and the Bay of Bengal which brings in coarse
sand particles whereas the other cores have medium
sand. Silt content in the vertical profile ranges
between 0.3 and 5%. Negligible amount of clay was
present. A slight decrease in sand content was
observed at a depth of 35cm which is compensated by
increase in the silt content. Ennore Sea and Industrial
discharge consists of poorly sorted fine sand but
Ennore sea sand domination is observed whereas silt
forms the highest fraction in C3 due to the huge
amount of sludge from industrial discharge. High silt
and clay was observed in C3 and similarly high
concentration of heavy metals in the top in 7.5cm
indirectly indicating greater extent of pollution during
the recent times. As indicated by Doyle and Shields26
d50 i.e. median bed material grain size best represents
grain size distribution and thus was included in the
analyses. The least d50 value is observed in C4
(293.5µm). Table 3 gives the detailed description of
the nature of the sediments. C3 and C4 are mesokurtic
whereas C2 and C5 are platykurtic and only C1 is
very leptokurtic in nature. In C5 although sand was
found to be dominating there is a reduction from 90%
to 80% owing to the nature of sediments in the Pulicat
lagoon. It is compensated by subsequent increase in
both clay and silt. Sediments with a high percentage
of small grains, such as silt and clay, have high
surface-to-volume ratios and can adsorb more heavy
metals than sediments composed of large grains, such
as sand27
.
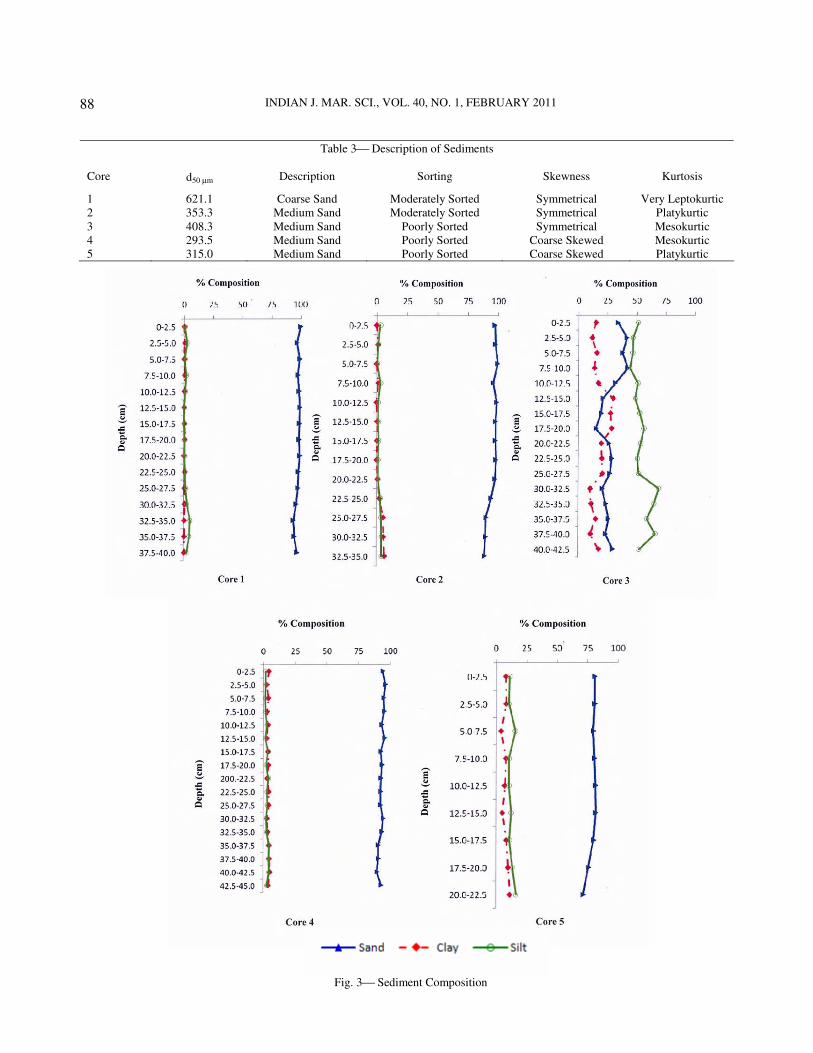
pH
pH of sediment controls the solubility of different
metals as opined by Ahrland28
. There is not much
down core as well as Core to Core variations in pH
(Fig. 4). It lies between slightly acidic to neutral to
slightly basic. The apparent unevenness length wise is
due the variations in core retrieval depth for each
Core. C3 has neutral to basic pH whereas all the other
locations the pH lies between 6-7 or in few cases less
than 6 viz C4 at a depth of 25cm and 45cm the pH
drops to 5.82 and 5.97 respectively. Industrial
discharge shows a basic pH throughout the core.
Metals such as copper, cadmium, lead, and zinc can
be mobilized during oxidation of anoxic or at low pH
sediments through oxidation of sulfide phases29
and
oxidation of organic matter30
. C3 shows a greater
basic nature with a corresponding decreased Cd
concentration. Cu is totally absent in all cores.
Calcium Carbonate And Organic Matter
The down core variations in calcium carbonate is
shown in Fig. 5. C1 showed the highest CaCO3 with
6% at the surface and drops to about 4% at a depth of
15cm and then again increases and varies from 5 to
4%. The source of calcium carbonate is dead
organisms – molluscs, foraminifera, coccoliths and
their shells lying all along the shores. The second
Table 2 Surface Water Quality
Core Temperature (°C) DO (mg/L) Salinity (ppt)
1 36.0 6.0 33.2
2 28.8 4.4 27.4
3 29.0 0.7 27.2
4 30.6 4.7 30.6
5 - - -

USHA & SESHAN: VERTICAL PROFILE OF HEAVY METAL CONCENTRATION IN CORE SEDIMENTS
87
Fig. 2 Grain Size Distribution
INDIAN J. MAR. SCI., VOL. 40, NO. 1, FEBRUARY 2011
88
Fig. 3 Sediment Composition
Table 3 Description of Sediments
Core d50 µm Description Sorting Skewness Kurtosis
1 621.1 Coarse Sand Moderately Sorted Symmetrical Very Leptokurtic
2 353.3 Medium Sand Moderately Sorted Symmetrical Platykurtic
3 408.3 Medium Sand Poorly Sorted Symmetrical Mesokurtic
4 293.5 Medium Sand Poorly Sorted Coarse Skewed Mesokurtic
5 315.0 Medium Sand Poorly Sorted Coarse Skewed Platykurtic
USHA & SESHAN: VERTICAL PROFILE OF HEAVY METAL CONCENTRATION IN CORE SEDIMENTS
89
highest CaCO3 % is observed in C5. Presence of
CaCO3 here can be attributed to the presence of
shelled organisms in the marine environment and
moreover Indian coastline falls in the category of
calcareous ooze and has 50% to less than 50% by
weight of calcium carbonate31
, upon the death and
decay of shelled organisms below the Carbonate
Compensation Depth, dissolution takes place and
calcium carbonate gets deposited. Least concentration
of CaCO3 is observed at C3, this being the site for
industrial discharge chances of shell deposition is
minimal due to the heavy sludge loading. The
remaining two Cores, viz C2 and C4, lying within the
canal supports a rich biodiversity including shelled
organisms thereby showing the presence of CaCO3.
At a depth of 25-35cm in C4 CaCO3 is present at 2%.
Taking into account its high specific surface area,
organic matter can form complexes with heavy metal
and consequently influence their distributions32
. Clays
have high specific surface area and can directly trap
heavy metals, but they also may act as a substrate for
organic matter flocculation33
that in turn adsorbs
metals. Cores C2, C3 and C4 have high organic
matter of 2-9% (Fig. 6) and they are the ones that
have relatively higher concentration of heavy metals.
The source for organic matter within the canal is due
to the fine nature of sediments, high rate of
sedimentation and larger supply of organic matter
from river runoff34
. C1 recorded the highest
concentration of organic matter (10.175%).Sea core
shows relatively lower organic matter content ranging
from 1.7 – 4.7%. It is observed that in all the cores the
surface subsamples have higher organic matter
content compared the bottom subsamples.
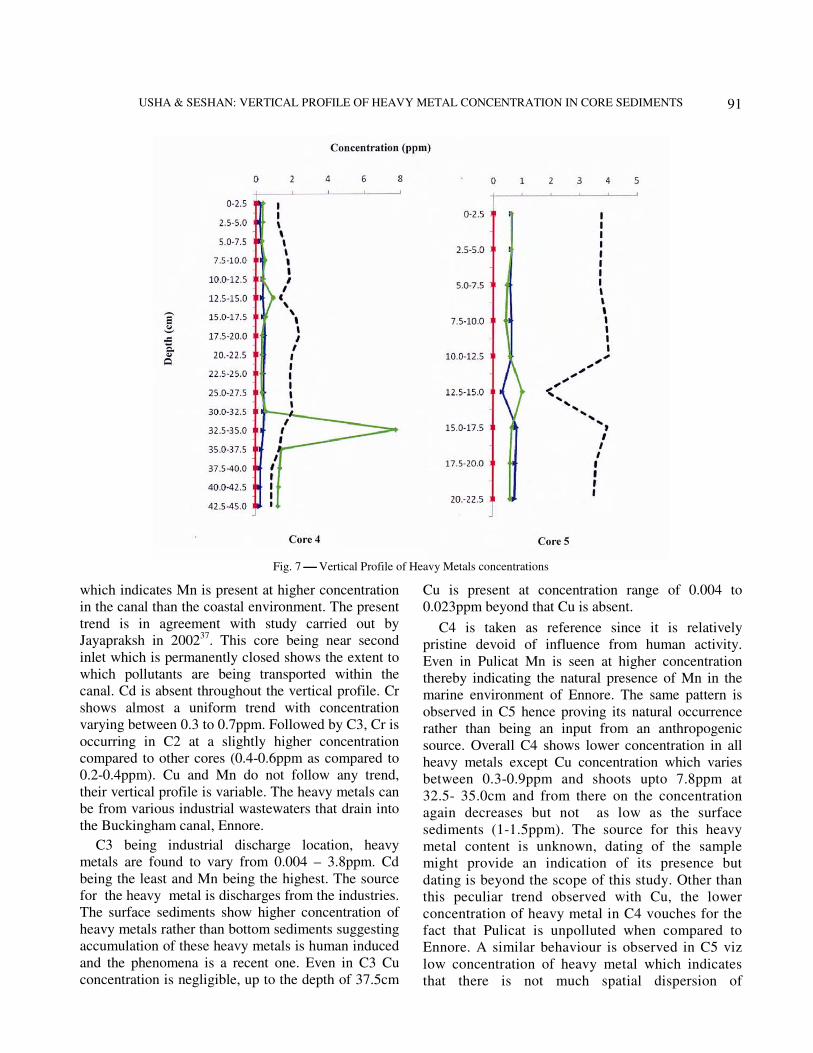
Vertical Profile Of Heavy Metals
Fig. 7 shows the trend in down core variation in
heavy metal concentrations. Adsorption of heavy
metal ions and complexes on clay minerals occurs as
a result of ion exchange, surface complexation,
hydrophobic interaction and electrostatic interaction.
Clay minerals play an important role in accumulation,
adsorption/desorption, as well as exchange processes
Fig. 4 pH variations
Fig. 5 Variations in Calcium carbonate

INDIAN J. MAR. SCI., VOL. 40, NO. 1, FEBRUARY 2011
90
of metal ions35
. The elemental sequence of heavy
metal concentration expressed in ppm is as follows:
Mn (1 to 4ppm) > Cu (0.1 to 7ppm) > Cr
(0.1 to 1.5ppm) > Cd (0 to 0.023ppm).
C1 is relatively less polluted in comparison with
other Cores. This can be to due to the highly dynamic
nature of creek with continuous tidal action and
dilution with seawater thereby reducing the chances
of passage of heavy metals from water to sediment.
Moreover enhanced mobility of metal ions is
observed in organic matter rich soils and the nature of
the creek sediments being sandy makes it incapable
for the metal to bind to the soil. In the creek, Cu is
present in higher concentration compared to other
metals (0.434 - 2.886ppm). Globally, the average
concentration of Cu in river-borne solids transported
in estuaries is relatively higher (2500ppm) than that of
near shore sediments36
(48ppm), whereas in all the
other cores Mn is present at higher concentration
(0.777 - 1.326ppm). Cd and Cr are present at
concentrations barely exceeding 0.05ppm. Mn is
present at about 1 ppm. Cu is present as high as
2.9ppm. The trend in Cu is variable compared to the
other metals.
In C2 all the metals are present at about 2ppm
whereas Mn is present at a concentration of 3ppm
Fig. 6 Variations in Organic Matter
Fig. 7 Vertical Profile of Heavy Metals concentrations
USHA & SESHAN: VERTICAL PROFILE OF HEAVY METAL CONCENTRATION IN CORE SEDIMENTS
91
which indicates Mn is present at higher concentration
in the canal than the coastal environment. The present
trend is in agreement with study carried out by
Jayapraksh in 200237
. This core being near second
inlet which is permanently closed shows the extent to
which pollutants are being transported within the
canal. Cd is absent throughout the vertical profile. Cr
shows almost a uniform trend with concentration
varying between 0.3 to 0.7ppm. Followed by C3, Cr is
occurring in C2 at a slightly higher concentration
compared to other cores (0.4-0.6ppm as compared to
0.2-0.4ppm). Cu and Mn do not follow any trend,
their vertical profile is variable. The heavy metals can
be from various industrial wastewaters that drain into
the Buckingham canal, Ennore.
C3 being industrial discharge location, heavy
metals are found to vary from 0.004 – 3.8ppm. Cd
being the least and Mn being the highest. The source
for the heavy metal is discharges from the industries.
The surface sediments show higher concentration of
heavy metals rather than bottom sediments suggesting
accumulation of these heavy metals is human induced
and the phenomena is a recent one. Even in C3 Cu
concentration is negligible, up to the depth of 37.5cm
Cu is present at concentration range of 0.004 to
0.023ppm beyond that Cu is absent.
C4 is taken as reference since it is relatively
pristine devoid of influence from human activity.
Even in Pulicat Mn is seen at higher concentration
thereby indicating the natural presence of Mn in the
marine environment of Ennore. The same pattern is
observed in C5 hence proving its natural occurrence
rather than being an input from an anthropogenic
source. Overall C4 shows lower concentration in all
heavy metals except Cu concentration which varies
between 0.3-0.9ppm and shoots upto 7.8ppm at
32.5- 35.0cm and from there on the concentration
again decreases but not as low as the surface
sediments (1-1.5ppm). The source for this heavy
metal content is unknown, dating of the sample
might provide an indication of its presence but
dating is beyond the scope of this study. Other than
this peculiar trend observed with Cu, the lower
concentration of heavy metal in C4 vouches for the
fact that Pulicat is unpolluted when compared to
Ennore. A similar behaviour is observed in C5 viz
low concentration of heavy metal which indicates
that there is not much spatial dispersion of
Fig. 7 Vertical Profile of Heavy Metals concentrations

INDIAN J. MAR. SCI., VOL. 40, NO. 1, FEBRUARY 2011
92
pollutants and the pollutants have not reached to a
distance of 2km into the sea from the coast.
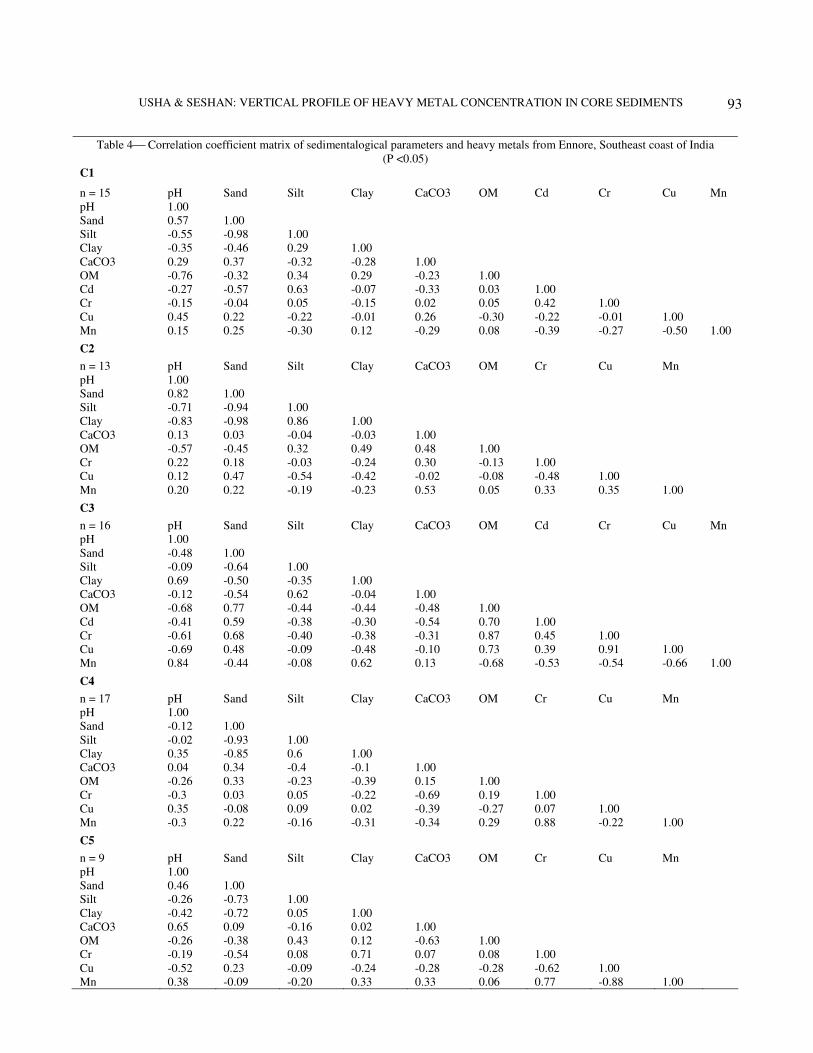
Correlation indexes were calculated for similarities
in composition of samples from different locations.
Cd was considered for statistical analysis only in C1
and C3. From the correlation matrix it is evident that
clay and silt (fine grained fraction) reveals good
correlation with heavy metals except in C3 (Table 4).
Weak association of Cd and Cr with fine grained
fraction in C3 indicate that they are not controlled by
grain size. In C4 and C5, Cr and Mn are positively
correlated. In C3 and C4, Cr and Cu are positively
correlated. Notably, the correlation and geochemical
associations of metals reveal a significant source of
contamination reflecting a common origin of similar
nature existing from the industrial effluents38
. Organic
matter also has good positive correlation with heavy
metals.
Geoaccumulation Index
The Geoaccumulation Index (Igeo) introduced by
Muller39
was used to assess metal pollution in
sediments of Ennore (Table 5). Igeo is expressed as
follows:
Igeo = log2 (Cn /1.5 * Bn ) where
Cn - measured concentration of heavy metal in the
sediment,
Bn - geochemical background value in average
shale40
of element n,
1.5 is the background matrix correction in factor
due to lithogenic effects.
Igeo calculation was carried out only for the surface
sediment in each core. The calculated values for
Ennore and its surrounding marine environment are
given in Table 6. As far as pollution due to Cd is in
Ennore is concerned, it is uncontaminated. C3 for Cr
and Cu falls under the class very highly contaminated.
C4 is the only core that shows moderate
contamination the rest of the cores show
contamination to a greater extent which provides
evidence that C4 is comparatively uncontaminated.
Anthropogenic Factor
In order to evaluate the data in detail the
anthropogenic factors (AF) of elements in the Cores
were calculated according to the formula,
AF = Cs/Cd
41 where
Cs and Cd refer to the concentrations of the
elements in the surface sediments and at depth in
sediment column.
According to Ruiz-Ferna´ndez42
, if AF is >1 for a
particular metal, it means contamination exists;
otherwise if AF is ≤ 1, there is no metal enrichment of
anthropogenic origin. AF for the Cores collected in
Ennore is tabulated in Table 7.
AF values suggest that all metals except for Cd in
the core samples of Ennore are anthropogenic. AF is
also seen to depend on the core sample location with
maximum AF observed for Mn followed by Cu at C3.
Enrichment Factor
The extent of sediment contamination can be
assessed using the enrichment factor (EF). EF is a
good tool to differentiate the metal source between
anthropogenic and naturally occurring43,44,45,46
.
According to this technique metal concentrations
were normalized to the textural characteristic of
sediments. It is standardization of a tested element
against a reference. A reference element is the one
characterized by low occurrence variability. The
common reference elements are Sc, Mn, Ti, Al and Fe
47, 48, 49, 50, 51, 52. In the present study Mn was used as
the reference metal.
EF = sample
reference
(Me/Mn)
(Me/Mn)
where Me/Mn is the ratio of the metal (Me) to Mn in
samples of interest and Me/Mn Reference is the natural
reference value of the metal to Mn ratio. EF values
were interpreted as suggested by Birch53
. The
enrichment categories are outlined in Table 8.
EF values vary within the Buckingham canal,
Ennore with minimal to significant enrichment
(Table 9). Cd is consistent throughout the study area
with minimal enrichment. Cr at C3 shows moderate
enrichment the rest being minimal enrichment.
Significant enrichment is observed at C1.
Assessment Of Sediment Contamination By
Comparision Of Concentartion With Those Of
Background Sediments
Hakanson54
had suggested a contamination factor
(Cif) and the degree of contamination (Cd) to describe
the contamination of given toxic substance given by
Cif = C
i 0-1/ C
i n and Cd = Σ7
i=1 Cif
USHA & SESHAN: VERTICAL PROFILE OF HEAVY METAL CONCENTRATION IN CORE SEDIMENTS
93
Table 4 Correlation coefficient matrix of sedimentalogical parameters and heavy metals from Ennore, Southeast coast of India
(P <0.05)
C1
n = 15 pH Sand Silt Clay CaCO3 OM Cd Cr Cu Mn
pH 1.00
Sand 0.57 1.00
Silt -0.55 -0.98 1.00
Clay -0.35 -0.46 0.29 1.00
CaCO3 0.29 0.37 -0.32 -0.28 1.00
OM -0.76 -0.32 0.34 0.29 -0.23 1.00
Cd -0.27 -0.57 0.63 -0.07 -0.33 0.03 1.00
Cr -0.15 -0.04 0.05 -0.15 0.02 0.05 0.42 1.00
Cu 0.45 0.22 -0.22 -0.01 0.26 -0.30 -0.22 -0.01 1.00
Mn 0.15 0.25 -0.30 0.12 -0.29 0.08 -0.39 -0.27 -0.50 1.00
C2
n = 13 pH Sand Silt Clay CaCO3 OM Cr Cu Mn
pH 1.00
Sand 0.82 1.00
Silt -0.71 -0.94 1.00
Clay -0.83 -0.98 0.86 1.00
CaCO3 0.13 0.03 -0.04 -0.03 1.00
OM -0.57 -0.45 0.32 0.49 0.48 1.00
Cr 0.22 0.18 -0.03 -0.24 0.30 -0.13 1.00
Cu 0.12 0.47 -0.54 -0.42 -0.02 -0.08 -0.48 1.00
Mn 0.20 0.22 -0.19 -0.23 0.53 0.05 0.33 0.35 1.00
C3
n = 16 pH Sand Silt Clay CaCO3 OM Cd Cr Cu Mn
pH 1.00
Sand -0.48 1.00
Silt -0.09 -0.64 1.00
Clay 0.69 -0.50 -0.35 1.00
CaCO3 -0.12 -0.54 0.62 -0.04 1.00
OM -0.68 0.77 -0.44 -0.44 -0.48 1.00
Cd -0.41 0.59 -0.38 -0.30 -0.54 0.70 1.00
Cr -0.61 0.68 -0.40 -0.38 -0.31 0.87 0.45 1.00
Cu -0.69 0.48 -0.09 -0.48 -0.10 0.73 0.39 0.91 1.00
Mn 0.84 -0.44 -0.08 0.62 0.13 -0.68 -0.53 -0.54 -0.66 1.00
C4
n = 17 pH Sand Silt Clay CaCO3 OM Cr Cu Mn
pH 1.00
Sand -0.12 1.00
Silt -0.02 -0.93 1.00
Clay 0.35 -0.85 0.6 1.00
CaCO3 0.04 0.34 -0.4 -0.1 1.00
OM -0.26 0.33 -0.23 -0.39 0.15 1.00
Cr -0.3 0.03 0.05 -0.22 -0.69 0.19 1.00
Cu 0.35 -0.08 0.09 0.02 -0.39 -0.27 0.07 1.00
Mn -0.3 0.22 -0.16 -0.31 -0.34 0.29 0.88 -0.22 1.00
C5
n = 9 pH Sand Silt Clay CaCO3 OM Cr Cu Mn
pH 1.00
Sand 0.46 1.00
Silt -0.26 -0.73 1.00
Clay -0.42 -0.72 0.05 1.00
CaCO3 0.65 0.09 -0.16 0.02 1.00
OM -0.26 -0.38 0.43 0.12 -0.63 1.00
Cr -0.19 -0.54 0.08 0.71 0.07 0.08 1.00
Cu -0.52 0.23 -0.09 -0.24 -0.28 -0.28 -0.62 1.00
Mn 0.38 -0.09 -0.20 0.33 0.33 0.06 0.77 -0.88 1.00

INDIAN J. MAR. SCI., VOL. 40, NO. 1, FEBRUARY 2011
94
Table 9 EF of Ennore
C1 C2
Depth (cm) EF (Cd) EF (Cr) EF (Cu) Depth (cm) EF (Cd) EF (Cr) EF (Cu)
0.0-2.5 0 1.05 7.39 0.0-2.5 0 1.01 1.05
2.5-5.0 0 1.35 7.42 2.5-5.0 0 0.92 1.57
5.0-7.5 0 1.32 10.62 5.0-7.5 0 1.42 1.28
7.5-10.0 0 1.13 8.11 7.5-10.0 0 1.21 0.98
10.0-12.5 0 1.12 11.64 10.0-12.5 0 0.79 4.18
12.5-15.0 0 0.84 3.09 12.5-15.0 0 0.76 0.68
15.0-17.5 0 1.08 6.48 15.0-17.5 0 0.96 2.46
17.5-20.0 0 0.73 2.27 17.5-20.0 0 1.22 3.99
20.0-22.5 0 0.76 7.45 20.0-22.5 0 0.88 3.83
22.5-25.0 0 0.77 6.49 22.5-25.0 0 0.86 2.69
25.0-27.5 0 1.00 9.39 25.0-27.5 0 0.93 1.99
30.0-32.5 0 0.93 12.14 30.0-32.5 0 0.96 1.33
32.5-35.0 0 0.74 0.22 32.5-35.0 0 0.72 0.07
35.0-37.5 0 0.84 0.62
37.5-40.0 0 1.76 1.15
C3 C4
Depth (cm) EF (Cd) EF (Cr) EF (Cu) Depth (cm) EF (Cd) EF (Cr) EF (Cu)
0.0-2.5 0 2.11 2.20 0.0-2.5 0 1 1
2.5-5.0 0 2.99 2.47 2.5-5.0 0 1 1
5.0-7.5 0 2.68 3.01 5.0-7.5 0 1 1
7.5-10.0 0 1.62 1.29 7.5-10.0 0 1 1
10.0-12.5 0 1.23 1.23 10.0-12.5 0 1 1
12.5-15.0 0 0.78 0.22 12.5-15.0 0 1 1
15.0-17.5 0 1.01 0.59 15.0-17.5 0 1 1
17.5-20.0 0 1.00 0.90 17.5-20.0 0 1 1
20.0-22.5 0 0.97 0.88 20.0-22.5 0 1 1
22.5-25.0 0 0.82 0.63 22.5-25.0 0 1 1
25.0-27.5 0 0.79 0.55 25.0-27.5 0 1 1
30.0-32.5 0 0.91 0.49 30.0-32.5 0 1 1
32.5-35.0 0 0.77 0.03 32.5-35.0 0 1 1
35.0-37.5 0 1.33 0.29 35.0-37.5 0 1 1
37.5-40.0 0 1.47 0.63 37.5-40.0 0 1 1
40.0-42.5 0 1.61 0.55 40.0-42.5 0 1 1
42.5-45.0 0 1 1
Table 5 Geoaccumalation index classes to assess sediment
quality
Igeo Class Igeo Value Quality of Sediment
0 < 0 Uncontaminated
1 0 - 1 Uncontaminated to moderately
contaminated
2 1 - 2 Moderately contaminated
3 2 - 3 Moderately to highly contaminated
4 3 - 4 Highly contaminated
5 4 - 5 Highly to very highly contaminated
6 > 5 Very highly contaminated
Table 6 Igeo classification for Ennore
C1 C2 C3 C4 C5
Cd Igeo Class 0 0 0 0 0
Cr Igeo Class 1 2 6 2 3
Cu Igeo Class 6 3 6 2 2
Mn Igeo Class 1 3 3 2 4
Table 7 Anthropogenic Factor (AF) in Core Samples of Ennore
C1 C2 C3 C4 C5
Cd 0.14 0 0 0 0
Cr 0.51 1.26 1.03 1.03 0.83
Cu 1.55 1.1 0.92 0.3 1.04
Mn 1.15 1.17 1.05 1.39 1.06
Table 8 Enrichment categories
EF class Extent of Enrichment
< 2 Deficiency to minimal enrichment
2 -5 Moderate enrichment
5 – 20 Significant enrichment
20 - 40 Very high enrichment
> 40 Extremely high enrichment
USHA & SESHAN: VERTICAL PROFILE OF HEAVY METAL CONCENTRATION IN CORE SEDIMENTS
95
where, Ci0-1 is the mean content of the substance;
Ci
n is the reference value for the substance.
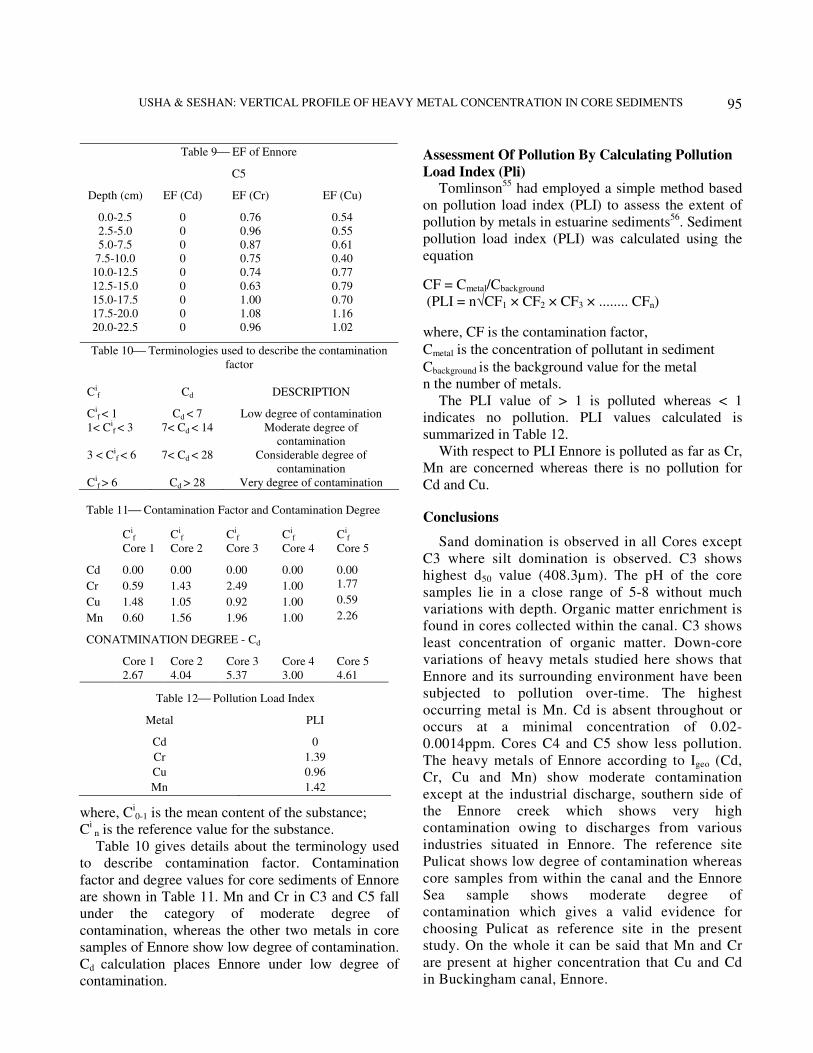
Table 10 gives details about the terminology used
to describe contamination factor. Contamination
factor and degree values for core sediments of Ennore
are shown in Table 11. Mn and Cr in C3 and C5 fall
under the category of moderate degree of
contamination, whereas the other two metals in core
samples of Ennore show low degree of contamination.
Cd calculation places Ennore under low degree of
contamination.
Assessment Of Pollution By Calculating Pollution
Load Index (Pli) Tomlinson
55 had employed a simple method based
on pollution load index (PLI) to assess the extent of
pollution by metals in estuarine sediments56
. Sediment
pollution load index (PLI) was calculated using the
equation
CF = Cmetal/Cbackground
(PLI = n√CF1 × CF2 × CF3 × ........ CFn)
where, CF is the contamination factor,
Cmetal is the concentration of pollutant in sediment
Cbackground is the background value for the metal
n the number of metals.
The PLI value of > 1 is polluted whereas < 1
indicates no pollution. PLI values calculated is
summarized in Table 12.
With respect to PLI Ennore is polluted as far as Cr,
Mn are concerned whereas there is no pollution for
Cd and Cu.
Conclusions
Sand domination is observed in all Cores except
C3 where silt domination is observed. C3 shows
highest d50 value (408.3µm). The pH of the core
samples lie in a close range of 5-8 without much
variations with depth. Organic matter enrichment is
found in cores collected within the canal. C3 shows
least concentration of organic matter. Down-core
variations of heavy metals studied here shows that
Ennore and its surrounding environment have been
subjected to pollution over-time. The highest
occurring metal is Mn. Cd is absent throughout or
occurs at a minimal concentration of 0.02-
0.0014ppm. Cores C4 and C5 show less pollution.
The heavy metals of Ennore according to Igeo (Cd,
Cr, Cu and Mn) show moderate contamination
except at the industrial discharge, southern side of
the Ennore creek which shows very high
contamination owing to discharges from various
industries situated in Ennore. The reference site
Pulicat shows low degree of contamination whereas
core samples from within the canal and the Ennore
Sea sample shows moderate degree of
contamination which gives a valid evidence for
choosing Pulicat as reference site in the present
study. On the whole it can be said that Mn and Cr
are present at higher concentration that Cu and Cd
in Buckingham canal, Ennore.
Table 9 EF of Ennore
C5
Depth (cm) EF (Cd) EF (Cr) EF (Cu)
0.0-2.5 0 0.76 0.54
2.5-5.0 0 0.96 0.55
5.0-7.5 0 0.87 0.61
7.5-10.0 0 0.75 0.40
10.0-12.5 0 0.74 0.77
12.5-15.0 0 0.63 0.79
15.0-17.5 0 1.00 0.70
17.5-20.0 0 1.08 1.16
20.0-22.5 0 0.96 1.02
Table 10 Terminologies used to describe the contamination
factor
Cif Cd DESCRIPTION
Cif < 1 Cd < 7 Low degree of contamination
1< Cif < 3 7< Cd < 14 Moderate degree of
contamination
3 < Cif < 6 7< Cd < 28 Considerable degree of
contamination
Cif > 6 Cd > 28 Very degree of contamination
Table 11 Contamination Factor and Contamination Degree
Cif
Core 1
Cif
Core 2
Cif
Core 3
Cif
Core 4
Cif
Core 5
Cd 0.00 0.00 0.00 0.00 0.00
Cr 0.59 1.43 2.49 1.00 1.77
Cu 1.48 1.05 0.92 1.00 0.59
Mn 0.60 1.56 1.96 1.00 2.26
CONATMINATION DEGREE - Cd
Core 1 Core 2 Core 3 Core 4 Core 5
2.67 4.04 5.37 3.00 4.61
Table 12 Pollution Load Index
Metal PLI
Cd 0
Cr 1.39
Cu 0.96
Mn 1.42

INDIAN J. MAR. SCI., VOL. 40, NO. 1, FEBRUARY 2011
96
References 1 McGlashan J E, Characteristics of waste discharges: Marine
Pollution - A 1988 Perspective, in: South African National
Scientific Programme Report No. 161, edited by Moden
AGS and Ridder JH 1989, pp 11 – 20.
2 Carignan R & Nriagu J O, Trace metal deposition and mobility
in the sediments of two lakes near Sudbury, Ontario, Geochim
Cosmochim. Acta, 49(1985) pp 1753–1764.
3 Carignan R, Rapin F & Tessier A, Sediment porewater
sampling for metal analysis: A comparison of techniques,
Geochim Cosmochim Acta, 49(1985) pp 2493–2497.
4 Gobeil C, Silverberg N, Sundby B & Cossa D, Cadmium
diagenesis in Laurentian Trough sediments, Geochim
Cosmochim Acta, 51(1987) pp 589–596.
5 Gobeil C & Cossa D, Mercury in sediments and sediment
pore water in the aurentian Trough, Can. J. Fish. Aquat. Sci.,
50(1993) pp 1794–1800.
6 McCorkle D C & Klinkhammer G P, Porewater cadmium
geochemistry and the porewater cadmium: 13C
relationship, Geochim Cosmochim. Acta, 55(1993)
pp 161-168.
7 Morfett K, Davison W & Hamilton-Taylor J, Trace metal
dynamics in a seasonally anoxic lake, Environ Geol Water
Sci., 11(1998) pp 107–114.
8 Matisoff G, Effects of bioturbation on solute and particle
transport in sediments in Metal Contaminated Aquatic
Sediments, edited by H E Allen, 1995, pp 201–272. Ann
Arbor Press.
9 Stumm W (ed.), Chemical processes at the particle-water
interface. Aquatic Surface Chemistry (John Wiley & Sons,
New York) 1987
10 Berggren D, Bergkvist B, Falkengren-Grerup U, Folkeson L
& Tyler G, Metal solubility and pathways in acidified forest
ecosystems of South Sweden, Sci. Total Environ., 96(1990)
pp 103-114.
11 Li Z & L M Shuman, Heavy metal movement in metal-
contaminated soil profiles. Soil Sci., 161(1996)
pp 656–666.
12 Streck T & Richter J, Heavy metal displacement in a
sandy soil at the field scale: Measurements and
parameterization of sorption. J Environ Qual 26, (1997)
pp 49-56.
13 Kalbitz K & Wennrich R, Mobilization of heavy metals and
arsenic in polluted wetland soils and its dependence on
dissolved organic matter, Sci. Total Environ, 209(1998)
pp 27–39.
14 Kabata-Pendias A & Pendias H Trace elements in soils and
plants. (Boca Raton Ann Arbor, London) 1992, CRC Press,
2nd edition.
15 Spark K.M, Wells, J D & Johnson B B, The interaction of a
humic acid with heavy metals, Australian Journal of Soil
Resources, 35(1997) pp 89–101.
16 Datta A, Sanyal SK & Saha S, A study of natural and
synthetic humic acids and their complexing ability towards
cadmium, Plant Soil, 235(2001) pp 115–125.
17 Krumbein W C & Pettijohn F J, Manual of Sedimentary
petrography. (D. Appleton Century Co. Inc., New York)
1938, pp 549 - 551.
18 Folk R.L & Ward W C, Brazos river bar: A study in the
significance of grain size parameters, Jour. Sediment. Petrol.,
27(1957) pp 3-27.
19 Loring D.H & Rantala Manual for the geochemical analyses
of marine sediments and suspended particulate matter. Earth
Sci Rev., 32(1992) pp 235-283
20 Gaudette H E Flight W R, Toner L & Folger D W, An
inexpensive titration method for the determination of organic
carbon in recent sediments, J Sediment Petrol., 44(1974)
pp 249-253
21 Agemian H & Chau A S Y, Evaluation of extraction
technique for the determination of metals in aquatic
sediments, Analyst.,101(1976) pp 761-767.
22 Voutsinou-Taliadouri F, A weak acid extraction method as a
tool for the metal pollution assessment in surface sediments,
Mikrochimica Acta, 119(1995) pp 243-249.
23 Kalavani S, Pollution induced inter and intra specific
changes in the benthic community structure in the
Buckingham canal, Ennore, Ph.D. thesis, Anna University
Chennai, India, 2007.
24 Department of Ocean Development, Coastal Ocean Monitoring
and Prediction System, Annual Report, (2001) pp 37–110.
25 Doyle M W & Shields Jr F D, Incorporation of bed texture
into a channel evolution model, Geomorphology, 34(2000)
pp 291-309.
26 Carolyn S, Bentivegna, Joy-Elaine Alfano Sean M. Bugel &
Katarzyna Czechowicz., Influence of Sediment Characteristics
on Heavy Metal Toxicity in an Urban Marsh, Journal on the
Biology of Urban Areas Around the world., 2(2004)
27 Ahrland S, Metal complexes in seawater in: alhem Workshop
Report edited by E.D. Goldberg Berlin 1975 pp 219- 244.
28 Kerner M & Wallmann K, Remobilization events involving
Cd and Zn from intertidal flat sediments in the Elbe estuary
during the tidal cycle, Estuarine Coastal Shelf Sci. 35(1995)
pp 371-393.
29 Forstner U & Patchineelam S R, Chemical associations of
heavy metals in polluted sediments from the Lower Rhine
river in Kavanaugh,(1980) http://ditullioj.people.cofc.edu/
teaching/610/Ch08_Figures.ppt
30 Marchand C, Lallier-Vergès E, Baltzer F, Albéric P,
Cossa D & Baillif P, Heavy metals distribution in mangrove
sediments along the mobile coastline of French Guiana,
Marine Chemistry 98(1)(2006) pp 1-17
31 Keil R.G, Montlucon D B, Prahl F R & Hedges J I, Sorptive
preservation of labile organic matter in marine sediments,
Nature, 370(1990) pp 549-552.
32 Muthumanickam Jayaprakash, Geochemical Assesment of
Heavy Metal Pollution in Ennore Creek, North of Chennai,
India, University of Madras (India), (2003) 298.
33 Ma Catalina alfaro-de la torre & Andŕe Tessier, Cadmium
deposition and mobility in the sediments of an acidic
oligotrophic lake, Geochimica et Cosmochimica Acta,
66:20(2002) pp 3549-3562.
34 Aston S R. & Chester R, Estuarine sediment process,
Estuarine chemistry, Academic press, (1976) pp 37-50.
35 Jayaprakash A, Geochemical assessment of heavy metal
pollution in Ennore creek, North of Chennai, Tamil Nadu,
India, Ph.D. thesis, University of Madras. India. (2002).
36 Turner A, Trace metal concentration in sediments from U.K.
estuaries: an empirical evaluation of the role of hydrous iron
and manganese oxides. Estuar. Coast. Shelf Sci. 50(2000)
pp 355-371.
37 Muller G, Schwermetalle in den Sedimenten des Rheins
Veranderungen seit. Umschau 24(1979) pp 778–783.

USHA & SESHAN: VERTICAL PROFILE OF HEAVY METAL CONCENTRATION IN CORE SEDIMENTS
97
38 Turekian K K & Wedepohl K H, Distribution of the elements
in some major units of the Earth’s crust. Bull. Geol.Soc. Am.
72(1961) pp 175–192.
39 Szefer P, Geldon J, Ahmed Ali A, Paez Osuna F, Ruiz-
Fernandes, A.C., & Guerro Gaivan, S.R., Environmental
International 24:3(1998) pp 359-374.
40 Ruiz-Ferna´ndez, A C, Pa´ez-Osuna F, Hillaire-Marcel C,
Soto-Jime´nez M & Ghaleb B, Principal component analysis
applied to assessment of metal pollution from urban wastes
in the Culiaca´n river estuary Bull. Environ. Contam. Toxicol
67(2001) pp 741-748.
41 Morillo J, Usero J & Gracia I, Heavy metal distribution in
marine sediments from the southwest coast of Spain.
Chemosphere 55(2004) pp 431–442.
42 Selvaraj K, Ram Mohan V & Szefer P, Evaluation of metal
contamination in coastal sediments of the Bay of Bengal,
India: geochemical and statistical approaches, Marine
Pollution Bulletin 49(2004) pp 174–185.
43 Adamo P, Arienzo M, Imperato M, Naimo D, Nardi G &
Stanzione D, Distribution and partition of heavy metals in
surface and sub-surface sediments of Naples city port,
Chemosphere 61(2005) pp 800–809.
44 Vald’es J, Vargas G, Sifeddine A, Ortlieb L & Guinez M,
Distribution and enrichment evaluation of heavy metals in
Mejillones Bay (23 _S), Northern Chile: geochemical and
statistical approach, Marine Pollution Bulletin 50(2005)
pp 1558–1568.
45 Pacyna J M & Winchester J W, Conatmination of the global
environment as observed in the Arctic, Palaeogeogr
Palacoclimatol Palaeoecol, 82(1990) pp 149 -157.
46 Quevauviller P, Lavigne R & Cirtex I, Impact of Industrial
and mine drainage wastes on the heavy metal distribution in
the drainage basinand estuary of the Sado River (Portugal),
Environ Pollut 59(1989) pp 267-286.
47 Reimann C & de Carital P, Instrinsic flaws of element
enrichment factors (EFs) in environmental geochemistry,
Environ Sci Technol 34(2000) pp 5084-5091.
48 Schiff K C & Weisberg S B, Iron as a reference element
for determining trace metal enrichment in Southern
California coastal shelf sediments, Mar Environ Res
48(1999) 161-176.
49 Sutherland R A, Bed sediment – associated trace metals in an
urban stream Oahu, Hawaii. Environ Geol, 39(2000)
pp 611-627.
50 Sugirtha Kumar P & Patterson Edward J K, Assessment of
metal concentration in the sediment cores of Manakudy
estuary, south west coast of India. Indian J. Mar. Sci.,
38:2(2009) pp 235-248.
51 Birch G A scheme for assessing human impacts on coastal
aquatic environments using sediments. In: Woodcoffe, C.D.,
Furness R A (Eds.), Coastal GIS 2003. Wollongong
University Papers in Center for Maritime Policy, 14,
Australia. (2003)
52 Hakanson L, Ecological risk index for aquatic pollution
control. A sedimentological approach. Water Res, 14:5(1980)
pp 975-1001.
53 Tomlinson D C, Wilson J G, Harris C R & Jeffery D W,
Problems in the assessment of heavy metals levels in
estuaries and the formation of a pollution index, Helgol.
Wiss. Meeresunters, 33:1-4(1980) pp 566-575.
54 Satyanarayana D, Panigrahy P K & Sahu S D, Metal
pollution in harbor and coastal sediments of
Visakhapatnam, east coast of India, Indian J. Mar. Sci.,
23:1(1994) pp 52-54