vertical drains, vacuum consolidation & preloading · the ability of the vacuum consolidation...
TRANSCRIPT

University of WollongongResearch Online
Faculty of Engineering - Papers (Archive) Faculty of Engineering and Information Sciences
2012
Vertical drains, vacuum consolidation & preloadingBuddhima IndraratnaUniversity of Wollongong, [email protected]
http://ro.uow.edu.au/engpapers/4887
Research Online is the open access institutional repository for the University of Wollongong. For further information contact the UOW Library:[email protected]
Publication DetailsIndraratna, B. (2012). Vertical drains, vacuum consolidation & preloading. In N. Denies & H. Noel (Eds.), International Symposiumon Ground Improvement (pp. I-47-I-62).

ISSMGE - TC 211 International Symposium on Ground Improvement IS-GI Brussels 31 May & 1 June 2012
Indraratna – General Report – SESSION 2 – VERTICAL DRAINS, VACUUM CONSOLIDATION & PRELOADING
General Report SESSION 2 – VERTICAL DRAINS, VACUUM CONSOLIDATION &
PRELOADING
Buddhima Indraratna Centre for Geomechanics and Railway Engineering,
Faculty of Engineering, University of Wollongong, NSW, Australia, [email protected]
1. INTRODUCTION
Due to the rapid increase in population, and the subsequent industrial and construction boom, especially in the urban and coastal regions, many countries have intensified the inevitable need for developing infrastructure on problematic soils, including soft compressible clays and deposits with low bearing capacities. Moreover, good quality geological materials for construction are also becoming scarce, a problem exacerbated by the numerous environmental constraints imposed in various countries. Because of these reasons, and environmental restrictions on certain public works, ground improvement has now become an integrated and essential component of infrastructure development. Consequently, civil engineers are forced to utilise even the softest and weakest of natural deposits for foundations, and therefore, the application of ground improvement techniques, including preloading and consolidation, vacuum consolidation, among other methods, have now become common practice in heavy construction.
There are 8 papers allocated to this Technical Session, composed of 25 Authors and co-authors from 5 countries.
This General Report attempts to offer a review of the majority of papers that have made significant contributions, but due to its imposed brevity, not all the papers could be reviewed and commented on in detail. Nevertheless, brief comments on all papers have been provided, as warranted, to provide a balanced overview of the entire Technical Session. Most papers elucidate already established technologies, but provide greater insight into the processes, supplemented with well compiled field and laboratory data. While a few papers have drawn on modified theoretical concepts, most papers presented field studies, including comparisons between predictions and observations, as warranted.
The following part of the Report describes the contributions to this session in relation to vertical drains and vacuum consolidation.
2. SOFT CLAY CONSOLIDATION WITH VERTICAL DRAINS
There are 8 articles in this section. This category of papers describes the consolidation process with time, with very useful information on field data, laboratory testing, analytical formulations and numerical modelling, including some reference to the comparison of observed data with consolidation predictions.
Indraratna et al. (2012) analysed case histories from Australia using schemes that combined PVD and vacuum preloading. The theory of equivalent 2D consolidation gives almost the same settlement-time curves as the true 3-D analysis, as shown in Fig. 1 (source Fig. 9). It also shows that a relative high vacuum pressure of up to -70 kPa can significantly decrease the required fill height and achieve a desirable degree of consolidation exceeding 95%. They also show that for these normally consolidated soft clays, the modified Cam-clay parameters are sufficient to predict the settlement, pore pressures and lateral displacements with acceptable accuracy.

ISSMGE - TC 211 International Symposium on Ground Improvement IS-GI Brussels 31 May & 1 June 2012
Indraratna – General Report – SESSION 2 – VERTICAL DRAINS, VACUUM CONSOLIDATION & PRELOADING
Figure 1: (a) Settlement; and (b) excess pore water pressure predictions and field data for a typical settlement plate location. (Source: Fig. 9, Indraratna et al. 2012)
Rujikiatkamjom and Indraratna (2012) proposed a radial consolidation model using a piecewise technique to investigate the smear effect in layered soil. The effects of permeability of the penetrating upper layer of soil on the underlying layer are discussed in terms of the degree of consolidation. The intrusion of the upper layer into the underlying layer creates an additional zone where the remoulded permeability of this zone can be increased or decreased depending on the initial permeability of the upper layer. In the intrusion zone located in the lower layer, the change in permeability can be divided into 3 distinct zones, including (a) a smear zone due to the upper layer of soil being dragged down, (b) a smear zone due to the underlying soil being remoulded, and (c) an undisturbed lower layer of soil (Fig 2, source Fig 3). The piecewise-linear technique has been considered to be an appropriate approach to determine the effect of soil dragdown on overall consolidation. An array of design procedures with an example already worked out illustrates the role of down-dragged soil. Kirstein and Wittorf (2012) analysed a case history in Germany where a stone column was used. In order to deal with dump soil, a very comprehensive site investigation was carried out. A technical and economic optimisation was achieved by an additional investigation of the soil using a Ménard pressure meter, and then adjusting the ground improvement methods to the respective sections. The high quality of construction with stone columns, and dynamic replacement and CMC-columns was documented not only in the foundation with the usual manufacturing protocols, but also tested regularly during construction phase with a Ménard pressure meter. The stone columns were 10 to 15 m deep. The improved soil characteristics were determined in relation to the stresses, according to Figure 3 (Source Fig. 6): by the load below the maximum height of the dam, where there was a big improvement in the characteristic values than on the parts with lower stresses, and where a less optimal angle of friction by installed gravel was taken into account. Large shear tests were used to check the friction angle of the gravel.

ISSMGE - TC 211 International Symposium on Ground Improvement IS-GI Brussels 31 May & 1 June 2012
Indraratna – General Report – SESSION 2 – VERTICAL DRAINS, VACUUM CONSOLIDATION & PRELOADING
Soil layer 1
Soil layer 2
Soil layer ith
Smear Zone
Figure 2: Down drag effects due to mandrel installation in layered soil (Source: Fig. 3, Rujikiatkamjorn and Indraratna 2012)
Figure 3: Stability analysis taking stress-dependent soil parameters into account (Source: Fig. 3, Kirstein and Wittorf 2012)
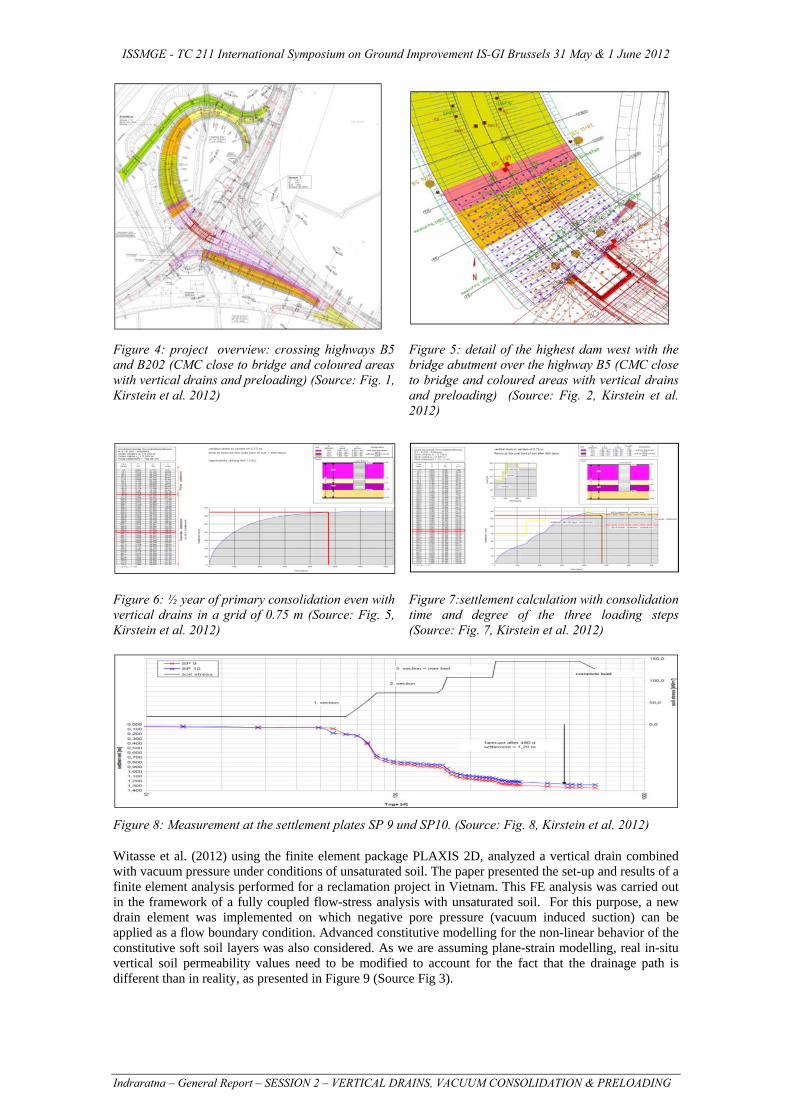
Kirstein et al. (2012) investigated the effect of wick drain consolidation as a soil improvement method in very soft clay and fat northern German clay (Figure 4, Source: Fig. 1). The example from Germany consisted of a new road crossing with 1.5 to 7.0 m high dams alongside the Danish border, where very soft clays were found 13 to 20 m below sea level (Figure 5, Source: Fig. 2). The undrained shear strength of the clay varied between 7 and 20 kN/m², the water content was almost 100 % and the organic matter below 6 %. A consolidation coefficient Cv < 0.3 m²/year revealed a significant fat clay which required long settlement time or a small grid of vertical drains for consolidation. From the stability calculations, the smallest grid of vertical drains were placed 0.5 m apart in part of the highest dam, which was built in three load steps, each of which required from 60 to 80 % consolidation before the next step could be loaded. The first 1.29 m of total settlements were calculated in the area west of the bridge with the following timeline of primary and secondary consolidation according to Figure 6 (Source: Fig. 5). Even using 600 kN/m geogrids totaling around 150 cm vertical settlements, around 20 cm horizontal deformation in each direction were measured throughout one year of monitoring. The stability calculations were based on Cu and required three steps of loading with beams and waiting twice for a sufficient degree of consolidation. The control results of the final stability analysis based on phi´, C´ and pore water pressure showed that the calculations based on undrained shear strength Cu were on the safe side. The settlement calculation had to be repeated according to the stability analysis with a fitting consolidation process in each of the three load steps. The measured settlements during consolidation in Figure 7 (Source: Fig. 7) fit the predictions given in Figure 8 (Source: Fig. 8). With a detailed planning of the steps in the workflow, the correct predictions, and a monitoring system fitted, economic soil improvement techniques can be combined with deep foundations in one project, and even very soft soil can be treated successfully.
ISSMGE - TC 211 International Symposium on Ground Improvement IS-GI Brussels 31 May & 1 June 2012
Indraratna – General Report – SESSION 2 – VERTICAL DRAINS, VACUUM CONSOLIDATION & PRELOADING
Figure 4: project overview: crossing highways B5 and B202 (CMC close to bridge and coloured areas with vertical drains and preloading) (Source: Fig. 1, Kirstein et al. 2012)
Figure 5: detail of the highest dam west with the bridge abutment over the highway B5 (CMC close to bridge and coloured areas with vertical drains and preloading) (Source: Fig. 2, Kirstein et al. 2012)
Figure 6: ½ year of primary consolidation even with vertical drains in a grid of 0.75 m (Source: Fig. 5, Kirstein et al. 2012)
Figure 7:settlement calculation with consolidation time and degree of the three loading steps (Source: Fig. 7, Kirstein et al. 2012)
Figure 8: Measurement at the settlement plates SP 9 und SP10. (Source: Fig. 8, Kirstein et al. 2012)
Witasse et al. (2012) using the finite element package PLAXIS 2D, analyzed a vertical drain combined with vacuum pressure under conditions of unsaturated soil. The paper presented the set-up and results of a finite element analysis performed for a reclamation project in Vietnam. This FE analysis was carried out in the framework of a fully coupled flow-stress analysis with unsaturated soil. For this purpose, a new drain element was implemented on which negative pore pressure (vacuum induced suction) can be applied as a flow boundary condition. Advanced constitutive modelling for the non-linear behavior of the constitutive soft soil layers was also considered. As we are assuming plane-strain modelling, real in-situ vertical soil permeability values need to be modified to account for the fact that the drainage path is different than in reality, as presented in Figure 9 (Source Fig 3).

ISSMGE - TC 211 International Symposium on Ground Improvement IS-GI Brussels 31 May & 1 June 2012
Indraratna – General Report – SESSION 2 – VERTICAL DRAINS, VACUUM CONSOLIDATION & PRELOADING
(a) Axisymmetric radial flow (b) Plane strain flow
Figure 9: Comparison of axisymmetric unit cell radial flow into plane strain flow (Source: Fig. 3, Witasse et al. 2012)
Eight Gauss points K, L, M, N, O, R, P and Q located respectively at the centre of layers 1a1, 1a2, 1b and 1c were chosen to follow the main parameters in this analysis: total vertical stress, effective vertical stress and active pore pressures (see Figures 10 and 11, (Source Figs 6 and 7)). Figure 12 (Source Fig 1) summarises the evolution of the lateral displacement induced by the vacuum pressure. These figures show the ability of the vacuum consolidation process to generate lateral displacement inwards to the treated area, as expected for a porous medium subjected to an isotropic depression. Figure 13 (Source Fig 12) presents the typical slope failure mechanism obtained using a phi-c reduction analysis (at 290 days for the situation presented where the vacuum treatment is active). More particularly, it was found that the developed FE model could show: (a) a higher rate of effective stress increase as the applied vacuum pressure increased, (b) the vacuum pressure induced inward lateral displacement, and (c) there was an increase in the safety factor when the vacuum consolidation was active.
Figure 10: Location of Gauss points and nodes for results post-processing (Source: Fig. 6, Witasse et al. 2012)
-800
-700
-600
-500
-400
-300
-200
-100
0
0 50 100 150 200 250 300
Time (day)
Tota
l ver
tica
l str
ess
(kPa
)
Points K, LPoints M, NPoints O, R
Points P, Q
Figure 11: Total vertical stresses variation with time (Source: Fig. 7, Witasse et al. 2012)
De
Layer 1a1
Layer 1a2
Layer 1b
Layer 1c

ISSMGE - TC 211 International Symposium on Ground Improvement IS-GI Brussels 31 May & 1 June 2012
Indraratna – General Report – SESSION 2 – VERTICAL DRAINS, VACUUM CONSOLIDATION & PRELOADING
-40
-35
-30
-25
-20
-15
-10
-5
0
5
-0,4 -0,2 0,0 0,2 0,4 0,6 0,8
Horizo ntal displacemen ts (m)
0 j
60 j
80 j
140 j
180 j
290 j
Figure 12: Horizontal displacements at the edge of vacuum consolidation area. (Source: Fig. 11, Witasse et al. 2012)
Figure 13: Failure mechanism after 6.7m fill construction (Source: Fig. 12, Witasse et al. 2012)
Mateos (2012) shows some results by using a back analysis of a trial embankment settlement based on CPTu and odeometric tests in order to accurately predict the settlement under a long embankment being built for a new “High speed rail track” in southeast Spain. The new rail track was designed along earth fills 4 to 8 m high. Due to the enormous deformability of the marsh sediments underneath, important settlements were forecast along the embankment, but to check this approach, a trial embankment was built over a section treated with 20m deep vertical distributed in a triangular mesh whose side is 1.66 m long. Data from this embankment was recorded for more than 15 months. The soil profile in the area of the study comprised 32 metres of sedimentary marsh overlaying alluvial fan sediments. The horizontal consolidation coefficient was estimated from the dissipation tests in CPTu. A total of 41 tests were performed and the results of CPTu tests conducted close to the trial embankment, showed there are many granular levels in the profile (Figure 13b. Source: Fig. 4). A trial embankment was built after this treatment by vertical drains to better understand how marsh soils consolidated. The trial embankment was 4 m high, 25.45 m wide and 64 m long. Data obtained since the beginning of the construction to September 2011 showed that most of the settlement developed during construction (Figure 14, Source: Fig. 6 and in the next two months (Figure 15, Source: Fig. 7). Since then, the rate of settlement decreased continually, and is now less than 0.5 cm per month. Data were analysed by the Asaoka method in order to predict the magnitude of final settlement. From this analysis a magnitude close to 30 cm was obtained (Figure 16, Source: Fig. 9).

ISSMGE - TC 211 International Symposium on Ground Improvement IS-GI Brussels 31 May & 1 June 2012
Indraratna – General Report – SESSION 2 – VERTICAL DRAINS, VACUUM CONSOLIDATION & PRELOADING
Figure 13b: Excess pore pressure registered by CPTu tests close to the trial embankment (Source: Fig. 4, Mateos 2012)
0
0,05
0 ,1
0,15
0 ,2
0,25
0 ,3
0,35
02 /0 5/201010 /08/2010
18/11/2 01026/02 /2 011
06/06 /2 0111 4/09/201 1
2 3/12/20 11Date
Se
ttle
me
nt
(m)
0
0,5
1
1,5
2
2,5
3
3,5
4
4,5
Em
ba
nk
me
nt
he
igth
(m
)
LCA 10
LCA 30
Embankment height
0
0,05
0,1
0,15
0,2
0,25
0,3
0,35
0,4
02/05/201010/08/2010
18/11/201026/02/2011
06/06/201114/09/2011
23/12/2011
Date
Se
ttle
men
t (m
)
0
0,5
1
1,5
2
2,5
3
3,5
4
4,5
Em
ba
nkm
en
t h
eig
ht
(m)
PA 10 PA 12PA 14 PA 20PA 22 PA 24PA 30 PA 32PA 34 Embankment heigth
Figure 14: Settlement data from horizontal inclinometers (LCA) along embankment axis. (Source: Fig. 6, Mateos 2012)
Figure 15: Settlement data obtained from settlement plates. PA 12, PA 22 and PA 32 are located over the embankment axis. (Source: Fig. 7, Mateos 2012)
0,00
0,05
0,10
0,15
0,20
0,25
0,30
0,35
0 50 100 150 200 250 300 350 400 450 500
Time (days)
Set
tlem
en
t (m
)
Axe c alcu lation LCA 30 LCA 10 PA 22
Figure 16: Comparison between instrumentation data and calculation results. (Source: Fig. 9, Mateos 2012)

ISSMGE - TC 211 International Symposium on Ground Improvement IS-GI Brussels 31 May & 1 June 2012
Indraratna – General Report – SESSION 2 – VERTICAL DRAINS, VACUUM CONSOLIDATION & PRELOADING
Belén and Schmidt (2012) presented a numerical 3D comparison between real PVD and equivalent permeability during consolidation: one simulating soil with a real PVD installed, and the other one simulating soil with equivalent permeability (kve) (Figure 17 Source: Fig. 9). For the 3D simulation of the unit cell, a hexagonal cross-section of three different zones: unit cell, smear zone and equivalent PVD was considered. The simulation with real PVD and a smear effect presented a discharge of approximately of 20 % through the upper face and 80 % through the PVD, as can be seen in Fig. 17 (Source: Fig. 9), showing that the PVD worked well. Both the unit cell with real PVD and the unit cell with kve gave similar final settlement results, but the consolidation rate and predicted excess pore pressure were somewhat different (Figure 18 and 19, Source: Figs. 6 and 7). The unit cell with a real PVD simulation resulted in a faster consolidation rate and lower predicted excess pore pressure.
Figure 17: Discharge vectors (models with smear effect) (Source: Fig. 9, Belén and Schmidt 2012)
Figure 18: Settlement at depth of 0.5 m for the simulations with and without smear effect (Source: Fig. 6, Belén and Schmidt 2012)
depth=0.5 m
-100
-80
-60
-40
-20
0
0 200 400 600
Elapse time (days)
Set
tlem
ent (
cm)
PVD with smear effect
PVD without smear effect
depth = 0.5 m
-100
-80
-60
-40
-20
0
0 200 400 600
Elapse time (days)
Set
tlem
ent (
cm)
kve with smear effect
kve without smear effect
kve simulation
real PVD simulation

ISSMGE - TC 211 International Symposium on Ground Improvement IS-GI Brussels 31 May & 1 June 2012
Indraratna – General Report – SESSION 2 – VERTICAL DRAINS, VACUUM CONSOLIDATION & PRELOADING
Figure 19: Comparison of excess pore pressure unit cell with and without smear (Source: Fig. 7, Belén and Schmidt 2012)
Román et al. (2012) presented the preloading progress of a hydraulic fill for the foundation of LNG tanks currently being constructed in El Musel Prot (Gijon, Northern Spain Figure 20, Source: Fig. 1). The hydraulic fill is mainly composed of marine sands dredged from nearby locations (Figures 21 and 22, Source: Figs. 3 and 16), which was placed on site using rainbow and pipeline discharge and the bottom dump method. Among several alternatives, preloading was selected as the ground improvement method to reduce the settlement of the LNG tanks. The preloading magnitude had to be equivalent to the load transmitted to the foundation during the hydraulic proof (285 kPa). Since during the earthworks it could be verified that the apparent density was over 20 kN/m3, the height could be limited to 16 m. The preloading fill was a conical frustum shape, with a 130 m diameter base and a 80 m diameter top. Figure 23 (Source: Fig. 17) shows the load (expressed as preloading height) vs. settlement curve observed during preloading construction and unloading. Note that during unloading the recovered deformation (upwards movement) during preloading removal was 8.6 times smaller than the settlement during first loading. Figure 24 (Source: Figs. 18 and 19) shows the results of the inclinometer with the highest deformation, as well as the variation of maximum measured displacements with time and fill height. Figure 25 (Source: Fig. 21) shows the settlement as the exterior “ring” concrete structure was being constructed. The maximum load, once the ring is constructed, will be of 230 kPa acting over a width of approximately 5-6 meters. The observed settlement was smaller than predicted. Therefore, preloading has been shown to in this case to be an efficient alternative for improving the tank foundations, albeit with limited settlement during unloading-reloading that is below the accepted thresholds.
Figure 20: Location of Enagás Plant (Source: Fig. 1, Román et al. 2012)
Excess of Pore Pressure at depth=5 m
0
10
20
30
40
0 100 200 300 400 500 600
Elapse time (days)
Exc
ess po
re p
ress
ure
(kPa) PVD with smear effect (smear zone)
PVD with smear effect (soil zone)
PVD without smear zone (smear zone)
PVD without smear effect (soil zone)
kve with smear effect
kve without smear effect

ISSMGE - TC 211 International Symposium on Ground Improvement IS-GI Brussels 31 May & 1 June 2012
Indraratna – General Report – SESSION 2 – VERTICAL DRAINS, VACUUM CONSOLIDATION & PRELOADING
Figure 21: Lay out of the site characterization program (Source: Fig. 3, Román et al. 2012)
Figure 22: Representative cross-section under Tank 1 (Source: Fig. 16, Román et al. 2012)
Figure 23: Preload height and settlement vs. time (Source: Fig. 17, Román et al. 2012)
Figures 24: Results of Inclinometer Nr 1 and evolution of maximum displacement versus time and height of preload. (Source: Fig. 18 and 19, Román et al. 2012)
Figure 25: Settlement during the concrete ring construction (Source: Fig. 21, Román et al. 2012)
3. RECENT ADVACEMENT IN SOFT CLAY CONSOLIDATION WITH VACUUM APPLICATION
3.1. Vacuum preloading system
This section elucidates a technological advancement that contributes to our understanding of the intricate mechanics of the different PVD-vacuum systems (membrane system and membraneless system) (Figure 26), to minimise consolidation, excessive post-construction settlement and lateral ground movement, as well as operational costs. Therefore, the specific aims must address both fundamental and applied components that not only assist in an analytical assessment of the most appropriate vacuum system for a

ISSMGE - TC 211 International Symposium on Ground Improvement IS-GI Brussels 31 May & 1 June 2012
Indraratna – General Report – SESSION 2 – VERTICAL DRAINS, VACUUM CONSOLIDATION & PRELOADING
given combination of soil-drain characteristics, but also to quantify the role of soil-drain interaction mechanics on soft soil stabilisation to support the anticipated infrastructure load (Geng et al. 2012).
/ 0u z
u p
( 1)1
zp
H
/ 0u z
/ 0u z
(a) (b)
Figure 26: Analysis schemes of unit cell with vertical drain: (a) membrane system; and (b) membrane system. (Geng et al. 2012)
Figure 27 illustrates the effect of the permeability of a sand blanket in a membrane system and membraneless system. As expected, when permeability decreases consolidation takes longer. When the PVD’s are short, say around 10 metres long (Fig. 2a), the permeability of the sand blanket should not be less than 0.01 times the permeability of the PVD and 104 times the permeability of the clay to maintain consolidation and achieve a 90% degree of consolidation. With longer drains (Fig. 2b), the ratios between the permeability of the sand blanket and the PVD, and between the permeability of the sand blanket and the clay layer should be more than 0.1 and 105, respectively.
3.2. Partially penetrating drain
Analytical solutions for partially penetrating PVDs are derived by considering the vacuum pressure (suction), time-dependent embankment surcharge, well resistance, and smear zone. Three-dimensional seepage with a virtual vertical drain is assumed to reflect real seepage into the soil beneath the tip of a PVD. Analytical solutions were then used to examine the length of the vertical drain and vacuum pressure on soft clay to determine the consolidation time and degree of consolidation, associated settlement, and distribution of suction along the drain. Regardless of PVD spacing, with 20m thick clay, a penetration ratio of 0.9 can provide a normalised settlement of 0.9 within an increased consolidation time (Th req) of less than 20% of Th i. For a 10m thick layer of clay with 1.0m drain spacing, the applied surcharge pressure should be more than 40% of the total applied pressure (vacuum plus surcharge), in order to obtain a normalised settlement of 0.9 within 1.25 Th i. However, for a 10m thick layer of clay with 1.5m drain spacing, the surcharge pressure must be more than 50% of the total applied pressure to achieve 90% normalised settlement within 1.25 Th i. This analysis shows that to overcome the loss of vacuum caused by the bottom pervious layer, a combination of vacuum with surcharge pressure is most beneficial when the length of the PVD is less than 90% of the total thickness of clay. Generally, the vertical drain penetration ratio can be reduced by up to 20% of the total thickness of clay without significantly affecting the settlement time for surcharge loading alone. In contrast, for a surcharge load combined with vacuum pressure, the length of the vertical drain can be reduced by 10% of the total thickness of soft clay with an appropriate combination of vacuum and surcharge (see Table 1).

ISSMGE - TC 211 International Symposium on Ground Improvement IS-GI Brussels 31 May & 1 June 2012
Indraratna – General Report – SESSION 2 – VERTICAL DRAINS, VACUUM CONSOLIDATION & PRELOADING
2.2
2.0
1.8
1.6
1.4
1.2
1.0
0.8
0.6
0.4
0.2
0.0
1E-3 0.01 0.1 1 10 100 10002.2
2.0
1.8
1.6
1.4
1.2
1.0
0.8
0.6
0.4
0.2
0.0
(b)
Hclay
= 10m
(a)
1
2
3
4
5
6
7
89
Nor
mal
ized
set
tlem
ent s
t/s8
-12
-22
-32
-42
-52
-62
1) Membrane system with 10
2) Membrane system with 10
3) Membrane system with 10
4) Membrane system with 10
5) Membrane system with 10
6) Membrane system with 10
7) Memb
K
K
K
K
K
K
raneless system with no vacuum loss
8) Membraneless system with 25% vacuum loss
9) Membraneless system with 50% vacuum loss
-12
-22
-32
-42
-52
-62
1) Membrane system with 10
2) Membrane system with 10
3) Membrane system with 10
4) Membrane system with 10
5) Membrane system with 10
6) Membrane system with 10
7) Memb
K
K
K
K
K
K
raneless system with no vacuum loss
8) Membraneless system with 25% vacuum loss
9) Membraneless system with 50% vacuum lossNor
mal
ized
set
tlem
ent s
t/s
Th
1
2
98
3 4 5 6
Hclay
= 40m
7
8
Figure 27: Normalized settlement-time factor curves for varying K2 (for membrane system) and η (for membraneless system): (a) the thickness of the clay is 10 m; (b) the thickness of the clay is 40 m (Geng et al. 2012).
Table 1: Vertical drain penetration ratio ( ) for different conditions to achieve 90% normalised
settlement
1.0ed m 1.5ed m
H = 10 m
ρ ρ SP
(80kPa) VP
(-80kPa) VP&SP
SP
(80kPa) VP
(-80kPa) VP&SP
0.8
cannot achieve 90% nomalised settlement
0.9 and SP>50% Total applies pressure
0.8
cannot achieve 90% nomalised settlement
0.9 SP>50% Total applies pressure
H = 20 m
ρ ρ SP
(80kPa) VP
(-80kPa) VP&SP
SP
(80kPa) VP
(-80kPa) VP&SP
0.85 0.9
0.9 SP>40% Total applies pressure
0.8
cannot achieve 90% nomalised settlement
0.9 SP>40% Total applies pressure
Note: SP = Surcharge preloading, VP= Vacuum Preloading, VP&SP= vacuum combined surcharge loading

ISSMGE - TC 211 International Symposium on Ground Improvement IS-GI Brussels 31 May & 1 June 2012
Indraratna – General Report – SESSION 2 – VERTICAL DRAINS, VACUUM CONSOLIDATION & PRELOADING
When a vacuum is applied to a layer of clay sandwiched between the top and bottom drainage layers, the PVDs must be shorter than the thickness of the clay to prevent the vacuum from leaking through the bottom drainage layer. When PVDs only partially penetrate the layer of clay, the soft clay beneath the tip of the PVD does not consolidate the same as the overlying stratum. Due to the complexity of the problem, soil consolidation with partially penetrated vertical drains has already been analysed by numerical methods.
4. CONCLUSION
This category of eight papers describes the consolidation process with time, with very useful information on field data, laboratory testing, analytical formulations and numerical modelling, including reference to the comparison of observed data with predictions. The overall findings are as follows: • A relative high vacuum pressure of up to -70 kPa can significantly decrease the required fill height
and achieve a desirable degree of consolidation exceeding 95%. • 2D finite element analysis for vacuum consolidation showed: (a) a higher rate of effective stress
increase as the applied vacuum pressure was increased, hence the increase in shear strength, and (b) the vacuum pressure application has the favourable effect of inducing inward lateral displacement.
• Vacuum consolidation performance depends on the actual distribution of vacuum along the drain length and permeability and the thickness of the sand blanket.
• During PVD installation, the intrusion of the upper layer into the underlying layer creates an additional zone where the remoulded permeability of this zone can retard the consolidation process
• Economic soil improvement techniques such as PVD can be combined with rigid inclusions to accelerate consolidation process and to enhance the shear strength.
• Coefficient of consolidation determined from oedometer tests and CPTu profiling provide an accurate description of soil consolidation behaviour and estimations for settlement development.
• The simulation of three dimensional unit cell with a PVD resulted in a faster consolidation rate and a lower predicted excess pore pressure.
• Vertical drain length can be reduced by up to 20% of the total thickness of clay without significantly affecting the settlement time for surcharge loading alone.
5. ACKNOWLEDGEMENT
The assistance of Dr Geng Xueyu, and Dr Cholachat Rujikiatkamjorn of the School of Civil, Mining & Environmental Engineering and Centre for Geotechnical Engineering, University of Wollongong is gratefully appreciated. REFERENCES Bacas, B.M. and Schmidt, F. (2012). Numerical 3D comparison between real PVD and equivalent permeability in consolidation process. ISSMGE - TC 211 International Symposium on Ground Improvement IS-GI Brussels. Geng, X. Y., Indraratna, B. and Rujikiatkamjorn, C. (2012). Analytical solutions for a single vertical drain with vacuum and time-dependent surcharge preloading in membrane and membraneless systems. International Journal of Geomechanics, ASCE, 12(1), 27-42. Indraratna, B., Rujikiatkamjorn, C. and Xueyu, G. (2012). Performance and prediction of surcharge and vacuum consolidation via prefabricated vertical drains with special reference to highways, railways and ports. ISSMGE - TC 211 International Symposium on Ground Improvement IS-GI Brussels. Kirstein, J. and Wittorf, N. (2012). Rigid inclusions in combination with fast wick drain consolidation as soil improvement method in very soft and fat northern German clay. ISSMGE - TC 211 International Symposium on Ground Improvement IS-GI Brussels. Kirstein, J. F., Ahner, C., Uhlemann, A. and Uhlich, P. (2012). Ground improvement methods for establishment of the federal road B 176 on a new elevated dumb in the brown coal area of MIBRAG. ISSMGE - TC 211 International Symposium on Ground Improvement IS-GI Brussels. Mateos, t.. (2012). Back analysis of a trial embankment settlement based on CPTu and oedometric test results. ISSMGE - TC 211 International Symposium on Ground Improvement IS-GI Brussels.

ISSMGE - TC 211 International Symposium on Ground Improvement IS-GI Brussels 31 May & 1 June 2012
Indraratna – General Report – SESSION 2 – VERTICAL DRAINS, VACUUM CONSOLIDATION & PRELOADING
Román, F., Jimenez, R., Suarez, J. C. G., Coz, A. (2012). Preloading of a hydraullic fill for foundation of LNG tanks. ISSMGE - TC 211 International Symposium on Ground Improvement IS-GI Brussels. Rujikiatkamjorn, C. and Indraratna, B.. (2012). Radial Consolidation Modelling Incorporating Downdrag Effect for a Multi-Layer Soil. ISSMGE - TC 211 International Symposium on Ground Improvement IS-GI Brussels. Witasse, R., Racinais, J., Maucotel, F., Galavi, V., Brinkgreve, R., and Plomteux, C. (2012). Finite Element Modeling of Vacuum Consolidation using Drain Elements and Unsaturated Soil Conditions. ISSMGE - TC 211 International Symposium on Ground Improvement IS-GI Brussels.