vertical distribution of zooplankton biomass and ... · distribución vertical de la biomasa...
TRANSCRIPT

Revista de Biología Marina y Oceanografía 44(2): 477-488, agosto de 2009
Vertical distribution of zooplankton biomass and ichthyoplanktondensity during an annual cycle on the continental shelf of
the southern Gulf of Mexico
Distribución vertical de la biomasa zooplanctónica y densidad ictioplanctónica duranteun ciclo anual en la plataforma continental del sur del Golfo de México
María de la Luz Espinosa-Fuentes1*, César Flores-Coto1, Laura Sanvicente-Añorve1
and Faustino Zavala-García1
1Laboratorio de Zooplancton, Instituto de Ciencias del Mar y Limnología,Universidad Nacional Autónoma de México.A. P. 70-305, 04510 México, D. F. México
Resumen.- Se analizó estacionalmente la biomasazooplanctónica (BZ) y la densidad ictioplanctónica (DI) en lacolumna de agua sobre la plataforma continental del sur delGolfo de México, para determinar sus patrones de distribuciónvertical y establecer si existe una relación entre amboscomponentes. Se muestrearon cinco niveles de profundidad:0-6 m, 6-12 m, 12-18 m, 45-55 m y 95-105 m. El patrón dedistribución vertical de la BZ y de la DI fue similar en todaslas épocas de muestreo, con la mayor concentración deorganismos en los niveles superficiales y la más baja en losniveles más profundos. Estos resultados sugieren que lacolumna de agua en el área de estudio puede estar dividida enuna capa superficial (0 a 18 m) y una capa profunda (45 a 100m) y que las diferencias estacionales pueden ser atribuidas alos procesos de mezcla. Esta diferencia entre las capassuperficiales y las profundas ocurre porque, en general, lascapas superficiales de la columna de agua son las másproductivas. La relación entre la BZ y la DI fue positiva ysignificativa (ANCOVA, P<0,05) a través de las épocas demuestreo y en la mayoría de las profundidades probablementeporque el ciclo de producción es continuo en el sur del Golfode México como sucede en áreas tropicales y subtropicales,manteniendo la disponibilidad de alimento y consecuentemente,la relación depredador-presa. La relación BZ y DI en la columnade agua es afectada principalmente por la variación estacionalde las descargas de agua continental y el proceso de mezcla.
Palabras clave: Capa de mezcla, descargas de agua continental,estratificación, relación zooplancton-ictioplancton
Abstract.- Seasonal zooplankton biomass (ZB) andichthyoplankton density (ID) in the water column on thecontinental shelf of the southern Gulf of Mexico were analyzedto determine their vertical distribution patterns and assess ifthere is a relationship between both components. Five depthlevels were sampled: 0-6, 6-12, 12-18, 45-55 and 95-105 m.The vertical distribution patterns of ZB and ID were similar forall sampling seasons, with the greatest concentration oforganisms in the upper levels and the lowest at deeper levels.These results suggest that the water column in the study areamay be divided into a surface layer (0-18 m) and a deep layer(45-100 m), and seasonal differences may be attributed tomixing processes. The difference between the surface and thedeep layers occurs because, in general, the upper layer is themost productive sector of the water column. The relationshipbetween ZB and ID in the water column was positive andsignificant (ANCOVA, P<0.05) throughout the samplingseasons for most depths, probably because the production cycleis continuous in the southern Gulf of Mexico, as is common intropical and subtropical areas, and it maintains the availabilityof food, and consequently the predator-prey relationships. Therelationship between the ZB and the ID in the water column ismainly affected by the seasonal variations in the continentalwater discharges and the mixing processes.
Key words: Continental water discharges, mixing layer,stratification, zooplankton-ichthyoplankton relationship
IntroductionOne of the most productive areas in the Gulf of Mexicois the Bay of Campeche, as it receives great volumes ofcontinental water. The large fisheries based on pelagicfish and shrimp are a reflection of the high biologicalproductivity of the area. This has prompted a number ofstudies of secondary production in this ecosystem
(Flores-Coto et al. 1988, Gasca et al. 1995, Salas de Leónet al. 1998) and the ichthyoplankton community (Flores-Coto et al. 1988, Flores-Coto & Ordóñez-López 1991,Flores-Coto et al. 1993, Sanvicente-Añorve et al. 1998,Flores-Coto et al. 2000).
Most of these studies only address horizontal meso-scale variations, while knowledge on the vertical

478 Revista de Biología Marina y Oceanografía Vol. 44, Nº2, 2009
distribution of zooplankton and ichthyoplankton in thesouthern Gulf of Mexico is scarce (Flores-Coto et al.1999, 2001, Espinosa-Fuentes & Flores-Coto 2004).
Knowledge of the vertical distribution patterns ofzooplankton biomass and ichthyoplankton density isimportant to understand ecological processes and toevaluate the abundance of these communities in theregion. Studies performed in other areas demonstrate thatvariations in the structure of the water column affect thespatial and temporal distribution of zooplankton andichthyoplankton (Ahlstrom 1959, Loeb & Nichols 1984,Munk et al. 1989, Davis et al. 1990, Sclafani et al. 1993,Boehlert & Mundy 1994).
In spite of the high biological productivity in the Bayof Campeche and the ecological importance ofzooplankton and ichthyoplankton, the relationshipbetween both components has not been addressed.
Considering that production cycles in the southernGulf of Mexico are continuous and that ichthyoplanktondepends on zooplankton biomass for food, we
hypothesized that the vertical distribution ofichthyoplankton is synchronous with the biomassdistribution of zooplankton, and that they have a positiverelationship throughout the water column.
The objectives of this study were to determine thevertical distribution patterns of both zooplankton biomass(ZB) and ichthyoplankton density (ID), and to assess therelationship between ZB and ID at different water depths,and how it varies according to the physical environmentthroughout an annual cycle.
Material and methodsThe study area is located in neritic waters of the southernGulf of Mexico, between 18° and 20ºN and between 91°and 94ºW. Twenty-two sampling stations were distributedalong four transects perpendicular to the coast, locatedoff the main fluvio-lagoon systems of the region (Fig.1). Sampling was carried out in May 21-30 (spring),August 19-29 (summer) and November 17-27 (autumn)of 1994, and in February 7-17 (winter) of 1995, aboard
Figure 1
Study area and location of sampling stations in the southern Gulf of Mexico
Área de estudio y localización de estaciones de muestreo en el sur del Golfo de México
Espinosa-Fuentes et al. Vertical distribution of zooplankton biomass and ichthyoplankton density 479
the R/V Justo Sierra. Samples were collected with amultiple opening-closing plankton net system with a 505μm mesh and a 75 cm diameter mouth. Five depth levels(level 1: 0-6 m; level 2: 6-12 m; level 3: 12-18 m; level 4:45-55 m, level 5: 95-105 m) were sampled at each station.Flowmeters were attached to each net in order todetermine water volume. Plankton samples were fixedwith 4% formalin. Zooplankton biomass was determinedas wet weight, except for the big jellied organisms, andeach sample was placed in a suction filter system in orderto eliminate interstitial water (Zavala-García & Flores-Coto 1989). Ichthyoplankton density (ID) wasstandardized as number of larvae 100 m3:
where g is the acceleration due to gravity (9.82 m s-2), ρis the water density (kg m-3), h is the water depth (m),and z is the depth interval (m).
Continental water discharge was determined throughthe vertical salinity gradient.
Differences in ZB and ID distributions regarding day-night variations were established with a one-way ANOVAfor the four cruises and the different sampling levels. Thehomocedasticity of ZB and ID data was determined withthe test of Levene (Levene 1960). The data were log-transformed [ln (x+1)] as the biomass and theichthyoplankton density did not present a normaldistribution.
The relationship between ZB and ID at each samplinglevel for the different study periods was evaluated usingan analysis of covariance (ANCOVA) where ID was thedependent variable, ZB the covariant, and the samplinglevel was represented as a categorical variable. APearson’s correlation analysis was applied to the data toevaluate the correlation between ZB and ID at eachsampling level and to obtain the statistical significance(Zar, 1996).
The influence of the environmental variables on therelationship between ZB and ID at each sampling levelduring the different study periods was evaluated with aMultiple Regression Analysis (MRA). The betteradjustment between the dependent variable (ID) and theindependent variables (ZB, depth, temperature, salinity,vertical salinity gradient and potential energy anomaly)for each sampling season was obtained applying aGeneral Linear Model (GLM) to determine the effectsof the independent variables. The stratification degreeof the water column was estimated calculating thepotential energy anomaly or ϕ parameter (Simpson et al.1978):
where S1 and S2 are the salinities at the given points andΔZ is the distance between them.
ResultsEnvironmental variables
Water temperature was homogeneous during May, Augustand November 1994 from the surface to 18 m depth(levels 1, 2 and 3), with values of 27.8 to 28.8°C, and itvaried from 19.3 to 24.9°C at deeper levels (45-105 m).In February 1995, temperature was homogeneous(~24°C) from the surface to 70 m depth, after which itdecreased to 18.8°C from this depth down to 100 m (level5) (Fig. 2).
There was a mixing layer from the surface to 30 m depthduring May, August and November with ϕ values<20 J m-3. The ϕ values increased in deeper waters to >250J m-3 at 100 m, indicating a marked stratification. In February,the mixing layer reached 70 m with ϕ <12 J m-3, and at 100m the ϕ value was ~150 J m-3 (Fig. 2).
The effect of the continental water discharges on thestudy area were more evident in August and November,when the greatest value of the vertical salinity gradientwas recorded between the surface and 18 m depth (Fig.2).
Vertical distribution of zooplankton biomass andichthyoplankton density
The vertical distribution of ZB and ID was similarthroughout the seasons, with the greatest organismconcentration in the upper levels (1, 2 and 3) and thelowest in the deeper levels (4 and 5), regardless of thetime of day.
Day-night variations in ZB and ID presented similarpatterns during all sampling periods, with the highestvalues during the night and the lowest values during theday (Fig. 3).
During May, August and November, the higherconcentration of ZB in the water column was observedat night in the surface levels (0-18 m), with the highest

480 Revista de Biología Marina y Oceanografía Vol. 44, Nº2, 2009
Figure 2
Average vertical distribution and standard deviation of temperature (ºC), potential energy anomaly (J m-3) and salinitygradient during the four sampling periods in the southern Gulf of Mexico
Distribución vertical del promedio y desviación estándar de la temperatura (ºC), anomalía de la energía potencial (J m-3) y gradientede salinidad durante cuatro períodos de muestreo en el sur del Golfo de México

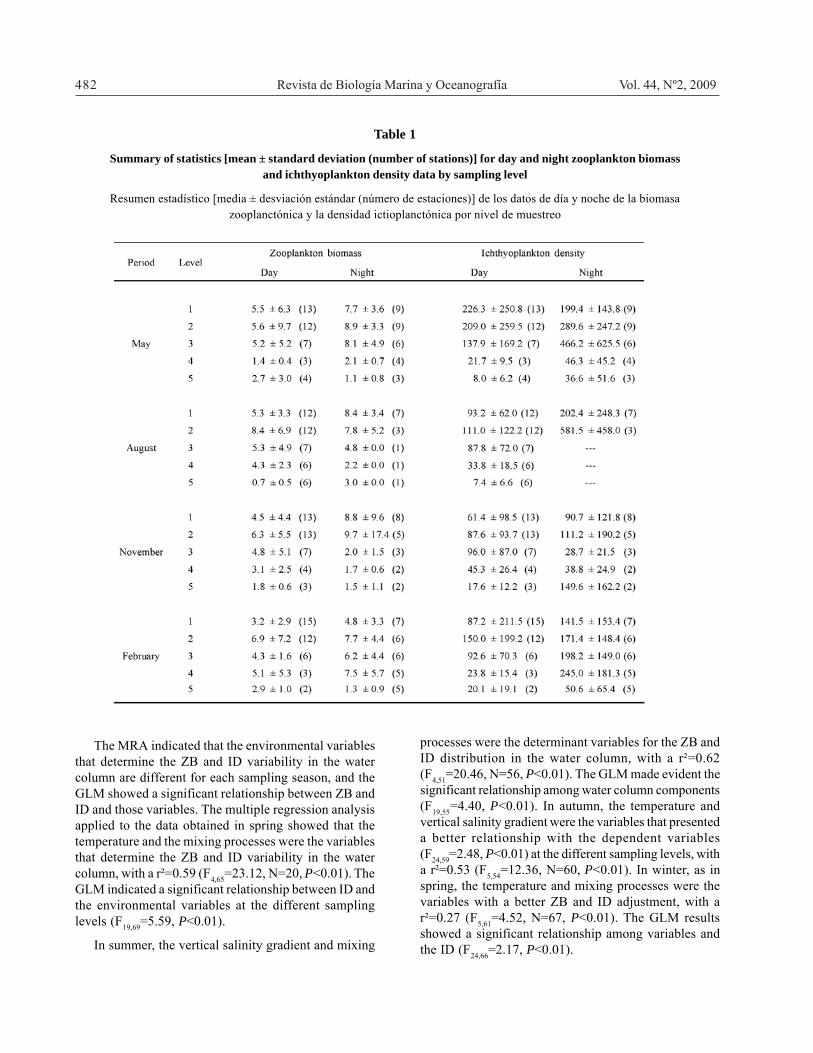
values (>7.8 g 100 m-3) between the surface and 12 mdepth (Table 1). In February, the ZB distribution wasrelatively uniform during both the day and the nightcatches, from the surface to 50 m depth, with the lowervalues recorded at level 5 (Fig. 4). There were nostatistical differences between the day and the nightcatches (P>0.05).
Ichthyoplankton density presented significantdifferences (P<0.05) between the day and night catchesonly in August and February. The highest ID occurred atnight throughout the seasons, in the surface strata (0-18m) during May and August and in the deeper strata (50-100 m) in November and February (Fig. 5, Table 1).The highest ichthyoplankton densities in these two lastmonths were recorded in levels 4 and 5, and mostlyincluded larvae from neritic families such as theGobiidae, Engraulidae, Synodonthidae, Carangidae andBregamacerotidae.
Relationship between ZB and ID, and environmentalparameters in the water column
ANCOVA results showed a significant relationship(P<0.05) between ZB and ID for all the study seasons(Table 2). The regression slopes between ZB and ID ateach sampling level of the water column showed apositive relationship, with the exception of February atlevel 5 which had a negative relationship (Fig. 6).Although most of the relationships were positive, theywere not all significant (Table 3).
Figure 3
Day and night vertical distribution of seasonal average ofzooplankton biomass (g 100 m-3) and ichthyoplankton
density (larvae 100 m-3) in the southern Gulf of Mexico
Distribución vertical del promedio estacional día y noche dela biomasa zooplanctónica (g 100 m-3) y densidad
ictioplanctónica (larvas 100 m-3) en el sur del Golfo deMéxico Figure 4
Vertical distribution of day and night averagezooplankton biomass (g 100 m-3) during four sampling
periods in the southern Gulf of Mexico
Distribución vertical del promedio de la biomasazooplanctónica (g 100 m-3) diurna y nocturna durante cuatro
periodos de muestreo en el sur del Golfo de México
Espinosa-Fuentes et al. Vertical distribution of zooplankton biomass and ichthyoplankton density 481
482 Revista de Biología Marina y Oceanografía Vol. 44, Nº2, 2009
Table 1
Summary of statistics [mean ± standard deviation (number of stations)] for day and night zooplankton biomassand ichthyoplankton density data by sampling level
Resumen estadístico [media ± desviación estándar (número de estaciones)] de los datos de día y noche de la biomasazooplanctónica y la densidad ictioplanctónica por nivel de muestreo
The MRA indicated that the environmental variablesthat determine the ZB and ID variability in the watercolumn are different for each sampling season, and theGLM showed a significant relationship between ZB andID and those variables. The multiple regression analysisapplied to the data obtained in spring showed that thetemperature and the mixing processes were the variablesthat determine the ZB and ID variability in the watercolumn, with a r²=0.59 (F4,65=23.12, N=20, P<0.01). TheGLM indicated a significant relationship between ID andthe environmental variables at the different samplinglevels (F19,69=5.59, P<0.01).
In summer, the vertical salinity gradient and mixing
processes were the determinant variables for the ZB andID distribution in the water column, with a r²=0.62(F4,51=20.46, N=56, P<0.01). The GLM made evident thesignificant relationship among water column components(F19,55=4.40, P<0.01). In autumn, the temperature andvertical salinity gradient were the variables that presenteda better relationship with the dependent variables(F24,59=2.48, P<0.01) at the different sampling levels, witha r²=0.53 (F5,54=12.36, N=60, P<0.01). In winter, as inspring, the temperature and mixing processes were thevariables with a better ZB and ID adjustment, with ar²=0.27 (F5,61=4.52, N=67, P<0.01). The GLM resultsshowed a significant relationship among variables andthe ID (F24,66=2.17, P<0.01).

usually inside and outside of the mixing layer respectively,except in February when the mixing layer reached a depthof 70 m.
Similar patterns during the day have been found inother places. Sabatés (2004) and Comyns & Lyczkowski-Shultz (2004) recorded the highest larval fish densitiesat the surface where food availability was greatest.
The surface layer of the water column has beenconsidered the most productive, where food particles existin high concentrations. This is therefore the mostimportant stratum for trophic interactions (Coombs et al.1994, Gray & Kingsford 2003).
Additionally, the high ZB and ID values recorded inthe mixed layer must be related to higher concentrationsof chlorophyll a (Zeldis et al. 1995). Accordingly, theareas of greatest chlorophyll a richness in the southernGulf of Mexico are located between the surface and 40m depth, with a maximum concentration at 10 m (Licea& Luna 1999, Aguirre-Gómez 2002). The location of thismaximum peak of chlorophyll a agrees with the depth(6-12 m) at which the highest values of ZB and ID wererecorded.
Several studies have associated the verticaldistribution of zooplankton and ichthyoplankton with thelocation of the maximum chlorophyll a concentrationlayer. Sameoto (1984), Townsend et al. (1984) and Harris(1988) hypothesized that the location of the maximumchlorophyll a concentration is an important factor in thebehaviour of zooplankton that determines the verticaldistribution of different stages in the water column.
On the other hand, in February the wind-inducedmixing generated a homogeneous distribution of ZB andID from the surface to a depth of 70 m. The mixing ofthe surface layer of the water column tends to preventthe formation of plankton patches and allows a uniformdistribution (Okubo & Levin 2001) that favours thevertical distribution of zooplankton throughout the watercolumn (Checkley et al. 1992, Farstey et al. 2002). Whendata were analysed separately for day and night, for theNovember and February data, the pattern broke and ahigher ID was recorded at levels 5 and 4 respectively.The high concentration observed in February may beattributed to the organisms having a better distributionthroughout the water column under mixed conditions(Combs et al. 1992).
Relationship between ZB and ID
Zooplankton and ichthyoplankton present different typesof relationships in the pelagic environment. These maybe positive, negative and random, and are visible at
Figure 5
Vertical distribution of day and night averageichthyoplankton density (larvae 100 m-3)
during four sampling periods inthe southern Gulf of Mexico
Distribución vertical del promedio de la densidadictioplanctónica (larvas 100 m-3) diurna y nocturna
durante cuatro periodos de muestreo enel sur del Golfo de México
DiscussionVertical distribution pattern
The vertical distribution of the ZB and ID throughoutthe seasons presented a similar pattern with the highervalues in the surface layers and the lower values in thedeeper strata, independently of the sampling hour. Theseresults suggest that the water column in the study areacan be divided into a 0 to 18 m surface layer and a 45 to100 m deeper layer. The surface and deeper areas are
Espinosa-Fuentes et al. Vertical distribution of zooplankton biomass and ichthyoplankton density 483

484 Revista de Biología Marina y Oceanografía Vol. 44, Nº2, 2009
different temporal and spatial scales.
The trophic dependency of ichthyoplankton onzooplankton is unquestionable and results in a positiverelationship that is not necessarily statistically significant.The relationship may fluctuate from positive to negative(Sanvicente-Añorve et al. 2006). There are several factorsthat generate a positive relationship between fish larvaeand zooplankton. Among these, one may mention thecomposition of zooplankton that allows the survival offish larvae, that is to say, that big zooplankton predatorssuch as chaetognaths, ctenophores and jellyfish are absentor in low numbers in such a way that the type and size ofzooplankton is adequate enough for the consumption oflarvae (Loeb 1979, Cowan & Shaw 1991, Sanvicente-Añorve et al. 2006). Considering that zooplanktonorganisms represent the main food resource of fish larvae,
it is important that both be present at the same time andin the same place (Cushing 1975). Fortier & Harris (1989)declared that positive patterns are a consequence of adensity-dependent competition, and that ontogeneticmigration of fish postlarvae is the result of a progressiveadjustment of their vertical distribution to the verticaldistribution of their prey.
In this study, the relationship between ZB and ID isconsidered to be a predator-prey relationship, althoughnot necessarily direct, as the zooplankton biomass netused was a 505 μm mesh that collects organisms biggerthan the food items of fish larvae. Nevertheless, it isassumed that the zooplankton biomass represents the sizelevel in the trophic chain that is sustained by smallerorganisms, such as the nauplii larvae of crustaceans andthe copepodite stages of the dominant zooplanktonicgroups.
Figure 6
Relationship between zooplankton biomass and ichthyoplankton density at different levels of the watercolumn during the four sampling periods
Relación entre la biomasa zooplanctónica y densidad ictioplanctónica a diferentes niveles de la columna deagua durante los cuatro periodos de muestreo

Table 2
ANCOVA results for different sampling periods (ichthyoplankton density = dependent variable)
Resultados del ANCOVA en diferentes periodos de muestreo (Densidad ictioplanctónica = Variable dependiente)
Table 3
Regression model values, correlation (r) and significance level of the relationships between zooplankton biomass andichthyoplankton density at different levels of the water column during the four sampling periods
Valores del modelo de regresión, correlación (r) y nivel de significancia de las relaciones entre la biomasa zooplanctónicas y ladensidad ictioplanctónica a diferentes niveles de la columna de agua durante los cuatro periodos de muestreo
Espinosa-Fuentes et al. Vertical distribution of zooplankton biomass and ichthyoplankton density 485

486 Revista de Biología Marina y Oceanografía Vol. 44, Nº2, 2009
The positive relationship observed in the study areaemerges as a consistent pattern in space and time,probably as a consequence of the continuous productioncycle in the southern Gulf of Mexico. This suggests thatzooplankton and ichthyoplankton are always present, andthis guarantees the availability of food throughout theyear, as well as the uninterrupted generation of growthand reproduction of organisms. With respect to this,Harden-Jones (1968) mentioned that eggs, larvae,juveniles and adult fish may remain together in tropicalareas where production is continuous and food is alwaysavailable.
Physical parameters that influence the ZB-IDrelationship
The multiple regression analysis showed that thetemperature, the vertical salinity gradient and the mixingprocesses were the most constant factors influencing thevariability of the distribution of ZB and ID throughoutthe annual cycle, and the GLM indicated there is asignificant relationship among the water columncomponents. Nevertheless, the existence of two layers, amixed surface layer and a deeper stratified layer, seemsto be an established distribution pattern in the watercolumn in the study area.
In February and May, the main factors influencingthe relationship between ZB and ID were the temperatureand the mixing process. In February, although therelationship between the ZB and ID was positive for allthe surface levels, these were not all significant. Thehighest correlation values were obtained for levels 3 and4, resulting from the mixing process that transportszooplankton organisms into the deeper layers. Fish larvaeand other zooplankton species were seen to avoid theturbulent strata by swimming or sinking in the watercolumn, as well as to increase their concentration andthe predator-prey encounter rate (Franks 2001, Incze2001, Pringle 2007) that may favour the feeding ofzooplankton (Rothschild & Osborn 1988). As the deeplayer (50-100 m) is not affected by the mixing processes,a high concentration of organisms impacting on thetrophic interactions may be expected.
The only negative value for the ZB and ID relationshipwas recorded during the winter in level 5, possibly as theresult of the exhaustion of zooplankton by ichthyoplankton(Sanvicente-Añorve et al. 2006).
The most important factor during August andNovember was the vertical salinity gradient, as it is duringthese periods that continental water discharges are thestrongest (IMTA 2000) and affect the surface strata (0-12 m). The ZB and ID relationship was positive and
generally significant in the upper layers during theseperiods, indicating that feeding conditions wereconvenient for both components.
Areas associated with large rivers, like the Grijalva-Usumacinta system and others in the region, usuallypresent a highly biological production in surface watersas a result of the discharge of nutrient-rich river waterthat favours carbon fixation by phytoplankton and, in turn,high concentrations of zooplankton (Dagg et al. 2004,Dagg & Brown 2005). In addition, Cowan & Shaw (1991)established that river water discharges over the innercontinental shelf may have an important effect on theZB and ID relationship, generating a high turbulence andintensifying the number of contacts between predatorsand prey (Lewis & Padley 2001).
AcknowledgmentsWe express our thanks to Dirección General del PersonalAcadémico of the Universidad Nacional Autónoma deMéxico for support of this study through ProgrammesIN-202092 and IN-203893, as well as the anonymousreviewers for their comments to the manuscript.
Literature citedAguirre-Gómez R. 2002. Primary production in the southern
Gulf of Mexico estimated from solar-stimulated naturalfluorescence. Hidrobiologica 12: 21-28.
Ahlstrom EH. 1959. Vertical distribution of pelagic fish eggsand larvae off California and Baja California. U.S. FishWildlife Service. Fishery Bulletin 60: 107-146.
Boehlert GW & BC Mundy. 1994. Vertical and onshore-offshore distributional patterns of tuna larvae in relation tophysical habitat features. Marine Ecology Progress Series107: 1-13.
Checkley DM Jr, S Uye, MJ Dagg, MM Mullin, M Omori,T Onbe & MY Zhu. 1992. Diel variation of thezooplankton and its environment at neritic stations in theinland Sea of Japan and the north-west Gulf of Mexico.Journal of Plankton Research 14: 1-40.
Comyns BH & J Lyczkowski-Shultz. 2004. Diel verticaldistribution of atlantic croaker, Micropogonias undulatus,larvae in the northcentral Gulf of Mexico with comparisonswith red drum Sciaenops ocellatus. Bulletin of MarineScience 74: 69-80.
Coombs SH, JH Nichols, DVP Conway, S Milligan & NCHalliday. 1992. Food availability for sprat larvae in theIrish Sea. Journal of the Marine Biological Association ofthe United Kingdom 72: 821-834.
Coombs SH, DB Robins, DVP Conway, NC Halliday & AJPomroy. 1994. Suspended particulates in the Irish Sea andfeeding conditions for fish larvae. Marine Biology 118: 7-15.
Cowan JH & RF Shaw. 1991. Ichthyoplankton off westLouisiana in winter 1981-1982 and its relationship withzooplankton biomass. Contributions in Marine Science 32:103-121.
Cushing DH 1975. Marine ecology and fisheries, 278 pp.Cambridge University Press, Cambridge.
Dagg MJ & SL Brown. 2005. The potential distribution offecal pellets from the larvacean Oikopleura dioica tovertical flux of carbon in a river dominated coastal margin.In: Gorsky G, MJ Youngbluth & D Diebel (eds). Responseof marine ecosystems to global change. Ecological impactof appendicularians, pp. 293-307. Contemporary PublishingInternational. Paris.
Dagg MJ, R Benner, S Lohrenz & D Lawrence. 2004.Transformation of dissolved and particulate materials oncontinental shelves influenced by large rivers, plumeprocesses. Continental Shelf Research 24: 833-858.
Davis TL, GP Jenkins & JW Young. 1990. Diel patterns ofvertical distribution in larvae of southern bluefin Thunnusmaccoyii, and other tuna in the East Indian. Marine EcologyProgress Series 59: 63-74.
Espinosa-Fuentes ML & C Flores-Coto. 2004. Cross-shelfand vertical structure of ichthyoplankton assemblages incontinental shelf waters of the southern Gulf of Mexico.Estuarine Coastal and Shelf Science 59: 333-352.
Farstey V, B Lazar & A Genin. 2002. Expansion andhomogeneity of the vertical distribution of zooplankton ina very deep mixed layer. Marine Ecology Progress Series91: 91-100.
Flores-Coto C & U Ordóñez-López. 1991. Larval distributionand abundance of Myctophidae, Gonostomatidae andSternoptychidae from the southern Gulf of Mexico. In: HoytRD (ed). Larval fish recruitment and research in theAmericas. Proceedings of the thirteenth annual fishconference, 21-26 May 1989, Mérida, México. NOAATechnical Report NMFS 95: 55-64.
Flores-Coto C, L Sanvicente-Añorve, R Pineda-López & MARodríguez-van Lier. 1988. Composición, distribución yabundancia ictioplanctónica en el sur del Golfo de México.Universidad y Ciencia 5: 65-84.
Flores-Coto C, F Zavala-García & G Espinosa-Villagrán.1993. Asociaciones ictioplactónicas de la Bahía deCampeche, México (verano 1987). Facultad de Cienciasdel Mar, Universidad Católica del Norte, Coquimbo, Chile.Serie Ocasional 2: 57-67.
Flores-Coto C, P Figueroa-Páez & F Zavala-García. 1999.Distribución y abundancia de larvas de Sciaenidae en lacolumna de agua, en el sur del Golfo de México. Primavera.Hidrobiologica 9: 135-144.
Flores-Coto C, R Martínez-Gutiérrez, M González-Félix,L Sanvicente-Añorve & F Zavala-García. 2000. Annualvariation of ichthyoplankton assemblages in neritic watersof the southern Gulf of Mexico. Caribbean Journal ofScience 36: 233-243.
Flores-Coto C, R Rivas-Vega, F Zavala-García & J Sánchez-Robles. 2001. Vertical distribution of larval carangids inthe southern Gulf of Mexico. Gulf Caribbean Research 13:1-8.
Fortier L & RP Harris. 1989. Optimal foraging and density-dependent competition in marine fish larvae. MarineEcology Progress Series 51: 19-33.
Franks PJS. 2001. Turbulence avoidance: An alternateexplanation of turbulence-enhanced ingestion rates in thefield. Limnology and Oceanography 46: 959-963.
Gasca R, E Suárez & I Castellanos. 1995. Biomasaszoopláncticas en aguas superficiales del Golfo de Méxicodurante verano e invierno de 1991. Caribbean Journal ofScience 31: 128-140.
Gray AC & MJ Kingsford. 2003. Variability in thermoclinedepth and strength, and relationships with verticaldistributions of fish larvae and mesozooplankton in dynamiccoastal waters. Marine Ecology Progress Series 247: 211-224.
Harden-Jones FR. 1968. Fish migration, 325 pp. EdwardArnold, London.
Harris RP. 1988. Interactions between diel vertical migratorybehavior of marine zooplankton and the subsurfacechlorophyll maximum. Bulletin of Marine Science 43: 663-674.
IMTA. 2000. Banco Nacional de Datos de Aguas Superficiales(BANDAS). 7 CDS. Secretaría del Medio Ambiente yRecursos Naturales, Comisión Nacional del Agua, InstitutoMexicano de Tecnología del Agua, Jiutepec, Morelos.México. [CD-ROM].
Incze LS, D Hebert, N Wolff, N Oakey & D Dye. 2001.Changes in copepod distributions associated with increasedturbulence from wind stress. Marine Ecology ProgressSeries 213: 229-240.
Levene H. 1960. Robust test for equality of variance. In: OlkinZ (ed). Contributions to probability and statistics, pp. 278-292. Stanford University Press, Palo Alto.
Lewis DM & TJ Padley. 2001. The influence of turbulenceon plankton predation strategies. Journal of TheoreticalBiology 210: 347-356.
Licea S & R Luna. 1999. Spatio-temporal variation ofphytoplankton on the continental margin in the SW Gulfof Mexico. Revista de la Sociedad Mexicana de HistoriaNatural 49: 83-99.
Loeb VJ. 1979. Larval fishes in the zooplankton communityof the North Pacific Central Gyre. Marine Biology 53: 173-191.
Loeb VJ & JA Nichols. 1984. Vertical distribution andcomposition of ichthyoplankton and invertebratezooplankton assemblages in the Eastern Tropical Pacific.Biología Pesquera 13: 39-66.
Munk P, T Kiorbe & V Christensen. 1989. Vertical migrationsof herring, Clupea harengus, larvae in relation to light andprey distribution. Environmental Biology of Fish 26: 87-96.
Espinosa-Fuentes et al. Vertical distribution of zooplankton biomass and ichthyoplankton density 487

488 Revista de Biología Marina y Oceanografía Vol. 44, Nº2, 2009
Okubo A & SA Levin. 2001. Diffusion and ecologicalproblems. Modern perspectives, 373 pp. Springer, NewYork.
Pringle JM. 2007. Turbulence avoidance and the wind-driventransport of plankton in the surface Ekman layer.Continental Shelf Research 27: 670-678.
Rothschild B & T Osborn. 1988. Small-scale turbulence andplankton contact rates. Journal of Plankton Research 10:465-474.
Sabatés A. 2004. Diel vertical distribution of fish larvae duringthe winter-mixing period in the northwesternMediterranean. ICES Journal of Marine Science 61: 1243-1252.
Salas-de-León D, A Monreal-Gómez, L Sanvicente-Añorve& C Flores-Coto. 1998. Influence de la circulation à longterme sur la distribution des organismes zooplanctoniquesdans la Baie de Campeche, Mexique. Oceanological Acta21: 87-93.
Sameoto DD. 1984. Environmental factors influencing diurnaldistribution of zooplankton and ichthyoplankton. Journalof Plankton Research 6: 767-792.
Sanvicente-Añorve L, C Flores-Coto & L Sánchez-Velasco.1998 . Spatial and seasonal patterns of larval fishassemblages in the southern Gulf of Mexico. Bulletin ofMarine Science 62: 17-30.
Sanvicente-Añorve L, LA Soto, ML Espinosa-Fuentes & CFlores-Coto. 2006. Relationship patterns betweenichthyoplankton and zooplankton: a conceptual model.Hydrobiologia 559: 11-22.
Sclafani M, CT Taggart & KR Thompson. 1993. Condition,buoyancy and the distribution of larval fish -implicationsof vertical migration and retention. Journal of PlanktonResearch 15: 413-435.
Simpson JH, CM Allen & NCG Morris. 1978. Fronts on thecontinental shelf. Journal of Geophysical Research 28A C9:4607-4614.
Townsend DW, TL Cucci & T Berman. 1984. Surfacechlorophyll maxima and vertical distribution ofzooplankton in the Gulf of Maine. Journal of PlanktonResearch 6: 793-802.
Zar JH. 1996. Biostatistical analysis, 662 pp. Prentice Hall,Englewodd Cliffs.
Zavala-García F & C Flores-Coto. 1989. Medición debiomasa zooplanctónica. Anales del Instituto de Cienciasdel Mar y Limnología, UNAM 16: 273-278.
Zeldis JR, CS Davis, MR James, SL Ballara, WE Booth &FH Chang. 1995. Salp grazing: effects on phytoplanktonabundance, vertical distribution and taxonomic compositionin a coastal habitat. Marine Ecology Progress Series 126:267-283.
Recibido el 10 de octubre de 2008 y aceptado el 10 de junio de 2009