vertical budgets for organic carbon and biogenic - cafe thorium
TRANSCRIPT

Deep-Sea Research II 49 (2002) 1645–1674
Vertical budgets for organic carbon and biogenic silica in thePacific sector of the Southern Ocean, 1996–1998
David M. Nelsona,*, Robert F. Andersonb, Richard T. Barberc,Mark A. Brzezinskid, Ken O. Buesselere, Zanna Chaseb,1, Robert W. Colliera,Mary-Lynn Dicksonf, Roger Fran-coise, Michael R. Hiscockc, Susumu Honjoe,
John Marrab, William R. Martine, Raymond N. Sambrottob, Frederick L. Saylese,Daniel E. Sigmona
aCollege of Oceanic and Atmospheric Sciences, Oregon State University, Corvallis, OR 97331, USAb Lamont-Doherty Earth Observatory, Columbia University, Palisades, NY 10964, USA
cDuke University Marine Laboratory, Beaufort, NC 28516, USAdDepartment of Ecology, Evolution & Marine Biology, University of California, Santa Barbara, CA 93106, USA
e Woods Hole Oceanographic Institution, Woods Hole, MA 02543, USAf Graduate School of Oceanography, University of Rhode Island, Narragansett, RI 02882, USA
Abstract
During the 1996–1998 Antarctic Environment and Southern Ocean Process Study (AESOPS), a component of US
JGOFS, we obtained seasonal or longer-term data sets on the rates of production, vertical transport, remineralization
and burial of particulate organic carbon (POC) and biogenic silica (BSiO2) in the Southern Ocean at 1701W between
551S and 681S. The AESOPS data records enable us to construct vertical C and Si budgets for the water column and
upper sediments, with all estimates derived from direct measurement of the relevant fluxes.
We constructed annual C and Si budgets for each of four ecologically distinct zonal bands within the system. For
both POC and BSiO2 the greatest annual delivery to the sea floor (B200 and 1400 mmolm�2 yr�1, respectively) and
burial (B6 and 160 mmol m�2 yr�1, respectively) were observed in the southern Antarctic Circumpolar Current (ACC)
between 61.51S and 65.51S. That pattern is consistent with our observation that a diatom bloom propagated southward
through the southern ACC during the spring and summer of 1997–1998, following the receding ice edge, and that this
bloom was the main source of both POC and BSiO2 in the system on an annual basis. In the other zones the annual
fluxes of POC and BSiO2 to the sea floor ranged from 19% to 67% of those in the zone traversed by the summer diatom
bloom. The higher benthic fluxes of both POC and BSiO2 in the southern ACC imply that blooms similar to the one we
observed in 1997–1998 occur commonly in the southern ACC, and that their high-productivity signature is transmitted
to the sea floor.
The data show preferential preservation of BSiO2 over POC throughout the water column and upper seabed. In the
four zonal bands we consider, BSiO2 and POC are produced in mole ratios of 0.1–0.4, exported from the upper 100 m in
ratios of 0.2–0.6, arrive at 1000m in ratios of 1.5–4.5, reach the sea floor in ratios of 2.2–7.6, and are buried in ratios of
11.6–28. Despite the preferential preservation of BSiO2, accumulation of opal-rich sediments beneath the ACC does not
result from unusually efficient preservation of siliceous material. The estimated BSiO2 preservation efficiency
*Corresponding author. Fax: +1-541-737-2064.
E-mail address: [email protected] (D.M. Nelson).1Present address: Monterey Bay Aquarium Research Institute, Moss Landing, CA 95039, USA.
0967-0645/02/$ - see front matter r 2002 Elsevier Science Ltd. All rights reserved.
PII: S 0 9 6 7 - 0 6 4 5 ( 0 2 ) 0 0 0 0 5 - X

(burial-production) ranges from 1.2% to 5.5%, indistinguishable from the global average of 3%. Instead, opal-rich
sediment accumulation in this region reflects very high annual rates of BSiO2 production in surface waters, along with
very low accumulation rates of other sedimentary components (e.g., CaCO3 and detrital material).
The observed high ratios of BSiO2 production to POC production in surface waters are consistent with the known
tendency for the Si/C ratio of diatoms to increase when [Fe] is low. If greater Fe availability during the last glacial
maximum permitted diatoms in the Southern Ocean to grow with lower, more normal Si/C ratios, export of diatom-
produced POC could have occurred at 2–3 times its present rate. A corresponding increase in opal export or opal
sediment accumulation is unlikely because silicic acid is almost totally depleted north of 651S under present conditions.
Thus, even large increases in POC production and export during glacial periods would not be reflected in the opal
accumulation record. r 2002 Elsevier Science Ltd. All rights reserved.
Resume
Dans le cadre du programmme AESOPS/US-JGOFS une !etude de processus a !et!e men!ee de 1996 "a 1998 dans le
secteur Pacifique de l’Oc!ean Austral (le long de 1701W). L’objectif est la d!etermination des flux annuels et des variations
saisonni"eres de la production primaire dans la couche de surface, du flux vertical du carbone organique particulaire
(POC) et de la silice biog"ene (BSiO2) dans la colonne d’eau ainsi que des flux de recyclage des !el!ements biog"enes. Quatre
bandes zonales sont consid!er!ees de 55 "a 681S. Les flux de POC et de BSiO2 les plus !elev!es sont mesur!es dans la
bande zonale sud du Courant Antarctique Circumpolaire (ACC), de 61,5 "a 65,51S, o "u les floraisons de diatom!ees se
d!epla-cent au printemps-!et!e vers le sud, dans le sillage des glaces; au niveau de l’interface eau-s!ediment les flux sont de
200 et 1400mmole m�2 an�1 respectivement, les flux nets enfouis correspondant !etant de 6 et 1600 mmole m�2 an�1.
Dans les autres bandes zonales les flux annuels "a l’interface eau-s!ediment ne repr!esentent que 19 "a 67% des valeurs
observ!ees dans la bande zonale pr!ec!edente. Le fait de trouver des flux benthiques !elev!ees dans la bande zonale sud du
Courant Antarctique Circumpolaire indique que les s!ediments de cette bande zonale sont r!eguli"erement aliment!es par
des flux !elev!es de mati"ere biog"ene.
Au cours du transport vertical la BSiO2 est mieux pr!eserv!ee que le POC comme l’indique la variation des rapports
molaire de silice et de carbone en fonction de la profondeur. Pour l’ensemble des quatre bandes zonales ces rapports
passent de 0,1–0,4 pour la production dans la couche de surface "a 0,2–0,6 pour la production export!ee "a 100m. A
1000m ils montent "a 1,5–4,5, s’!el"event "a 2,2–7,6 "a l’interface eau-s!ediment, et atteignent 11,6–28 dans les d!ep #ots
s!edimentaires. En d!epit de cette pr!eservation privil!egi!e de l’opale, m#eme dans la bande zonale o "u les d!ep #ots
s!edimentaires sont particuli"erement riches en opale, le rapport de pr!eservation (rapport du flux s!edimentaire net sur le
flux de production) n’est que de 1,2–5,5%, ce qui n’est pas significativement diff!erent de la moyenne de 3% pour l’oc!ean
mondial. La richesse en opale des s!ediments antarctiques s’explique donc non pas par une pr!eservation d’opale
exceptionnelle dans les s!ediments mais par une production de silice biog"ene !elev!ee dans la couche de surface, et ceci par
rapport aux autres flux de mati"ere biog"ene (carbonate de calcium et d!etritus) beaucoup plus limit!es.
Les rapports BSiO2/ POC !elev!es mesur!es dans le mat!eriel planctonique des eaux de surface s’expliquent par l’impact
d’un d!eficit en fer des eaux de surface sur la croissance des diatom!ees. Au dernier maximum glaciaire une plus grande
disponibilit!e en fer dans la couche de surface de l’Oc!ean Austral a du se traduire par des rapports Si/C dans le mat!eriel
export!e 2 "a 3 fois plus faibles qu’actuellement. Ainsi il est peu probable qu’au dernier maximum glaciaire, m#eme si les
flux de POC !etaient plus !elev!es que dans l’oc!ean moderne, les flux de silice biog!ene export!ee aient !et!e plus importants
qu’actuellement, d’autant que la croissance des diatom!ees aunord de 651S est limit!ee par la disponibilit!e en acide
silicique.
1. Introduction
The Southern Ocean is the largest of severalhigh-nutrient, low-chlorophyll (HNLC) regions inthe world’s oceans. This region plays a major rolein regulating the global net transfer of carbondioxide between the ocean and the atmosphere, in
part because the annual photosynthetic uptake ofCO2 by phytoplankton and resulting export ofparticulate organic carbon (POC) to the deepocean are significantly less than the availablemacronutrients nitrogen and phosphorus wouldsustain (e.g., Sarmiento et al., 1998). Changes inthe efficiency of this ‘‘biological pump’’ (Volk and
D.M. Nelson et al. / Deep-Sea Research II 49 (2002) 1645–16741646

Hoffert, 1985; Longhurst and Harrison, 1989)have been hypothesized to play a major role inregulating atmospheric CO2 concentrations onglacial/interglacial time scales (Knox and McEl-roy, 1984; Martin, 1990; Moore et al., 2000).
The relatively low primary productivity of theSouthern Ocean went unrecognized for decades.As recently as the mid 1970s global productivitymaps showed either large regions or a broadcircumpolar band within the Antarctic Circumpo-lar Current (ACC) where primary productivitywas >200 g C m�2 yr�1 (e.g., Lieth, 1975). Theperceived high productivity was based mainly ontwo lines of indirect evidence; the high biomass ofseals, seabirds and other large carnivores in theregion (Croxall and Prince, 1979; Brown andLockyer, 1984) and the presence of diatom-richsiliceous sediments underlying much of the ACC(Goodell et al., 1973; DeMaster, 1981). However,the first large-scale 14C productivity surveys in theACC showed very low productivity throughoutmost of the region, even during the relatively shortsummer growing season (El-Sayed and Turner,1975; Holm-Hansen et al., 1977). As a conse-quence, productivity estimates for the ACC wererevised downward to as low as 16 g C m�2 yr�1 (El-Sayed, 1978). Somewhat higher estimates wereobtained by accounting for the effects of ice-edgephytoplankton blooms (Smith et al., 1988) andareas of high productivity near the Antarctic PolarFront (APF) (Laubischer et al., 1993), but no 14C-based estimate has ever approached the 200 gC m�2 yr�1 level estimated from indirect evidence.Subsequent estimates based on satellite oceancolor, sea-surface temperature and irradiance data,applied to temperature-dependent photosynthesis/irradiance models (Antoine et al., 1996; Behrenfeldand Falkowski, 1997; Moore and Abbott, 2000),indicate primary productivity of o50 g C m�2 yr�1
throughout most of the ACC south of 551S. Thatis less than half the annual productivitydetermined by 14C uptake at time-series sites inthe Sargasso Sea near Bermuda (Michaels et al.,1994) and North Pacific Central Gyre nearHawaii (Letelier et al., 1996), implying that mostof the ACC is less productive on an annual basisthan even the classically oligotrophic mid-oceangyres.
The opal sediment record is the most obviouslong-term signal emanating from biological pro-cesses in the ACC. Opal (hydrated amorphoussilica, which in the Southern Ocean consists almostexclusively of diatom remains) comprises fromB50% to >90% (by weight) of modern abyssalsediments beneath the ACC (Broecker and Peng,1982), making the region a major oceanic sink forSi (DeMaster, 1981; Tr!eguer et al., 1995). Sub-sequent estimates of opal burial rates beneath theACC, using 230Th-normalized accumulation ratesto account for sediment focusing, have lowered theestimated burial rate by about a factor of two, butburial remains a major removal term in the globaloceanic Si budget (DeMaster, 2002). Several recentstudies have addressed what Pondaven et al. (2000)termed the ‘‘opal paradox’’ in the Southern Ocean:the accumulation of opal-rich diatom sediments inan area of low primary productivity. This accu-mulation has been hypothesized to result eitherfrom unusually efficient preservation of biogenicsilica in the water column (Nelson et al., 1995) orfrom an unusually high production of biogenicsilica in surface waters (e.g. Pondaven et al., 2000).Understanding the processes generating the opalsediments beneath the ACC is important in anyattempt to reconstruct paleoproductivity patternsin the region. Do past changes in opal accumula-tion rates reflect changes in total primaryproductivity, in diatom productivity alone, inpreservation efficiency, or in some combinationof the three? Moreover, the organic carboncontent of the sediments in the Southern Oceanis low, as is typical of many open-ocean environ-ments (Van Bennekom et al., 1988; DeMasteret al., 1991). Are the cycles of carbon and silicondecoupled in the Southern Ocean to a degree thatprecludes use of the opal sediment record as anindicator of primary productivity or POC exportto the deep sea, or can useful paleoproductivityinformation be derived from that record (e.g.,Ragueneau et al., 2000)?
During the recently completed Antarctic Envir-onment and Southern Ocean Process Study(AESOPS), a component of US JGOFS, weconducted a suite of biogeochemical studiesfocused on the cycles of C, N and Si in the Pacificsector of the ACC. Those studies were centered at
D.M. Nelson et al. / Deep-Sea Research II 49 (2002) 1645–1674 1647

1701W and extended from B531S (well north ofthe APF) to B711S (well south of the SouthernACC Front (SACCF) and into the Ross Gyre).We thus obtained data across the full meridionalextent of the ACC and from waters to the south.We measured fluxes (rates of production, reminer-alization and vertical transport) of organic carbon,organic nitrogen, and biogenic silica in surfacewaters, in the subsurface water column, and in theseabed between November 1996 and March 1998.We have reported on a number of those individualstudies (Honjo et al., 2000; Sambrotto and Mace,2000; Brzezinski et al., 2001; Buesseler et al., 2001;Nelson et al., 2001; Dickson and Orchardo, 2001;Sayles et al., 2001; Sigmon et al., 2002; see Table1). Combining our data sets to estimate annual Cand Si fluxes in the upper ocean, deep ocean, andseabed has enabled us to quantify most of theimportant features of the C and Si cycles in thesystem. In this paper we report those estimatedannual fluxes, use them to construct verticalbudgets for POC and biogenic silica (BSiO2) andevaluate the quantitative relationships between the
C and Si cycles throughout the water column andupper sediments. The results provide insights intothe processes generating siliceous sediments in theregion, and the likely changes in those processeson glacial/interglacial time scales
2. Methods
2.1. Study area and timing of observations
We collected samples and data in the Pacificsector of the Southern Ocean southeast of NewZealand during a series of cruises betweenNovember 1996 and March 1998 aboard theresearch vessels Nathaniel B. Palmer and Roger
Revelle. Those cruises sampled almost entirely inthe vicinity of 1701W, and extended from B531Sto B711S (Fig. 1). In late November 1996 bottom-moored arrays of sediment traps were deployedfrom the Palmer along 1701W at the locationsshown in Fig. 1. Bottom depths at those sites aregiven in Table 2. Traps on these arrays collected
Table 1
Experimental and analytical methods used, and papers presenting the individual data sets
Depth Process Method Reference
A. Organic carbon data
Euphotic zone Gross photosynthesis 18O conversion from H2O to O2 Dickson & Orchardo, 2001
Euphotic zone Net community production d[O2]/dt Dickson & Orchardo, 2001
Euphotic zone POC production 14C uptake Barber & Marra, unpublished data
Euphotic zone New production 15NO3– uptake Sambrotto & Mace, 2000
50 m New production Seasonal NO3– drawdown This paper
100 m Particulate flux 234Th deficit, > 70 mm POC Buesseler et al., 2001
1,000 m Particulate flux Sediment trap collections Honjo et al., 2000
Sea floor Particulate rain Remineralization + burial This paper
Sea floor Remineralization Pore-water NO3–, TCO2 & alkalinity profiles Sayles et al., 2001
Sea floor Long-term burial 230Th-normalized accumulation Sayles et al., 2001
B. Biogenic silica data
Euphotic zone Gross production 32Si uptake Brzezinski et al., 2001
50 m Net production Seasonal Si(OH)4 drawdown Sigmon et al., 2002
50 m Export Seasonal (Si(OH)4+BSiO2) drawdown Sigmon et al., 2002
100 m Particulate flux 234Th deficit, > 70 mm BSiO2 Buesseler et al., 2001
1,000 m Particulate flux Sediment trap collections Honjo et al., 2000
Sea floor Particulate rain Remineralization plus burial This paper
Sea floor Remineralization Pore-water Si(OH)4 profiles Sayles et al., 2001
Sea floor Long-term burial 230Th-normalized accumulation Sayles et al., 2001
D.M. Nelson et al. / Deep-Sea Research II 49 (2002) 1645–16741648

samples for predetermined intervals of 8.5–136days from the time of deployment until lateJanuary 1998. Details of the trap design and thefull data set on POC and opal fluxes at all depths
are given by Honjo et al. (2000). Each trap arrayincluded a programmable, interval-collecting trapat B1000 m (937–1031 m) and the material col-lected in those traps forms the basis of the
Fig. 1. The AESOPS study area, locations of main sampling sites and boundaries of sub-regions used for vertical budgets. Cruise
tracks of the R./V. Roger Revelle in October/November 1997 are shown in red, November/December 1997 in green, January/February
1998 in blue and February/March 1998 in yellow. Gross production and net production of POC and BSiO2 in the euphotic zone and
export of both phases from the upper 100m were measured along these cruise tracks over the time intervals shown in Table 2. Bottom-
moored sediment traps were deployed from late November 1996 to mid January 1998 to measure the sinking fluxes of POC and BSiO2
at the sites shown with stars. Benthic fluxes (remineralization and burial) of POC and BSiO2 were also measured at the sites shown with
stars, and at the additional sites shown with rectangles. White dashed lines denote the boundaries of the four sub-regions selected for
vertical budgets based on data at B1701W: the northern ACC (551–591S), polar frontal region (591–61.51S), southern ACC (61.5–
65.51S) and Ross Gyre (65.51–681S). Reasons for placing the boundaries at those latitudes at 1701W are discussed in the text. The mean
positions of the Subtopical Front (STF), Subantarctic Front (SAF), PF, SACCF and southern boundary of the Antarctic Circumpolar
Current (SB ACC) in the study area (from Orsi et al., 1995) are shown with black solid lines.
D.M. Nelson et al. / Deep-Sea Research II 49 (2002) 1645–1674 1649

estimated 1000-m settling fluxes reported here. Wesampled from the Palmer to measure benthicremineralization and burial fluxes of organiccarbon and biogenic silica at each of the fourmooring sites where sediment traps were deployed,plus three other sites as shown in Fig. 1 and Table2, during the mooring recovery cruise in February1998 (Sayles et al., 2001).
We measured rates of organic matter andbiogenic silica production in the euphotic zoneand their export from the upper 100 m on a seriesof four cruises aboard the Revelle between lateOctober 1997 and mid March 1998. Sampling oneach cruise was also centered on 1701W, andextended from B531S to 631–711S, with thesouthward extent of sampling increasing as sum-mer progressed and the sea ice retreated (Fig. 1).The first two cruises (in October/November andDecember/January) sampled southward to theedge of the retreating pack ice, which was locatedat B631S and B651S, respectively. The third andfourth cruises (in January and February/March)encountered no pack ice and sampled to B681Sand B711S, respectively. We performed tracerincubation experiments with 18O, 14C, 15N and 32Sito measure rates of gross photosynthesis, POC
production, NO3� uptake and BSiO2 production
within the euphotic zone at stations along thesetransect lines (Sambrotto and Mace, 2000; Brze-zinski et al., 2001; Dickson and Orchardo, 2001)and incubation experiments to measure net com-munity production from the change in dissolved[O2] with time (Dickson and Orchardo, 2001).Dates over which we obtained each of these datasets are presented in Table 2.
We also estimated seasonal net production ofPOC and BSiO2 from the observed seasonaldrawdown of nitrate and silicic acid in the upper50 m. We estimated export of POC and BSiO2
from the upper 100 m based on 234Th deficits in theupper 100 m, in combination with the POC andBSiO2 content of the >70 mm particles presumedto be the main agents of vertical transport in thesystem (Buesseler et al., 2001). The spatial extentof the combined measurements of 234Th deficitsand >70 mm POC and BSiO2 was greatest on thecruises in December and February/March. Furtherdetails of the sampling locations and dates, and allmeasured rates of photosynthesis, nutrient uptakeand biogenic particle export used in the budgetspresented here, can be found at the US JGOFSwebsite: http://usjgofs.whoi.edu/southern.html.
Table 2
Time intervals over which rates of organic carbon and biogenic silica production were measured, latitudes and bottom depths of
AESOPS sediment-trap mooring sites and benthic flux stations in the Southern Ocean
Sub-region Northern ACC Polar Frontal Region Southern ACC Ross Gyre
(551–59 1S) (591–61.5 1S) (61.51–65.5 1S) (65.51–68 1S)
Time over which surface-layer rates were measured1
Gross and net photosynthesis Dec. 7–Feb. 19 Dec. 7–Feb. 21 Dec. 12–Mar. 10 F3
POC production Dec. 7–Mar. 13 Nov. 1–Mar. 13 Oct 28–Mar. 10 Feb. 27–Mar. 7
New production Dec. 7–Feb. 20 Dec. 11–Feb. 21 Dec. 16–Mar. 10 F3
BSiO2 production Dec. 6–Mar. 13 Nov. 2–Mar. 13 Oct. 29–Mar. 11 Jan. 16–Mar. 7
POC and BSiO2 export2 Oct. 24–Feb. 18 Nov. 1–Feb. 21 Oct. 28–Mar. 10 Jan. 17–Feb. 27
Latitude of sediment-trap mooring site (1S) 56.88 60.27 63.17 66.14
Bottom depth at sediment-trap mooring site (m) 4,969 3,978 2,930 3,148
Latitudes of benthic flux sites (1S) 56.88, 58.69 60.27 61.88, 63.17, 64.20 66.14
Bottom depths at benthic flux sites (m) 4,969, 4,345 3,978 3,303, 2,930, 2,746 3,148
1During austral spring and summer, 1997 – 1998.2Export estimates are based on 234Th deficits, which integrate export over the 2 – 4 weeks prior to sampling.3H2
18O, d[O2]/dt and 15NO3– incubation data in the Ross Gyre are insufficient to provide direct estimates of annual gross
photosynthesis, net community production or new production.
D.M. Nelson et al. / Deep-Sea Research II 49 (2002) 1645–16741650

2.2. Rate measurements
The experimental and analytical methods usedfor measuring carbon and silica fluxes are sum-marized in Table 1, and are presented in detail inthe separate papers reporting the original data sets(Honjo et al., 2000; Sambrotto and Mace, 2000;Brzezinski et al., 2001; Buesseler et al., 2001;Sayles et al. 2001; Dickson and Orchardo, 2001;Sigmon et al., 2002). We present the mainfeatures of those methods here, and refer thereader to the papers cited above for more completedescriptions.
Gross photosynthesis and net community produc-
tion. We measured the gross rate of photosyntheticO2 production by adding 18O-labeled H2O toseawater samples, incubating and measuring theproduction of 18O-labeled dissolved O2 (Benderet al., 1987). We determined net communityproduction from changes in the concentration ofdissolved O2 during incubation experiments. Forexperiments of both kinds, we collected samplesfrom depths corresponding to 85%, 50%, 25%,18%, 10%, 5% and 1% of surface irradiance.Incubations were done on deck under naturalsunlight, in incubators maintained at sea-surfacetemperature with running seawater and screenedwith combinations of blue and neutral-densityphotographic screening to achieve irradiance levelsthat simulated those in situ. All incubations beganabout 1 h before sunrise and lasted B24 h.Vertically integrated daily rates, in mmolC m�2 d�1, were calculated by trapezoidal integra-tion of the data. Due to an over-collection ofincident radiation by the two incubators receivingthe highest irradiance levels, data from thoseincubations were not included in the integrations.Instead, gross and net O2 production rates wereintegrated by extending the production ratemeasured at the third optical depth (25% ofsurface irradiance) to the surface and integratingthe rest of the profile to the 1% light level(Dickson and Orchardo, 2001). This modificationof the integration scheme increased the calculatedgross and net production by an average of13% and 23%, respectively, in spring andby 1% and 34%, respectively, in summer oververtically integrated rates that do not correct for
photoinhibition in incubations performed at high-er-than-ambient light levels.
We converted the measured rates of O2 produc-tion to carbon units using the equations:
Net Corg prod: ¼ ðNet O2 prod:=1:4Þ; ð1Þ
Gross Corg prod: ¼ Net Corg prod:
þ ððGross O2 prod:� Net O2 prod:Þ=1:1Þ; ð2Þ
where all production rates are expressed in mmolC or O2 m�2 d�1. We applied a photosyntheticquotient (PQ) of 1.4 to the net O2 production dataand a PQ of 1.1 to the difference between gross O2
and net O2 production. The higher PQ assumesthat nitrogen is obtained as nitrate, which must bereduced to be assimilated into organic matter, andthe lower PQ on use of the regenerated nitrogen-ous nutrients ammonium and urea (Laws, 1991).
POC production. We measured the conversionof 14C-labeled bicarbonate (H14CO3
–) to organicmatter retained by glass-fiber filters (GFF; nom-inal pore size B0.7 mm) during B24-hr incuba-tions. Depths sampled, incubation conditions andvertical integration methods were as describedabove for gross and net photosynthetic rates.While the oxygen-based methods described abovemeasure the gross rate of organic carbon produc-tion by phytoplankton and the net rate of organiccarbon production by the microplankton commu-nity, 14C uptake measures the photosyntheticproduction of POC that is not respired or releasedas DOC on time scales o24 h.
Nitrate uptake. We measured rates of nitrateuptake, and estimated rates of nitrate-based newproduction (Eppley and Peterson, 1979), fromconversion of 15N-labeled nitrate (15NO3
–) toorganic matter retained by glass-fiber filters(GFF; nominal pore size B0.7 mm) similar tothose used for 14C measurements of POC produc-tion rates (Sambrotto and Mace, 2000). Samplingdepths, incubation conditions and vertical integra-tion methods were as described above for 18O and14C incubations, except that no correction forphotoinhibition was found to be necessary for the15N measurements. Those incubations in a sepa-rate set of incubators were not subject to the sameover-collection of light as those used for the 14Cand oxygen studies. We converted the measured
D.M. Nelson et al. / Deep-Sea Research II 49 (2002) 1645–1674 1651

rates of nitrate uptake to carbon-based estimatesof new production using the Redfield C:N moleratio of 6.6 (Redfield et al., 1963).
Biogenic silica production. We measured rates ofBSiO2 production from the conversion of 32Si-labeled silicic acid (32Si(OH)4) to particulatematter retained by polycarbonate membrane filters(Poretics, Inc.) with a pore diameter of 0.4 mm(Brzezinski et al., 2001). Sampling depths, incuba-tion conditions and vertical integration methodswere as described above for 15N incubationexperiments, but we included a sample from thedepth of 0.1% surface irradiance in all profiles.That deeper sample was added because data fromother areas have often shown that BSiO2 produc-tion extends to greater depths than does eitherphotosynthesis or nitrate uptake (e.g. Nelson andBrzezinski, 1997). This was true also in theAESOPS study (Brzezinski et al., 2001).
Seasonal net production of organic carbon and
biogenic silica. We estimated these from theobserved seasonal drawdown of NO3
– and Si(OH)4in surface waters. Nutrient conditions in the studyarea at the beginning of the first Revelle cruise inOctober 1997 indicate that little biological removalhad occurred since the time of deep convectivemixing the previous winter (e.g., Morrison et al.,2001). Nutrient concentrations subsequently di-minished as a result of biological uptake, with thegreatest drawdown occurring north of 661S(Morrison et al., 2001; Brzezinski et al., 2001).We obtained minimum estimates of the seasonalnet production of POC and BSiO2 from thevertically integrated depletion of NO3
– and Si(OH)4in the upper 50–100 m. We estimated net BSiO2
production directly from Si(OH)4 drawdown(Sigmon et al., 2002) and POC production fromNO3
– drawdown multiplied by the Redfield ratio of6.6 (Tables 1 and 3).
POC and BSiO2 export from the upper 100 m.
We estimated POC and BSiO2 export frommeasurements of 234Th, a naturally occurringparticle-reactive radionuclide produced from along-lived soluble precursor, 238U (Buesseler,1998 and references therein). We measured 234Thactivity profiles (generally 5 depths between thesurface and 100 m) during the four Revelle cruisesbetween October 1997 and March 1998. By
measuring the 234Th deficit, calculated as thevertically integrated difference between the 234Thactivity and that of its parent 238U (238U activitycan be estimated from salinity), we calculated theexport flux of 234Th on sinking particles. We usedthese data and the measured ratios of particulate234Th to the POC and BSiO2 retained on 70-mmscreens to estimate POC and BSiO2 fluxes at 100 m(Buesseler et al., 2001). We obtained independentestimates of BSiO2 export from the upper 50 mbased on seasonal changes in the total Si inventory(vertically integrated [Si(OH)4]+vertically inte-grated BSiO2; Sigmon et al., 2002). No parallelestimate of POC export from the upper 50m wasmade because we do not have adequate informa-tion on changes in the dissolved organic carbon(DOC) inventory in surface waters.
POC and opal fluxes to 1000 m. The fluxes ofPOC and BSiO2 to 1000 m were calculated directlyfrom material collected by sediment traps at foursites within the study area (Honjo et al., 2000).There is increasing evidence that the trappingefficiency of moored traps deployed in themesopelagic zone can be o100% (Yu et al.,2001; Scholten et al., 2001). The thorium- andprotactinium-based efficiency estimates employedby those authors are complicated in the SouthernOcean by the presence of a large advective supplyof nuclides via upwelling of deep waters. Never-theless, the 1000 m AESOPS traps collected a fluxof 230Th ranging from 46% to 90% of its rate ofproduction by 234U decay in the overlying watercolumn (Chase, 2001). This suggests trappingefficiencies for the AESOPS traps were between50% and 100%. Because of the uncertainty inestimating advective fluxes of nuclides on a site-specific basis, and because the o100% efficienciesidentified by deficits in scavenged isotopes may behydrodynamic and involve particle sorting in someunknown, composition-dependent manner, wehave not corrected trap fluxes for possible under-trapping. The reported particle flux estimates to1000 m thus represent minimum values, withmaximum values being about twice the reportedvalues.
Benthic remineralization of organic carbon and
biogenic silica. We calculated rates of biogenicsilica dissolution in the seabed from the efflux of
D.M. Nelson et al. / Deep-Sea Research II 49 (2002) 1645–16741652

Table 3
Estimated annual fluxes of organic carbon and biogenic silica in the Southern Ocean at 1701W
Depth Process Method Northern ACC Polar Frontal Region Southern ACC Rose Gyre
(551–59 1S) (591–61.5 1S) (61.51–65.5 1S) (61.51–68.5 1S)
A. Organic carbon fluxes (molCm�2 y�1)
Euphotic zone Gross photosynthesis 18O conversion from H2O to O2 16 12 15 F2
Euphotic zone Net community production d[O2]/dt 1.6 3.2 6.6 F2
Euphotic zone POC production 14C uptake 6.9 8.5 8.7 3.7
Euphotic zone New production 15NO3F uptake 2.6 3.9 3.8 F2
50 m New production Seasonal NO3F drawdown 2.1 2.6 3.2 1.7
100 m Particulate export 234Th deficit, > 70 mm POC 2.5 2.3 2.7 1.7
1,000 m Particulate flux Sediment trap collections 0.17 0.17 0.21 0.14
Seabed Particulate rain Remineralization + burial1 0.071 – 0.074 0.055 – 0.063 0.15 – 0.21 0.088–0.14
Seabed Remineralization Pore-water NO3– profiles 0.070 0.061 0.20 0.14
Seabed Remineralization Pore-water TCO2 & alkalinity profiles 0.073 0.053 0.14 0.087
Seabed Long-term burial 230Th-normalized accumulation 0.0012 0.0017 0.0062 0.0014
B. Biogenic silica fluxes (mol Si m�2 y�1)
Euphotic zone Gross production 32Si uptake 0.76 1.9 3.0 1.3
Euphotic zone Net production Seasonal Si(OH)4 drawdown 0.35 0.95 2.4 0.69
50 m Export Seasonal (Si(OH)4+BSiO2) drawdown 0.32 0.88 2.2 0.51
100 m Particulate export 234Th deficit, > 70 mm BSiO2 0.64 1.4 1.4 0.34
1,000 m Particulate flux Sediment trap collections 0.28 0.38 0.94 0.21
Seabed Particulate rain Remineralization plus burial 0.29 0.34 1.4 0.26
Seabed Remineralization Pore-water Si(OH)4 profiles 0.27 0.29 1.2 0.24
Seabed Long-term burial 230Th-normalized accumulation 0.016 0.048 0.16 0.016
1Range in POC rain represents that resulting from the two independent estimates of remineralization2H2
18O, d[O2]/dt and 15NO3– incubation data in the Ross Gyre are insufficient to provide direct estimates of annual gross photosynthesis, net community production or
new production.
D.M
.N
elson
eta
l./
Deep
-Sea
Resea
rchII
49
(2
00
2)
16
45
–1
67
41653

Si(OH)4 from the sediment at the seven benthicstations. We estimated rates of organic carbonremineralization at those same stations by twoindependent methods, one based on effluxes ofalkalinity and total CO2 (TCO2), and the otherfrom efflux of NO3
–. Effluxes were estimated asdescribed by Sayles et al. (2001) from the measuredvertical profiles of pore-water solutes in the upper20 cm of the sediment, determined using in situpore-water sampling instruments exclusively foralkalinity and TCO2 and combining in situ andshipboard methods for Si(OH)4 and NO3
–. Effluxestimates were based on the assumption that allflux is diffusive and proceeds in accordance withFick’s first law.
Long-term burial of organic carbon and biogenic
silica. We calculated organic carbon and opalaccumulation rates from measurements of opal,organic carbon and 230Th in the top 4 cm ofmulticores collected at the seven benthic stations.The 230Th method for obtaining vertical fluxassumes that the flux of 230Th to the sea floor isconstant and equal to its production from 234Udecay in the overlying water column. FollowingFran-cois et al. (1990) and Suman and Bacon(1989), we derived the burial flux of organiccarbon and biogenic silica (FS; in g cm�2 yr�1) bynormalizing to the known constant flux of 230Th:
FS ¼ ðCS=AThÞ � PTh; ð3Þ
where CS is the weight-fraction of the componentof interest, ATh is the activity of 230Th in thesediment, and PTh is the 230Th production rate, afunction of the depth of water overlying the coringsite (Sayles et al., 2001).
Rain of POC and opal to the sea floor. For bothPOC and BSiO2, we estimated delivery to the seafloor as the sum of benthic remineralization pluslong-term burial.
2.3. Sub-regions for constructing vertical budgets
Any attempt to construct a vertical elementalbudget based on measured fluxes hinges on theassumption that changes in flux with depth resultmainly from the production and recycling pro-cesses operating in that region. Lateral injection ofmaterial produced where production rates are
either significantly higher or significantly lowerwould cause the apparent vertical budget to bealiased by lateral effects. The entire area underconsideration in this study is dominated by theeastward-flowing ACC, with zonal transportextending from the surface to the bottom (Gordonand Molinelli, 1986). The Southern Ocean hasbeen characterized biogeochemically as a series ofzonal bands, in which properties change muchmore rapidly in the meridional direction than inthe zonal direction (Tr!eguer and Jacques, 1992;Banse, 1996; Moore et al., 2000). We have thusdivided the AESOPS study area into four hydro-graphically and ecologically distinct sub-regions,arranged spatially as zonal bands. We constructedvertical budgets for organic carbon and biogenicsilica in each band, using fluxes measured in thewater column and upper seabed. The four bandsrepresent the following sub-regions:
1. The northern ACC (551–591S). This zone issituated entirely north of the APF. It ischaracterized by high surface nitrate andphosphate concentrations (>15 and >2 mM,respectively), but relatively low silicic acidconcentrations (B10 mM) prior to the onset ofphytoplankton growth in spring (Morrisonet al., 2001). This sub-region lies within anecological zone that Banse (1996) referred to asthe ‘‘subantarctic water ring’’, where there isrelatively little seasonal change in chlorophyll.
2. The polar frontal region (591–61.51S). This isthe zone in which the maximum meridionalgradients in both surface and subsurfacetemperature and density are located at all timesof year (Moore et al., 1999) and the site of themain meridional gradient in surface-layer[Si(OH)4] in early spring (Morrison et al.,2001). It is also the zone of maximum meaneastward velocity of the ACC and maximum inmesoscale variability and eddy energy (Barthet al., 2001). This zone has been reported to bethe site of intense phytoplankton blooms in theAtlantic sector of the ACC during spring andsummer (e.g., Laubischer et al., 1993; Bath-mann et al., 1997).
3. The southern ACC (61.51–65.51S). This zonelies entirely within the ACC, south of the APF.
D.M. Nelson et al. / Deep-Sea Research II 49 (2002) 1645–16741654

In the vicinity of 1701W the southern ACC isalmost completely ice-covered in late winter andis entirely ice-free by late summer. It has highsurface [Si(OH)4] (35–55 mM) in late winter(Morrison et al., 2001), and is the zone withinwhich we observed the main biological event insurface waters during the spring and summer of1997–1998: A diatom bloom developed betweenthe southern edge of the APF and the winter iceedge in early December, and then propagatedsouthward across the southern ACC betweenDecember and early February, depleting sur-face [Si(OH)4] to o2 mM, and occasionally too1 mM, to at least as far south as 651S(Brzezinski et al., 2001).
4. The Ross Gyre (65.51–681S). This zone liessouth of the SACCF, and surface waterspassing through 1701W at these latitudes comemainly from the Ross Sea shelf (e.g. Gordonand Molinelli, 1986). This zone is ice-coveredfor all but B100 days each year, and is south ofthe area from which there is evidence of adiatom bloom during either 1996–1997 or 1997–1998 (Honjo et al., 2000; Brzezinski et al.,2001).
Each of these zones included one sediment-trapmooring site, one to three stations at whichbenthic fluxes were measured, and 4–24 stationsat which surface-layer rate data were obtainedduring AESOPS. The latitude and bottom depthof each mooring site and benthic site and the timeinterval during which surface-layer rate measure-ments were made within each of these zones areshown in Table 2.
2.4. Estimation of annual POC and BSiO2 fluxes
The available rate data are most readilycompared when they are expressed as estimatedannual fluxes, in mol C or Si m�2 yr�1. Of the datasets obtained, only the 1000-m sediment-trap datapermit an annual flux per m�2 to be calculateddirectly (Honjo et al., 2000). Our other ratemeasurements integrate over shorter or longertime scales: 1 day for photosynthesis and nutrientuptake in surface waters (Sambrotto and Mace,
2000; Brzezinski et al., 2001; Dickson and Orch-ardo, 2001), several weeks for seasonal nutrientdrawdown and 234Th-based export (Buesseler et al.,2001; Sigmon et al., 2002), several months toseveral years for benthic remineralization, andmore than 1000 years for burial (Sayles et al.,2001). We have thus either extrapolated orinterpolated those rate data as described belowto estimate annual fluxes.
Primary production, new production biogenic
silica production and export of C and Si. Weobtained vertical profiles of C, NO3
– and Si(OH)4uptake rates between the sea surface and the baseof the euphotic zone (1% of surface irradiance forphotosynthesis and NO3
– uptake, 0.1% of surfaceirradiance for Si(OH)4 uptake). The measuredrates were generally very low at the greatest depthsampled (Dickson and Orchardo, 2001; Brzezinskiet al., 2001). We thus obtained reasonably directmeasurements of the vertically integrated dailyrate of each process, (in mmol C, N or Si m�2 d�1)at the location sampled on the date when theexperiment was performed. Within each sub-region our data set consists of 4–24 dailymeasurements of vertically integrated photosynth-esis or nutrient uptake, taken over some knownperiod of time in spring and summer (Table 2).Those periods ranged from 9 to 134 days, with allin the three most northerly sub-regions being X72days. All data records from the Ross Gyre werep50 days long because ice cover prevented theship from operating there until mid January.
We estimated export of POC and opal from theupper 100 m based on 234Th deficits in the upper100 m, which included the full depth range overwhich such deficits were measurable (Buesseleret al., 2001). We therefore obtained reasonablydirect estimates of POC and opal export, averagedover the several-weeks time scale on which 234Thdeficits integrate (e.g. Buesseler et al., 1992). Wecollected 234Th data over time intervals similar tothose for photosynthesis and nutrient uptake data(113–134 days in the ACC, 41 days in the RossGyre).
We used several different methods to estimatethe time-integrated productivity, nutrient uptake,and export during the period covered by the data.Temporal integration methods differed because of
D.M. Nelson et al. / Deep-Sea Research II 49 (2002) 1645–1674 1655

differences in the temporal coverage. We measuredrates of BSiO2 production, POC export from theupper 100 m and BSiO2 export from the upper100 m during all four cruises, and calculated thetime-integrated rates of those processes withineach sub-region by trapezoidal integration of thetime-course data within the appropriate latitudeband. We measured rates of gross photosynthesis,POC production, new production and net com-munity production on only the December/Januaryand February/March cruises. That sampling strat-egy missed little biological activity during theOctober/November cruise, which was conductedbefore spring stratification and the onset of netnutrient drawdown (Morrison et al., 2001). How-ever, it produced a B40-day gap (early Januarythrough mid February), which coincided with thepeak of the summer diatom bloom in the southernACC (e.g. Brzezinski et al., 2001). We integratedthrough that part of the growing season based onempirical relationships between measured ratesand other properties that were measured on allcruises.
Vertically integrated photosynthetic rates werestrongly correlated with surface irradiance inDecember, early January and late February/March (R. Barber and J. Marra, unpublisheddata). We therefore used measured surface irra-diance and the observed relationship betweenirradiance and productivity to estimate POCproduction between early January and mid Feb-ruary, when no direct measurements were made. Itwas not necessary to correct surface irradiancedata for ice cover in the three sub-regions locatedwithin the ACC because the entire ACC was ice-free by late December (Smith et al., 2000). Primaryproductivity in the Ross Gyre was measured onlyduring late February and early March (Table 2),and the measured rates were extrapolated to the100-day ice-free period in that sub-region.
We estimated new production during Januaryand early February based on the observed ratio ofvertically integrated 15NO3
– uptake to surfacechlorophyll during December, late February andearly March. That ratio was nearly constant atB5mmol N m�2 d�1 (mg Chl a l�1)�1 until late inthe season when it decreased somewhat (Sambrot-to and Mace, 2000). We used that relationship,
along with surface chlorophyll estimated fromNASA’s SeaWiFS sensor, to estimate new produc-tion in each sub-region during the temporal gap inthe 15N data record. No estimate of annual grossphotosynthesis, net community production or 15N-based estimate of annual new production in theRoss Gyre is possible, because of the small numberof 18O and 15N incubation experiments performedthere.
The time-integrated production and export inspring and summer are lower than the correspond-ing annual fluxes because they do not account forthe rest of the year. However, our data recordclearly included the period of maximum phyto-plankton productivity and export (e.g., Brzezinskiet al., 2001; Buesseler et al., 2001). Therefore, weestimated the annual flux estimates by a uniformextrapolation method that draws upon the onegenuinely year-round data record we have in eachsub-region, the particle fluxes collected by sedi-ment traps at B1000 m (Honjo et al., 2000).
The sediment-trap data from all AESOPS sitesshow that the fluxes of both POC and BSiO2 to1000 m were greatest in summer, with a longperiod of much lower flux through the autumn,winter and early spring (Honjo et al., 2000). Allupper-ocean production and export measurementswere made in the spring and summer (Table 2). Wetherefore estimated annual production and exportbased on the assumption that our sampling periodincluded the annual production and export max-ima for both POC and BSiO2. Mathematically, weassumed that the time period included in our datarecord (TD) was the most productive period ofthat length during the year. We then identified theperiod of comparable length in the sediment-traprecord (TF) that had the highest integrated POC orBSiO2 flux to 1000 m at the mooring site located inthe same sub-region (Honjo et al., 2000). Forexample, our record on BSiO2 production rates inthe polar frontal region (591–61.51S) covers 132days, from November 2 1997 through March 131998 (Table 2). The period of similar length thatyields the highest mean BSiO2 flux to 1000 m at themooring site within that sub-region (60.271S) wasa 134-day period from November 30 1996 throughApril 13 1997. (The data records consistently showa seasonal lag between the period of maximum
D.M. Nelson et al. / Deep-Sea Research II 49 (2002) 1645–16741656

production in surface waters and that of maximumparticle flux to 1000 m.) We then calculated theannual production or export (PA) in mol C orSi m�2 yr�1 as
PA ¼ PDTFFA
TDFD; ð4Þ
where PD is the time-integrated production orexport during the period covered by data(mol C or Si m�2); FA is annual flux to1000 m (mol C or Si m�2 yr�1); FD is flux to1000 m during the highest-flux period of a lengthsimilar to that of the data record on production(mol C or Si m�2)
This estimation method assumes that the shapeof the seasonal time course of upper-oceanproductivity and particle export parallels that ofthe seasonal time course of particle flux to 1000 m,but it is unaffected by the time lag betweenproduction in surface waters and arrival at1000 m. The upper-ocean rate estimates derivedin this way are conservative, as we cannot becertain that (in the example given above)the 132-day period covered by our data is thesingle most productive 132-day period thatcould have been chosen during the year. But thisscheme provides a far more realistic estimate thancould be obtained either by ignoring productionand export during autumn and winter or byextrapolating spring and summer rates to theentire year.
Net production of BSiO2 and POC and export of
BSiO2 based on nutrient drawdown and changes in
BSiO2 with time. Nutrient drawdown calculationsare useful only for spring and summer, whensurface-layer nutrient concentrations decreasedwith time. They provide minimum estimates ofannual net production because they contain noinformation for the autumn and winter when ratesof nutrient resupply by upwelling andmixing exceed those of nutrient uptake byphytoplankton. Even the spring/summer estimateis conservative, because it is based on the excess ofnet nutrient use in surface waters over resupply byupwelling and mixing (e.g., Jennings et al., 1984).There are no reliable criteria for evaluating theuncertainty in estimates of this kind; they providea hard minimum, but no information on the
maximum. The resulting minimum estimates of netBSiO2 and POC production are reported primarilyfor comparison with others, which can be extra-polated to consider potentially significant rates inautumn and winter (e.g., annual new productionbased on 15NO3
– uptake or export based on 234Thdeficits).
Benthic remineralization and burial of POC and
opal. Benthic remineralization estimates are basedon measurements made at a single time point foreach region (March–April 1998). In calculatingannually averaged fluxes, we considered thepossible effects of temporal variability on fluxes(Sayles et al., 2001). The estimated temporalvariability was small at the southernmost site(66.141S), with maximum fluxes estimated to be25% greater than the annual mean. This differenceis similar to the spatial variability found in theRoss Gyre region. The potential temporal varia-bility is most significant at 63.171S, where a flufflayer was observed just above the sediment surfaceand the maximum flux was estimated to be 1.6–2.3times the annual mean (Sayles et al., 2001). If thissite is representative of all those at which a flufflayer was present (61.881S, 63.171S and 64.201S),then a correction would have to be applied tofluxes calculated from high-resolution pore-waterdata at each of these sites. The corrected fluxes,calculated from high-resolution pore-water pro-files of NO3
–, are higher than fluxes calculated fromlower resolution alkalinity and TCO2 profiles byabout 40%. This difference is similar to the spatialvariability that was averaged to give the regionalflux estimate for the southern ACC region inTable 3. Modeling indicates that no seasonalvariability in POC remineralization was likely atsites within and north of the polar frontal region(Sayles et al., 2001). The NO3
–-based fluxes shownin Table 3 have been corrected for the model-derived effect of seasonal variability. The fluxescalculated from alkalinity and TCO2 data, whichare based on profiles with coarser depth resolutionbelow the sediment–water interface, do not includethe correction.
The corrected NO3–-based fluxes are about 40%
higher than those calculated from alkalinity andTCO2. This difference is similar to the spatialvariability that was averaged to give the regional
D.M. Nelson et al. / Deep-Sea Research II 49 (2002) 1645–1674 1657

flux estimates for the southern ACC in Table 3.Thus the range of estimates for the Ross Gyre andsouthern ACC may reflect both spatial variabilityand the difference between two independentmethods of calculation. Additional modelingdemonstrated that the time scale of opal reminer-alization in sediments throughout the region islong enough that no seasonal variability in benthicdissolution rates is likely for opal. The regionalaverage benthic remineralization values reportedfor the northern ACC have large uncertainty(780% for POC and 750% for opal) becausethey combine data from two sites (58.691S, waterdepth 4345 m, and 56.881S, 4969 m) with verydifferent benthic fluxes (Sayles et al., 2001).
2.5. Uncertainty in the estimated annual fluxes
As noted above, some of our individual fluxestimates are subject to quantifiable uncertainty ofup to a factor of two. In addition, while rates ofbiological processes in surface waters are inher-ently measured to within 75% by isotopic tracermethods, vertical integration and seasonal extra-polation of those rates introduce additional errors,which cannot be quantified well by analytical orstatistical criteria. Burial fluxes estimated by230Th-normalization have an uncertainty of up to730% associated with the assumption that theflux of 230Th is equal to its production rate(Henderson et al., 1999). Further uncertainty isintroduced by the fact that the various ratemeasurements integrate over time scales rangingfrom 1 day to >1000 years, and that the surface-layer and 1000 m data were obtained duringdifferent years. Fluxes of POC and opal to1000 m were measured mostly during 1996–1997,while upper-ocean fluxes were measured onlyduring the spring and summer of 1997–1998. Thecumulative effect of these uncertainties is thatsmall differences between estimated fluxes shouldnot be interpreted as having any significance.While there is no reliable way to evaluate theuncertainty associated with the estimated annualfluxes, we believe that estimates for the samephase (i.e. opal or POC) are distinguishable fromone another only if they differ by at least a factorof two.
3. Results and discussion
All estimated annual fluxes of POC and BSiO2
in the Pacific sector of the Southern Oceanbetween November 1996 and March 1998 arepresented in Table 3. Estimates are reported to twosignificant figures for consistency but, as notedabove, small (o2-fold) differences between fluxestimates should not be interpreted as havingsignificance. Many of the estimated differences aremuch greater than a factor of two, however, andthey show several major features of the C and Sicycles in the region:
3.1. Relationships among gross photosynthesis, net
community production and POC production
The estimated annual gross photosynthesis, netcommunity production and POC production inthe three sub-regions located within the ACC arepresented in Fig. 2. Data records for gross photo-synthesis and net community production obtainedin the Ross Gyre are not long enough to permitestimates of annual production. Estimated annualPOC production based on 14C uptake ranged from6.9 to 8.7 mol C m�2 yr�1. Estimated gross photo-synthesis ranged from 12 to 16 mol C m�2 yr�1,1.4–2.3 times annual POC production, in thosesub-regions. Like POC production, gross photo-synthetic rates were fairly uniform across the ACC(Fig. 2). Estimated net community productionincreased southward from 1.6 mol C m�2 yr�1 inthe northern ACC to 6.6 mol C m�2 yr�1 in thesouthern ACC. The ratio of net communityproduction to gross photosynthesis increasedsouthward, from 0.10 in the northern ACC, to0.27 in the polar frontal region and 0.43 in thesouthern ACC. That ratio estimates the fraction ofphotosynthetically produced organic matter that isavailable for export from the euphotic zone, withhigh ratios indicating efficient export and lowratios intense near-surface recycling. The data thussuggest that 57–90% of gross photosyntheticproduction was remineralized within the euphoticzone across the entire region, with intensity ofrecycling diminishing to the south.
The difference between the estimates of annualgross photosynthesis and annual POC production
D.M. Nelson et al. / Deep-Sea Research II 49 (2002) 1645–16741658
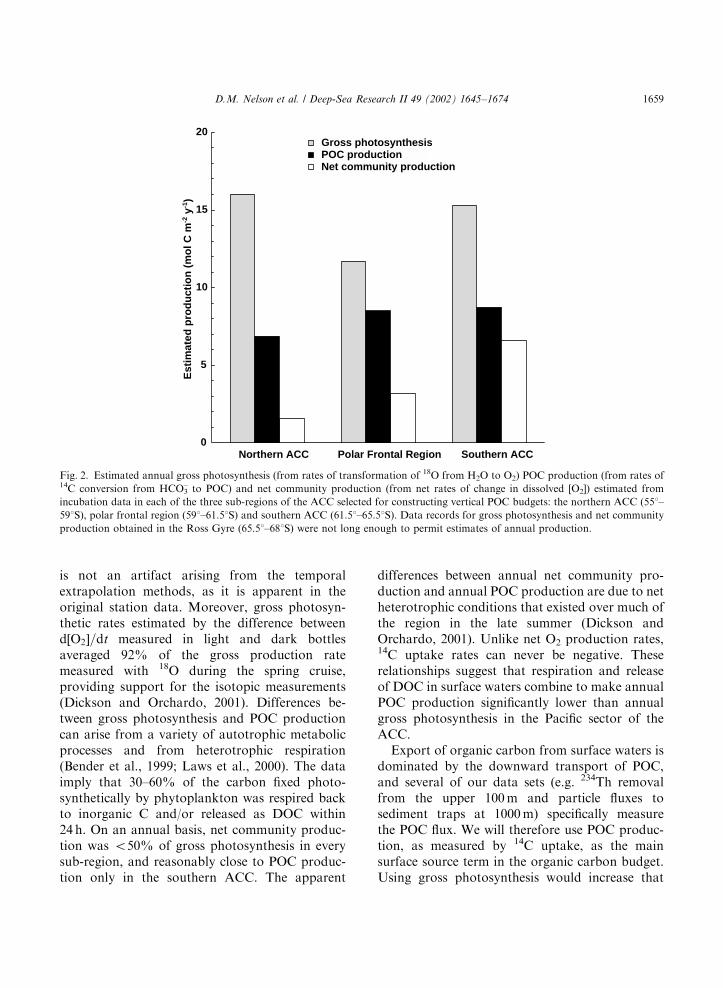
is not an artifact arising from the temporalextrapolation methods, as it is apparent in theoriginal station data. Moreover, gross photosyn-thetic rates estimated by the difference betweend½O2�=dt measured in light and dark bottlesaveraged 92% of the gross production ratemeasured with 18O during the spring cruise,providing support for the isotopic measurements(Dickson and Orchardo, 2001). Differences be-tween gross photosynthesis and POC productioncan arise from a variety of autotrophic metabolicprocesses and from heterotrophic respiration(Bender et al., 1999; Laws et al., 2000). The dataimply that 30–60% of the carbon fixed photo-synthetically by phytoplankton was respired backto inorganic C and/or released as DOC within24 h. On an annual basis, net community produc-tion was o50% of gross photosynthesis in everysub-region, and reasonably close to POC produc-tion only in the southern ACC. The apparent
differences between annual net community pro-duction and annual POC production are due to netheterotrophic conditions that existed over much ofthe region in the late summer (Dickson andOrchardo, 2001). Unlike net O2 production rates,14C uptake rates can never be negative. Theserelationships suggest that respiration and releaseof DOC in surface waters combine to make annualPOC production significantly lower than annualgross photosynthesis in the Pacific sector of theACC.
Export of organic carbon from surface waters isdominated by the downward transport of POC,and several of our data sets (e.g. 234Th removalfrom the upper 100 m and particle fluxes tosediment traps at 1000 m) specifically measurethe POC flux. We will therefore use POC produc-tion, as measured by 14C uptake, as the mainsurface source term in the organic carbon budget.Using gross photosynthesis would increase that
0
5
10
15
20
Northern ACC Polar Frontal Region Southern ACC
Est
imat
ed p
rod
uct
ion
(m
ol C
m-2
y-1
)
Gross photosynthesis POC production Net community production
Fig. 2. Estimated annual gross photosynthesis (from rates of transformation of 18O from H2O to O2) POC production (from rates of14C conversion from HCO3
– to POC) and net community production (from net rates of change in dissolved [O2]) estimated from
incubation data in each of the three sub-regions of the ACC selected for constructing vertical POC budgets: the northern ACC (551–
591S), polar frontal region (591–61.51S) and southern ACC (61.51–65.51S). Data records for gross photosynthesis and net community
production obtained in the Ross Gyre (65.51–681S) were not long enough to permit estimates of annual production.
D.M. Nelson et al. / Deep-Sea Research II 49 (2002) 1645–1674 1659

surface source term by B40% in the polar frontalregion, and by 75–130% in the southern andnorthern ACC (Fig. 2). The estimated fraction ofsurface-produced organic matter exported fromsurface waters, reaching 1000 m or delivered to theseabed in the northern and southern ACC wouldthus decrease by approximately a factor of two ifwe considered gross photosynthesis as the surfacesource term.
3.2. Vertical budget for particulate organic carbon
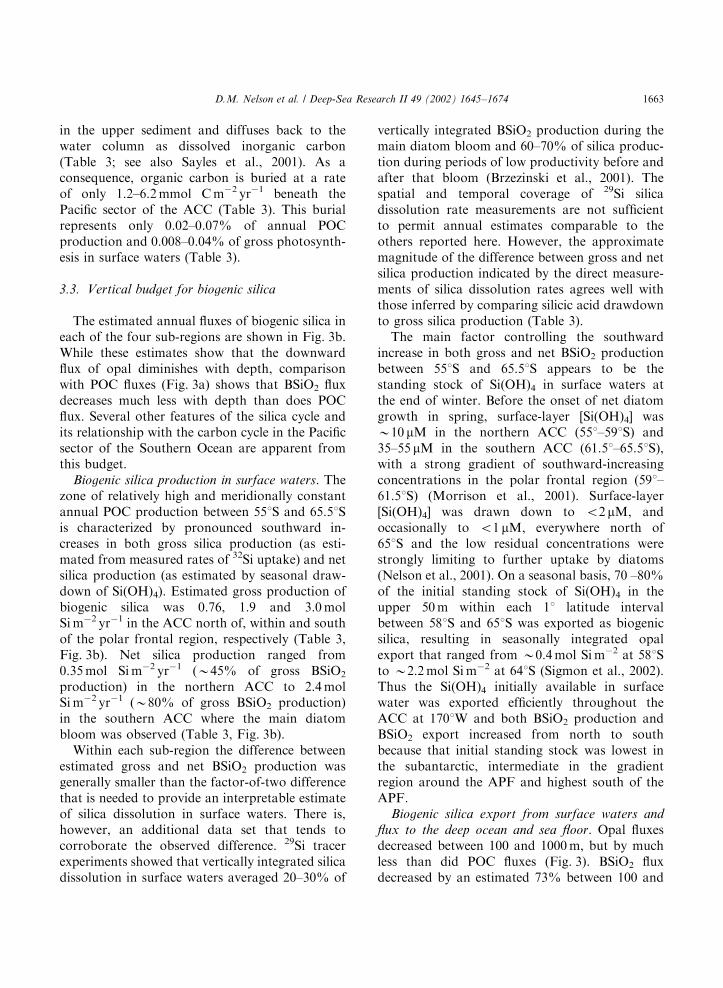
The estimated annual fluxes of POC in each ofthe four sub-regions are shown in Fig. 3a. It isclear from these estimates that the annual down-ward flux of POC diminishes dramatically withdepth. Several other features of the carbon cycle inthis sector of the Southern Ocean are apparentfrom this budget.
Primary productivity. The annual production ofPOC in surface waters was 6.9–8.7 mol C m�2 yr�1
(B80–105 g C m�2 yr�1) in each sub-regionexcept the Ross Gyre, where it was B3.7 molC m�2 yr�1 (B45 g C m�2 yr�1). The lower annual
productivity in the Ross Gyre resulted from thecombined effects of a shorter ice-free season andthe fact that no significant phytoplankton bloomdeveloped there during the ice-free period. Theestimated POC production throughout the AE-SOPS study area between 551S and 65.51 S issomewhat higher than most other estimates ofannual primary productivity in the SouthernOcean south of 551S, which are generally o50 gC m�2 yr�1 (Antoine et al., 1996, Behrenfeld andFalkowski, 1997).
New production and POC export from the upper
100 m. The AESOPS data permit three indepen-dent estimates of new production or POC export.These are:
1. annual new production estimated from 15Ntracer measurements of nitrate uptake,
2. seasonal new production in spring and summerestimated from the observed drawdown ofnitrate in surface waters, and
3. annual POC export from the upper 100 mestimated from 234Th deficits in surface watersand the POC content of the >70 mm particles
0 2 4 6 8 10
Production (C-14uptake)
New production(N-15 nitrate uptake)
New production(nitrate drawdown)
Export (100 m)
Flux to 1,000 m
Flux to seabed
Burial
POC flux (mol C m-2y-1)
Northern ACC Polar Frontal RegionSouthern ACCRoss Gyre
0 1 2 3
Production (Si-32uptake)
Net production(silicic aciddrawdown)
Export (100 m)
Flux to 1,000 m
Flux to seabed
Burial
BSiO2 flux (mol Si m-2y-1)
(a) (b)
Fig. 3. Estimated annual fluxes of POC (A) and BSiO2 (B) in each of the four sub-regions. See text for descriptions of the data sets and
estimation methods used. The estimated POC flux to the seabed represents the sum of burial plus the mean of the two independent
estimates of benthic remineralization shown in Table 3.
D.M. Nelson et al. / Deep-Sea Research II 49 (2002) 1645–16741660

assumed to be responsible for most 234Thexport.
Fig. 3a shows that these three estimates of newor export production are in excellent agreement,and that all indicate this export term to be B30–40% of annual POC production throughout thissector of the ACC. No 15N-based estimate of newproduction can be made for the Ross Gyre, but thenew-production estimate based on nitrate draw-down agrees closely with the export estimate basedon 234Th in that system as well. Both suggest thatB50% of the POC produced annually is exported.There is considerableFand difficult to quantify-Funcertainty associated with each of theseestimates, but they are based on completelydifferent data sets and thus genuinely independent.One feature of the individual data sets notapparent in the annual estimates is that therewas a significant temporal offset between newproduction and POC export. During December1997, when the main diatom bloom was develop-ing and propagating southward (Brzezinski et al.,2001), vertically integrated new production calcu-lated from measured rates of 15NO3
– uptake greatlyexceeded POC export from the upper 100 mcalculated from 234Th deficits and POC contentof large particles (Sambrotto and Mace, 2000;Buesseler et al., 2001). By February, when nophytoplankton bloom was observed in the studyarea and there were extensive areas of netheterotrophy in surface waters (Brzezinski et al.,2001; Dickson and Orchardo, 2001), 234Th-basedmeasurements of POC export significantly ex-ceeded 15NO3
–-based measurements of new produc-tion (Sambrotto and Mace, 2000; Buesseler et al.,2001). This temporal offset is similar to thatobserved between the start of elevated newproduction during the southwest monsoon in theArabian Sea and the initial increase in 234Thdeficits (Buesseler et al., 1998; Sambrotto, 2001).The offset may represent the accumulation ofbiomass in surface waters between the initialestablishment of favorable growth conditions andthe increase in sinking and grazing losses.
Data from AESOPS thus provide robustevidence that new production and POC export
were 1.7–3.8 mol Cm�2 yr�1 throughout the ACCat 1701W during 1997–1998. These estimates are inthe same general range as new-production esti-mates based on seasonal nitrate drawdown theIndian Ocean sector of the ACC, which rangeregionally from 0.9 to 3.5 mol C m�2 yr�1 (Ponda-ven et al., 2000). They are somewhat lower thanthe mean new production of 5.1 mol C m�2 yr�1
over the Ross Sea shelf estimated from 15NO3–
uptake rates (Nelson et al., 1996). Our threeindependent estimates of new production andPOC export in the AESOPS study area are alsoin the general range predicted by the recentbiogeochemical model of Schlitzer (2000), whichestimates POC export from ocean circulationpatterns and the distributions of dissolved oxygen,nutrients and TCO2. Those model results predictexport fluxes of 2–6 mol C m�2 yr�1 throughoutthe Pacific sector of the Southern Ocean (seeSchlitzer’s Fig. 9). Our results are also in generalagreement with recent estimates of new productionbased on seasonal drawdown of HPO4
2� (Louanchiand Najjar, 2000), which suggest a mean newproduction of 2–2.5 mol C m�2 yr�1 throughoutthe Southern Ocean south of 401S. The Pacificsector at 1701W thus seems to be quite typical ofthe Southern Ocean with respect to annual POCexport.
In each sub-region of the ACC new productionestimated from the 15NO3 uptake measurementssomewhat exceeds POC export fluxes based on234Th deficits (Fig. 3a). None of these differencesreaches the factor-of-two level that is necessary toaccept a difference in fluxes as genuine. However,sediment-trap collections indicate that some of thediscrepancy may be attributed to the nitrogen-richnature of the sinking material in this region,particularly at the end of the growing season(Honjo et al., 2000).
Our data provide no evidence that annual grossphotosynthesis, POC production, net communityproduction or POC export is higher in the polarfrontal region than in the waters to the north orsouth (Figs. 2 and 3a). The data also provide noindication that annual production or export ofBSiO2 is higher in the polar frontal region than inthe rest of the ACC at 1701W (Fig. 3b). Upwellingassociated with mesoscale meanders in the APF
D.M. Nelson et al. / Deep-Sea Research II 49 (2002) 1645–1674 1661

has been shown to be a potential source of bothmacro- and micronutrients to the surface layer inthis sector (Barth et al., 2001), and the APF is thesite of intensified primary productivity in othersectors of the ACC (e.g. Laubischer et al., 1993;Bathmann et al., 1997). However, production andexport rates measured at 1701W suggest that anystimulation of either process by enhanced nutrientsupply within the APF is negligible on an annualbasis.
Transport of POC to the deep ocean and the
seabed. The flux of POC to 1000 m ranged fromB140 to B210 mmol C m�2 yr�1 (Table 3,Fig. 3a). Those fluxes, which were calculateddirectly from year-round sediment-trap collections(Honjo et al., 2000), contain less uncertainty thando estimates extrapolated from spring and summerdata. POC fluxes to 1000 m are consistentlybetween 6% and 8% of the 234Th-based estimateof POC export from the upper 100 m. Even if the1000-m fluxes are systematically underestimatedby 20–40% due to under-collection of sinkingPOC (Yu et al., 2001; Scholten et al., 2001), theclear implication is that B90% of the POCexported from the upper 100 m is remineralizedat depths o1000 m. This is a common observationin the ocean (e.g. Lee et al., 1998), supported inother systems by data showing that both thesettling flux of POC and respiratory consumptionof O2 decrease quasi-exponentially with depthbetween 100 and 500 m (Martin et al., 1987;Jenkins and Goldman, 1985).
Remineralization of sinking POC in the upper1000 m has particular significance for the carboncycle in the Southern Ocean. If we seek to evaluatethe rate at which biological pumping extracts CO2
from the atmosphere and delivers it to the deepocean as POC, that carbon must be exported to atleast the shallowest depth that will not beventilated during the following winter. Carbonremineralized at shallower depths will be releasedback to the atmosphere at the time of ventilation,resulting in no net transport to depth. Winterventilation depths in the ACC are generally 200–300 m, and can be as deep as 500 m (Gordon andMolinelli, 1986). Thus the annual extraction ofcarbon from the atmosphere by biological pro-cesses in the Southern Ocean may be seriously
overestimated by quantities such as new produc-tion and export production, which are well definedonly for the upper 100 m and do not account forrelatively shallow (100–500 m) subsurface recy-cling. Respiration below the euphotic zone butwithin the ventilated layer also may reduce theamount of material exported to depth. Daily netcommunity production rates determined fromincubations were more than twice those estimatedfrom mixed-layer oxygen saturation levels (Dick-son and Orchardo, 2001). This difference wasfound in spring, when mixed-layer depths greatlyexceeded the depth of the euphotic zone and it wasattributed to respiration of material below theeuphotic zone. Lack of reliable information onorganic matter remineralization between 100 and500 m thus appears to be a major gap in ourpresent ability to characterize the carbon cycle ofthe Southern Ocean.
A relatively high fraction (30–85%) of the POCthat does penetrate to 1000 m, apparently reachesthe sea floor. The most efficient transport of POCfrom 1000 m to the sea floor appears to occursouth of the APF, where POC rain to the sea flooris 55–85% (and hence indistinguishable from100%) of the flux to 1000 m. In contrast, weestimate that 30–45% of the POC that reaches1000 m reaches the sea floor in the polar frontalregion and northern ACC (Table 3). Bottomdepths at 1701W are considerably shallower inthe southern ACC and Ross Gyre than they are inthe polar frontal region and northern ACC(Fig. 1). Depths at the sites where we measuredbenthic fluxes in the two more southerly sub-regions were B2750–3300m, as opposed toB3980–4970 m to the north (Table 2). Thus themore efficient transport of POC from 1000 m tothe sea floor in the northern part of the study areamay result from the simple fact that the verticaldistance those particles must travel is less. Ingeneral, the B90% loss of POC between 100 and1000 m and relatively efficient transport from1000 m to the sea floor imply that pelagicremineralization of organic matter is much lessintense below 1000 m than at shallower depths.
Benthic remineralization and burial. Benthic fluxstudies during AESOPS indicate that 97–99% ofthe POC that reaches the sea floor is remineralized
D.M. Nelson et al. / Deep-Sea Research II 49 (2002) 1645–16741662
in the upper sediment and diffuses back to thewater column as dissolved inorganic carbon(Table 3; see also Sayles et al., 2001). As aconsequence, organic carbon is buried at a rateof only 1.2–6.2mmol C m�2 yr�1 beneath thePacific sector of the ACC (Table 3). This burialrepresents only 0.02–0.07% of annual POCproduction and 0.008–0.04% of gross photosynth-esis in surface waters (Table 3).
3.3. Vertical budget for biogenic silica
The estimated annual fluxes of biogenic silica ineach of the four sub-regions are shown in Fig. 3b.While these estimates show that the downwardflux of opal diminishes with depth, comparisonwith POC fluxes (Fig. 3a) shows that BSiO2 fluxdecreases much less with depth than does POCflux. Several other features of the silica cycle andits relationship with the carbon cycle in the Pacificsector of the Southern Ocean are apparent fromthis budget.
Biogenic silica production in surface waters. Thezone of relatively high and meridionally constantannual POC production between 551S and 65.51Sis characterized by pronounced southward in-creases in both gross silica production (as esti-mated from measured rates of 32Si uptake) and netsilica production (as estimated by seasonal draw-down of Si(OH)4). Estimated gross production ofbiogenic silica was 0.76, 1.9 and 3.0 molSi m�2 yr�1 in the ACC north of, within and southof the polar frontal region, respectively (Table 3,Fig. 3b). Net silica production ranged from0.35 mol Si m�2 yr�1 (B45% of gross BSiO2
production) in the northern ACC to 2.4 molSi m�2 yr�1 (B80% of gross BSiO2 production)in the southern ACC where the main diatombloom was observed (Table 3, Fig. 3b).
Within each sub-region the difference betweenestimated gross and net BSiO2 production wasgenerally smaller than the factor-of-two differencethat is needed to provide an interpretable estimateof silica dissolution in surface waters. There is,however, an additional data set that tends tocorroborate the observed difference. 29Si tracerexperiments showed that vertically integrated silicadissolution in surface waters averaged 20–30% of
vertically integrated BSiO2 production during themain diatom bloom and 60–70% of silica produc-tion during periods of low productivity before andafter that bloom (Brzezinski et al., 2001). Thespatial and temporal coverage of 29Si silicadissolution rate measurements are not sufficientto permit annual estimates comparable to theothers reported here. However, the approximatemagnitude of the difference between gross and netsilica production indicated by the direct measure-ments of silica dissolution rates agrees well withthose inferred by comparing silicic acid drawdownto gross silica production (Table 3).
The main factor controlling the southwardincrease in both gross and net BSiO2 productionbetween 551S and 65.51S appears to be thestanding stock of Si(OH)4 in surface waters atthe end of winter. Before the onset of net diatomgrowth in spring, surface-layer [Si(OH)4] wasB10 mM in the northern ACC (551–591S) and35–55 mM in the southern ACC (61.51–65.51S),with a strong gradient of southward-increasingconcentrations in the polar frontal region (591–61.51S) (Morrison et al., 2001). Surface-layer[Si(OH)4] was drawn down to o2 mM, andoccasionally to o1 mM, everywhere north of651S and the low residual concentrations werestrongly limiting to further uptake by diatoms(Nelson et al., 2001). On a seasonal basis, 70 –80%of the initial standing stock of Si(OH)4 in theupper 50 m within each 11 latitude intervalbetween 581S and 651S was exported as biogenicsilica, resulting in seasonally integrated opalexport that ranged from B0.4 mol Si m�2 at 581Sto B2.2 mol Si m�2 at 641S (Sigmon et al., 2002).Thus the Si(OH)4 initially available in surfacewater was exported efficiently throughout theACC at 1701W and both BSiO2 production andBSiO2 export increased from north to southbecause that initial standing stock was lowest inthe subantarctic, intermediate in the gradientregion around the APF and highest south of theAPF.
Biogenic silica export from surface waters and
flux to the deep ocean and sea floor. Opal fluxesdecreased between 100 and 1000 m, but by muchless than did POC fluxes (Fig. 3). BSiO2 fluxdecreased by an estimated 73% between 100 and
D.M. Nelson et al. / Deep-Sea Research II 49 (2002) 1645–1674 1663

1000 m in the polar frontal zone, and by 33–55%in the other three sub-regions (Table 3). Thus anestimated 27–67% of the BSiO2, as opposed to 6–8% of the POC, exported annually from surfacewaters penetrates to 1000 m in this sector of theSouthern Ocean. The percentages calculated abovewould be aliased by any significant differencebetween BSiO2 export in 1996–1997 (when the1000-m fluxes were measured) and 1997–1998(when export from the upper 100 m was mea-sured). However, the selective preservation of opalthat is apparent in Fig. 3 cannot be an artifactresulting from interannual differences unless opalexport was much higher in 1996–1997 than in1997–1998. As discussed above, surface [Si(OH)4]was depleted to o2 mM everywhere between 551Sand 651S during 1997–1998. This nearly completeremoval of the available Si(OH)4 in 1997–1998makes it highly unlikely that opal export couldhave been significantly higher during the previousyear.
Our estimates imply that a very high fractionof the BSiO2 that reached 1000 m reachedthe sea floor. Estimates for the four sub-regionsrange from 89% to 145% (Table 3), none ofwhich is distinguishable from 100% given theuncertainty inherent in such estimates. The carbonbudget shows that there was also relativelylittle remineralization of POC in the watercolumn below 1000 m. The efficient transport ofboth BSiO2 and POC from 1000 m to the seafloor in all four sub-regions could have at least twocontributing causes. It is possible that theparticulate material Fboth organic and sili-ceousFproduced in surface waters already hashad its most reactive components remineralized(for POC) or dissolved (for BSiO2) by the time itreaches 1000 m. It is also possible that thoseparticles that penetrate to 1000 m do so by sinkingso rapidly that they cover the remaining distanceto the sea floor in a very short time. Both processesmay be significant; the sediment-trap recordsindicate a time lag on the order of 17 days betweenthe maximum POC and opal fluxes to B1000 mand the maximum fluxes to deeper traps atB2900–4900 m (Honjo et al., 2000). That timelag is consistent with a bulk settling rate ofB200 m d�1.
Benthic dissolution and burial. The benthic fluxdata indicate that 83–95% of the BSiO2 reachingthe sea floor dissolves in the upper sediment(Sayles et al., 2001; see also Table 3). While thisrepresents substantial recycling, it is considerablyless intense than the 97–99% remineralizationcalculated above for the POC that reaches thesea floor. This differential recycling continues aprocess that appears to occur throughout thewater column: POC is remineralized more rapidlythan BSiO2 within every depth interval, fromsurface water to the seabed. The cumulative effectis that the preservation efficiency (burial in theseabed/production in surface waters) is muchgreater for BSiO2 than for POC. Estimatedpreservation efficiencies for BSiO2 range from1.2% in the Ross Gyre to 5.5% in the southernACC, while those for POC range only from 0.02%in the northern ACC to 0.08% in the southernACC.
Although the preservation efficiency for BSiO2
appears to be B60 times greater than that for POCthroughout the AESOPS study area, it is notunusually high in comparison with opal preserva-tion efficiencies elsewhere in the ocean. The 1.2–5.5% range of opal preservation efficiency calcu-lated for the AESOPS study area is indistinguish-able from the global mean of 2.5–3% estimated byTr!eguer et al. (1995). Thus the AESOPS resultsfrom the Pacific sector are consistent with thoserecently presented by Pondaven et al. (2000) fromthe Indian sector: Opal preservation efficiency isnot enhanced in the Southern Ocean, and thus isnot the reason why extensive diatom-rich sedi-ments are forming beneath low-productivity sur-face waters.
A consistent spatial pattern in the silica cycle.The southern ACC between 61.51S and 65.51Srepresents a local maximum in almost every Si fluxestimated in the upper ocean, the deep ocean orthe seabed (Fig. 3b). The sole exception to thatpattern is opal export from the upper 100 m, wherethe maximum is somewhat broader and includesboth the polar frontal region and the southernACC. It is important to note in this regard that thedifferent estimates consider not only different datasets but also different time intervals. Estimates ofgross and net BSiO2 production in surface waters
D.M. Nelson et al. / Deep-Sea Research II 49 (2002) 1645–16741664

and opal export from the upper 100 m are allderived from data obtained in the spring andsummer of 1997–1998 (Brzezinski et al., 2001;Sigmon et al., 2002; Buesseler et al., 2001; see alsoTable 2). Opal fluxes to 1000 m were measuredfrom November 1996 through January 1998 andthe estimated annual fluxes are influenced moststrongly by data from the spring and summer of1996–1997 (Honjo et al., 2000). Benthic dissolu-tion fluxes (the main term in the estimated flux tothe seabed) integrate time periods ranging fromseveral months to several years, and all benthicfluxes were measured on material that reached thesea floor before February/March of 1998 (Sayleset al., 2001). The estimated burial rates integratetime periods on the order of 1000+ years (Sayleset al., 2001). The emergence of the southern ACCas the zone of maximum BSiO2 flux in all pelagicestimates thus provides evidence that it was thezone of maximum BSiO2 production and export inboth 1996–1997 and 1997–1998. The benthic data,which integrate over longer time scales, furtherimply that those fluxes may have been maximal inthe southern ACC quite consistently during thepast 1000+ years.
A temporally persistent pattern of the kinddescribed above is exactly what would be expectedif the control of BSiO2 production and export is asSigmon et al. (2002) have proposed. Briefly, theyshowed that during the spring and summer of1997–1998 diatoms exported 70–80% of the Si thatwas available in the upper 50 m at the end ofwinter, at all latitudes north of 651S. As a result,BSiO2 export was greatest in the southern ACC,where initial surface-layer [Si(OH)4] was 35–55 mM, least in the northern ACC where initialconcentrations were B10 mM and intermediate inthe intervening gradient region associated with theAPF. South of 651S the initial [Si(OH)4] in surfacewaters was >55 mM, but relatively little of that Siwas used due to the combined effects of a short ice-free season and possible Fe limitation. Thusannual production and export of BSiO2 aremaximal between 591S and 651S because they arelimited by low late-winter [Si(OH)4] north of 591Sand by prolonged ice cover and possible Felimitation south of 651S. Both of those conditionsare persistent features in the Southern Ocean,
which are probably not subject to major changeson millennial or shorter time scales. Thus thesouthern ACC should be the zone of maximumBSiO2 production and export every year. Verticalbudgets derived from the several AESOPS datasets combine to suggest that the expected persis-tent maximum in all Si fluxes in the southern ACCdoes in fact occur.
3.4. Selective preservation of opal over organic
matter
Fig. 4 presents the estimated annual fluxes,expressed as BSiO2/POC flux ratios. Those ratiosincrease systematically with depth throughout thewater column and upper sediments. Estimated onan annual basis, phytoplankton produced BSiO2
and POC in a mole ratio of B0.1 in the northernACC, and 0.2–0.4 in the polar frontal region,southern ACC and Ross Gyre. The mean BSiO2/POC ratio measured in pure diatom culturesgrowing under nutrient-replete conditions isB0.13 (Brzezinski, 1985). Thus the observedBSiO2/POC production ratios of 0.1–0.4 implythat diatoms accounted for a large fraction of theannual POC production throughout the system,and that those diatoms had unusually high Si/Cproduction ratios in the polar frontal region,southern ACC and Ross Gyre. As also reportedby Buesseler et al. (2001), ratios of opal export toPOC export from the upper 100 m ranged region-ally from 0.2 to 0.6, and the BSiO2/POC ratioincreased to 1.5–4.5 in the material reaching1000 m. The large compositional change between100 and 1000 m reflects the B90% remineraliza-tion of POC discussed above, while biogenic silicafluxes decreased by only 10–70% (Fig. 3b). POCremineralization continued to a diminished extentin the >1000 m water column, at least in thenorthern ACC and the polar frontal region, whileopal passed from 1000 m to the sea floor withoutmeasurable loss. This caused the mole ratio of opalto POC in material delivered to the sea floor torange from 2.2 to 7.6. While 83–95% of the BSiO2
that reached the sea floor dissolved in theupper sediments, 97–99% of the POC reachingthe sea floor was remineralized, with the result thatthe ratio of long-term opal burial to long-term
D.M. Nelson et al. / Deep-Sea Research II 49 (2002) 1645–1674 1665

POC burial increases to 11.6–28. It is clearfrom these data that one reason why opal-rich, organic-poor sediments are accumu-lating beneath the ACC is that the biogenicmaterial produced by phytoplankton is selectivelystripped of organic matter at every stage in itspassage through the water column and into theseabed. Another reason, as noted by Sayles et al.(2001), is that other sedimentary components suchas CaCO3 and terrigenous material accumulateonly very slowly in the abyssal sediments of theACC.
3.5. Comparison of POC and BSiO2 fluxes in the
ACC with those in other oceans
POC fluxes. The estimated annual 14C primaryproductivity in the ACC at 1701W (6.9–8.7 molC m�2 yr�1) is somewhat higher than the meanannual productivity in the ACC south of 551Sestimated from satellite ocean-color and surfaceirradiance data (Antoine et al., 1996, Behrenfeldand Falkowski, 1997). Subsequent estimates,based on ocean-color data obtained concurrentlywith our observations (October 1997–September
0 5 10 15 20 25 30
Surface-layerproduction
Net or newproduction
Export (100 m)
Flux to 1,000 m
Flux to seabed
Burial
BSiO2/POC flux ratio (mol/mol)
Northern ACC
Polar Frontal Region
Southern ACC
Ross Gyre
Fig. 4. Annual flux estimates reported in Fig. 3, expressed as BSiO2/POC flux ratios (mol/mol).
D.M. Nelson et al. / Deep-Sea Research II 49 (2002) 1645–16741666

Table 4
Estimated fluxes of particulate organic carbon and biogenic silica in the Pacific sector of the Sothern Ocean, compared with those in selected other ocean systems.
Region POC
production
(molCm�2 y�1)
New or export
POC
production
(molCm�2 y�1)
POC flux
to B1,000 m
(molC m�2 y�1)
BSiO2
production
(mol Sim�2 y�1)
Net or export
BSiO2
production
(mol Si m�2
y�1)
BSiO2 flux to
B1,000 m
(mol Sim�2 y�1)
Reference(s)
Southern Ocean @
1701W
6.9 – 8.7 2.1 – 3.8 0.17 – 0.21 0.8 – 3.0 0.3 – 2.4 0.28 – 0.94 This study
Ross Sea shelf 1 11.9 5.1 0.412 2.0 0.71 0.482 Nelson et al., 1996
Sargasso Sea near
Bermuda
9 – 15 2.5 – 2.6 0.08 – 0.133 0.24 0.03 – 0.05 F4 Michaels et al.,
1994; Nelson &
Brzezinski, 1997;
Buesseler et al.,
2000; W. Deuser,
unpublished data
N. Pacific Gyre near
Hawaii
12 – 17 0.8 0.15 F4 F4 0.02 Letelier et al.,
1996; Karl et al.
1996; Scharek
et al., 1999
Equatorial Pacific 22 – 41 1.8 – 6.3 0.1 F4 F4 0.12 Barber et al., 1996;
McCarthy et al.,
1996; Honjo et al.,
1995
Arabian Sea 23 – 43 1.0 – 3.4 0.17 – 0.56 F4 F4 0.2 Honjo et al., 1999;
Lee et al., 1998
Global average 10 – 13 2.6 0.2 0.6 – 0.8 0.3 – 0.4 0.15 Antoine et al.,
1996; Behrenfeld
& Falkowski,
1997; Nelson et al.,
1995; Schlitzer,
2000; Honjo, 1997
1Shelf-wide mean fluxes reported2Fluxes to sediment traps at 250 m; mean bottom depth of the shelf is 550m.3Traps were located at 500 and 1500 m; the higher value shown is the flux to 500m, the lower value the flux to 1500m.4No data-based estimate is available.5 Include carbonate, so overestimates POC flux.
D.M
.N
elson
eta
l./
Deep
-Sea
Resea
rchII
49
(2
00
2)
16
45
–1
67
41667

1998) suggest that zonally averaged primaryproductivity in the ACC ranges from B2.4 molC m�2 yr�1 in seasonally ice-covered waters toB6mol C m�2 yr�1 in the polar frontal region(Moore and Abbott, 2000). Spatially integratedproductivity in the polar frontal region and allwaters to the south, an area of 3.07� 107 km2, wasestimated in that study to be 1.42 Pg C yr�1 (1petagram (Pg)=1015 g), a mean productivity ofB46 g C m�2 yr�1 (B3.9 mol C m�2 yr�1). Thoserecent estimates remain somewhat lower than our14C-based estimate for the AESOPS study area,but they are generally within the factor-of-tworange that must be exceeded before differences inannual estimates are meaningful. These estimatesthus suggest that the annual primary productivitywe have estimated at 1701W is close to thecircumpolar average for the ACC. The highestrecent estimate of primary productivity in theSouthern Ocean is 3.2–4.0 Pg C yr�1, integrated forall waters south of 501S (Arrigo et al., 1998), anarea of 4.6� 107 km2 (Moore and Abbott, 2000).The regional productivity estimate of Arrigo et al.(1998) thus represents a mean productivity ofB70–90 g C m�2 yr�1 (B5.8–7.5 mol C m�2 yr�1),which is indistinguishable from our estimate of6.9–8.7 mol C m�2 yr�1 for the ACC at 1701W.
While approximately average for the ACC,primary productivity of 6.9–8.7 mol C m�2 yr�1 isconsiderably lower than that in most other oceans(Table 4). For example, multi-year records of 14Cproductivity at the JGOFS Bermuda AtlanticTime Series (BATS) site in the Sargasso Sea rangeinterannually from 9 to 15 mol C m�2 yr�1 (Mi-chaels et al., 1994) and those at the JGOFS HawaiiOcean Time-series (HOT) site in the North PacificCentral Gyre from 12 to 17 mol C m�2 yr�1
(Letelier et al., 1996). Thus our 14C-based pro-ductivity estimate in each of three sub-regions ofthe ACC at 1701W is somewhat lower than 14C-based productivity estimates from the classicallyoligotrophic subtropical gyres.
15N-based estimates of annual new productionand 234Th-based estimates of annual POC exportin the four sub-regions of the AESOPS study arearange from 1.7 to 3.9 mol C m�2 (Table 3a,Fig. 3a). These two independent estimates bothindicate that the f ratio (new production/total
POC production; Eppley and Peterson, 1979) isB0.4 on an annual basis throughout the system(Table 3a). These f ratios are significantly higherthan those in other open-ocean systems. Forexample, f ratios are generally o0.15 in subtro-pical gyres (e.g. Eppley and Peterson, 1979;Harrison et al., 1996) and have been estimated tobe only 0.04–0.08 in the Arabian Sea (Lee et al.,1998) and 0.02–0.10 in the equatorial Pacific(Buesseler, 1998).
The relatively high f ratios and export efficien-cies we observed in the Southern Ocean at 1701Wresult in annual POC export that is similar to thatin more productive systems at lower latitudes, inspite of the lower primary productivity (Table 4).Our estimated export of 1.7–3.8mol C m�2 yr�1 inthe ACC and Ross Gyre is indistinguishable fromthe 2.6 mol C m�2 yr�1 estimated for the SargassoSea by Michaels et al. (1994) from seasonaldrawdown of dissolved inorganic C and the2.5 mol C m�2 yr�1 estimated for that same systemby Buesseler et al. (2000) from 234Th deficits andthe POC/234Th ratio of the sinking materialcollected by neutrally buoyant sediment traps.The annual POC export we estimate in the ACC isalso similar to that reported in the Arabian Sea,even though annual primary productivity in theArabian Sea is estimated to be 3–5 times that inthe AESOPS study area (Lee et al., 1998; seeTable 4).
Eppley and Peterson (1979) noted a large-scalepattern in which f ratios increase with increasingtotal primary productivity, implying that POCexport from eutrophic surface waters should bemany times greater than that from oligotrophicsystems. However, the relationship presented byEppley and Peterson was based entirely on datafrom tropical and subtropical areas, and does notappear to hold in polar oceans of either thenorthern or southern hemisphere (e.g. Smith andHarrison, 1991). Instead, f ratios in high-latitudesystems generally range from B0.3 to B0.7, inproductive and unproductive regions alike (datafrom numerous studies, summarized by Nelson,1992). A consequence of this relationship is thatPOC export from low-productivity surface watersin polar oceans may be significantly higher thanthat from low-productivity areas in the tropics or
D.M. Nelson et al. / Deep-Sea Research II 49 (2002) 1645–16741668

subtropics. Buesseler (1998) examined this exportefficiency throughout the world’s oceans andattributes high export efficiency in the polaroceans to diatom-dominated food webs. TheAESOPS data are consistent with that high-latitude pattern, with the result that annual newproduction and POC export in the ACC at 1701Ware approximately average for the global oceandespite low primary productivity (Table 4).
Annual POC fluxes to 1000m ranged from 0.14to 0.21 mol C m�2 (Table 3, Fig. 3a), about twicethe global average (Honjo et al., 2000). The carbonbudget thus indicates that POC export efficiency ishigh (remineralization efficiency is low) through-out the upper 1000 m in the ACC. The overallresult of this high export efficiency is that,although annual primary productivity is lowerthan that in most other ocean habitats, annualPOC export from surface waters is somewherenear the global average and annual POC flux tothe deep ocean is about twice the global average(Table 4).
Opal fluxes. In contrast to the low annualproduction of POC, estimated annual rates ofBSiO2 production are substantially higher in theACC than in most other oceans (Table 4). TheAESOPS data indicate that BSiO2 production inthe Pacific sector of the ACC ranges from B0.8 to3.0 mol Si m�2 yr�1 (Fig. 3b). Those rates are 3–12times the annual BSiO2 production reported at theBATS site, and BSiO2 production in all sub-regions except the northern ACC is well above theglobal average of 0.6–0.8 mol Si m�2 yr�1 (Table4). High rates of BSiO2 production in surfacewaters appear to be quite common in the SouthernOcean. Nelson et al. (1996) estimated a meanproduction of 2.0 mol Si m�2 yr�1 over the RossSea shelf, Pondaven et al. (2000) estimated ratesranging regionally from 1.6 to 3.3 mol Si m�2 yr�1
in the Indian Ocean sector of the ACC andRutgers van der Loeff et al. (2002) estimated silicaproduction to be 1.6 mol Si m�2 yr�1 in the polarfrontal region of the Atlantic sector.
Net BSiO2 production and export from theupper 100 m, as estimated from AESOPS data, arealso considerably higher in the ACC than that inother oceans (Table 4). The estimated net BSiO2
production (B0.4–2.4 mol Si m�2 yr�1) and export
(B0.3–1.4mol Si m�2 yr�1) are an order of magni-tude greater than at the BATS site and 2–5 timesthe estimated global mean. As is the case for BSiO2
production, high rates of net BSiO2 productionand export appear to be widespread in theSouthern Ocean. Net BSiO2 production has beenestimated to average 0.7 mol Si m�2 yr�1 over theRoss Sea shelf (Nelson et al., 1996), to rangeregionally from 0.7 to 2.3 mol Si m�2 yr�1 in theIndian Ocean sector of the ACC (Pondaven et al.,2000) and to be 0.4–1.1mol Si m�2 yr�1 in thepolar frontal region of the Atlantic (Rutgers vander Loeff et al., 2002).
Taken together, the high rates of BSiO2
production and export, low primary productivityand moderate POC export imply that the relation-ship between the cycles of carbon and silicon inSouthern Ocean surface waters is very differentfrom that in other oceans, as was suggestedrecently by Ragueneau et al. (2000). The ACC isamong the most productive, highest-export sys-tems in the ocean with respect to biogenic silica.But for POC, the main form in which biologicalprocesses transport carbon to the deep ocean,export in the ACC is only average and primaryproductivity lower even than that in the mid-oceangyres.
3.6. Potential causes and implications of Si-
enriched, C-depleted primary production and export
The reasons for the observed low rates of POCproduction with high accompanying rates ofBSiO2 production and export in the SouthernOcean are not yet apparent. One clear possibility,however, is the effect of low [Fe] on the elementalcomposition of diatoms, coupled with the abun-dant supply of Si(OH)4 to surface waters viaupwelling. Studies in several systems, including theSouthern Ocean, have shown that Fe deficiencyincreases the Si/N and Si/C uptake ratios ofdiatoms by a factor of 2–3 (Hutchins and Bruland,1998; Takeda, 1998). Fe limitation has beenhypothesized to be the main cause of the HNLCcharacter of the Southern Ocean (Martin, 1990),and has now been demonstrated experimentally inseveral other sectors of the ACC (Van Leeuweet al., 1997; Boyd et al., 2000). Mixed-layer [Fe]
D.M. Nelson et al. / Deep-Sea Research II 49 (2002) 1645–1674 1669

was consistently o0.3 nM throughout the AE-SOPS study area (Measures and Vink, 2001), andexperiments performed during AESOPS indicatethat Si/N uptake ratios were increased by as muchas a factor of six under the resulting Fe limitation(Franck et al., 2000). During AESOPS a diatombloom developed, which was intense enough todeplete surface [Si(OH)4] from 35–50 mM too2 mM throughout the entire north–south extentof the southern ACC leading Brzezinski et al.(2001) to conclude that Fe has little effect on theannual yield of siliceous biomass in this regioneven if Fe limitation slows the rate at which silicicacid is depleted. Primary production, N and Pdrawdown and new production in this same bloomwere modest (Sambrotto and Mace, 2000, Dicksonand Orchardo, 2001; Morrison et al., 2001), andFe deficiency caused Si to be taken up in highproportions to both C and N (Franck et al., 2000).Thus several data sets obtained during AESOPSare consistent with the hypothesis that theobserved Si-enriched, C-depleted character ofphytoplankton production and particle export inthe ACC is a consequence of low Fe availability.
One implication of the above scenario is thatlow [Fe] limits the annual production and exportof organic matter in the Southern Ocean whilehaving little or no effect on the annual productionor export of biogenic silica. If so, then selective Fecontrol of the annual production of organicmatter, with no accompanying control of annualBSiO2 production, must be considered in anyattempt to reconstruct Southern Ocean paleopro-ductivity from the opal sediment record. Datarecords from the Vostok ice core in Antarcticashow that each of the last four glacial epochs wascharacterized by low atmospheric CO2 (Petit et al.,1999), implying that the biological pumping ofCO2 from the atmosphere to the ocean may havebeen more efficient during glacial times. It also hasbeen argued, based on Vostok ice core data, thatFe was much more readily available in SouthernOcean surface waters during the last glacialmaximum (Martin, 1990). The potential cause-and-effect relationship is obvious: Release from Felimitation during glacial times would have per-mitted diatoms to grow with significantly higherN/Si and C/Si ratios. Annual production and
export of BSiO2 would not have been significantlyhigher than they are today, as the available Si insurface water is almost completely used underpresent conditions (Brzezinski et al., 2001; Sigmonet al., 2002). In contrast, POC production andexport would have been at least twice as high,perhaps as much as six times as high, as they are atpresent. If this reasoning is correct, then POCproduction and export during glacial times couldhave been 2–6 times their present values withoutincreasing either the accumulation rate or the opalcontent of the sediments being generated.
There is little evidence that opal accumulationrates south of the APF were higher during glacialtimes than they are at present. Some data in factsuggest that those rates were lower during the lastglacial maximum (Mortlock et al., 1991; Kumaret al., 1995; Anderson et al. 2002) and that residualsilicic acid concentrations in surface waters werehigher (De La Rocha et al., 1998). There is,however, a growing body of evidence that the ratioof organic carbon burial to opal burial south ofthe APF was significantly higher during glacialtimes. Anderson et al. (2002) have presentedsediment core data from the Atlantic sector ofthe ACC indicating that this ratio was approxi-mately three times higher during each of the pasttwo glacial periods than during the ensuinginterglacials. If those changes reflect changes inthe ratio of POC export to BSiO2 export fromsurface waters, then there was approximately threetimes as much POC export per unit BSiO2 exportduring each of the last two glacial maxima as thereis at present. That difference exactly matches thechange in diatom elemental composition that isknown to occur when the cells are released fromFe deficiency.
It has recently been suggested that the SouthernOcean was a much stronger sink for atmosphericCO2 during the last glacial maximum than it is atpresent, with total POC export 2.9–3.6 Pg C yr�1
greater than it is now (Moore et al., 2000).According to those calculations about half of thehypothesized increase in POC export occurred insubantarctic waters north of 551S, implyingincreased export of B1.5–1.8 Pg C yr�1 withinthe ACC proper. The mean POC export weestimate in the ACC south of 551S at 1701W is
D.M. Nelson et al. / Deep-Sea Research II 49 (2002) 1645–16741670

2.5 mol C m�2 yr�1 (Table 3). Extrapolating thatexport to the area of the ACC (3.3� 107 km2;Tr!eguer and Jacques, 1992) yields an estimatedpresent export of 8.3� 1013 mol C yr�1 (B1.0 PgC yr�1) in the region. Thus if POC export in theACC was 1.5–1.8 Pg C yr�1 higher during the lastglacial maximum as hypothesized by Moore et al.,it would have been approximately 2.5–2.8 PgC yr�1, or 2.5–2.8 times its present value. As wecalculated above, POC export could have beenincreased by almost exactly that amount, with nocorresponding increase in opal export, if diatomswere permitted to grow with the normal elementalcomposition characteristic of Fe-replete condi-tions.
Acknowledgements
We thank the crews of the Nathaniel B. Palmer
and Roger Revelle for excellent support during theseagoing phase of this study. Many people assistedus either at sea or during the later analysis ofsamples and data, including John Andrews, JulieArrington, Larry Ball, Cal Eck, Alan Fleer,Martin Fleisher, Valerie Franck, Zev Frankel, BillGolden, Joanne Goudreau, Dave Hirschberg,Janice Jones, Bonnie Mace, Steve Manganini,Chris Moser, Joe Orchardo and Cara Sucher. Weparticularly thank Michael Bacon, Michael Bend-er, J. Kirk Cochran, Werner Deuser, Jack Dy-mond and Chris Measures for providing access tounpublished data, and for advice on the generalissues dealt with in this paper. Gerhard Fischerprovided comments and insights on an earlierversion of this paper, which were particularlyhelpful. This work was sponsored by the USNational Science Foundation through grantsOPP-9530677, OCE-9911312, OPP-9614028 andOCE-9530688 to Oregon State University, OPP-9531982 to the University of California,OPP-9531981 to Duke University, OPP-9530379,OPP-9530398 OCE-9530981, OCE-9819151 andOPP-9530611 to Columbia University, OPP-9530746 to the University of Rhode Island andOPP-9530861, OPP-9530300 and OCE-9530719 tothe Woods Hole Oceanographic Institution. Thisis US JGOFS contribution #670.
References
Anderson, R.F., Chase, Z., Fleisher, M.Q., Sachs, J., 2002. The
southern ocean’s biological pump during the last glacial
maximum. Deep-Sea Research Part II 49, 1909–1938.
Antoine, D., Andr!e, J.-M., Morel, A., 1996. Oceanic primary
production 2. Estimation at global scale from satellite
(coastal zone color scanner) chlorophyll. Global Biogeo-
chemical Cycles 10, 57–69.
Arrigo, K.R., Worthen, D., Schnell, A., Lizotte, M.P., 1998.
Primary production in Southern Ocean waters. Journal of
Geophysical Research 103, 15587–15600.
Banse, K., 1996. Low seasonality of low concentrations of
surface chlorophyll in the subantarctic water ring: under-
water irradiance, iron or grazing? Progress in Oceanography
37, 241–291.
Barber, R.T., Sanderson, M.P., Lindley, S.T, Chai, F., Newton,
J., Trees, C.C., Foley, D.G., Chavez, F.P., 1996. Primary
productivity and its regulation in the equatorial Pacific
during and following the 1991–92 El Ni *no. Deep-Sea
Research Part II 43, 933–969.
Barth, J.A., Cowles, T.J., Pierce, S.D., 2001. Mesoscale frontal
and bio-optical structure of the antarctic polar front near
1701W during spring. Journal of Geophysical Research 106,
13879–13902.
Bathmann, U.V., Scharek, R., Klaas, C., Dubischar, C.D.,
Smetacek, V., 1997. Spring development of phytoplankton
biomass and composition in major water masses of the
Atlantic sector of the Southern Ocean. Deep-Sea Research
Part II 44, 51–68.
Behrenfeld, M.J., Falkowski, P.G., 1997. Photosynthetic rates
derived from satellite-based chlorophyll concentration.
Limnology and Oceanography 42, 1–20.
Bender, M., Grande, K., Johnson, K., Marra, J., Williams,
P.J.leB., Sieburth, J., Pilson, M., Langdon, C., Hitchcock,
G., Heinemann, C., 1987. A comparison of four methods
for the determination of planktonic community metabolism.
Limnology and Oceanography 32, 1085–1098.
Bender, M., Orchardo, J., Dickson, M.-L., Barber, R., Lindley,
S., 1999. In vitro O2 fluxes compared with 14C production
and other rate terms during the JGOFS Equatorial Pacific
experiment. Deep-Sea Research Part II 46, 637–654.
Boyd, P.W., Watson, A.J., Law, C.S., Abraham, E.R., Trull,
T., Murdoch, R., Bakker, D.C.E., Bowie, A.R., Buesseler,
K.O., Chang, H., Charette, M., Croot, P., Downing, K.,
Frew, R., Gall, M., Hadfield, M., Hall, J., Harvey, M.,
Jameson, G., LaRoche, J., Liddicoat, M., Ling, R.,
Maldonado, M.T., McKay, M.M., Nodder, S., Pickmore,
S., Pridmore, R., Rintoul, S., Safi, K., Sutton, P., Strzepek,
R., Tanneberger, K., Turner, S., Waite, A., Zeldis, J., 2000.
A mesoscale phytoplankton bloom in the polar Southern
Ocean stimulated by iron fertilization. Nature 407, 695–702.
Broecker, W.S., Peng, T.-H., 1982. Tracers in the Sea. Eldigio
Press, Palisades, New York, 690pp.
Brown, S.G., Lockyer, C.H., 1984. Whales. In: Laws, R.M.
(Ed.), Antarctic Ecology. Academic Press, London, pp.
717–781.
D.M. Nelson et al. / Deep-Sea Research II 49 (2002) 1645–1674 1671

Brzezinski, M.A., 1985. The Si:C:N ratio of marine diatoms
interspecific variability and the effect of some environmental
variables. Journal of Phycology 21, 347–357.
Brzezinski, M.A., Nelson, D.M., Franck, V.M., Sigmon, D.E.,
2001. Silicon dynamics within an intense open-ocean diatom
bloom in the pacific sector of the southern ocean. Deep-Sea
Research Part II 48, 3997–4018.
Buesseler, K.O., 1998. The decoupling of production and
particulate export in the surface ocean. Global Biogeo-
chemical Cycles 12 (2), 297–310.
Buesseler, K.O., Bacon, M.P., Cochran, J.K., Livingston, H.D.,
1992. Carbon and nitrogen export during the JGOFS
north Atlantic bloom experiment estimated from 234Th:238U disequilibria. Deep-Sea Research Part I 39 (7/8),
1115–1137.
Buesseler, K.O., Ball, L., Andrews, J., Benitez-Nelson, C.,
Belastock, R., Chai, F., Chao, Y., 1998. Upper ocean export
of particulate organic carbon in the Arabian Sea derived
from thorium-234. Deep-Sea Research Part II 45 (10–11),
2461–2487.
Buesseler, K.O., Steinberg, D.K., Michaels, A.F., Johnson,
R.J., Andrews, J.A., Valdes, J.R., Price, J.F., 2000. A
comparison of the quantity and composition of material
caught in neutrally buoyant versus surface-tethered sedi-
ment traps. Deep-Sea Research Part I 47, 277–294.
Buesseler, K.O., Ball, L., Andrews, J., Cochran, J.K., Hirsch-
berg, D.J., Bacon, M.P., Fleer, A., Brzezinski, M., 2001.
Upper ocean export of particulate organic carbon and
biogenic silica in the southern ocean along 1701W. Deep-Sea
Research Part II 48, 4247–4273.
Chase, Z., 2001. Trace elements as regulators (Fe) and recorders
(U, Pa, Th, Be) of biological productivity in the ocean.
Ph.D. Thesis, Columbia University.
Croxall, J.P., Prince, P.A., 1979. Antarctic seabird and seal
monitoring studies. Polar Record 19, 573–595.
De La Rocha, C.L., Brzezinski, M.A., DeNiro, M.J., Shemesh,
A., 1998. Silicon-isotope composition of diatoms as an
indicator of past oceanic change. Nature 395, 680–683.
DeMaster, D.J., 1981. The supply and accumulation of silica in
the marine environment. Geochimicha et Cosmochimica
Acta 45, 1715–1732.
DeMaster, D.J., 2002. Continental margin biogenic silica
accumulation: coupling of the marine cycles of organic
matter and biogenic silica. Deep-Sea Research Part II,
submitted.
DeMaster, D.J., Nelson, T.M., Harden, S.L., Nittrouer, C.A.,
1991. The cycling and accumulation of biogenic silica and
organic carbon in antarctis deep-sea and continental margin
environments. Marine Chemistry 35, 489–502.
Dickson, M.-L., Orchardo, J., 2001. Oxygen production,
respiration in the antarctic polar front region during austral
spring and summer. Deep-Sea Research Part II 48,
4275–4297.
El-Sayed, S.Z., 1978. Primary productivity and estimates of
potential yields of the Southern Ocean. In: McWhinnie,
M.A. (Ed.), Polar Research. Westview Press, New York, pp.
141–160.
El-Sayed, S.-Z., Turner, J.T., 1975. Productivity of the
Antarctic and tropical/subtropical regions: a comparative
study. In: Dunbar, M. (Ed.), Polar Oceans. Arctic Institute
of North America, Montreal, pp. 463–503.
Eppley, R.W., Peterson, B.J., 1979. Particulate organic matter
flux and planktonic new production in the deep ocean.
Nature 282, 677–680.
Franck, V.M., Brzezinski, M.A., Coale, K.H., Nelson, D.M.,
2000. Iron and silicic acid availability regulate Si uptake in
the Pacific sector of the Southern Ocean. Deep-Sea
Research Part II 47 (15–16), 3315–3338.
Francois, R., Bacon, M., Suman, D.O., 1990. Thorium-230
profiling in deep-sea sediments: high-resolution records of
flux and dissolution of carbonate in the equatorial Atlantic
during the last 24,000 years. Paleoceanography 5 (5),
761–787.
Goodell, H.G., Houtz, R., Ewing, M., Hayes, D., Naini, B.,
Echols, R.J., Kennett, J.R., Donahue, J.G., 1973. Marine
Sediments of the Southern Oceans. Antarctic Map Folio
Series, Folio 17, American Geographic Society.
Gordon, A.L., Molinelli, .E.J., 1986. Thermohaline and
chemical distributions and the Atlas data set. In: Gordon,
A.L. (Ed.), Southern Ocean Atlas. Columbia University
Press, New York, pp. 3–233.
Harrison, W.G., Harris, L.R., Irwin, B.D., 1996. The kinetics of
nitrogen utilization in the oceanic mixed layer: nitrate and
ammonium interactions at nanomolar concentrations.
Limnology and Oceanography 41, 16–32.
Henderson, G.M., Heinze, C., Anderson, R.F., Winguth, M.E.,
1999. Global distribution of the 230Th flux to ocean
sediments constrained by GCM modelling. Deep-Sea
Research Part I 46, 1861–1893.
Holm-Hansen, O., El-Sayed, S.-Z., Franceschini, G.S., Cuhel,
R.L., 1977. Primary production and factors controlling
phytoplankton growth in the Southern Ocean. In: Llano, G.
(Ed.), Adaptations within Antarctic Ecosystems. Gulf
Publishing Co., Houston, pp. 11–50.
Honjo, S., 1997. The rain of ocean particles and earth’s carbon
cycle. Oceanus 40, 4–7.
Honjo, S., Dymond, J., Collier, R., Manganini, S., 1995. Export
production of particles to the interior of Equatorial Pacific
Ocean during 1992 Eq. Pac. experiment. Deep-Sea Research
Part II 42 (2/3), 831–870.
Honjo, S., Dymond, J., Prell, W., Ittekot, V., 1999. Monsoon-
controlled export fluxes to the interior of the Arabian Sea:
US JGOFS 1994–1995 experiment. Deep-Sea Research Part
II 46 (8–9), 1859–1902.
Honjo, S., Fran-cois, R., Manganini, S., Dymond, J., Collier,
R., 2000. Particle fluxes to the interior of the Southern
Ocean in the Western Pacific sector along 1701W. Deep-Sea
Research Part II 47 (15–16), 3521–3548.
Hutchins, D.A., Bruland, K.W., 1998. Iron-limited diatom
growth and Si:N uptake ratios in a coastal upwelling
regime. Nature 393, 561–564.
Jenkins, W.J., Goldman, J.C., 1985. Seasonal oxygen cycling
and primary production in the Sargasso Sea. Journal of
Marine Research 43, 465–491.
D.M. Nelson et al. / Deep-Sea Research II 49 (2002) 1645–16741672

Jennings Jr., J.C., Gordon, L.I., Nelson, D.M., 1984. Nutrient
depletion indicates high primary productivity in the Weddell
Sea. Nature 308, 51–54.
Knox, F., McElroy, M., 1984. Changes in atmospheric CO2:
influence of marine biota at high latitudes. Journal of
Geophysical Research 89, 4629–4637.
Kumar, N., Anderson, R.F., Mortlock, R.A., Froelich, P.N.,
Kubik, P.W., Dittrich-Hannen, B., Suter, M., 1995. Iron
fertilization of glacial-age Southern Ocean productivity.
Nature 378, 675–680.
Laubischer, R.K., Perissinotto, R., McQuaid, C.D., 1993.
Phytoplankton production and biomass at frontal zones in
the Atlantic sector of the Southern Ocean. Polar Biology 13,
471–481.
Laws, E.A., 1991. Photosynthetic quotients, new production,
net community production in the open ocean. Deep-Sea
Research Part I 38, 143–167.
Laws, E.A., Landry, M.R., Barber, R.T., Campbell, L.,
Dickson, M.-L., Marra, J., 2000. Carbon cycling in primary
production bottle incubations: inferences from grazing
experiments and photosynthetic studies using 14C and 18O
in the Arabian Sea. Deep-Sea Research Part II 47,
1339–1352.
Lee, C., Murray, D.W., Barber, R.T., Buesseler, K.O.,
Dymond, J., Hedges, J.I., Honjo, S., Manganini, S.J.,
Marra, J., Moser, C., Peterson, M.L., Prell, W.L., Wake-
ham, S.G., 1998. Particulate organic carbon fluxes: compi-
lation of results from the 1995 US JGOFS Arabian Sea
process study. Deep-Sea Research Part II 45, 2489–2501.
Letelier, R.M., Dore, J.E., Winn, D.D., Karl, D.M., 1996.
Seasonal and interannual variations in photosynthetic
carbon assimilation at Station ALOHA. Deep-Sea Research
Part II 43, 467–490.
Lieth, H., 1975. Historical survey of primary productivity
research. In: Lieth, H., Whittaker, R.H. (Eds.), Primary
Productivity of the Biosphere. Springer, New York,
pp. 7–16.
Longhurst, A.R., Harrison, W.G., 1989. The biological
pump: profiles of plankton production and consump-
tion in the upper ocean. Progress in Oceanography 22,
47–123.
Louanchi, F., Najjar, R.G., 2000. A global monthly climatol-
ogy of phosphate, nitrate and silicate in the upper ocean:
spring–summer export production and shallow reminerali-
zation. Global Biogeochemical Cycles 14, 957–977.
Martin, J.H., 1990. Glacial–interglacial CO2 change: the iron
hypothesis. Paleoceanography 5, 1–13.
Martin, J.H., Knauer, G.A., Karl, D.M., Broenkow, W.W.,
1987. VERTEX: carbon cycling in the northeast pacific.
Deep-Sea Research Part 1 34, 267–285.
McCarthy, J.J., Garside, C., Nevins, J.L., Barber, R.T., 1996.
New production along 1401W in the equatorial Pacific
during and following the 1992 El Ni *no event. Deep-Sea
Research Part II 43, 1065–1093.
Measures, C.I, Vink, S., 2001. Dissolved fe in the upper waters
of the pacific sector of the southern ocean. Deep-Sea
Research Part II 48, 3913–3941.
Michaels, A.F., Bates, N.R., Buesseler, K.O., Carlson, C.A.,
Knap, A.H., 1994. Carbon-cycle imbalances in the Sargasso
Sea. Nature 372, 537–540.
Moore, J.K., Abbott, M.R., 2000. Phytoplankton
chlorophyll distributions and primary production in the
Southern Ocean. Journal of Geophysical Research 105,
28709–28722.
Moore, J.K., Abbott, M.A., Richman, J.G., 1999. Location and
dynamics of the Antarctic Polar Front from satellite sea
surface temperature data. Journal of Geophysical Research
104, 3059–3073.
Moore, J.K., Abbott, M.A., Richman, J.G., Nelson, D.M.,
2000. The Southern Ocean at the last glacial maximum: a
strong sink for atmospheric CO2. Global Biogeochemical
Cycles 14 (1), 455–475.
Morrison, J.M., Gaurin, S., Codispoti, L.A., Takahashi, T.,
Millero, F.J., Gardner, W.D., Richardson, M.J., 2001.
Seasonal evolution of the hydrographic properties in the
Antarctic Circumpolar Current at 1701W during 1997–1998.
Deep-Sea Research Part II 48, 3943–3972.
Mortlock, R.A., Charles, C.D., Froelich, P.N., Zibello, M.A.,
Saltzman, J., Hays, J.D., Burckle, L.H., 1991. Evidence for
lower productivity in the Antarctic Ocean during the last
glaciation. Nature 351, 220–223.
Nelson, D.M., 1992. Biogeochemical cycles of organic and
siliceous matter in the Southern Ocean. In: Gallardo, V.A.,
Ferreti, O., Moyano, H.I. (Eds.), Oceanografia in Antartide.
ENEA-Progetto Antartide, Italia/Centro EULA, Universi-
dad de Concepci !on, Chile, pp. 9–21.
Nelson, D.M., Brzezinski, M.A., 1997. Diatom growth and
productivity in an oligotrophic midocean gyre: a 3-yr record
from the Sargasso Sea near Bermuda. Limnology and
Oceanography 42, 473–486.
Nelson, D.M., Tr!eguer, P., Brzezinski, M.A., Leynaert, A.,
Qu!eguiner, B., 1995. Production and dissolution of biogenic
silica in the ocean: revised global estimates, comparison
with regional data and relationship to biogenic sedimenta-
tion. Global Biogeochemical Cycles 9, 359–372.
Nelson, D.M., DeMaster, D.J., Dunbar, R.B., Smith Jr., W.O.,
1996. Cycling of organic carbon and biogenic silica in the
Southern Ocean: estimates of water-column and sedimen-
tary fluxes on the Ross Sea continental shelf. Journal of
Geophysical Research 101, 18519–18532.
Nelson, D.M., Brzezinski, M.A., Sigmon, D.E., Franck, V.M.,
2001. A seasonal progression of si limitation in the pacific
sector of the southern ocean. Deep-Sea Research Part II 48,
3973–3995.
Orsi, A.H., Whitworth, T., Worth, N., 1995. On the meridional
extent and fronts of the Antarctic Circumpolar Current.
Deep Sea Research Part I 42, 641–673.
Petit, J.R., Jouzel, J., Raynaud, R., Barkov, N.I., Barnola, J.-
M., Basile, I., Bender, M., Chapellaz, J., Davis, M.,
Delaygue, G., Delmotte, M., Kotlyakov, V.M., Legrand,
M., Lipenkov, V.Y., Lorius, C., P!epin, L., Ritz, C.,
Saltzman, E., Stievenard, M., 1999. Climate and atmo-
spheric history of the past 420,000 years from the Vostok ice
core, Antarctica. Nature 399, 429–436.
D.M. Nelson et al. / Deep-Sea Research II 49 (2002) 1645–1674 1673

Pondaven, P., Ragueneau, O., Tr!eguer, P., Hauvespre, A.,
Dezileau, L., Reyss, J.L., 2000. Resolving the ‘‘opal
paradox’’ in the Southern Ocean. Nature 405, 168–172.
Ragueneau, O., Tr!eguer, P., Leynaert, A., Anderson, R.F.,
Brzezinski, M.A., DeMaster, D.J., Dugdale, R.C., Dymond,
J., Fishcher, G., Fran-cois, R., Heinze, C., Maier-Reimer, E.,
Martin-J!ez!equel, V., Nelson, D.M., Qu!eguiner, B., 2000. A
review of the Si cycle in the modern ocean: recent progress
and missing gaps in the application biogenic opal as a
paleoproductivity proxy. Global and Planetary Change 26
(4), 315–366.
Redfield, A.C., Ketchum, B.H., Richards, F.A., 1963. The
influence of organisms on the composition of seawater. In:
Hill, M.N. (Ed.), The Sea., Vol. 2. Wiley, Interscience, New
York, pp. 26–77.
Rutgers van der Loeff, M.M., Buesseler, K.O., Bathmann, U.,
Hense, I., Andrews, J., 2002. Steady summer production
and a sudden spring bloom make a comparable contribution
to carbon and opal export near the Antarctic Polar Front,
SE Atlantic. Deep-Sea Research Part II, in press.
Sambrotto, R.N., 2001. Nitrogen production in the northern
Arabian Sea during the spring intermonsoon and southwest
Monsoon seasons. Deep-Sea Research Part II 48 (6–7),
1173–1198.
Sambrotto, R.N., Mace, B.J., 2000. Coupling of biological and
physical regimes across the Antarctic Polar Front as
reflected by nitrogen production and recycling. Deep-Sea
Research Part II 47 (15–16), 3339–3368.
Sarmiento, J.L., Hughes, T.M.C., Stouffer, R.J., Manabe, S.,
1998. Simulated response of the ocean carbon cycle to
anthropogenic climate warming. Nature 393, 245–252.
Sayles, F.L., Martin, W.R., Chase, Z., Anderson, R.F., 2001.
Benthic remineralization and burial of biogenic SiO2,
CaCO3 organic carbon and detrital material in the southern
ocean along a transect at. Deep-Sea Research Part II 48,
4323–4383.
Schlitzer, R., 2000. Applying the adjoint method for biogeo-
chemical modeling: export of particulate organic matter in
the World Ocean. Geophysical Monographs 114, 107–124.
Scholten, J.C., Fietzke, J., Vogler, S., Rutgers van der Loeff,
M., Mangini, A., Koeve, W., Waniek, J., Stoffers, P., Antia,
A., Kuss, J., 2001. Trapping efficiencies of sediment traps
from the deep eastern North Atlantic: the 230Th calibration.
Deep-Sea Research Part II 48 (10), 2383–2408.
Sigmon, D.E., Nelson, D.M., Brzezinski, M.A., 2002. The si
cycle in the pacific sector of the southern ocean: seasonal
diatom production in the surface layer and export to the
deep sea. Deep-Sea Research Part II 49, 1747–1763.
Smith, W.O., Harrison, W.G., 1991. New production in polar
regions: the role of environmental controls. Deep-Sea
Research Part I 38, 1463–1479.
Smith, W.O., Keene, N.K., Comiso, J.C., 1988. Interannual
variability in estimated primary productivity of the Antarc-
tic marginal ice zone. In: Sahrhage, D. (Ed.), Antarctic
Ocean and Resources Variability. Springer, Berlin, pp.
131–139.
Smith Jr., W.O., Anderson, R.F., Moore, J.K., Codispoti, L.A.,
Morrison, J.M., 2000. The US Southern Ocean Joint Global
Ocean Flux Study: an introduction to AESOPS. Deep-Sea
Research Part II 47 (15–16), 3073–3093.
Suman, D.O., Bacon, M.P., 1989. Variations in Holocene
sedimentation in the North-American basin determined
from Th-230 measurements. Deep-Sea Research Part I 36
(6), 869–878.
Takeda, S., 1998. Influence of iron availability on nutrient
consumption ratio of diatoms in oceanic waters. Nature
393, 774–777.
Tr!eguer, P., Jacques, G., 1992. Dynamics of nutrients and
phytoplankton, and fluxes of carbon, nitrogen and silicon in
the Antarctic Ocean. Polar Biology 12, 149–162.
Tr!eguer, P., Nelson, D.M., Van Bennekom, A.J., DeMaster,
D.J., Leynaert, A., Qu!eguiner, B., 1995. The silica balance
in the world ocean: a re-estimate. Science 268, 375–379.
Van Bennekom, A.J., Berger, G.W., van der Gast, S.J., Devries,
R.T., 1988. Primary productivity and the silica cycle in the
Southern Ocean (Atlantic sector). Paleogeography, Paleo-
climatology and Paleoecology 67, 19–30.
Van Leeuwe, M.A., Scharek, R., De Baar, H.J.W., De Jong,
J.T.M., Goeyens, L., 1997. Iron enrichment experiments in
the Southern Ocean: physiological responses of plankton
communities. Deep-Sea Research Part II 44, 189–208.
Volk, T., Hoffert, M.I., 1985. Ocean carbon pumps: analysis of
relative strengths and efficiencies in ocean-driven atmo-
spheric CO2 changes. In: Sundquist, E.T., Broecker, W.S.
(Eds.), The Carbon Cycle and Atmospheric CO2: Natural
Variations Archean to Present. American Geophysical
Union, Washington, pp. 99–110.
Yu, E.-F., Francois, R., Bacon, M.P., Honjo, S., Fleer, A.P.,
Manganini, S.J., Rutgers van der Loeff, M.M., Ittekot, V.,
2001. Trapping efficiency of bottom-tethered sediment traps
estimated from the intercepted fluxes of 230Th and 231Pa.
Deep-Sea Research Part I 48, 865–889.
D.M. Nelson et al. / Deep-Sea Research II 49 (2002) 1645–16741674