verona italy – – october27, 2006 · verona italy – – october27, 2006 steven m. petak, md,...
TRANSCRIPT

Verona Italy Verona Italy –– October27, 2006October27, 2006Steven M. Petak, MD, JD, FACE, FCLM
Texas Institute for Reproductive Medicine And Endocrinology, HouTexas Institute for Reproductive Medicine And Endocrinology, Houston, Texasston, TexasPast President, International Society of Clinical Densitometry (Past President, International Society of Clinical Densitometry (ISCD)ISCD)President, American Association of Clinical Endocrinologists (AAPresident, American Association of Clinical Endocrinologists (AACE)CE)
Endocrine and Bone Densitometry Consultant Endocrine and Bone Densitometry Consultant –– NASA: Johnson Space CenterNASA: Johnson Space Center
Post-Menopausal Osteoporosis:
“WHO” Do We Treat Now

DisclaimerDisclaimer• Speaker for
• GSK/Roche• Proctor & Gamble/Aventis• Merck• Eli Lilly• Wyeth
• Consultant• Eli Lilly• GSK/Roche• Novartis

RoadmapRoadmap
1. The Stone Age2. The Industrial Revolution3. The Information Age

The Stone AgeThe Stone Age
Kyphosispost-menopausal
Diagnosis based on obvious clinical findings.Oral reports (before writing invented).
Mammoth injury: vertebral fractures

Cave painting found near Denver. Circa 60,000 BC
ISCD: International Society of Cave Dwellers
Osteoporosis testing: “Take rock. Hit bone. It break!”*
*Miller PD, Bilezikian
J et al. J Paleolithic Medicine 60,000 BC 1(1):1-2

Modern Stone Age Equivalent: Case 1Modern Stone Age Equivalent: Case 167 year old Caucasian woman with a history of a 2 recent
minimal trauma grade 2 painful vertebral fractures at T10 and T11 by VFA.• DXA results show a L1-L4 T-score of -1.9 with little
variability between vertebral bodies and the lowest hip site at the left femoral neck at a T-score of -1.7. The technical quality of the study was good.
What is her diagnosis?• A. Low bone density (osteopenia)• B. Osteoporosis• C. Severe Osteoporosis • D. None of the above

Case 1Case 167 year old Caucasian woman with a history of a 2 recent
minimal trauma grade 2 painful vertebral fractures at T10 and T11 by VFA.• DXA results show a L1-L4 T-score of -1.9 with little
variability between vertebral bodies and the lowest hip site at the left femoral neck at a T-score of -1.7. The technical quality of the study was good.
What is her diagnosis?• A. Low bone density (osteopenia)• B. Osteoporosis• C. Severe Osteoporosis • D. None of the above

Case 1: Lessons to be LearnedCase 1: Lessons to be Learned……
We are still in the stone age We are still in the stone age as far as recognizing and as far as recognizing and
treating the treating the ““low hanging fruitlow hanging fruit””
------------------------------Fracture Patients!Fracture Patients!
For more information: see ISCD VFA Course: www.iscd.org

RoadmapRoadmap
1. The Stone Age2. The Industrial Revolution3. The Information Age

Prototype Densitometer*Prototype Densitometer*
*not really…

Case 2: How Does DXA Work? Baseline
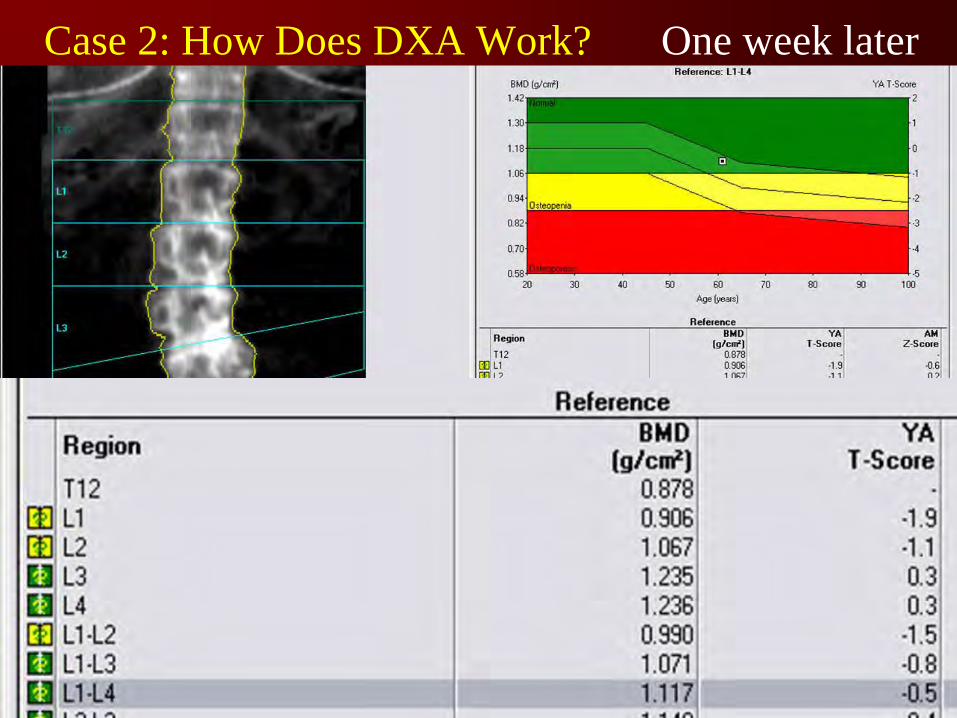
Case 2: How Does DXA Work? One week later

Case 3Case 3• 42 year old premenopausal woman with
radiographic osteopenia • Risk factors: family history, low body
weight
• Referred for significant decrease in bone density
• Two studies – 8 months apart. Studies done on same machine: Hologic Delphi

Case 3 Case 3 –– DXA of 12/6/2005DXA of 12/6/2005
Spine T-score of -3.0

Case 3 Case 3 -- DXA of 4/29/2005DXA of 4/29/2005
Spine T-score of -2.2

Case 3 Case 3 -- ComparisonComparison

Case 3 Case 3 -- ComparisonComparison

Case 3 Case 3 -- Lessons LearnedLessons Learned
1.
Compare BMD values NOT T-scores
2.
Manufacturers differ on comparing T-scores based on ethnicity. Hologic: ethnic T-scores and Z-scores; GE-Healthcare Lunar: ethnic specific Z-scores only.
3.
ISCD recommends using the a standard ethnic reference population for T-scores and ethnic databases for Z-scores…
for now

Case 4Case 460 year old woman with DXA study
showing a bone density of 0.806 g/cm2 at the L1-L4 spine in 2004 and 0.795 g/cm2 in 2006. The DXA lab did not do a precision study…
Her T-score in 2006 was -3.2.
Is this a significant change?

Case 4Case 460 year old woman with DXA study
showing a bone density of 0.806 g/cm2 at the L1-L4 spine in 2004 and 0.795 g/cm2 in 2006. The DXA lab did not do a precision study…
Her T-score in 2006 was -3.2.
Is this a significant change? NoNoSee: www.iscd.org

Understanding the Guidelines for Understanding the Guidelines for Fracture PreventionFracture Prevention
• Background• Risk Factor Assessment• Screening

Case 5Case 5• 50 year old African American woman with
menopause 6 months ago with a T-score of -2.5 at the spine and -2.5 at the hip• No other risk factors
• 80 year old Caucasian woman with a T-score of -2.4 at the spine and -2.4 at the hip• Prior spine fragility fracture, positive family
history, smoker, body weight 120 pounds
• Same diagnosis? • Same fracture risk?

WHO Report: 1994
““If all you have is a hammer, then If all you have is a hammer, then everything starts to look like a naileverything starts to look like a nail””

Fracture Prediction by BMDFracture Prediction by BMD
T-Score (SD)–3 –2 –1 0 1
Kanis JA, et al. Osteoporos Int. 2004;15:20-26.
NormalLow bone
massOsteoporosis
-2.5 or less -1.0 to -2.5 -1.0 or greater

Marshall et al, 1996
Site of measurement
Distal radius
Hip
Lumbar spine
Forearmfracture
1.7
1.4
1.5
Hipfracture
1.8
2.6
1.6
Vertebralfracture
1.7
1.8
2.3
Allfractures
1.4
1.6
1.5
Prediction of fracture from BMD

Z-score
Prediction of fracture: Relative Risk
3 2 1 0 -1 -30
Relative
risk
-2
20
15
10
5
2.61.6
Gradient of risk
Kanis JA et al
i.e. femoral neck on hip fracture
i.e. femoral neck on global risk

Some Treatment Guidelines Used Some Treatment Guidelines Used in the United Statesin the United States
NOF +Risk Factors
AACE +Risk Factors
ACOG +Risk Factors
NAMS +Risk Factors
-3.0 -2.5 -2.0 -1.5 -1.0
T-score
Treat Don’t Treat??

ProblemsProblems……

Fracture Rates, Population TFracture Rates, Population T--Score Distribution, Score Distribution, and Number of Fractures in NORAand Number of Fractures in NORA
0
10
20
30
40
50
60
> 1.0 1.0 to 0.5 0.5 to 0.0 0.0 to -0.5 -0.5 to -1.0 -1.0 to -1.5 -1.5 to -2.0 -2.0 to -2.5 -2.5 to -3.0 -3.0 to -3.5 < -3.5
BMD T-Scores
Frac
ture R
ate P
er 10
00 P
erso
n/Yea
rs
0
50
100
150
200
250
300
350
400
450
Numb
er of
Fra
cture
s
Fracture rate
Number of fractures
• BMD distribution
≤
-2.5-1.0 to -2.5> -1.0
Siris. Arch Intern Med. 2004;164(10):1108.

Fracture Probability at Hip by Age and BMDFracture Probability at Hip by Age and BMD
T-Score (SD)–3 –2 –1 0 1
0
10
20
50
60
70
80
Age (y)1 0
- Yea
r Fra
ctur
e P r
o ba b
il ity
at H
i p (%
)
Kanis JA, et al. Osteoporos Int. 2004;15:20-26.
T-score of -2.5
13%
2%

Combined Effect of Bone Density Combined Effect of Bone Density and Prevalent Fracturesand Prevalent Fractures
Risk Ratio for New
Vertebral Fractures
Ross PD et al. Ann Intern Med. 1991;114:919-923.
Prevalent Vertebral Fractures
25.114.9
10.27.4 4.4 1
05
1015202530
Lowest Third Middle Third Highest ThirdNone
One
Bone Density

Effects of Combining BMD and Effects of Combining BMD and Number of Risk FactorsNumber of Risk Factors
35
17.95.6
23.4
10.5
2.710.6
5.8 1.405
101520253035
OsteoporoticOsteopenic
Normal0Te
n Ye
ar R
isk
of H
ip F
ract
ure
Total Hip BMDNo. o
f risk
facto
rs
Taylor BC, et al Journal of the American Geriatrics Society 52: 1479, 2004
35
17.9
0
>21-2

0
2
1
3
4
5
20 25 30 3515 40 45BMI (kg/m2)
RR
(com
pard
with
a B
MI o
f 25)
Any fractureOsteoporotic fractureHip fracture
BMI and Risk of Fracture

RoadmapRoadmap
1. The Stone Age2. The Industrial Revolution3. The Information Age

The “Manhattan”
Project of Osteoporosis
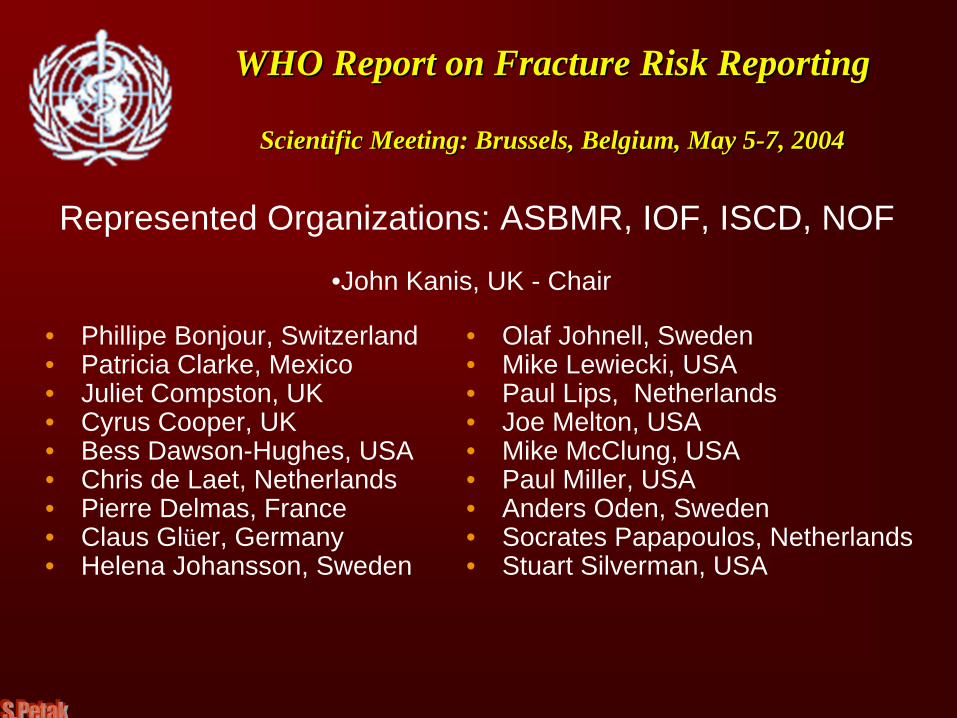
WHO Report on Fracture Risk ReportingWHO Report on Fracture Risk Reporting
Scientific Meeting: Brussels, Belgium, May 5Scientific Meeting: Brussels, Belgium, May 5--7, 20047, 2004
• Phillipe Bonjour, Switzerland • Patricia Clarke, Mexico• Juliet Compston, UK• Cyrus Cooper, UK• Bess Dawson-Hughes, USA• Chris de Laet, Netherlands• Pierre Delmas, France• Claus Glüer, Germany• Helena Johansson, Sweden
• Olaf Johnell, Sweden• Mike Lewiecki, USA• Paul Lips, Netherlands• Joe Melton, USA• Mike McClung, USA• Paul Miller, USA• Anders Oden, Sweden• Socrates Papapoulos, Netherlands• Stuart Silverman, USA
Represented Organizations: ASBMR, IOF, ISCD, NOF
•John Kanis, UK - Chair

Cohorts Studied
CaMoS
Rotterdam
EVOS/EPOS
Rochester
Kuopio
Hiroshima
Sheffield
Gothenburg I Gothenberg
II
DubboEPIDOS OFELY
N = 59,232 Person-years = 249,898 % Female = 74
Any fracture = 5444
Osteoporotic fractures = 3495
Hip fractures = 957
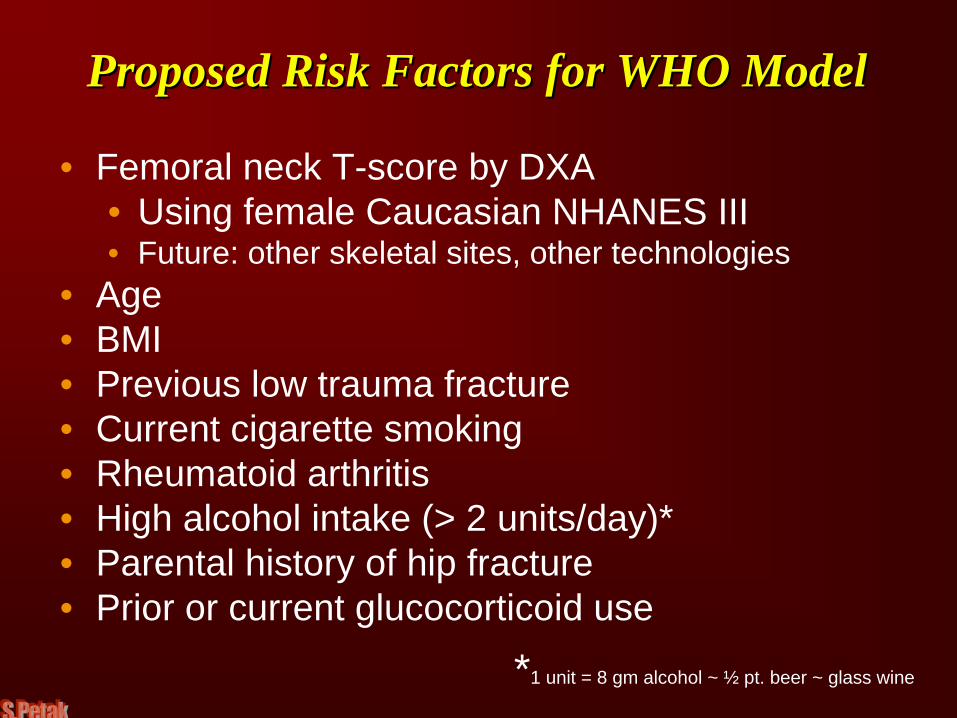
Proposed Risk Factors for WHO ModelProposed Risk Factors for WHO Model
• Femoral neck T-score by DXA • Using female Caucasian NHANES III• Future: other skeletal sites, other technologies
• Age• BMI• Previous low trauma fracture• Current cigarette smoking• Rheumatoid arthritis• High alcohol intake (> 2 units/day)*• Parental history of hip fracture• Prior or current glucocorticoid use
*1 unit = 8 gm alcohol ~ ½ pt. beer ~ glass wine

0
10
20
30
40
−3 −2.5 −2 −1.5 −1 -0.5 0 0.5 1
BMD T-Score
50
60
7080
Age
Ost
eopo
rotic
Fra
ctur
e R
isk
–an
y fr
actu
re(%
per
10
Year
s)
Kanis JA, et al. Kanis JA, et al. OsteoporosOsteoporos Int.Int. 2001;12:9892001;12:989––995.995.McClung MR. McClung MR. Current Current OsteoporosOsteoporos ReportsReports 2005;3:572005;3:57--63.63.
Current Treatment ModelCurrent Treatment Model
Not treated:64.1%
Based on 7893 post-menopausal women with average age of 67
10.7% 25.2%

0
10
20
30
40
−3 −2.5 −2 −1.5 −1 -0.5 0 0.5 1
Femoral Neck T-Score NHANES3 Female
50
60
7080
Age
Ost
eopo
rotic
Fra
ctur
e R
isk
–an
y fr
actu
re(%
per
10
Year
s)
Kanis JA, et al. Kanis JA, et al. OsteoporosOsteoporos Int.Int. 2001;12:9892001;12:989––995.995.McClung MR. McClung MR. Current Current OsteoporosOsteoporos ReportsReports 2005;3:572005;3:57--63.63.
A Possible FutureA Possible Future Treatment ModelTreatment Model
2.9%
7.5%22.3%10.7%
Using a 10 year any fracture Using a 10 year any fracture risk threshold of 12%risk threshold of 12%

Next StepsNext Steps…… Implementation at Country/Region LevelImplementation at Country/Region Level
• Use of disutility calculations to get hip fracture equivalents
• Analysis of economic resources using a 50% fracture reduction from pharmacologic therapy as a basis
• Implementation in USA in progress by NOF and AACE
• Awaiting final WHO materials before new AACE guidelines finalized

AACE Osteoporosis Guidelines Taskforce 2006AACE Osteoporosis Guidelines Taskforce 2006
• Dr. Nelson Watts, Chair• Dr. John Bilezikian• Dr. Pauline Camacho• Dr. Susan Greenspan• Dr. Steven Harris• Dr. Stephen Hodgson• Dr. Michael Kleerekoper• Dr. Marjorie Luckey• Dr. Michael McClung• Dr. Steven Petak

Implications of WHO 2007 (?) ModelImplications of WHO 2007 (?) Model
• ISCD PDC 2005: Diagnostic classification of osteoporosis will not change
• Distinguishes between diagnostic threshold and intervention threshold
• “Osteopenia”
will no longer be relevant
• Fewer younger patients at low risk will be treated and more older patients at higher risk will be treated

LimitationsLimitations
• Limited as to reference site for BMD
• Does not apply to secondary osteoporosis
• Does not determine which interventions will be effective at lowering the fracture risk• Medications• Non-pharmacologic interventions• Nothing?

Thank you Prof. Thank you Prof. CoculescuCoculescu, Prof. , Prof. IonescuIonescu
and the RSE for the kind invitationand the RSE for the kind invitation

Michele Zini
Therapy of osteoporosis: the present
Michele Zini
Servizio di Endocrinologia, Arcispedale “S. Maria Nuova”
–
Reggio Emilia
3rd Joint Meeting AME-AACE -
Verona 27-29 October 2006Friday October 27, 2006
9.00 a.m.- 12.45 a.m.
Pre-congress
symposium: Osteoporosis

Michele Zini
An EBM-guided treatment of osteoporosisChoices and Outcomes of treatment
Chairs: D. Bergman – M.L. BrandiEBM expert: M. ZiniDiscussants: S.M. Petak – A. Piovesan
Clinical Symposium
Michele Zini
The evidence-based treatment of osteoporosis
Michele ZiniServizio di Endocrinologia, Arcispedale “S. Maria Nuova” – Reggio emilia
Roma, November 5-7, 2004

Michele Zini
Roma, November 5-7, 2004
Pharmacological treatment
Michele Zini
calciumvitamin D
estrogen & SERMbisphosphonates
calcitoninfluoride
teriparatidestrontium ranelate
other

Michele Zini
ALENDRONATE – Phase
III study
Liberman
UA et
al., N Engl
J Med
333:1437-43, 1995

Michele Zini
ALENDRONATE – Phase
III study
Liberman
UA et
al., N Engl
J Med
333:1437-43, 1995

Michele Zini
ALENDRONATE -
FOSIT studyPols
HAP et
al., Osteoporos
Int
(1999) 9:461–468

Michele Zini
ALENDRONATEFIT study
Black DM et
al., Lancet
1996; 348: 1535-41
“clinical
fracture”
arm

Michele Zini
ALENDRONATE -
FIT studyCummings
SR et
al., JAMA. 1998;280:2077-2082
“non-clinical
fracture”
arm

ALENDRONATE and NON-VERTEBRAL FRACTURES A meta-analysys from 5 RCTs Karpf DB et al., JAMA.277:1159-1164, 1997
Michele Zini
ALL NON-VERTEBRAL FRACTURES:
Relative risk =0.71 (95% C.I = 0.50-0.99.)
Relative risk reduction =0.29 (95% C.I = 0.02 - 0.49)
Absolute risk reduction=0.03 (95% C.I = 0.001 - 0.06)
NNT = 34 (17-668)

Michele Zini
ALENDRONATE – O.R.A.G. META-ANALYSIS
Cranney
A et
al., Endocr
Rev
23:508–516, 2002

Michele Zini
ALENDRONATE – O.R.A.G. META-ANALYSIS
Cranney
A et
al., Endocr
Rev
23:508–516, 2002

ALENDRONATE – HIP FRACTURES Papapoulos
SE et
al., Osteoporos
Int. 16: 468-74, 2005
Michele Zini

ALENDRONATE in MALE Orwoll
E et al., NEJM 343: 604-610, 2000
Michele Zini

Michele Zini
RISEDRONATE – VERT North America study
Harris ST et
al., JAMA 282: 1344-1352, 1999

Michele Zini
RISEDRONATE – VERT Multinational
study
Reginster J-Y et al., Osteoporos Int 11 :83–91, 2000

Michele Zini
RISEDRONATE – VERT study
(5 yrs
follow-up)
Sorensen
OH et
al., Bone
32: 120-126, 2003
Michele Zini
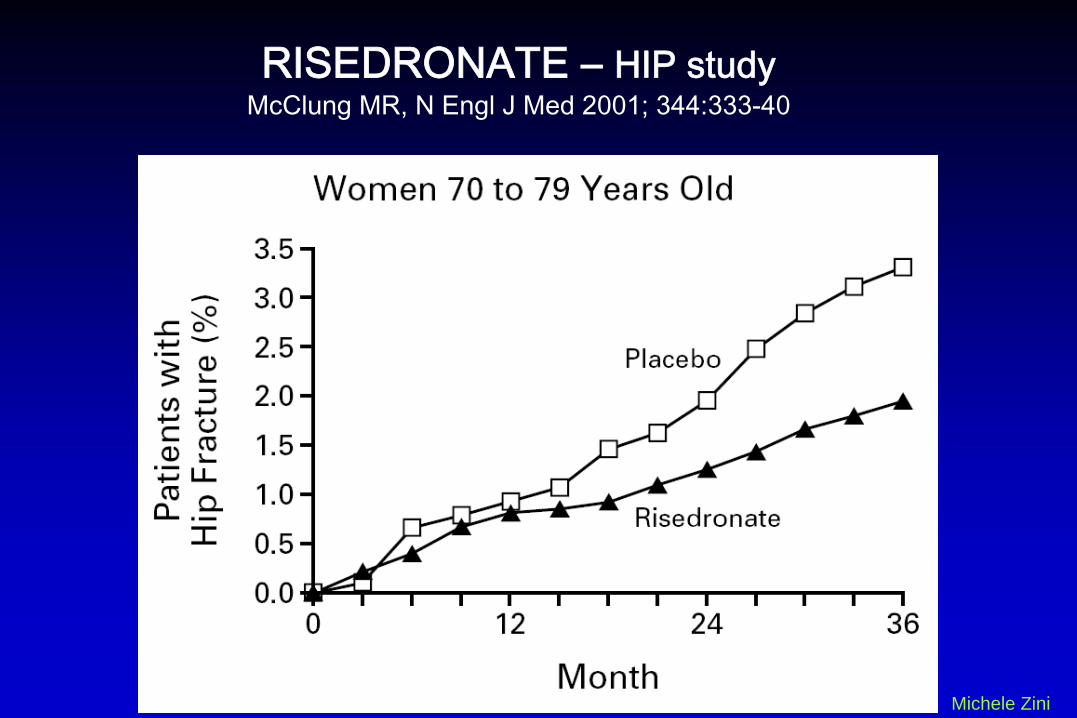
RISEDRONATE – HIP study
McClung
MR, N Engl
J Med
2001; 344:333-40

Michele Zini
RISEDRONATE O.R.A.G.
META-ANALYSIS
Cranney
A et
al.,Endocr
Rev
23: 517–523, 2002

Michele Zini
O.R.A.G. –
Osteoporosis
Research
Advisory
GroupMETA-ANALYSES
Cranney
A et
al., Endocr
Rev
23:570–578, 2002

Michele Zini
STRONTIUM RANELATE – SOTI studyMeunier PJ et al., N Engl J Med 2004;350:459-68
Relative Risk = 0.59 (95% C.I.: 0.48 to 0.73)

Michele Zini
STRONTIUM RANELATE – TROPOS studyReginster JY et al., J Clin Endocrinol Metab 90: 2816–2822, 2005

Michele Zini
STRONTIUM RANELATE – Cochrane meta-analysisO'Donnell S et al. Strontium ranelate for preventing and treating postmenopausal
osteoporosis.Cochrane Database of Systematic Reviews 2006, Issue 3.

Michele Zini
STRONTIUM RANELATE – Cochrane meta-analysisO'Donnell S et al. Strontium ranelate for preventing and treating postmenopausal
osteoporosis.Cochrane Database of Systematic Reviews 2006, Issue 3.

Michele Zini
TERIPARATIDE Neer RM et al., N Engl J Med 344:, 1434-1441, 2001
POPULATION: 1637 postmenopausal women with prior vertebral fractures

Michele Zini
TERIPARATIDE Neer RM et al., N Engl J Med 344:, 1434-1441, 2001

Prevalenza di livelli
inadeguati
di vitamina
D
(<30 ng/ml) nelle donne
in postmenopausa
p=0.015 per test di tendenzaTratto da Holick MF et al. Poster presented at ASBMR, October 1–5, 2004, Seattle, WA, USA.
Prev
alen
za(%
)
0
20
40
60
80
71–80
53.0%(n=558)
57.6%(n=245)
81–9051–60
50.7%(n=229)
61–70
48.0%(n=488)
>90
73.3%(n=15)
Gruppi di età
N=1536

Livelli ematici di vitamina D e risposta all’alendronato
Tratto da; Ishijima M. et al. Abstract SU462 ASBMR 2005
0
2
4
6
8
10
<15 ng/ml 15-20 ng/ml >20 ng/ml
Mod
ifica
zion
e %
DM
O L
omba
re
25 (OH) D sierica
+1,4%
+5,7%*
+8,4%*
*p<0,01

Supplementazione di vitamina D nei vari trial
Studio Dosaggio Vitamina D(UI/die)
VERT 500
MORE 400/600
TROPOS 400/800
MOBILE 400
FIT 250

Michele Zini
IBANDRONATE – BONE study Chesnut
CH III et
al., J Bone
Miner
Res 2004;19:1241–1249

Michele Zini
IBANDRONATE – BONE study Chesnut
CH III et
al., J Bone
Miner
Res 2004;19:1241–1249

Main issues
• antifracture activity
• cardiovascular effects
• breast cancer
Michele Zini
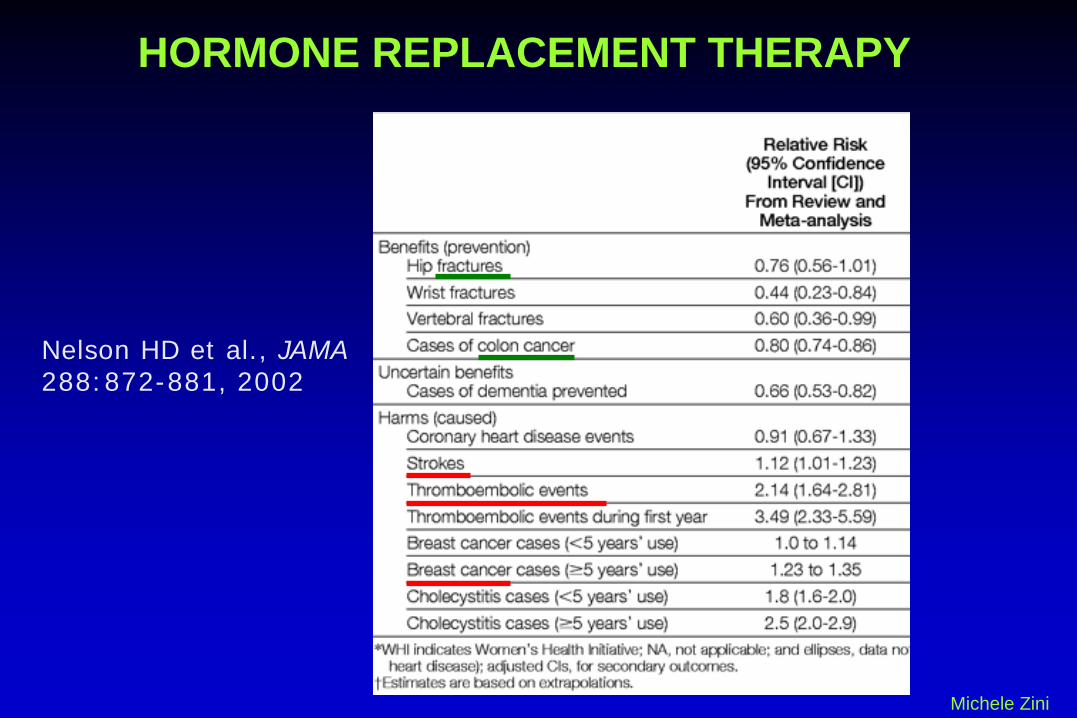
HORMONE REPLACEMENT THERAPY

SOFRGPEPIHERSWHI“One million”
et al.
Michele Zini
HORMONE REPLACEMENT THERAPY
Michele Zini
HORMONE REPLACEMENT THERAPY
Nelson HD et al., JAMA 288:872-881, 2002

Michele Zini
RALOXIFENE - MORE studyEttinger B et al., JAMA 282:637-645, 1999
Delmas PD et al., J Clin Endocrinol Metab 87: 3609–3617, 2002 - 4 yrs follow-up

Michele Zini
RR = 0.93 (95% CI: 0.81-1.06)
RALOXIFENE - MORE studyEttinger B et al., JAMA 282:637-645, 1999
Delmas PD et al., J Clin Endocrinol Metab 87: 3609–3617, 2002

CLODRONATEMcCloskey
E et
al., J Bone
Miner
Res 2004;19:728–736 –
3 years
follow-up
Michele ZiniTreatment: clodronate
800 mg/day per os
secondary
postmenopausal

Michele Zini
Once-a-week ALENDRONATE 70 mg/week
Schnitzer T et al., Aging 12: 1-12, 2000 Rizzoli R et al., J Bone Miner Res 17:1988–1996, 2002

Michele Zini
Once-a-week
RISEDRONATE 35 mg/week
Brown JP et al., Calcif Tissue Int 71: 103-111, 2002

Michele Zini
Once-a-month IBANDRONATE 150 mg/month - MOBILE study
Miller PD et al., J Bone Miner Res 20:1315-1322, 2005 Reginster J-Y et al., Ann Rheum Dis 65:654–661, 2006
Michele Zini
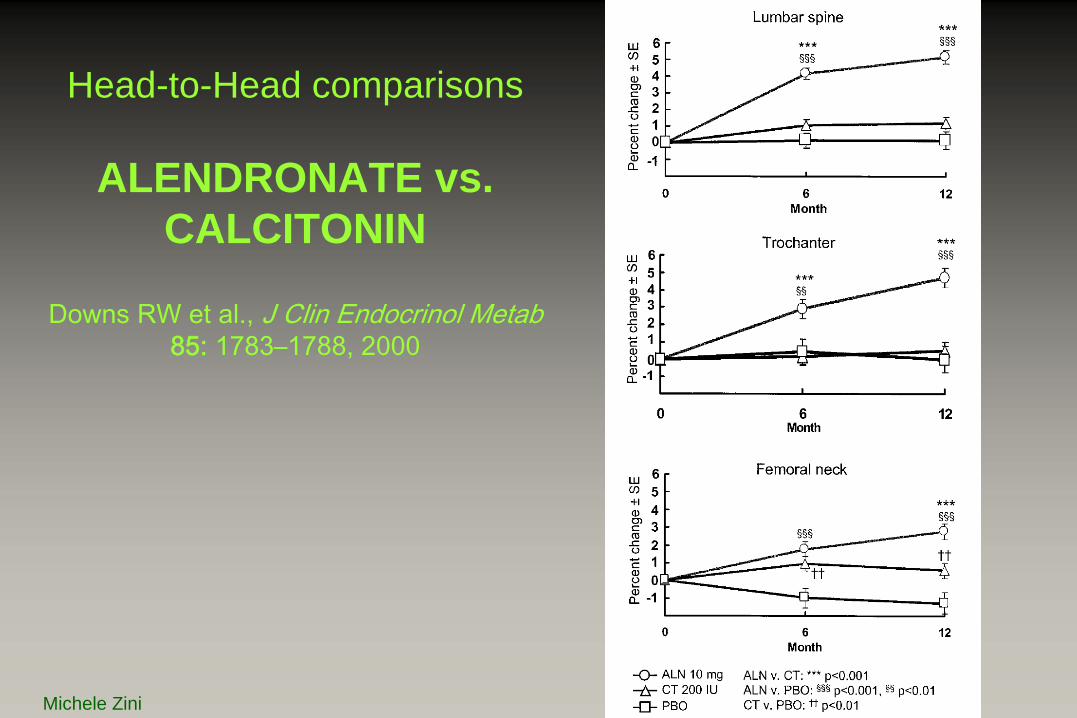
Head-to-Head comparisons
ALENDRONATE vs. CALCITONIN
Downs
RW et
al., J Clin Endocrinol Metab 85: 1783–1788, 2000

Michele Zini
Head-to-Head comparisons ALENDRONATE vs. TERIPARATIDE Body J-J et
al., J Clin Endocrinol Metab 87: 4528–4535, 2002

Michele Zini
Head-to-Head comparisons ALENDRONATE vs. RALOXIFENE – EFFECT study
Sambrook
PN et
al., Journal of Internal
Medicine 2004; 255: 503–511

Michele Zini
Head-to-Head comparisons ALENDRONATE vs. RISEDRONATE – FACT study
Rosen
CJ et
al., J Bone
Miner
Res 2005;20:141–151 Bonnick
S et
al., J Clin
Endocrinol
Metab. 2006 Apr
24; [Epub
ahead
of print] –
2 yrs
follow-up

THERAPEUTIC PROPOSALS
Michele Zini
Alendronate
First choice drug
Well suited for all bone types
Long term administration
May be associated with estrogen and vit. D
Gastroesophageal side effects

Risedronate
First choice drug
Same effectiveness as alendronate
Newer drug: less scientific evidence
Michele Zini
THERAPEUTIC PROPOSALS

Strontium ranelate
Effective on both spinal and non-spinal fractures
AIFA “nota 79”: in case of contraindications or intolerance to alendronate or risedronate
Michele Zini
THERAPEUTIC PROPOSALS
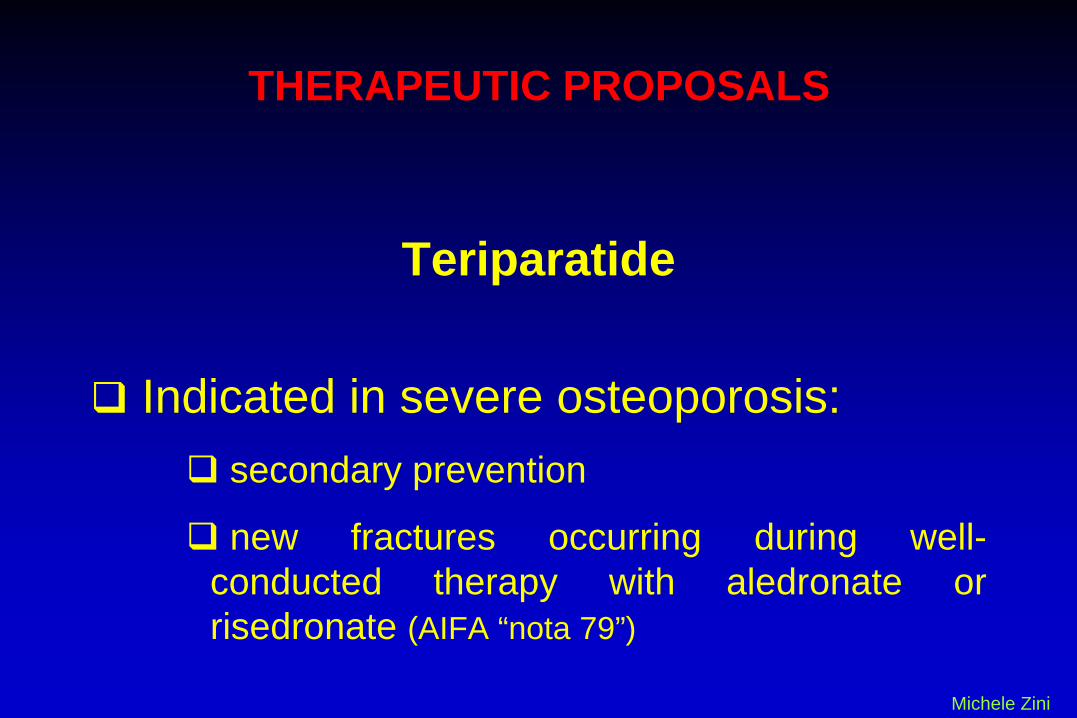
Teriparatide
Indicated in severe osteoporosis: secondary prevention
new fractures occurring during well- conducted therapy with aledronate or risedronate (AIFA “nota 79”)
Michele Zini
THERAPEUTIC PROPOSALS

THERAPEUTIC PROPOSALS
Michele Zini
Estrogen
Only for women with
serious climateric syndromeor
early menopause

THERAPEUTIC PROPOSALS
Michele Zini
Other drugs
Many drugs are prescribed due to several non- scientific reasons
- reimbursement by SSN- patient’s compliance- associated diseases
clodronate - raloxifene - ibandronate

THERAPEUTIC PROPOSALS
Michele Zini
Other drugs
Not indicated:neridronatezoledronateipriflavonetibolone

AMBULATORIO OSTEOPOROSI - Endocrinologia, Reggio Emilia
% PATIENTS with ACTIVE CURRENT TREATMENT for OSTEOPOROSIS
Michele Zini
alendronaterisedronatestrontium ranelateteriparatideraloxifeneestrogenscalcium / vit. Daltri

All this was HOW to treat TODAY
Now: HOW to treat IN THE NEXT FUTURE
And then: WHO to treat
Michele Zini

Michele Zini
WHO to treat - NORA study Siris ES et al., Arch Intern Med. 164:1108-1112, 2004
1) Most of fractures occur in osteoPENIC, not in osteoPOROTIC women

Michele Zini
WHO to treat Andrade SE et al., Arch Intern Med 163: 2052-2057, 2003
2) Osteoporosis is a largely UNDERTREATED condition

Michele Zini
WHO to treat Carnevale V et al., Osteoporos Int 17: 478–483, 2006
Michele Zini
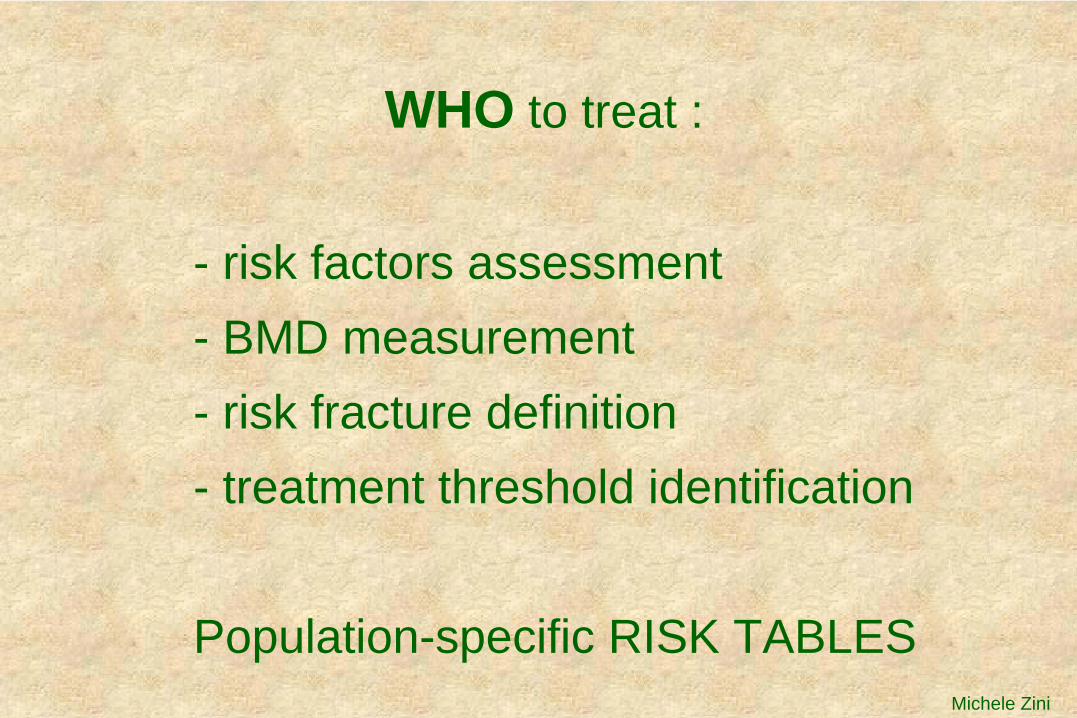
WHO to treat :
- risk factors assessment - BMD measurement - risk fracture definition - treatment threshold identification
Population-specific RISK TABLES


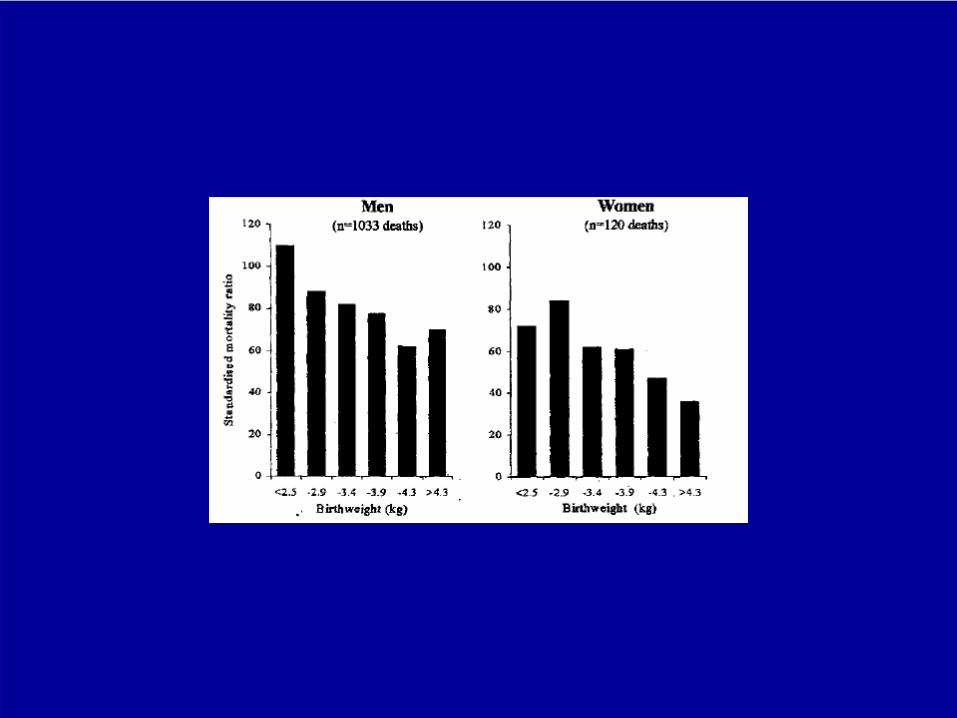
D J BARKER
• Low birth-weight and development of metabolic syndrome


RecommendationsRecommendations forfor bonebone densitometrydensitometry•• RadiographicRadiographic evidenceevidence of of osteopeniaosteopenia and/or and/or vertebralvertebral
deformitydeformity
•• Loss of Loss of heightheight, , thoracicthoracic kyphosiskyphosis
•• Previous lowPrevious low--trauma fracture (i.e. a fall from standing trauma fracture (i.e. a fall from standing height)height)
•• Prolonged corticosteroid therapy Prolonged corticosteroid therapy
•• Hypogonadism in either sex (possibly to include most Hypogonadism in either sex (possibly to include most menopausal women)menopausal women)
•• Chronic disorders associated with Chronic disorders associated with osteoporosisosteoporosis (e.g. (e.g. hyperthyroidismhyperthyroidism and and hyperparathyroidismhyperparathyroidism))
•• A A maternalmaternal historyhistory of of hiphip fracturefracture
•• A low body mass A low body mass indexindex
•• A low A low calciumcalcium intakeintake
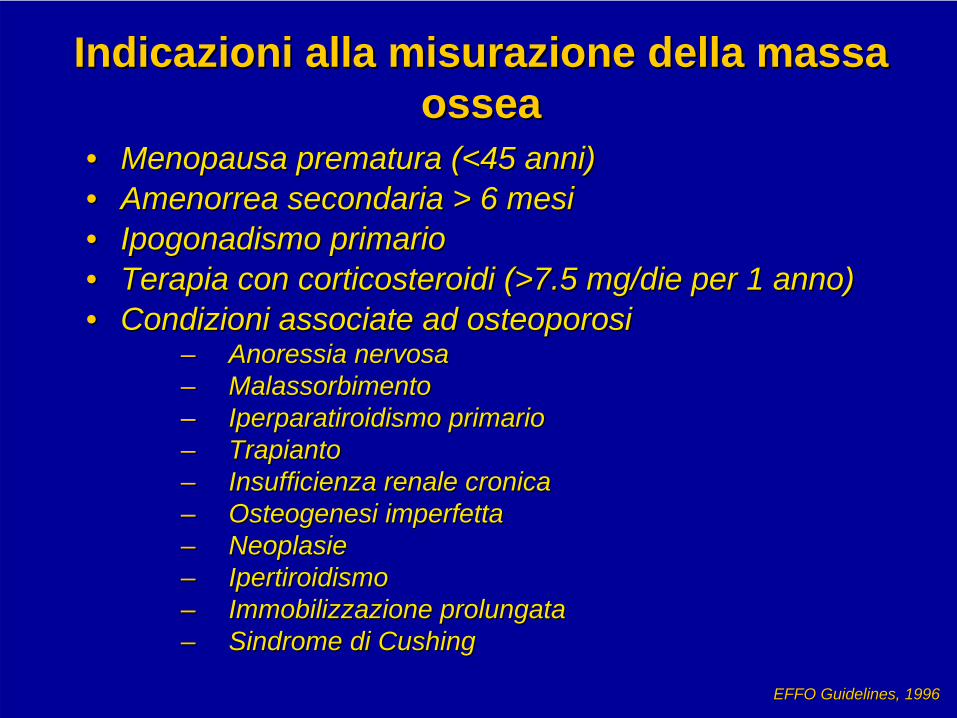
Indicazioni alla misurazione della massa Indicazioni alla misurazione della massa osseaossea
•• Menopausa prematura (<45 anni)Menopausa prematura (<45 anni)•• Amenorrea secondaria > 6 mesiAmenorrea secondaria > 6 mesi•• IpogonadismoIpogonadismo primarioprimario•• Terapia con corticosteroidi (>7.5 mg/Terapia con corticosteroidi (>7.5 mg/diedie per 1 anno)per 1 anno)•• Condizioni associate ad osteoporosiCondizioni associate ad osteoporosi
–– Anoressia nervosaAnoressia nervosa–– MalassorbimentoMalassorbimento–– IperparatiroidismoIperparatiroidismo primarioprimario–– Trapianto Trapianto –– Insufficienza renale cronicaInsufficienza renale cronica–– Osteogenesi imperfettaOsteogenesi imperfetta–– NeoplasieNeoplasie–– IpertiroidismoIpertiroidismo–– Immobilizzazione prolungataImmobilizzazione prolungata–– Sindrome di Sindrome di CushingCushing
EFFO EFFO GuidelinesGuidelines, 1996, 1996


dicembre 2005luglio 2005maggio 2005
T7
T6
T7
carico assiale e localizzazione delle VCF
le VCF (vertebral compression fracture) nell’osteoporosi severa
esperienza con pazienti polifratturateesperienza con pazienti polifratturate
T6 T7T8
busto 3S

Il concetto di normalità della 25-OH-Vitamina D Il concetto di normalità della 25-OH-Vitamina D
> 30 ng/ml (70> 30 ng/ml (70--90 90 nmol/lnmol/l) = ) = NormaleNormale
1212--30 ng/ml (4030 ng/ml (40--70 70 nmol/lnmol/l) = ) = InsufficienteInsufficiente
55--12 ng/ml (2012 ng/ml (20--40 40 nmol/lnmol/l) = Deficit) = Deficit--CarenzaCarenza
<5 ng/ml (<20 <5 ng/ml (<20 nmol/lnmol/l) = ) = SeveraSevera carenzacarenza


The Role of RANK Ligand Inhibition in Pathologic Bone
Loss

Increased Bone Density Associated with Blockade of
RANK Signaling
Radiographs of mouse femur.Amgen, data on file.
Normal OPG Knockout
OPG Overexpression

Day 0 5 10 20 30
rhOPG
Control
Bone Formed During RANK-L is Well Mineralized
rhOPG = recombinant human OPGReproduced from Capparelli C, et al. J Bone Miner Res. 2003;18:852-8 with permission of the American Society for Bone and Mineral Research.

RANK-LInhibition and Neck Strength in Rats
Reproduced from Ross AB, et al. J Mater Sci Mater Med. 2001;12:583-8 with kind permission of Springer Science and Business Media.
Crosshead
Applied Force
Epoxy Disk
Propagating Fracture
Rat Femur
Metal Fixture
Femoral Neck Strength
***
40
60
80
100
120
140
160
Elastic Force
Maximum Force
Fracture Force
Forc
e (N
)
Placebo OPG
*Significantly greater than placebo, P < 0.05

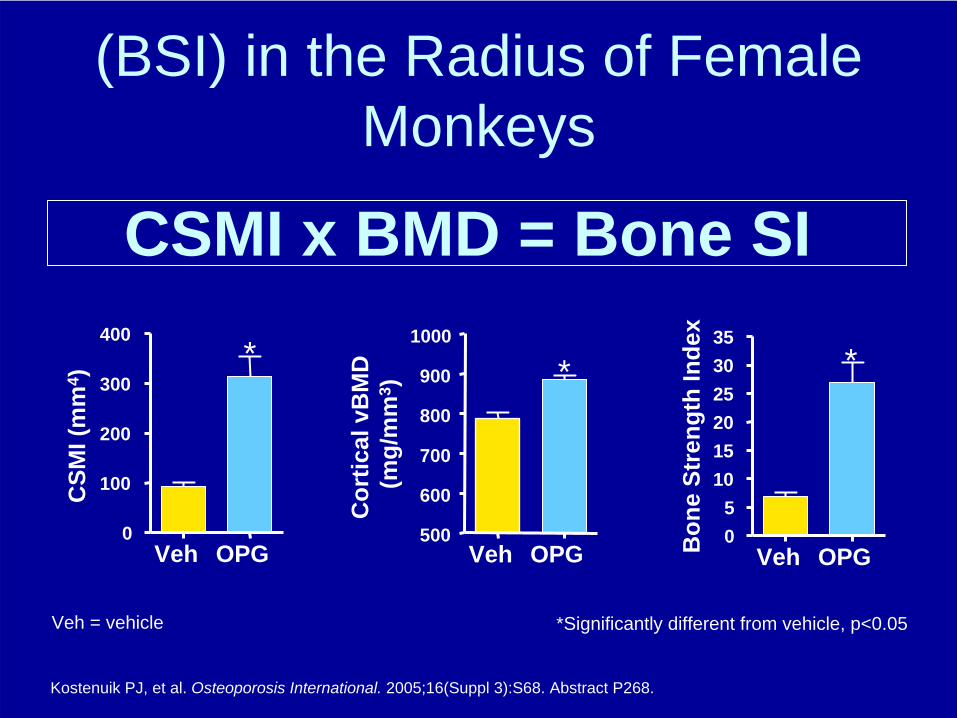
The Importance of Bone Geometry for Cortical Strenght
• In general, wide tubes are stronger than narrow tubes due to a greater cross-sectional moment of inertia (CSMI)
• CSMI is an index of bone strength1
• Bone strength can be predicted by multiplying CSMI X BMD1
Bike frames are strong due to wide tubing
Periosteal expansion helps to
maintain bone strength as we age
1. Ferretti JL, et al. Bone. 1996;18:97-102.
Central Axis
Periosteum

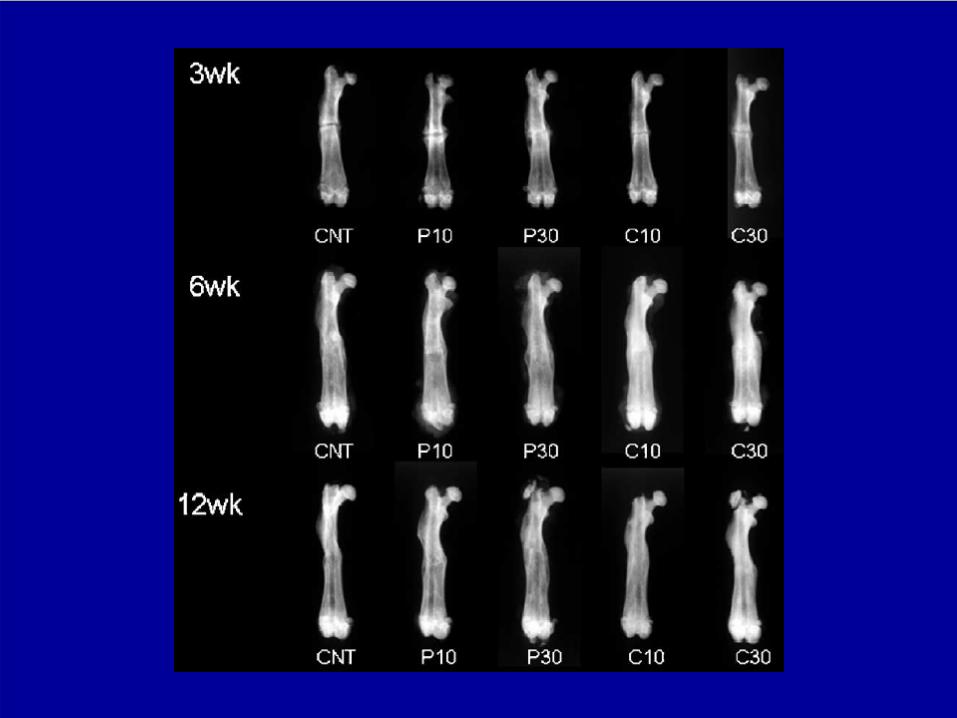
RANK Ligand Inhibition Increases Cortical Bone Area and Thickness in
the Radius of Female Monkeys
Veh = vehicle
Kostenuik PJ, et al. Osteoporosis International. 2005;16(Suppl 3):S68. Abstract P268
15
20
25
30 *
Perio
stea
lC
ircum
fere
nce
(mm
)
0
5
10
15
20
*
Endo
stea
lC
ircum
fere
nce
(mm
)
0.0
0.5
1.0
1.5
2.0
2.5
3.0
3.5
*
Cor
tical
Thi
ckne
ss (m
m)
Veh OPG Veh OPG Veh OPG
*Significantly different from vehicle, p<0.05
*Significantly different from vehicle, p<0.05
CSMI x BMD = Bone SI
Kostenuik PJ, et al. Osteoporosis International. 2005;16(Suppl 3):S68. Abstract P268.
Veh OPG500
600
700
800
900
1000
*C
ortic
al v
BM
D(m
g/m
m3 )
Veh OPG05
101520253035
*
Bon
e St
reng
th In
dex
Veh OPG0
100
200
300
400*
CSM
I (m
m4 )
Veh = vehicle
(BSI) in the Radius of Female Monkeys

Lumbar Vertebra
Duration of Treatment (Months)
Cha
nge
in B
MD
(%)
-10
-5
0
5
10
15
20
25
30
35
0 1 2 3 4 5 6
Sham
Control
OPG
PTH
OPG+PTH
* *
* *
*
* *
*
*
*
* *
# # #
-5
0
5
10
15
20
25
30
0 1 2 3 4 5 6
**
*
*
*
*
*
*
*
*
* * *
#
##
#
Duration of Treatment (Months)
Femur/Tibia
RANK Ligand Inhibition and PTH have Additive Effects on BMD in Aged OVX Rats
Adapted from Kostenuik PJ, et al. Endocrinol. 2001;142:4295-304.
* = significant difference from vehicle-treated OVX# = significant difference from PTH-treated OVX (by Tukey-Kramer test, P < 0.05).

The Role of RANK Ligand Inhibition in Bone Erosions

RANK Ligand is Required for Bone Erosions in Rheumatoid
ArthritisRANK Ligand mRNA detected in Arthritic Synovium
1. Amgen, data on file. 2. Kong Y-Y, et al. Nature. 1999;402:304-9.
RANK Ligand in arthritic synovium1
• RANK Ligand gene expression is significantly elevated by activated T cells and synoviocytes in the inflamed synovium1,2
• Cytokines differentially regulate RANK Ligand and OPG, thereby altering the RANK Ligand/OPG ratio to favor bone resorption1,2

RANK-L inhibition in Preclinical Models of Arthritis
1. Kostenuik PJ, et al. J Bone Min Res. 2004;19(Suppl 1):S189. Abstract SA510
• Adjuvant arthritis-induced excess RANK Ligand leads to focal osteolytic lesions and significant bone loss
• RANK Ligand inhibition appears to prevent loss of bone mineral density in adjuvant arthritis
Normal Healthy Rat Paw1
Arthritic Rat Paw1 Arthritic Rat Paw + OPG1

CONTROL ARTHRITIS ARTHRITIS + OPG
RANK Ligand Inhibition in Arthritic Rats Prevents RANK Ligand Inhibition in Arthritic Rats Prevents Loss of BMD, but Does Not Inhibit InflammationLoss of BMD, but Does Not Inhibit Inflammation
Reproduced from Kong Y-Y, et al. Nature. 1999;402:304-9 with permission of Nature Publishing Group
0.16
0.18
0.20
0.22
0.24
BM
D (g
per
cm
2 )
.0
0.5
1.0
1.5
2.0
2.5
Paw
Sw
ellin
g (m
L)
––
+–
++
AdAOPG
––1
+–4
++5
AdAOPGLane

RANK Ligand Inhibition Can Prevent Cartilage RANK Ligand Inhibition Can Prevent Cartilage Destruction in Rats Destruction in Rats
Normal ArthriticRANK Ligand
Inhibition
A B C
Reproduced from Kong Y-Y, et al. Nature. 1999;402:304-9 with permission of Nature Publishing Group

The Role of RANK Ligand Inhibition in Treatment-
Induced Bone Loss

1. Hofbauer LC, et al. Endocrinol. 1999;140:4382-9.
2. Sasaki N, et al. Nephrol Dial Transplant. 2001;16:479-82.
RANK Ligand and Bone Loss in Glucocorticoid Osteoporosis
• Glucocorticoid exposure enhances RANK Ligand expression and inhibits OPG production by osteoblasts1-2
• This alteration increases the OPG/RANK Ligand ratio and results in osteoclast-driven bone resorption
I

Cancer Treatment-Bone Loss• Women with breast cancer treated with
aromatase inhibitors – In this patient population, there was a more than
1.5- to 2-fold higher risk of experiencing vertebral fracture1,2
• Men with prostate cancer treated with androgen deprivation therapy (ADT)– Estimated 1 in 4 men who undergo androgen
deprivation therapy will experience skeletal complications, such as fracture, within 2 years3,4
1. Baum M, et al. Lancet. 2002;359:2131-39.2. Arimidex® (anastrazole) prescribing information3. Melton LJ, et al. J Urol. 2003;169:1747-50. 4. Smith M, et al. N Engl J Med. 2001;345:948.

Cancer Treatment-Bone Loss
Cancer Treatment
ADT 3,4 Aromatase Inhibitor 1,2
Increase in bone turnover markers
Rapid bone loss
Increased risk of fracture
1. Theriatult RL. Oncol. 2004;18(Suppl 3):11-5. 2. Coleman RE. Oncol. 2004;18(Suppl 3):16-20. 3. Stoch SA, et al. J Clin Endocrinol Metab. 2001;86:2787-91. 4. Smith M, et al. N Engl J Med. 2001;345:948.
• Hormone ablative therapies enhance RANK Ligand expression and inhibit OPG production by osteoblasts
• This alteration increases the RANK Ligand/OPG ratio and results in osteoclast-driven bone resorption

The Role of RANK Ligand Inhibition in Cancer-Related
Bone Disease

“Vicious Cycle” of Bone Destruction in Metastatic
Cancer
Adapted from Roodman GD. N Engl J Med. 2004;350:1655-64.
Bone
Osteoblast
RANK
RANKL
Bone Resorption
Osteoclast
Cancer Cells in bone metastasis
Ca2+
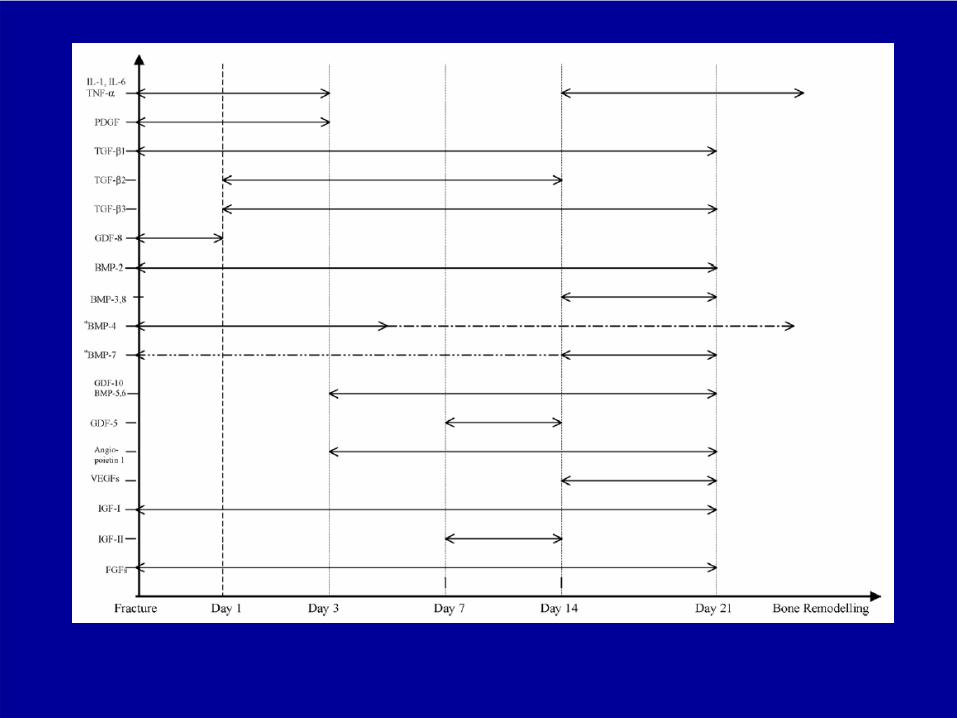
Growth Factors (TGF-IGFs, FGFs,
PDGFs, BMPs)
Cytokines and Growth Factors (IL-6, IL-8, IL-1,
PGE-2, TNF-, CSF-1, PTHrP)
Osteolytic Lesions
Direct effectson tumor?
RA
NK
L

Tumor-Induced Osteolysis in Breast Cancer Model
MDAMDA--231 231 IntracardiacIntracardiac ModelModel
Adapted from Morony S, et al. Cancer Res. 2001;61(11):4432-6.
ControlControl RANK RANK LigandLigand InhibitionInhibition
Radiographic lesions
00 0.30.3 11 3300
6060
120120
180180
OPG Dose (mg/kg)OPG Dose (mg/kg)
**
# of
OC
/mm
# of
OC
/mm
22Tu
mor
Are
aTu
mor
Are
a
* Significantly different from 0 mg/kg OPG
OPG Dose (mg/kg)OPG Dose (mg/kg)00 0.30.3 11 33
00
22
44
****# Le
sion
s/m
ouse
# Le
sion
s/m
ouse

Prostate Cancer-induced Osteoblastic Bone Lesions
Zhang J, et al. Cancer Res. 2003;63:7883-90.
basal vehicleRANKL inhibition
(RANK:Fc)
X-ra
y
Prostate Cancer LuCaP 35 HU/SCID model, Rx initiated at 6 weeks
0
5
10
15
20
25
30
35
40
Basal Vehicle RANK-FcTreatment
PSA
(ng/
ml)
*
Serum PSA as surrogate marker forprostate tumor burden
* P <0.01 as compared with vehicle treated group


NEW TREATMENT: NEW TREATMENT: ELECTRICAL NEUROELECTRICAL NEURO--MODULATIONMODULATION
30404244
46
48
57
63
72
78
87
93
102
108
113
121
129
137
145
150
152
mpiezz
a
0
5
10
15
20
25
30
35
40
45
Frequenza
Tempo
Modulazione di Frequenza - Ampiezza - IntensitàFrequencyFrequency--DurationDuration--PotentialPotential ModulationModulation
Freq
uenc
y (H
z)
time (s)
Width (microsec)
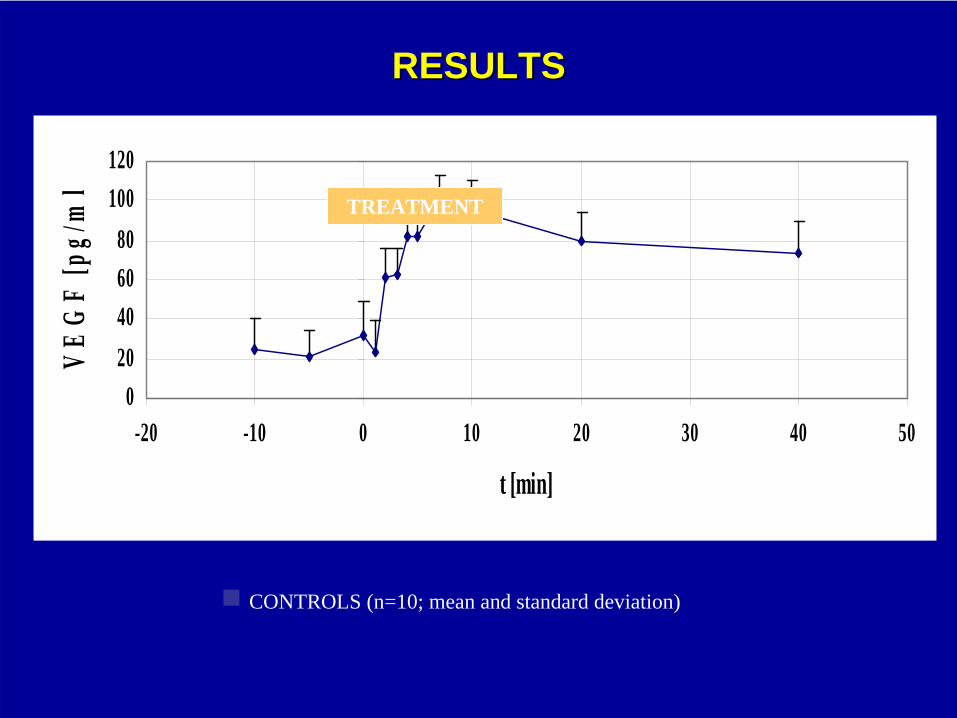
RESULTSRESULTS
VEGF IN EXPERIMENTALVEGF IN EXPERIMENTAL
020406080
100120
-20 -10 0 10 20 30 40 50
t [min]
VE
GF
[pg/
ml
CONTROLS (n=10; mean and standard deviation)
TREATMENT

RESULTSRESULTS
VEGF IN EXPERIMENTALVEGF IN EXPERIMENTAL
020406080
100120
-20 -10 0 10 20 30 40 50
t [min]
VE
GF
[pg/
ml
OSTEOPOROTIC FRACTURES (n=10; mean and standard deviation)
TREATMENT

ANGIOGENIC GROWTH FACTORS ANGIOGENIC GROWTH FACTORS
0
1
2
3
4
5
6
7
8
-20 -10 0 10 20 30 40
t [min]
b-FG
F [p
g/m
l]
0
10
20
30
40
50
60
70
VEG
F [p
g/m
l]
VEGFb-FGF
IN CONTROLS


GATTI DAVIDERiabilitazione Reumatologica
Valeggio S/M Università di Verona

80 years old28 years old
SKELETAL DISORDER CHARACTERIZED BY COMPROMISED BONE
STRENGTH PREDISPOSING TO AN INCREASED RISK OF FRACTURE.
BONE STRENGTH REFLECTS THE INTEGRATION OF TWO MAIN FEATURES:
BONE DENSITY AND BONE QUALITY.
Consensus Conference 2001

OSTEOPORSIS PREVENTION ?
? ? ?
?
FRACTURE PREVENTION ?
Who should be treated with bone active agents?
Who should be treated with bone active agents?
MOST RELEVANT RISK FACTORS OF OSTEOPOROTIC FRACTURES

BONE STENGTH +BONE DENSITY
BONEQUALITY
LOWBMD ?
FRACTURERISK
FACTORS

anythingyoucan
measure…..
BONE STENGTH +BONE DENSITY
BONEQUALITY

DXA = QUANTITATIVE EVALUATION
DXA CANNOT ALWAYS PREDICT
FRACTURE RISK…

VERTEBRAL FRACTURE RELATIVE RISK ADJUSTED FOR -2.5 SD T-SCORE (SPINE BMD)
0 5 10 15 20 25 30
Postmenop. No prevalent Fx
Postmenop. Prevalent Fx

Incidence of new vertebral fractures during follow-up, by number of prevalent fractures
Nevitt et al 1999
0
10
20
30
40
50
60
0 1 2 3 4 5+Number of prevalent fractures
Inci
denc
eof
new
frac
ture
s(%
)
old NOTA 79
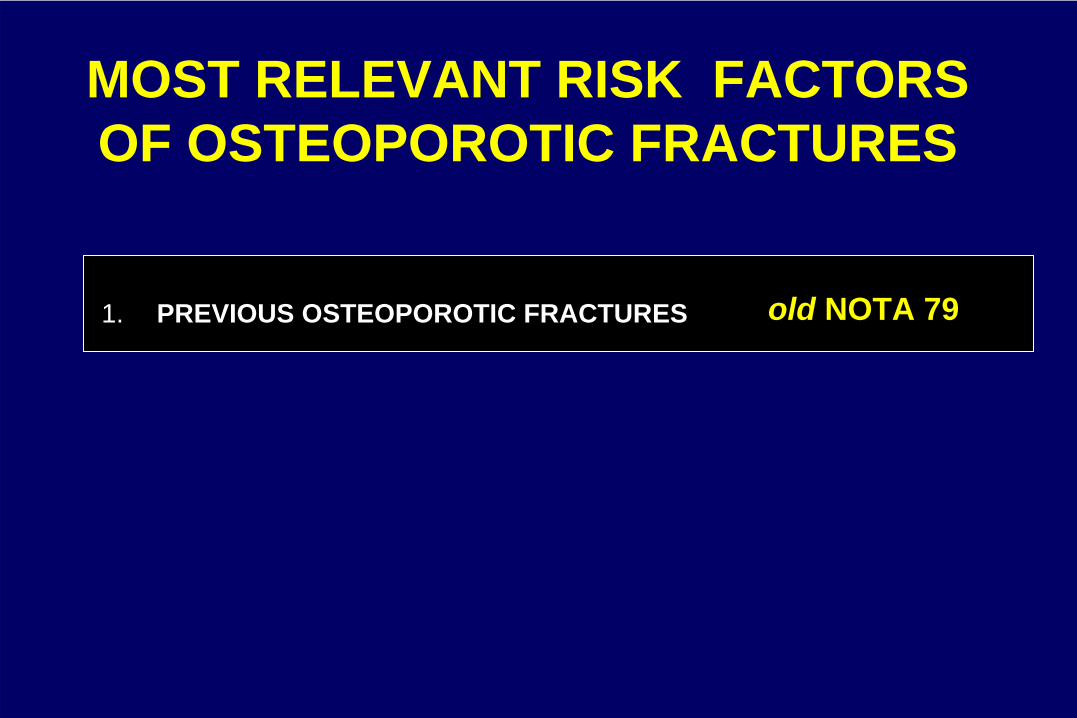
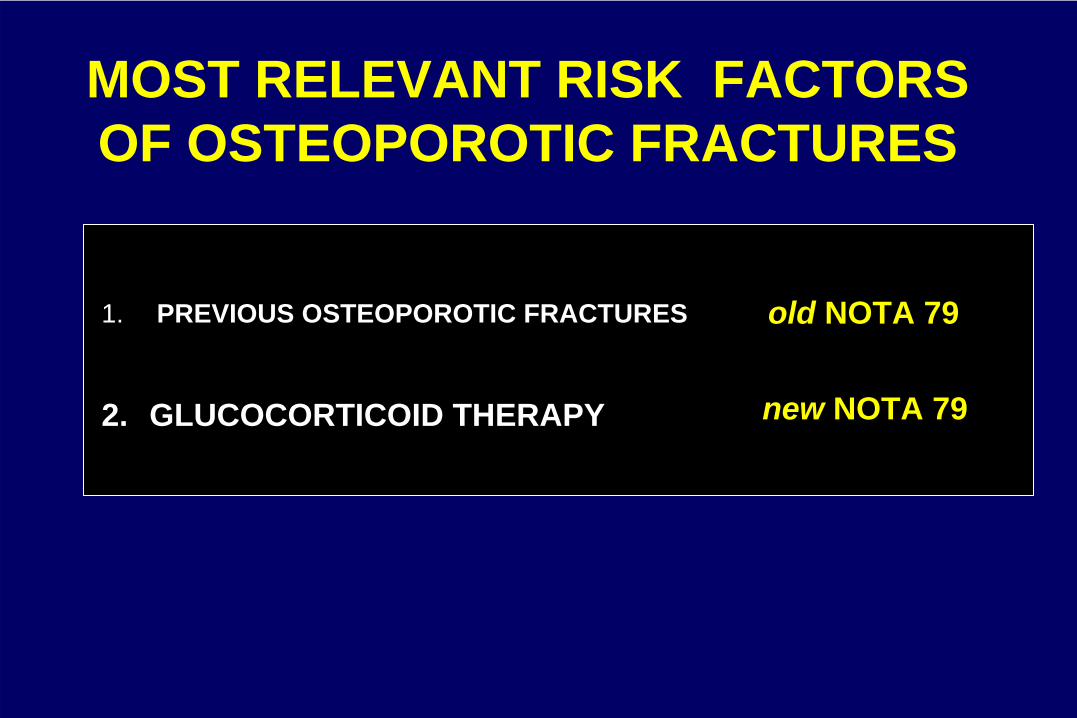
MOST RELEVANT RISK FACTORS OF OSTEOPOROTIC FRACTURES
1. PREVIOUS OSTEOPOROTIC FRACTURES

0 5 10 15 20 25 30
Postmenop. No prevalent Fx
Postmenop. Prevalent Fx
Cs Osteoporosis, all patients
Cs Osteop. Postmenop. Women
VERTEBRAL FRACTURE RELATIVE RISK ADJUSTED FOR -2.5 SD T-SCORE (SPINE BMD)

Incidence of new vertebral fractures during 1 year follow-up
4,5 %
16,1 %
POSTMENOPAUSAL < -2,5OSTEOPOROSIS
G.I.OP = -1,2
T-SCORE FRACTURE(SPINE BMD) INCIDENCE
Ettinger et al. 1999 Wallach et al. 2000
old NOTA 79
MOST RELEVANT RISK FACTORS OF OSTEOPOROTIC FRACTURES
1. PREVIOUS OSTEOPOROTIC FRACTURES
2. GLUCOCORTICOID THERAPY new NOTA 79

old NOTA 79
MOST RELEVANT RISK FACTORS OF OSTEOPOROTIC FRACTURES
1. PREVIOUS OSTEOPOROTIC FRACTURES
2. GLUCOCORTICOID THERAPY
3. LOW BMD
new NOTA 79

16,4
5,4
1,10
5
10
15
20
Osteoporosis Low BMD NormalsT < -2.5 T> -1
NNT 122 370 1818
THERAPY RR 0,50
Epidos study, OI 1998
Inci
denc
e/1
000
/wom
an-Y
S

IN ITALY: WOMEN > 50 YS OLD = 11.000.000
T-SCORE n° hip-fx hip-fx(Milioni) (incidenza)
<-2,5 1.1 (16/1000)
>-2,5 9.9 (2/1000)
17.600
19.800

AGE> 75, poor health
0
20
40
60
80
100
120
140
-7 -5 -3 -1 1 3
BMD T score (SD)
Ris
chio
di f
ratt
ura
AGE < 60good health
Other fracture risk factors amplify the effect of low BMD

age < 65: T score < -2.5
age > 65: T score < -2.0
Treatment threshold NOF Guidelines

age < 65: T score < -2.5 = 0.8 % of the population
age > 65: T score < -2.0 = 85% of the elderly
Treatment threshold NOF Guidelines
Rational: treating absolute risk of fracture!

REMAINING LIFE EXPECTANCY IN WOMEN
0
5
10
15
20
25
30
35
50 65 75 80 85
Age (years)
year
s

1 0.5 0 -0.5 -1 -1.5 -2 -2.5 -3 -445 1.8 2.3 2.8 3.5 4.3 5.4 6.6 8.1 10 1550 2.4 3 3.8 4.7 5.9 7.4 9.2 11.3 14.1 21.355 2.6 3.3 4.1 5.3 6.7 8.5 10.7 13.4 16.8 2660 3.2 4.1 5.1 6.5 8.2 10.4 13 16.2 20.2 30.665 4 5 6.3 8 10 12.6 15.6 19.3 23.9 35.570 4.3 5.5 7.1 9 11.5 14.6 18.3 22.8 28.4 42.375 4.2 5.4 7 9.1 11.8 15.2 19.4 24.5 30.8 46.280 4.6 6 7.7 9.9 12.7 16.2 20.5 25.6 31.8 46.485 4.5 5.8 7.4 9.4 12 15.3 19.1 23.8 29.4 42.7
T – s c o r e
Age
Ten year probability (%) of any fracture in women by T-score

ANNO 2005

BMD + age
+smoke o low BMI
BMD + age
BMD + ETA’+
smoke + low BMI

BMD
RISK FACTORS
BMD +
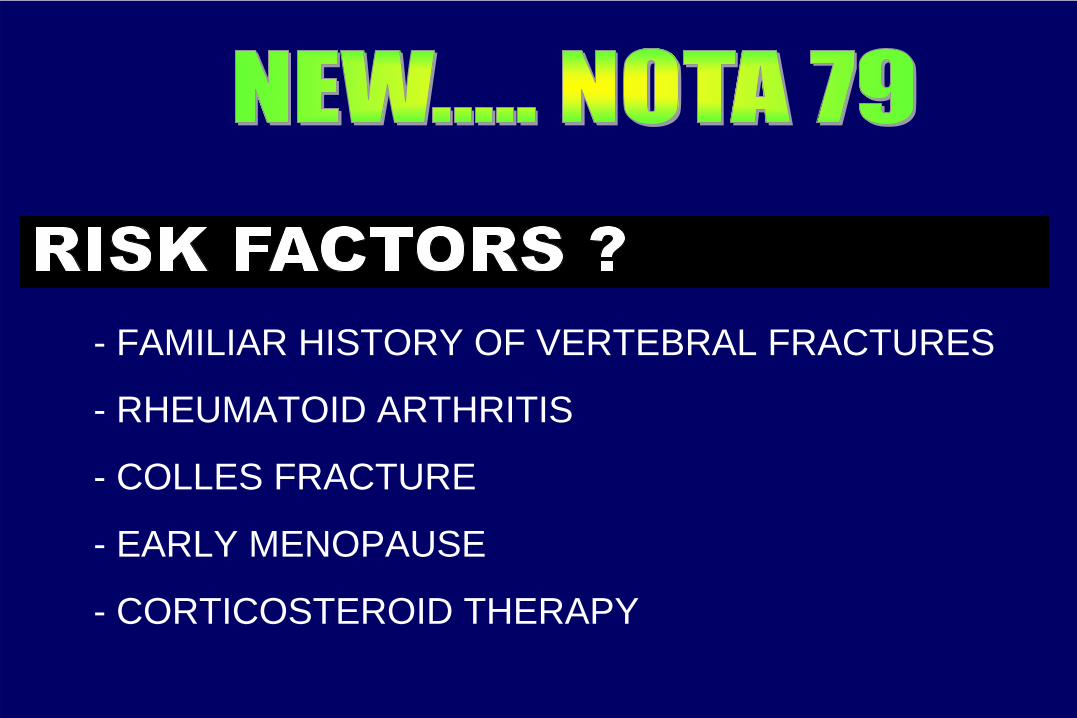
- FAMILIAR HISTORY OF VERTEBRAL FRACTURES
- RHEUMATOID ARTHRITIS
- COLLES FRACTURE
- EARLY MENOPAUSE
- CORTICOSTEROID THERAPY

OSTEOPOROSIS Who should be treated with
bone active agents?
OSTEOPOROSIS Who should be treated with
bone active agents?
old NOTA 79
present NOTA 79
1. PREVIOUS OP FRACTURES
2. GIOP
3. LOW BMDnew NOTA 79
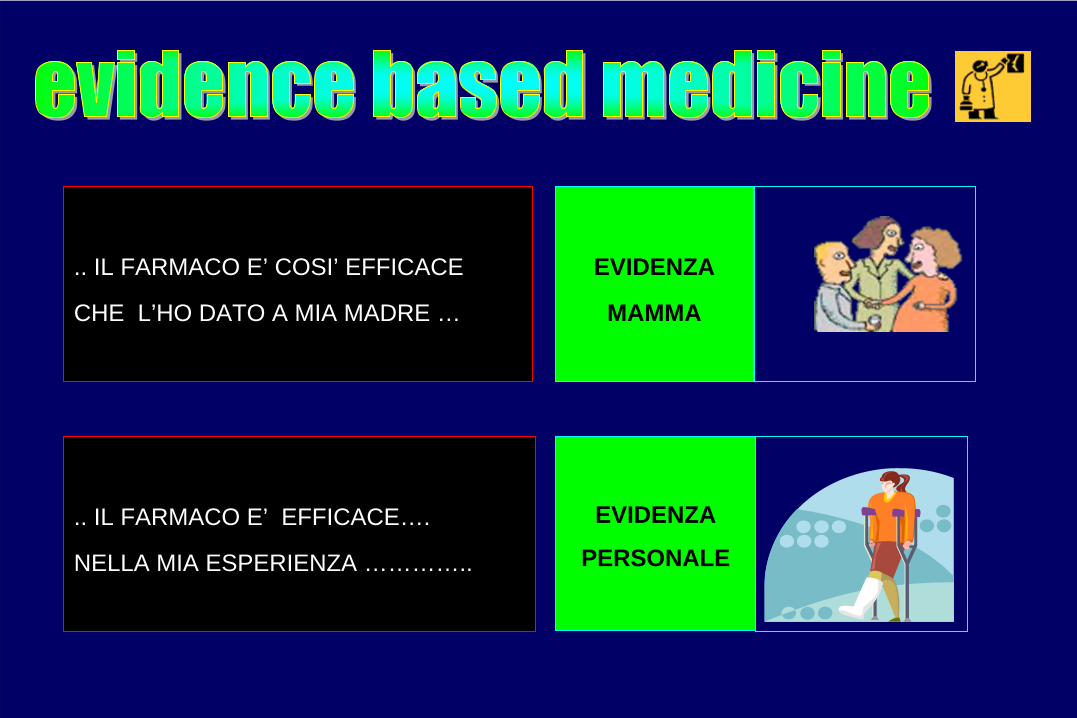
.. IL FARMACO E’ COSI’ EFFICACE
CHE L’HO DATO A MIA MADRE …
EVIDENZA
MAMMA
.. IL FARMACO E’ EFFICACE….
NELLA MIA ESPERIENZA …………..
EVIDENZA
PERSONALE

RCT:
Cohort Study:
Case-control study:
Case - series:
Expert Opinion:
ANNO 2005

ANNO 2005

Linee guida 2005 SIOMMMS, CROI, SIMFER, SIMI, SIOT, SIRM, SIR
Ibandronato / A / / /
A


2005 SIOMMMS, CROI, SIMFER, SIMI, SIOT, SIRM, SIR
Ibandronato 1a 1b3 /
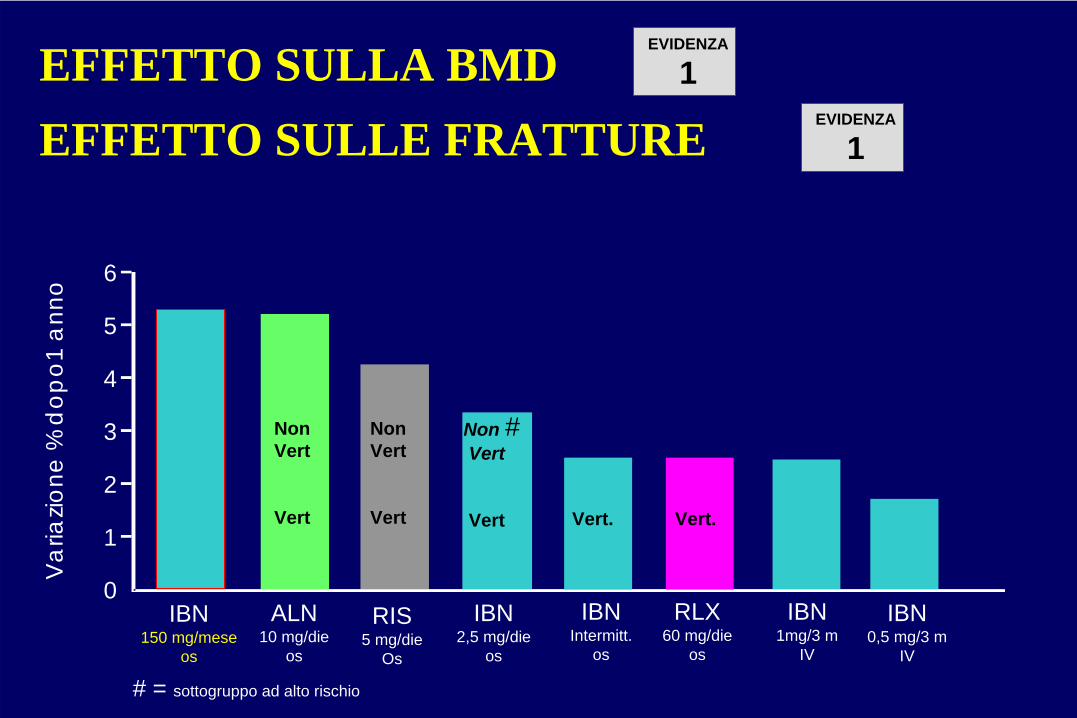
IBN150 mg/mese
os
EFFETTO SULLA BMD EFFETTO SULLE FRATTURE
6
5
4
3
2
1
0
Var
iazio
ne%
dop
o1 a
nno
RIS5 mg/die
Os
RLX60 mg/die
os
IBN2,5 mg/die
os
IBNIntermitt.
os
IBN1mg/3 m
IV
IBN0,5 mg/3 m
IV
EVIDENZA
1
ALN10 mg/die
os
NonVert
Vert
NonVert
Vert Vert.
EVIDENZA
1
Vert.
Non #Vert
Vert
# = sottogruppo ad alto rischio

“Male osteoporosis”
Alfredo ScillitaniUnit of Endocrinology
Ospedale “Casa Sollievo della Sofferenza”San Giovanni Rotondo
3rd Joint Meeting AME-AACE -Verona 27-29 October 2006

Epidemiology
women men
Osteopenia 50 47 (33)*
Osteoporosis 18 6 (4)*
Age adjusted prevalence (%):
* when utilizing cut-off for women
Bilezikian J.P., J.C.E.M., 1999

Age-specific incidence of hip fractures
Melton L.J. III et al., Public Health Rep., 1996
Men
1928-1942
43-52
53-62
63-72
73-82
83-92
> 85 years
75 - 84 years
65 - 74 years
2500
1500
2000
1000
500
0
Women
1928-1942
43-52
53-62
63-72
73-82
83-92
> 85 years
75 - 84 years
65 - 74 yearsAge
-spe
cific
inci
denc
epe
r 100
,000
per
son-
year
s

Mortality rates for fracture patients and general population by sex and age-group
Center J.R. et al., Lancet, 1999
500
400
0
100
200
300
60-69 70-79 > 80Women Men Women Men Women Men
General population
Fracture patients
Dea
ths
per 1
000
pers
on-y
ears
Age-group (years)

Estrogens as key factors in the establishment of peak bone mass in men
Chronological age (yrs) 28 24, 3/12Karyotype 46, XY —Phenotype normal male normal maleBone age (yrs) 15 14Testosterone = ↑
Dihydrotestosterone = ↑
Estradiol ↑ ↓
Estrone ↑ ↓
Radial BMD — 0.570Lumbar BMD 0.745 (<2.0 SD for bone age) 0.931Height (cm) 204 204Weight (kg) 127 135.1Estrogen therapy Ineffective EffectiveDefect Estrogen resistance Aromatase deficiency
Smith E.P. et al., N.E.J.M., 1994 Morishima A. et al., J.C.E.M., 1995
(-4.65 SDS)(-1.68 SDS)(+3.7 SDS)(+2.1 SDS)

Changes in serum estrogen (top), testosterone (middle) and sex hormone binding globulin (bottom) in aging men
Khosla S. et al., J.C.E.M. 1998
<30
<30
<30
30-3
9
30-3
9
30-3
9
40-4
9
40-4
9
40-4
9
50-5
9
50-5
9
50-5
9
60-6
9
60-6
9
60-6
9
70-7
9
70-7
9
70-7
9
80+
80+
80+
Pre
Pre
Post
Post
0
20
40
60
SHB
G(n
mol
/ L)
Age (years)
Age (years)
Age (years)
600
400
200
200
100
0 0Tota
lT(n
g/m
L)
Bio
T(n
g/m
L )
200
0 020 1040
3020
604080
80
Tota
lE(p
g/m
L)
Bio
E(p
g/m
L)

Possible causes of higher bone fragility in women
• Smaller bone size at peak bone mass
• Trabecular bone loss causes a deeper architectural damage
• Lower periostal bone apposition with aging

Possible causes of higher bone fragility in women
• Smaller bone size at peak bone mass
• Trabecular bone loss causes a deeper architectural damage
• Lower periostal bone apposition with aging

Growing: areal (left) and volumetric (right) bone mineral density at femural shaft
Lu P.W. et al., J.C.E.M., 1996
0 0
0.5 0.2
0.41.0
0.61.5
0.8
2.0 1.0
0 05 5
Bon
em
iner
alde
nsity
(g/c
m2 )
Age (years)
Female Male
10 1015 1520 2025 2530 30
2.5 1.2
Bon
em
iner
alde
nsity
(g/c
m3 )

Possible causes of higher bone fragility in women
• Smaller bone size at peak bone mass
• Trabecular bone loss causes a deeper architectural damage
• Lower periostal bone apposition with aging

Mechanisms of loss of trabecular bone in women and trabecular thinning in men
Seeman E., Lancet, 2002
perforation
Women
thinning
Men

Possible causes of higher bone fragility in women
• Smaller bone size at peak bone mass
• Trabecular bone loss causes a deeper architectural damage
• Lower periostal bone apposition with aging

Ageing: position and extent of bone loss in men and women
Seeman E., Lancet, 2002
Men
Men
Women
Women
Net bone loss
Young Old
ResorbedFormed
Absoluteamount of bone

CAUSES OF SECONDARY OSTEOPOROSISHypogonadal states• Turner syndrome• Klinefelter syndrome• Anorexia nervosa• Hypothalamic amenorrhea• Hyperprolactinemia• Other primary/secondary hypogonadal
statesEndocrine disorders• Cushing’s syndrome• Hyperparathyroidism• Thyrotoxicosis• Insulin-dependent diabetes mellitus• Acromegaly• Adrenal insufficiencyNutritional and gastrointestinal disorders• Malnutrition• Parenteral nutrition• Malabsorption syndromes• Gastrectomy• Severe liver disease, especially biliary
cirrhosis• Pernicious anemiaRheumatologic disorders• Rheumatoid arthritis• Ankylosing spondylitis
Hematologic disorders/malignancy• Multiple myeloma• Lymphoma and leukemia• Malignancy-associated parathyroid hormone
related (PTHrP) production• Mastocytosis• Hemophilia• ThalassemiaSelected inherited disorders• Osteogenesis imperfecta• Marfan syndrome• Hernochromatosis• Hypophosphatasia• Glycogen storage diseases• Homocystinuria• Ehlers-Danlos syndrome• Porphyria• Menkes’ syndrome• Epidermolysis bullosaOther disorders• Immobilization• Chronic obstructive pulmonary disease• Pregnancy and lactation• Scoliosis• Multiple sclerosis• Sarcoidosis• Amyloidosis

Rate of primary and secondary osteoporosis in women and men
women men
30%70% 45% 55%
Primaryosteoporosis
Secondaryosteoporosis

• Patient history
• Physical examination

Risk Factors
• familial• nutritional• environmental• social• medical• pharmacological• .........

0 00
5
10
1.0
0.5
Fem
urne
ckB
MD
(g/c
m2 )
Yes
Yes
No
No
No
No
No
No
Yes
Yes
Yes
Yes
Buc
klin
gra
tio
Cor
tical
thic
knes
s(c
m)
0.2
0.1
15
0
1.0
0.5
0
5
10
15
0
0.2
0.1
Adjusted bone variable means according to maternal osteoporosis history
Adjusted bone variable means according to maternal osteoporosis historyMaternal history of osteoporosis
Men
Women
*
*
*
*
*
*
Looker A.C. & Beck T.J., C.T.I., 2004
* p<0.05 for differences by maternal OP history within sex category

Bone related toxic effects before and after diagnosis of prostate cancer
12 Mo before diagnosis (%)
P value
12 to 60 Mo after diagnosis P value
OSTEOPOROSISAndrogen deprivation therapy 0.59
0.196.92
<0.001No androgen deprivation therapy 0.46 3.69
ANY FRACTURE
Androgen deprivation therapy 3.410.01
19.37<0.001No androgen deprivation
therapy 2.80 12.63
FRACTURE RESULTING IN HOSPITALIZATION
Androgen deprivation therapy 0.260.49
5.19<0.001No androgen deprivation
therapy 0.21 2.35
Shahinian V.B. et al., N.E.J.M., 2005

Physical signs
• Height loss• Armspan-Height difference• Weight• Kyphosis• Wall-Occiput distance• Rib-Pelvis distance• Grip strength• Hand skinfold• Tooth count
• Height loss• Armspan-Height difference• Weight• Kyphosis• Wall-Occiput distance• Rib-Pelvis distance• Grip strength• Hand skinfold• Tooth count
• Height loss• Armspan-Height difference• Weight• Kyphosis• Wall-Occiput distance• Rib-Pelvis distance• Grip strength• Hand skinfold• Tooth count

Physical signs and osteoporosis: anthropometric variables
MENwith fractures
WOMENwith fractures
Sitting height * ↓ ↓
Leg length * = ↓
Arm span * = ↓
* relative to age-matched controls
Wang X.F. et al., Osteoporos. Int., 2004

Wall-occiput test for occult thoracic vertebral fractures

Rib-pelvis distance test for occult lumbar vertebral fractures
Siminoski K. et al., Am. J. Med., 2003

Physical examination
Genetic forms of osteoporosis
Pathognomic manifestations of diseases

Ehlers-Danlos syndrome
by permission of Prof. P. Filipponi

Physical examination
Genetic forms of osteoporosis
Pathognomic manifestations of diseases

Hyperthyroidism

Routine laboratory tests
• E.S.R.• Complete blood count• Calcium• Phosphorus• Creatinine• Alkaline phosphatase• Liver function tests (i.e. serum protein
electrophoresis, GT...)• 24-h urine calcium

If on the basis of these tests (or in relation to the physical examination), there is evidence of medical conditions associated with bone loss a definitive diagnosis should be pursued with appropriate testing

Rate of primary and secondary osteoporosis in women and men
women men
30%70% 45% 55%
Primaryosteoporosis
Secondaryosteoporosis

More focused laboratory testing (to uncover “occult” secondary causes of osteoporosis)
• s. ionized calcium• s. parathyroid hormone• s. 25(OH)D• hormones (s. testosterone, s. TSH, 24-hour
urine cortisol)• s. anti-(gliadin), -tissue transglutaminase
and -endomysial antibody• s. total tryptase• biochemical marker of bone remodelling• bone marrow aspiration• bone biopsy

Celiac disease among patients with osteoporosis
Stenson W.F. et al., Arch. Intern. Med.,2005
All Males Females
Patients with osteoporosis
266 25 241
Patients with celiac disease
9(3.4%)
2(8.0%)
7(2.9%)

BMD and fractures in alcoholics
Alcoholics(n = 51)
Controls(n = 31)
p
BMD at lumbar spine (g/cm2) 1,025 ± 0,135 1,055 ± 0,152 ns
BMD at femoral neck (g/cm2) 0,843 ± 0,121 0,854 ± 0,191 ns
BMD at total neck (g/cm2) 0,968 ± 0,122 1,005 ± 0,173 ns
Vertebral fractures (n,%) 16 (31,4%) 3 (9,7%) <0,021
Peripheral fractures (n,%) 21 (41,2%) 0 <0,000
All fractures (n,%) 28 (54,9%) 3 (9,7%) <0,000
Santori C. et al., (unpublished data)

Fractures in alcoholics according to WHO BMD criteria
Alcoholics with vertebral fractures
(n 16)
Alcoholics with vertebral and non vertebral fractures
(n 28)
Normali (n/%) 7 (43,7%) 16 (57,2%)
Osteopenia (n/%) 8 (50%) 9 (32,1%)
Osteoporosis (n/%) 1 (6,3%) 3 (10,7%)
Santori C. et al., (dati non pubblicati)

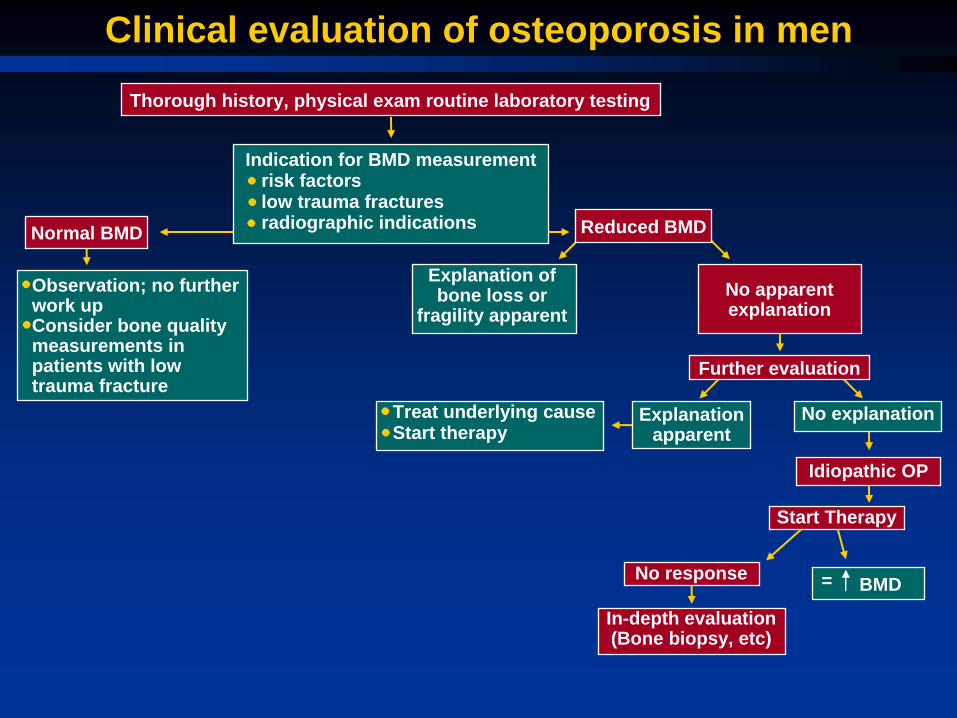
Clinical evaluation of osteoporosis in menThorough history, physical exam routine laboratory testing
Indication for BMD measurementrisk factorslow trauma fracturesradiographic indicationsNormal BMD
Observation; no further work up Consider bone quality measurements in patients with low trauma fracture
Explanation of bone loss or
fragility apparent
Treat underlying causeStart therapy
No apparent explanation
Explanation apparent
No explanation
Idiopathic OP
Start Therapy
No response BMD
In-depth evaluation (Bone biopsy, etc)
Further evaluation
Reduced BMD
=

Clinical evaluation of osteoporosis in menThorough history, physical exam routine laboratory testing
Indication for BMD measurementrisk factorslow trauma fracturesradiographic indicationsNormal BMD
Observation; no further work up Consider bone quality measurements in patients with low trauma fracture
Explanation of bone loss or
apparent fragility
Treat underlying causeStart therapy
No apparent explanation
apparent explanation
No explanation
Idiopathic OP
Start Therapy
No response BMD
In-depth evaluation (Bone biopsy, etc)
Further evaluation
Reduced BMD
=

Clinical evaluation of osteoporosis in menThorough history, physical exam routine laboratory testing
Indication for BMD measurementrisk factorslow trauma fracturesradiographic indicationsNormal BMD
Observation; no further work up Consider bone quality measurements in patients with low trauma fracture
Explanation of bone loss or
fragility apparent
Treat underlying causeStart therapy
No apparent explanation
Explanation apparent
No explanation
Idiopathic OP
Start Therapy
No response BMD
In-depth evaluation (Bone biopsy, etc)
Further evaluation
Reduced BMD
=

Clinical evaluation of osteoporosis in menThorough history, physical exam routine laboratory testing
Indication for BMD measurementrisk factorslow trauma fracturesradiographic indicationsNormal BMD
Observation; no further work up Consider bone quality measurements in patients with low trauma fracture
Explanation of bone loss or
apparent fragility
Treat underlying causeStart therapy
No apparent explanation
apparent explanation
No explanation
Idiopathic OP
Start Therapy
No response BMD
In-depth evaluation (Bone biopsy, etc)
Further evaluation
Reduced BMD
=
Clinical evaluation of osteoporosis in menThorough history, physical exam routine laboratory testing
Indication for BMD measurementrisk factorslow trauma fracturesradiographic indicationsNormal BMD
Observation; no further work up Consider bone quality measurements in patients with low trauma fracture
Explanation of bone loss or
fragility apparent
Treat underlying causeStart therapy
No apparent explanation
Explanation apparent
No explanation
Idiopathic OP
Start Therapy
No response BMD
In-depth evaluation (Bone biopsy, etc)
Further evaluation
Reduced BMD
=

Systemic mastocytosis
Is there a rolefor estrogen
determination?

Sex steroids in male idiopathic osteoporosis
Free
est
radi
ol(n
g/dL
)Fr
ee e
stra
diol
(ng/
dL)
Free
test
oste
rone
(ng/
dL)
Sonstertile 1
Sonstertile 1
Sonstertile 2
Sonstertile 2
Sonstertile 3
Sonstertile 3
Probands Sons Brothers
Matched controls
Matched controls
Matched controls
p=0.05 p<0.01
p<0.01
p<0.01
NS
NS
NS
NS
NS
0.06
0.06
0.04
0.04
0.02
0.02
0
0
25
20
10
15
5
0
Van Pottelbergh et al., J. Clin. Endocrinol. Metab., 2004

Male osteoporosis: Therapy
life-style modification (stop smoking, alcohol, etc.)
Physical activity
Adequate calcium intake (1200-1500 mg)
Adequate vitamin D supplementation (400-800 UI/die)
Drugs: hormonal replacement therapy(hypogonadism)Alendronate(Risedronate, PTH, …)

Alendronate for the treatment of osteoporosis in men
Orwoll E. et al., N.E.J.M., 2000
2.0
4
3
1.0
2
1
-1
2
0.0
0
0
0 12
Month
Mea
npe
rcen
tcha
nge
in B
one
Min
eral
Den
sity
Total Body
Trochanter
Femoral Neck
18 246
*
*
*
*
*
*
*
*
*
0 12 18 246
34
12
0
Hip**
* *
3
7
4
8
1
5
2
6
0
Lumbar Spine
**
**
*
Alendronate Placebo * p<0.001

Use of osteoporosis medication before and after hip fracture
0Calcium and
vitamin DClodronate
% o
f hip
frac
ture
patie
nts
Alendronate(10 mg)
Risedronate(5 mg)
Alendronate(70 mg)
OtherTherapies
10
20
30
40
50
60
70
80
BeforeAfter
MALES
Carnevale V. et al., Osteoporos. Int., 2006
No Therapy

Dropout curves with time of those patients who stopped therapy, with respect age in classes
0,9
0,8
0,7
0,6
0,5
0,4
0,3
0,2
0,1
00 200 400 600
Days
Freq
uenc
ies
Den
sitie
sof
Dro
p O
uts
800 1000 1200 1400
< 73 yrs74 - 81 yrs82+ yrsOverall
MALES
Carnevale V. et al., Osteoporos. Int., 2006