verification of the new ecmwf era-interim reanalysis over ... · from the t95 to the t255...
TRANSCRIPT

Hydrol. Earth Syst. Sci., 15, 647–666, 2011www.hydrol-earth-syst-sci.net/15/647/2011/doi:10.5194/hess-15-647-2011© Author(s) 2011. CC Attribution 3.0 License.
Hydrology andEarth System
Sciences
Verification of the new ECMWF ERA-Interim reanalysis overFrance
C. Szczypta1, J.-C. Calvet1, C. Albergel1, G. Balsamo2, S. Boussetta2, D. Carrer1, S. Lafont1, and C. Meurey1
1CNRM/GAME, (Meteo-France, CNRS), URA 1357, Toulouse, France2European Centre for Medium-range Weather Forecasts (ECMWF), Reading, UK
Received: 2 September 2010 – Published in Hydrol. Earth Syst. Sci. Discuss.: 22 September 2010Revised: 20 February 2011 – Accepted: 21 February 2011 – Published: 25 February 2011
Abstract. An evaluation of the global ECMWF atmosphericreanalysis ERA-Interim (with a 0.5◦ grid) is performed overFrance, based on the high resolution (8 km) SAFRAN atmo-spheric reanalysis. The ERA-Interim precipitation, Incom-ing Solar Radiation (ISR), air temperature, air humidity, andwind speed, are compared with their SAFRAN counterparts.Also, interpolated in situ ISR observations are used in orderto consolidate the evaluation of this variable. The daily pre-cipitation estimates produced by ERA-Interim over Francecorrelate very well with SAFRAN. However, the values areunderestimated by 27%. A GPCP-corrected version of ERA-Interim is less biased (13%). The ERA-Interim estimates ofISR correlate very well with SAFRAN and with in situ obser-vations on a daily basis. Whereas SAFRAN underestimatesthe ISR by 6 Wm−2, ERA-Interim overestimates the ISR by10 Wm−2. In order to assess the impact of the ERA-Interimerrors, simulations of the ISBA-A-gs land surface modelare performed over the SMOSREX grassland site in south-western France using ERA-Interim (with and without GPCPrescaling) and SAFRAN. Latent and sensible heat fluxes aresimulated, together with carbon dioxide fluxes. The rescaledERA-Interim performs better than the original ERA-Interimand permits to achieve flux scores similar to those obtainedwith SAFRAN.
1 Introduction
Soil moisture controls the exchange of water and heat energybetween the land surface and the atmosphere through evap-oration and plant transpiration. As a result, it is a key vari-able in short- and medium-range meteorological modelling,
Correspondence to:J.-C. Calvet([email protected])
climate and hydrological studies. A significant amount ofstudies have been conducted to obtain soil moisture prod-ucts. For that purpose, land surface modelling (Dirmeyer etal., 1999; Georgakakos and Carpenter, 2006 among others)and remote sensing (Wagner et al., 1999a, b; Njoku et al.,2003; Kerr et al., 2007) techniques are used. Another vari-able, the Leaf Area Index (LAI), is defined as the total onesided area of photosynthetic tissues per unit ground surfacearea. Monitoring the distribution and changes of LAI is im-portant to monitor vegetation. It is a fundamental variable inland-surface models. This variable controls the link betweenthe biosphere and the atmosphere through various processessuch as photosynthesis, respiration, transpiration, and raininterception. Long time series of accurate LAI products areessential for climate change studies, and to validate biochem-ical models (Brut et al., 2009).
In the framework of the HYMEX (HYdrological cyclein the Mediterranean EXperiment) project (HYMEX WhiteBook, 2008) and particularly with the aim of developing asoil moisture and vegetation biomass climatology over Eu-rope and North Africa, this study investigates the quality ofthe European Center for Medium range Weather Forecast-ing (ECMWF) ERA-Interim (ERA-I) gridded atmosphericreanalysis over France, where a high resolution atmosphericanalysis (Systeme d’Analyse Fournissant des Renseigne-ments A la Neige – SAFRAN; Durand et al., 1993) is avail-able. In the HYMEX project, this climatology will be usedto drive land surface and runoff models, like the Total RunoffIntegrating Pathways (TRIP; Oki et al., 1997) coupled to theInteractions between Soil Biosphere and Atmosphere (ISBA)model (Noilhan and Planton, 1989; Noilhan and Mahfouf,1996) to build a soil moisture, LAI and river flow clima-tology over the Mediterranean basin. The TRIP model isable to isolate the river basins, inter-basin translation of waterthrough river channels, as well as collect and route runoff tothe river mouth(s) for all the major rivers (Oki et al., 1998).
Published by Copernicus Publications on behalf of the European Geosciences Union.

648 C. Szczypta et al.: Verification of the new ECMWF ERA-Interim
The river flow simulated by TRIP can be used for the verifi-cation of the variables simulated by the land surface modelbecause the river flow is driven by the runoff simulated byISBA. Because the Mediterranean basin will probably beaffected by climate change to a large extent (Gibelin andDeque, 2003), it is important to build a monitoring system ofthe land surface variables and of the hydrological variables(e.g. river flow) over this region. The ISBA model is drivenby atmospheric variables such as precipitation, downwellingradiation (shortwave and longwave), wind speed, air temper-ature and air humidity. Over France (Fig. 1), the SAFRANanalysis provides high resolution (8 km) gridded atmosphericvariables. Over the whole Mediterranean domain, high res-olution gridded atmospheric reanalyses are not available sofar. The ERA-I data produced by the ECMWF could be usedto drive the ISBA model at a spatial resolution of 0.5◦, andto produce surface flux and runoff estimates.
In order to verify the quality of the low resolution ERA-I data, the SAFRAN reanalysis can be used as a reference,over France. In the case of Incoming Solar Radiation (ISR),another high resolution product (Brion et al., 2005), based onin situ observations, is used as well. In this study, the ERA-I estimates of atmospheric variables (precipitation, ISR, airtemperature (Ta), air specific humidity (qa) and wind speed)are compared for different temporal scales. First, a mul-tiyear evaluation is performed over the 1991–2008 period,except for ISR as the reference data are only available overthe 1995–2006 period. Second, ERA-I is compared in detailwith the SAFRAN product for two years: 2001 and 2003. In2003, France was affected by a large scale heat wave, whichcaused a severe drought in many areas. On the other hand,2001 was a rather normal year, representative of the climatol-ogy. Finally, the impact of using ERA-I instead of SAFRANin ISBA is assessed over a grassland site in southwesternFrance, for which surface flux and soil moisture profile ob-servations are available.
2 Data and methods
This section presents ERA-I and the different data sets usedfor the verification of the ERA-I atmospheric variables at thesurface. In order to assess the impact of using ERA-I in-stead of SAFRAN, the ISBA model was run using the twoatmospheric reanalyses over the SMOSREX grassland site(De Rosnay et al., 2006) in southwestern France for a periodof seven years (2001–2007), as in Albergel et al. (2010a, b).The simulated soil moisture and surface energy, water, andCO2 fluxes derived from ERA-I were compared with the ref-erence SAFRAN-derived values at the SMOSREX site.
2.1 Structure of data sets
In this Section, the various atmospheric analyses used in thisstudy are presented. Different time slices are considered de-pending on the availability of the data:
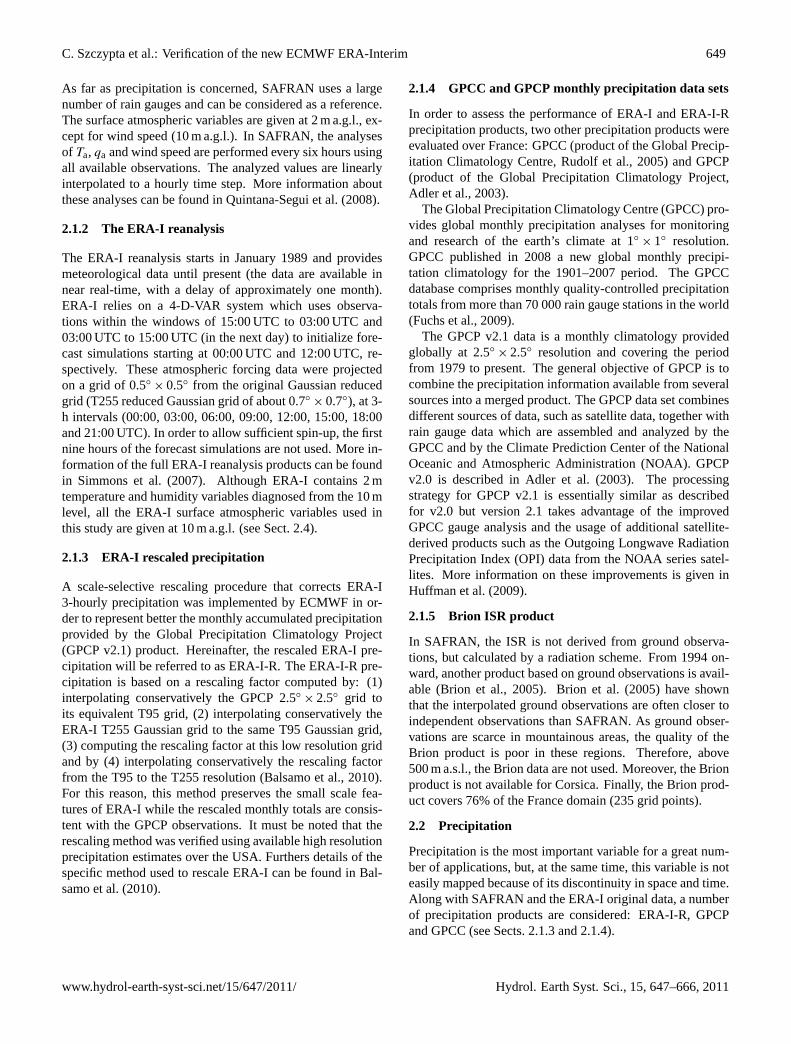
Fig. 1. Map of France, and main areas discussed in this study.
– 1991–2008: the SAFRAN and ERA-I analyses, and theGPCP precipitation products
– 1991–2007: the GPCC precipitation product
– 1995–2006: the Brion et al. (2005) ISR product
– 2001–2007: ISBA simulations for the SMOSREX site(Albergel et al., 2010b).
Since these products are available at different spatial reso-lutions, the comparisons performed in this study are basedon the ERA-I 0.5◦ resolution grid, corresponding to 308 gridcells over France. In particular, the high resolution (8 km)SAFRAN and Brion grid cells were aggregated at the 0.5◦
resolution of ERA-I. Both SAFRAN and ERA-I analysesprovide the atmospheric variables needed to drive land sur-face models: precipitation, ISR,Ta, qa, wind speed, andthe incoming longwave radiation. The latter is studied inSect. 3.4.
2.1.1 The SAFRAN analysis
SAFRAN is a mesoscale atmospheric analysis system forsurface variables. It produces an analysis at the hourly timestep using atmospheric simulations and ground data observa-tions. SAFRAN is based on climatically homogeneous zonesand is able to take topography effects into account. Origi-nally intended for mountainous areas, it was later extendedto cover France. A detailed validation of the SAFRAN anal-ysis over France (Quintana et al., 2008) and feedbacks fromthe operational implementation showed that SAFRAN wasrobust (wind, temperature, relative humidity, precipitation...)and provided accurate meteorological values to force ISBA.
Hydrol. Earth Syst. Sci., 15, 647–666, 2011 www.hydrol-earth-syst-sci.net/15/647/2011/
C. Szczypta et al.: Verification of the new ECMWF ERA-Interim 649
As far as precipitation is concerned, SAFRAN uses a largenumber of rain gauges and can be considered as a reference.The surface atmospheric variables are given at 2 m a.g.l., ex-cept for wind speed (10 m a.g.l.). In SAFRAN, the analysesof Ta, qa and wind speed are performed every six hours usingall available observations. The analyzed values are linearlyinterpolated to a hourly time step. More information aboutthese analyses can be found in Quintana-Segui et al. (2008).
2.1.2 The ERA-I reanalysis
The ERA-I reanalysis starts in January 1989 and providesmeteorological data until present (the data are available innear real-time, with a delay of approximately one month).ERA-I relies on a 4-D-VAR system which uses observa-tions within the windows of 15:00 UTC to 03:00 UTC and03:00 UTC to 15:00 UTC (in the next day) to initialize fore-cast simulations starting at 00:00 UTC and 12:00 UTC, re-spectively. These atmospheric forcing data were projectedon a grid of 0.5◦ × 0.5◦ from the original Gaussian reducedgrid (T255 reduced Gaussian grid of about 0.7◦
× 0.7◦), at 3-h intervals (00:00, 03:00, 06:00, 09:00, 12:00, 15:00, 18:00and 21:00 UTC). In order to allow sufficient spin-up, the firstnine hours of the forecast simulations are not used. More in-formation of the full ERA-I reanalysis products can be foundin Simmons et al. (2007). Although ERA-I contains 2 mtemperature and humidity variables diagnosed from the 10 mlevel, all the ERA-I surface atmospheric variables used inthis study are given at 10 m a.g.l. (see Sect. 2.4).
2.1.3 ERA-I rescaled precipitation
A scale-selective rescaling procedure that corrects ERA-I3-hourly precipitation was implemented by ECMWF in or-der to represent better the monthly accumulated precipitationprovided by the Global Precipitation Climatology Project(GPCP v2.1) product. Hereinafter, the rescaled ERA-I pre-cipitation will be referred to as ERA-I-R. The ERA-I-R pre-cipitation is based on a rescaling factor computed by: (1)interpolating conservatively the GPCP 2.5◦
× 2.5◦ grid toits equivalent T95 grid, (2) interpolating conservatively theERA-I T255 Gaussian grid to the same T95 Gaussian grid,(3) computing the rescaling factor at this low resolution gridand by (4) interpolating conservatively the rescaling factorfrom the T95 to the T255 resolution (Balsamo et al., 2010).For this reason, this method preserves the small scale fea-tures of ERA-I while the rescaled monthly totals are consis-tent with the GPCP observations. It must be noted that therescaling method was verified using available high resolutionprecipitation estimates over the USA. Furthers details of thespecific method used to rescale ERA-I can be found in Bal-samo et al. (2010).
2.1.4 GPCC and GPCP monthly precipitation data sets
In order to assess the performance of ERA-I and ERA-I-Rprecipitation products, two other precipitation products wereevaluated over France: GPCC (product of the Global Precip-itation Climatology Centre, Rudolf et al., 2005) and GPCP(product of the Global Precipitation Climatology Project,Adler et al., 2003).
The Global Precipitation Climatology Centre (GPCC) pro-vides global monthly precipitation analyses for monitoringand research of the earth’s climate at 1◦
× 1◦ resolution.GPCC published in 2008 a new global monthly precipi-tation climatology for the 1901–2007 period. The GPCCdatabase comprises monthly quality-controlled precipitationtotals from more than 70 000 rain gauge stations in the world(Fuchs et al., 2009).
The GPCP v2.1 data is a monthly climatology providedglobally at 2.5◦ × 2.5◦ resolution and covering the periodfrom 1979 to present. The general objective of GPCP is tocombine the precipitation information available from severalsources into a merged product. The GPCP data set combinesdifferent sources of data, such as satellite data, together withrain gauge data which are assembled and analyzed by theGPCC and by the Climate Prediction Center of the NationalOceanic and Atmospheric Administration (NOAA). GPCPv2.0 is described in Adler et al. (2003). The processingstrategy for GPCP v2.1 is essentially similar as describedfor v2.0 but version 2.1 takes advantage of the improvedGPCC gauge analysis and the usage of additional satellite-derived products such as the Outgoing Longwave RadiationPrecipitation Index (OPI) data from the NOAA series satel-lites. More information on these improvements is given inHuffman et al. (2009).
2.1.5 Brion ISR product
In SAFRAN, the ISR is not derived from ground observa-tions, but calculated by a radiation scheme. From 1994 on-ward, another product based on ground observations is avail-able (Brion et al., 2005). Brion et al. (2005) have shownthat the interpolated ground observations are often closer toindependent observations than SAFRAN. As ground obser-vations are scarce in mountainous areas, the quality of theBrion product is poor in these regions. Therefore, above500 m a.s.l., the Brion data are not used. Moreover, the Brionproduct is not available for Corsica. Finally, the Brion prod-uct covers 76% of the France domain (235 grid points).
2.2 Precipitation
Precipitation is the most important variable for a great num-ber of applications, but, at the same time, this variable is noteasily mapped because of its discontinuity in space and time.Along with SAFRAN and the ERA-I original data, a numberof precipitation products are considered: ERA-I-R, GPCPand GPCC (see Sects. 2.1.3 and 2.1.4).
www.hydrol-earth-syst-sci.net/15/647/2011/ Hydrol. Earth Syst. Sci., 15, 647–666, 2011
650 C. Szczypta et al.: Verification of the new ECMWF ERA-Interim
In order to verify the quality of ERA-I and to assessto what extent the rescaling of ERA-I improves the pre-cipitation estimates, a comparison of the precipitation datasets is performed at different temporal and spatial scales.First, average precipitation values for the whole France do-main, derived from ERA-I and ERA-I-R, are compared withSAFRAN with monthly and daily time steps. Second, thesame comparison is performed at the scale of the ERA-I grid(0.5◦). Three scores are considered: the square correlationcoefficient (temporal correlation), the mean bias, and the rootmean square error (RMSE). Also, the spatial correlations be-tween SAFRAN and either ERA-I or ERA-I-R are investi-gated, at different seasons. Finally, a month-by-month com-parison between all the data sets presented before is made forthe years 2001 and 2003.
2.3 Incoming Solar Radiation (ISR)
For the ISR variable, ERA-I and SAFRAN are both com-pared in detail with the Brion data set, for the years 2001and 2003. A multiyear evaluation is performed over the1995–2006 period. The ERA-I ISR is also compared withSAFRAN for the whole domain (308 grid cells). As for pre-cipitation, the inter-comparison of ISR products is performedat different temporal and spatial scales.
2.4 Air temperature, air humidity and wind speed
Air temperature, air humidity and wind speed providedby ERA-I (Simmons et al., 2010) are compared withSAFRAN. The comparison is performed at two times: morn-ing (06:00 UTC) and noon (12:00 UTC). For both morningand noon variables, statistical scores (square correlation co-efficient, bias and RMSE) were computed for the whole1991–2008 period. In the case ofTa andqa, two additionaltimes were considered, in order to better sample the diurnalcycle: 00:00 UTC and 18:00 UTC. It is important to note thatthe data are estimated at different heights. In SAFRAN,Taandqa are analyzed at 2 m and wind speed at 10 m above thesurface. In this study, the ERA-I instantaneous atmosphericvariables are all extracted from the lowest atmospheric modellevel, at 10 m above the surface. Indeed, Pitman et al. (2009)showed that diagnosed 2 m temperature may vary a lot fromone atmospheric analysis to another, and they suggested touse of the variables corresponding to the lowest atmosphericmodel level. This ensures the internal consistency of thefields and permits some flexibility in the choice of verticalinterpolation within the surface boundary layer (e.g. usingthe stability functions of the modelling platform). However,in order to assess the impact of comparing SAFRAN andERA-I Ta andqa at different heights, the ERA-ITa andqaat 2 m were investigated for the year 2001 (see Sect. 3.3).
2.5 Impact study on the SMOSREX site
The impact of using ERA-I is assessed on the SMOSREXgrassland site in southwestern France, based on existingSAFRAN-driven ISBA-A-gs simulations validated usingground observations (Albergel et al., 2010b).
2.5.1 The SMOSREX experimental site
The SMOSREX (Surface Monitoring Of the Soil ReservoirEXperiment) experimental site is located in Mauzac, nearToulouse, in the south of France (De Rosnay et al., 2006).It is a field campaign, which has been in operation since Jan-uary 2001. Part of the SMOSREX experimental site is cov-ered by a grassland of about 3.2×10⁴ m2 (180 m× 180 m),mown once a year at wintertime. At SMOSREX, all the at-mospheric forcing variables required to run ISBA-A-gs aremeasured: there are continuous ground measurements of at-mospheric pressure, air humidity, air temperature, long-waveand short-wave incident radiation, rain rate, wind speed. Anumber of biophysical variables and surface fluxes are ob-served at the SMOSREX site: soil moisture (observed at tendepths and permitting to estimate the root-zone soil moisturecontentw2), LAI, CO2, sensible heat (H) and latent heat(LE) flux measurements.
2.5.2 The ISBA-A-gs land surface model
On the basis of ISBA (Noilhan and Planton, 1989; Noilhanand Mahfouf, 1996), Calvet et al. (1998) developed ISBA-A-gs. It is a CO2 responsive version of ISBA which ac-counts for the effect of the atmospheric CO2 concentrationand for the interactions between all environmental factors onthe stomatal aperture. In ISBA-A-gs, photosynthesis and itscoupling with stomatal conductance at a leaf level are ac-counted for. The vegetation net assimilation is computed andused as an input to a simple growth sub-model able to predictLAI. ISBA-A-gs is able to simulate GPP (Gross Primary Pro-duction), NEE (Net Ecosystem Exchange), LAI, the energyand mass fluxes such as sensible and latent heat fluxes, andsoil moisture. ISBA-A-gs was implemented in the SURFEX(SURFace Externalisee) modelling platform (Le Moigne etal., 2009). In this study, SURFEX is used “offline”, i.e. with-out coupling the land surface with an atmospheric model.First, a comparison of the different atmospheric variables be-tween SAFRAN and ERA-I is performed on the grid cell cor-responding to the SMOSREX site for a 18-year (1991–2008)period, corresponding to the available ERA-I dataset. Sec-ond, ISBA-A-gs is used to simulate the SMOSREX grass-land for the 2001–2007 period, based on these two atmo-spheric forcing data sets. The same comparison is made withthe ERA-I-R precipitation.
Over the SMOSREX grassland, a number of studies haveshown that the ISBA-A-gs model is able to simulate, reason-ably well, the water, energy, and CO2 fluxes, the LAI and
Hydrol. Earth Syst. Sci., 15, 647–666, 2011 www.hydrol-earth-syst-sci.net/15/647/2011/
C. Szczypta et al.: Verification of the new ECMWF ERA-Interim 651
Table 1. Precipitation over France in 2001, 2003 and over the 1991–2008 period: temporal and spatial squared correlation coefficient andRMSE of ERA-I and ERA-I-R with respect to the SAFRAN analysis.
Comparison Score ERA-I ERA-I-R ERA-I ERA-I-R ERA-I ERA-I-Rtype 2001 2001 2003 2003 [1991–2008] [1991–2008]
Temporal R2 0.89 0.89 0.90 0.90 0.89 0.89(daily values) RMSE (mm day−1) 1.26 1.09 1.12 0.94 1.27 1.07
Spatial R2 0.59 0.58 0.48 0.54 0.48 0.54(308 grid cells) RMSE (mm year−1) 326 235 274 179 309 207
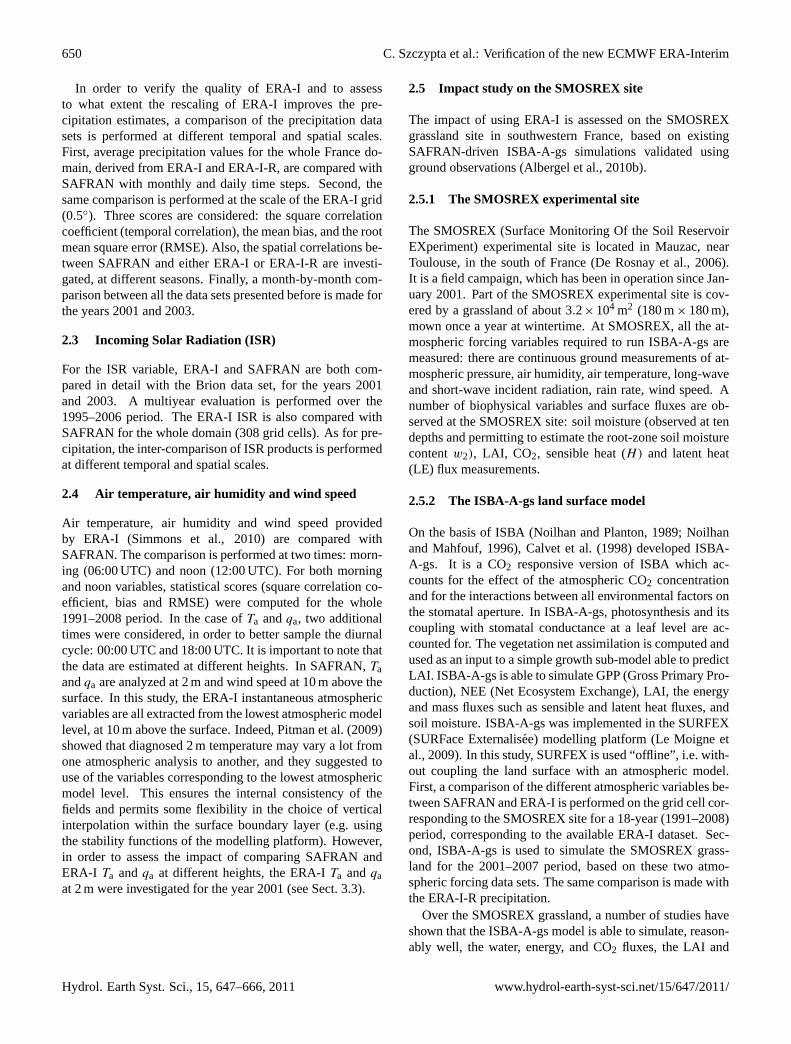
Fig. 2. Mean daily precipitation over France for SAFRAN, ERA-Iand ERA-I-R: from (top) January to June 2001, and from (bottom)July to December 2001.
the root-zone soil moisture (e.g. Albergel et al., 2010a, b),using either the locally observed atmospheric forcing or theatmospheric forcing from the nearest SAFRAN grid point.In this study, ISBA-A-gs simulations are produced using theSAFRAN atmospheric forcing as a reference, and, also, us-ing ERA-I and ERA-I-R. The simulated biophysical vari-ables (w2, LAI and wg) and fluxes (CO2, H and LE) are allconsidered for the 2001–2007 period (Albergel et al., 2010b).In order to evaluate the impact of using ERA-I or ERA-I-Rin ISBA-A-gs, and to quantify the departure from the refer-ence SAFRAN-driven simulation, a number of scores werecomputed, compared and analyzed: square correlation coef-ficient, mean bias, RMSE and, for soil moisture and LAI, theNash-Sutcliffe coefficient (NASH).
In order to assess the relative impact on the ISBA-A-gssimulations of precipitation and ISR, which are the most bi-ased ERA-I variables for this site, ISBA-A-gs was run in
three configurations: (1) SAFRAN, (2) SAFRAN, except forSAFRAN precipitation replaced by the ERA-I-R precipita-tion, and (3) SAFRAN, except for SAFRAN ISR replacedby the ERA-I ISR.
3 Results
This section presents the results obtained for each atmo-spheric variable. The comparison is performed over the1991–2008 period for all the forcing variables, except forISR covering the 1995–2006 period. In addition, Tables 1, 3,and 4 give specific score values for the years 2001 and 2003.
3.1 Precipitation data
The purpose of this Section is to evaluate the ERA-I pre-cipitation data against the precipitation derived from theSAFRAN analysis. In order to make a first assessment ofERA-I, Fig. 2 presents the mean daily precipitation overFrance for 2001, through time series derived from SAFRANand ERA-I. At the scale of the whole country, the ERA-I mean daily precipitation is very close to SAFRAN. Fig-ure 2 shows that a significant correlation exists between thetwo data sets (R2 = 0.89): the two curves are very similarthroughout 2001 and the precipitation events occur at thesame time. It can be noticed that differences between the twodata sets may arise, particularly in January, February, April,August and September for this particular year. This bias isalways in the same direction: on a daily scale, ERA-I tendsto underestimate the precipitation.
Moreover, it appears that the ERA-I-R data set is closer toSAFRAN than the original ERA-I. The rescaling improvesthe quality of the precipitation estimates. Although smallerdifferences are observed between ERA-I-R and SAFRAN, itcan be noted that when the precipitation is more abundant(in March, April, October 2001), ERA-I-R tends to overes-timate the precipitation. Similar results are found for 2003(not shown).
Figure 3 presents the same results as Fig. 2, except formonthly precipitation, over the whole 1991–2008 period, andis completed by Fig. 4, focusing on 2001 and 2003 with
www.hydrol-earth-syst-sci.net/15/647/2011/ Hydrol. Earth Syst. Sci., 15, 647–666, 2011
652 C. Szczypta et al.: Verification of the new ECMWF ERA-Interim
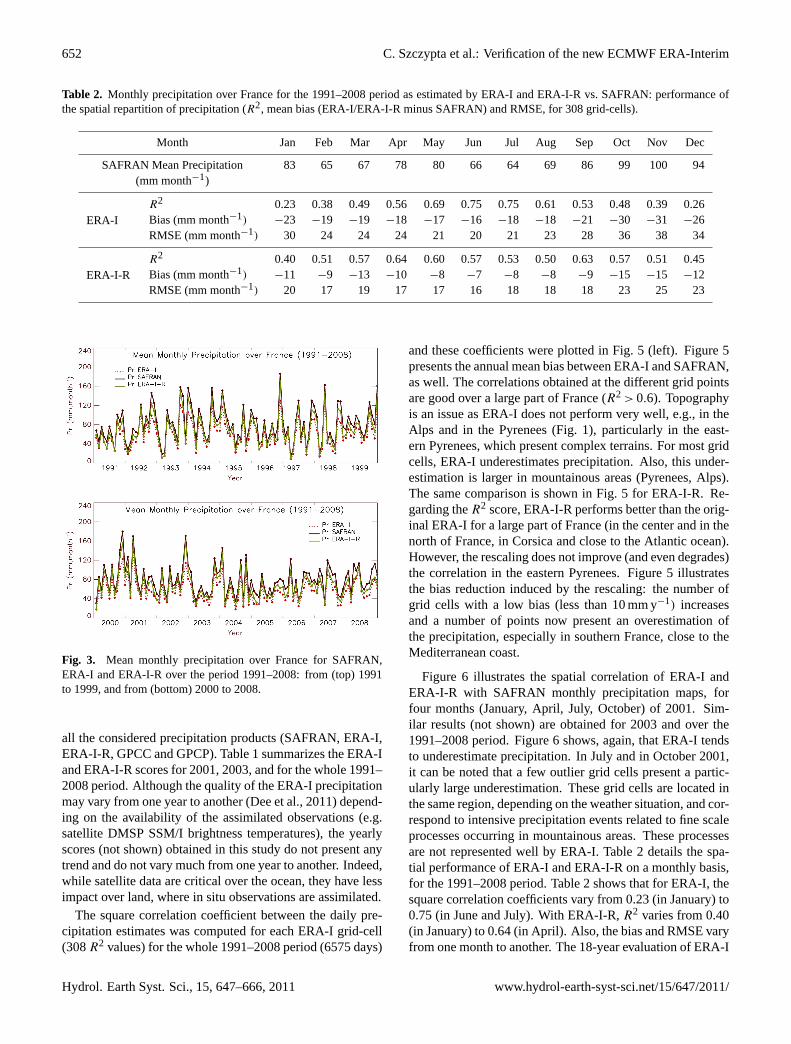
Table 2. Monthly precipitation over France for the 1991–2008 period as estimated by ERA-I and ERA-I-R vs. SAFRAN: performance ofthe spatial repartition of precipitation (R2, mean bias (ERA-I/ERA-I-R minus SAFRAN) and RMSE, for 308 grid-cells).
Month Jan Feb Mar Apr May Jun Jul Aug Sep Oct Nov Dec
SAFRAN Mean Precipitation 83 65 67 78 80 66 64 69 86 99 100 94(mm month−1)
ERA-IR2 0.23 0.38 0.49 0.56 0.69 0.75 0.75 0.61 0.53 0.48 0.39 0.26Bias (mm month−1) −23 −19 −19 −18 −17 −16 −18 −18 −21 −30 −31 −26RMSE (mm month−1) 30 24 24 24 21 20 21 23 28 36 38 34
ERA-I-RR2 0.40 0.51 0.57 0.64 0.60 0.57 0.53 0.50 0.63 0.57 0.51 0.45Bias (mm month−1) −11 −9 −13 −10 −8 −7 −8 −8 −9 −15 −15 −12RMSE (mm month−1) 20 17 19 17 17 16 18 18 18 23 25 23
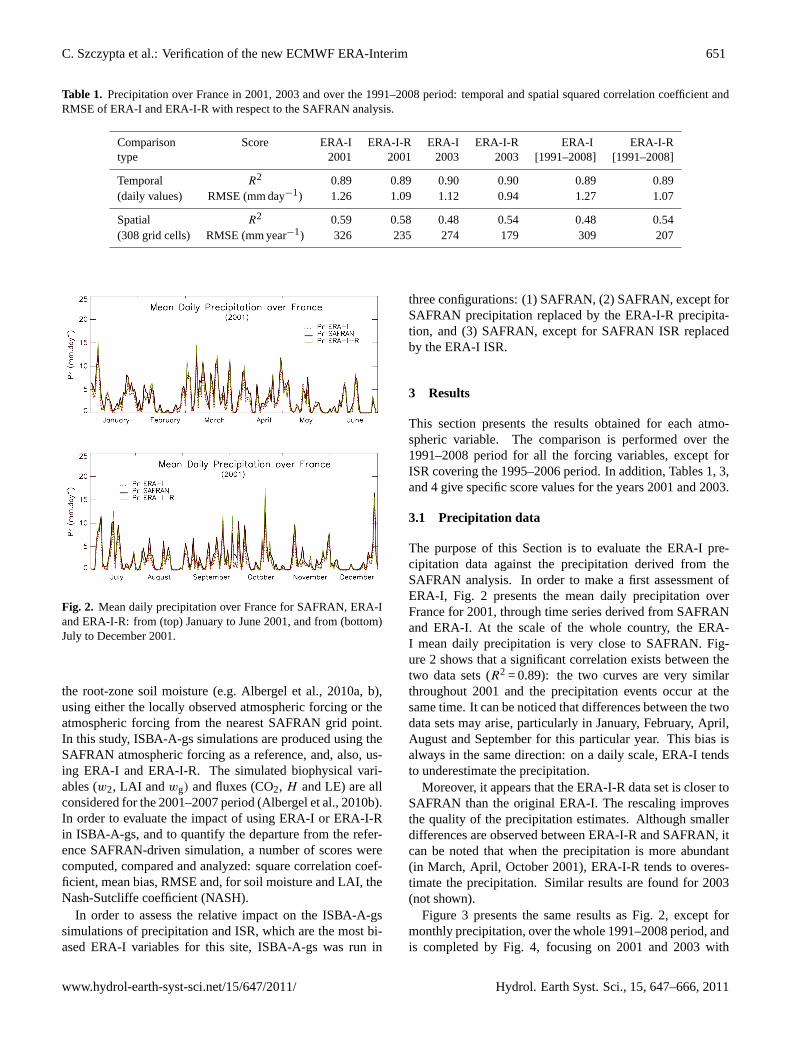
Fig. 3. Mean monthly precipitation over France for SAFRAN,ERA-I and ERA-I-R over the period 1991–2008: from (top) 1991to 1999, and from (bottom) 2000 to 2008.
all the considered precipitation products (SAFRAN, ERA-I,ERA-I-R, GPCC and GPCP). Table 1 summarizes the ERA-Iand ERA-I-R scores for 2001, 2003, and for the whole 1991–2008 period. Although the quality of the ERA-I precipitationmay vary from one year to another (Dee et al., 2011) depend-ing on the availability of the assimilated observations (e.g.satellite DMSP SSM/I brightness temperatures), the yearlyscores (not shown) obtained in this study do not present anytrend and do not vary much from one year to another. Indeed,while satellite data are critical over the ocean, they have lessimpact over land, where in situ observations are assimilated.
The square correlation coefficient between the daily pre-cipitation estimates was computed for each ERA-I grid-cell(308R2 values) for the whole 1991–2008 period (6575 days)
and these coefficients were plotted in Fig. 5 (left). Figure 5presents the annual mean bias between ERA-I and SAFRAN,as well. The correlations obtained at the different grid pointsare good over a large part of France (R2 > 0.6). Topographyis an issue as ERA-I does not perform very well, e.g., in theAlps and in the Pyrenees (Fig. 1), particularly in the east-ern Pyrenees, which present complex terrains. For most gridcells, ERA-I underestimates precipitation. Also, this under-estimation is larger in mountainous areas (Pyrenees, Alps).The same comparison is shown in Fig. 5 for ERA-I-R. Re-garding theR2 score, ERA-I-R performs better than the orig-inal ERA-I for a large part of France (in the center and in thenorth of France, in Corsica and close to the Atlantic ocean).However, the rescaling does not improve (and even degrades)the correlation in the eastern Pyrenees. Figure 5 illustratesthe bias reduction induced by the rescaling: the number ofgrid cells with a low bias (less than 10 mm y−1) increasesand a number of points now present an overestimation ofthe precipitation, especially in southern France, close to theMediterranean coast.
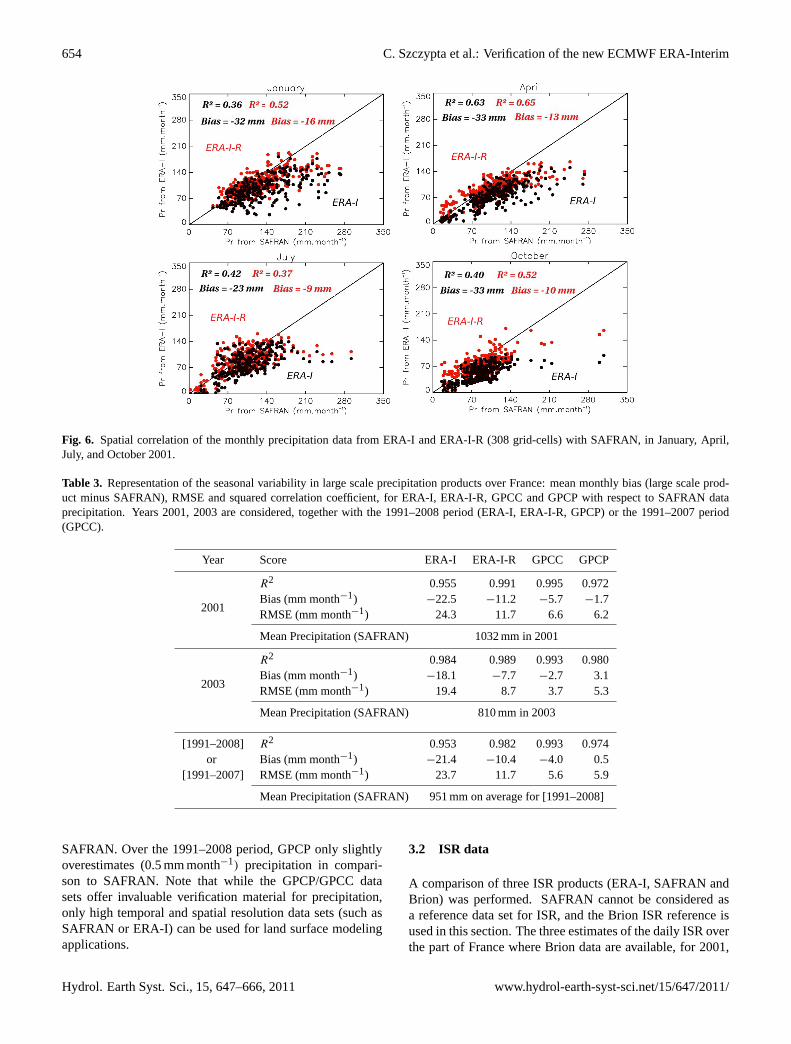
Figure 6 illustrates the spatial correlation of ERA-I andERA-I-R with SAFRAN monthly precipitation maps, forfour months (January, April, July, October) of 2001. Sim-ilar results (not shown) are obtained for 2003 and over the1991–2008 period. Figure 6 shows, again, that ERA-I tendsto underestimate precipitation. In July and in October 2001,it can be noted that a few outlier grid cells present a partic-ularly large underestimation. These grid cells are located inthe same region, depending on the weather situation, and cor-respond to intensive precipitation events related to fine scaleprocesses occurring in mountainous areas. These processesare not represented well by ERA-I. Table 2 details the spa-tial performance of ERA-I and ERA-I-R on a monthly basis,for the 1991–2008 period. Table 2 shows that for ERA-I, thesquare correlation coefficients vary from 0.23 (in January) to0.75 (in June and July). With ERA-I-R,R2 varies from 0.40(in January) to 0.64 (in April). Also, the bias and RMSE varyfrom one month to another. The 18-year evaluation of ERA-I
Hydrol. Earth Syst. Sci., 15, 647–666, 2011 www.hydrol-earth-syst-sci.net/15/647/2011/

C. Szczypta et al.: Verification of the new ECMWF ERA-Interim 653
Fig. 4. Mean monthly precipitation over France for SAFRAN, ERA-I, ERA-I-R, GPCC and GPCP: (left) 2001, and (right) 2003.
Fig. 5. Daily precipitation estimates over the 1991–2008 period: (top) ERA-I and (bottom) ERA-I-R vs. SAFRAN in terms of (left) temporalcorrelation (R2), (centre) mean bias and (right) mean relative bias (mean bias/mean precipitation value).
and ERA-I-R shows that the biases on precipitation dependsignificantly on the precipitation amount. At summertime,when the monthly precipitation presents low values, the bi-ases are smaller. On average, ERA-I and ERA-I-R under-estimate the reference SAFRAN data by 27% and by 13%,respectively.
In order to assess the quality of ERA-I and ERA-I-R, rel-ative to other global precipitation estimates, a comparisonwith the GPCC and GPCP data sets was performed. Figure 4shows the mean monthly precipitation for 2001 and 2003, for
all these data sets (SAFRAN, ERA-I, ERA-I-R, GPCP andGPCC). Both GPCC and GPCP monthly estimates are closerto SAFRAN than ERA-I (either rescaled or not). Table 3presents the scores obtained for this comparison (2001, 2003,and the whole 1991–2008 period) and shows that the correla-tion between GPCC, GPCP and SAFRAN (on a monthly ba-sis) is very good and that the bias is small. ERA-I is rescaledwith GPCP data but it can be noticed that the mean an-nual bias (for 2001 and 2003) between GPCP and SAFRANis still smaller than the mean bias between ERA-I-R and
www.hydrol-earth-syst-sci.net/15/647/2011/ Hydrol. Earth Syst. Sci., 15, 647–666, 2011
654 C. Szczypta et al.: Verification of the new ECMWF ERA-Interim
Fig. 6. Spatial correlation of the monthly precipitation data from ERA-I and ERA-I-R (308 grid-cells) with SAFRAN, in January, April,July, and October 2001.
Table 3. Representation of the seasonal variability in large scale precipitation products over France: mean monthly bias (large scale prod-uct minus SAFRAN), RMSE and squared correlation coefficient, for ERA-I, ERA-I-R, GPCC and GPCP with respect to SAFRAN dataprecipitation. Years 2001, 2003 are considered, together with the 1991–2008 period (ERA-I, ERA-I-R, GPCP) or the 1991–2007 period(GPCC).
Year Score ERA-I ERA-I-R GPCC GPCP
2001
R2 0.955 0.991 0.995 0.972Bias (mm month−1) −22.5 −11.2 −5.7 −1.7RMSE (mm month−1) 24.3 11.7 6.6 6.2
Mean Precipitation (SAFRAN) 1032 mm in 2001
2003
R2 0.984 0.989 0.993 0.980Bias (mm month−1) −18.1 −7.7 −2.7 3.1RMSE (mm month−1) 19.4 8.7 3.7 5.3
Mean Precipitation (SAFRAN) 810 mm in 2003
[1991–2008] R2 0.953 0.982 0.993 0.974or Bias (mm month−1) −21.4 −10.4 −4.0 0.5
[1991–2007] RMSE (mm month−1) 23.7 11.7 5.6 5.9
Mean Precipitation (SAFRAN) 951 mm on average for [1991–2008]
SAFRAN. Over the 1991–2008 period, GPCP only slightlyoverestimates (0.5 mm month−1) precipitation in compari-son to SAFRAN. Note that while the GPCP/GPCC datasets offer invaluable verification material for precipitation,only high temporal and spatial resolution data sets (such asSAFRAN or ERA-I) can be used for land surface modelingapplications.
3.2 ISR data
A comparison of three ISR products (ERA-I, SAFRAN andBrion) was performed. SAFRAN cannot be considered asa reference data set for ISR, and the Brion ISR reference isused in this section. The three estimates of the daily ISR overthe part of France where Brion data are available, for 2001,
Hydrol. Earth Syst. Sci., 15, 647–666, 2011 www.hydrol-earth-syst-sci.net/15/647/2011/

C. Szczypta et al.: Verification of the new ECMWF ERA-Interim 655
Fig. 7. Mean daily ISR over part of France where there are Briondata (235 grid cells) for SAFRAN, ERA-I and Brion: from (top)January to June 2001, and from (bottom) July to December 2001.
are presented in Fig. 7. Similar results are obtained for 2003and over the 1995–2006 period (not shown). At the scaleof the France domain, the three ISR estimates present sim-ilar day-to-day variations. ERA-I correlates very well withSAFRAN and Brion (R2 = 0.96 for SAFRAN andR2 = 0.98for Brion). At wintertime, when the ISR is low, the 3 esti-mates are almost the same, and the bias is close to zero. Atsummertime, when the ISR is high, more differences are ob-served between the three data sets. ERA-I clearly has highervalues from February to September. Figure 8 presents thesame comparison but for a monthly time step, over the 1995–2006 period, and illustrates the rather large difference be-tween ERA-I and Brion at summertime. The correspondingscores are listed in Table 4. It can be noted that the differ-ence between ERA-I and SAFRAN is higher than betweenERA-I and Brion. ERA-I tends to overestimate the ISR,which is consistent with the underestimation of the precipita-tion found in Sect. 3.1. Over the 1995–2006 period, the meanoverestimation of the monthly ISR by ERA-I represents 7%of the reference Brion estimates. Although SAFRAN tendsto underestimate the ISR, it correlates well with the otherestimates.
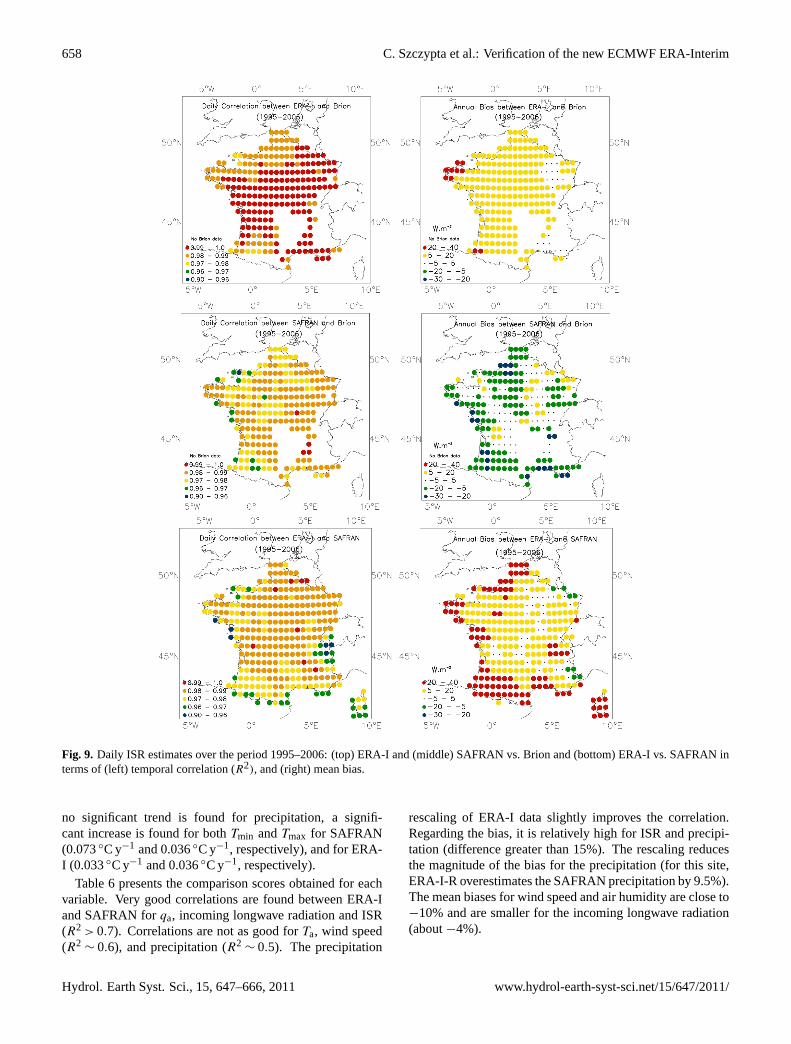
The square correlation coefficient between ERA-I andSAFRAN time series (daily time step) with Brion, and themean bias, were calculated for each ERA-I grid cell for the1995-2006 period and were plotted in Fig. 9. ERA-I cor-relates better than SAFRAN with the reference Brion prod-uct. In coastal regions close to the Atlantic ocean and tothe Mediterranean Sea, where SAFRAN correlates less withBrion (R2 < 0.98 in Fig. 9) higher correlations of ERA-I withBrion are observed. The same trend is observed in the centre
Fig. 8. Mean monthly ISR over part of France where there areBrion data (235 grid cells) for SAFRAN, ERA-I and Brion over theperiod 1995-2006: from (top) 1995 to 2000 and from (bottom) 2001to 2006.
of France. In general, ERA-I correlates very well with Brion(R2 > 0.99 for a large part of France). Correlations betweenERA-I and SAFRAN are lower in mountainous areas and inCorsica, but still good:R2 values are higher than 0.90 inthe Alps and higher than 0.96 in the other mountainous areasand in Corsica. Consistent with Fig. 8, SAFRAN and ERA-Itend to underestimate and overestimate the ISR, respectively,with respect to the Brion ISR. However, fewer ERA-I esti-mates are affected by a large bias: 8% and 1.4% of the gridcells present a mean bias lower than−20 Wm−2 or greaterthan 20 Wm−2, for SAFRAN and ERA-I, respectively. Thedifference between ERA-I and Brion is relatively small ex-cept for Brittany, where ISR is more badly overestimated.The comparison between SAFRAN and ERA-I shows that inthe Alps, ERA-I tends to underestimate ISR while it overes-timates the values in Corsica and in the Pyrenees.
Table 4 shows the ERA-I or SAFRAN scores with respectto the Brion ISR.
3.3 Air temperature, air humidity and wind speed
Quintana-Segui et al. (2008) found that the SAFRAN surfaceair temperature and relative humidity were well reproduced,presenting no bias. Wind speed was also well reproduced,however it was underestimated by SAFRAN with a meanbias of−0.3 m s−1.
Table 5 presents a comparison (annual bias, RMSE andsquare correlation coefficient) between ERA-I and SAFRANfor three atmospheric variables (Ta, qa and wind speed) spa-tially averaged over France for the 1991–2008 period. In
www.hydrol-earth-syst-sci.net/15/647/2011/ Hydrol. Earth Syst. Sci., 15, 647–666, 2011

656 C. Szczypta et al.: Verification of the new ECMWF ERA-Interim
Table 4. Average ISR over the France domain where Brion dara are available, in 2001, 2003, and over the 1995–2006 period: mean bias(ERA-I minus other data sets), RMSE and squared correlation coefficient for ERA-I and SAFRAN with respect to Brion data (based on dailyvalues), and RMSE and squared correlation coefficient for the spatial repartition of the average annual ISR (for 308 grid cells).
Year Score ERA-I SAFRAN Comparison type(76% of France) (76% of France)
2001
R2 0.97 0.96
Temporal (daily values)
Bias (Wm−2) 8.2 −8.5RMSE (Wm−2) 18.1 18.1
Mean ISR Brion 140 Wm−2
2003
R2 0.97 0.96Bias (Wm−2) 9.1 −9.1RMSE (Wm−2) 18.8 20.2
Mean ISR Brion 152 Wm−2
[1995–2006]
R2 0.97 0.95Bias (Wm−2) 9.7 −6.1RMSE (Wm−2) 19.8 19.4
Mean ISR Brion 142 Wm−2
2001R2 0.91 0.63
Spatial (235 grid cells)
RMSE (Wm−2) 9.7 12.4
2003R2 0.82 0.54RMSE (Wm−2) 10.0 12.6
[1995–2006]R2 0.89 0.58RMSE (Wm−2) 10.6 11.1
order to investigate the difference inTa andqa bias, through-out the diurnal cycle, the comparison analysis was made at00:00, 06:00, 12:00 and 18:00 UTC. The ERA-ITa andqacorrelate very well with SAFRAN, withR2 > 0.97, and themean difference between the two data sets over France is rel-atively small.
At the scale of the whole country, ERA-I tends to over-estimateTa at 00:00, 06:00 and 18:00 UTC while it tendsto underestimate this quantity at 12:00 UTC. That impliesthat ERA-I tends to reduce the diurnal cycle ofTa. Thistendency is partly due to the ERA-ITa considered in thisstudy at 10 m and not at 2 m like in SAFRAN. At nighttime,the surface radiative cooling induces slightly lowerTa closeto the soil than at 10 m above the soil, and this is consis-tent with the biases obtained at 00:00, 06:00 and 18:00 UTC.On the contrary,Ta increases more quickly during the day(e.g. at 12:00 UTC) at 2 m than at 10 m. In order to assessthe impact of comparing SAFRAN and ERA-ITa at differ-ent heights, the ERA-ITa values at 2 m were investigated forthe year 2001. The ERA-I diurnal cycle amplitude at 2 mis indeed closer to SAFRAN. However, a reduction in thediurnal cycle ofTa remains and this implies that this effectis not totally linked to the difference in height. While, in2001, the ERA-I 10 m diurnal amplitude ofTa is reducedby 1.6 K, the ERA-I 2 m diurnal amplitude is reduced by
0.7 K: ERA-I overestimates (0.5 K on average)Ta at 00:00and 06:00 UTC and underestimates (0.2 K on average) thisquantity at 12:00 UTC. At 18:00 UTC, ERA-I and SAFRANTa at 2 m are similar. The same comparison was performedfor grid cells where ERA-I and SAFRAN altitudes are veryclose (difference<10 m, 44 points in France). Over thesepoints, the same 0.7 K reduction in the diurnal amplitudeis observed, showing that the remaining diurnal bias is notcaused by differences in altitude. At the grid cell level, morespecific information regarding the bias between SAFRAN(2 m) and ERA-I (10 m) over the 1991–2008 period can beextracted from Fig. 10. RegardingTa at 00:00, 06:00 and18:00 UTC, ERA-I overestimates the values from 0.5 to 4 Kfor a large part of France. At 00:00, this overestimation con-cerns the whole France, except for the Pyrenees and Alpspiedmonts, where ERA-I tends to underestimate the valuesfrom −0.5 to −4 K. At 06:00 and 18:00 UTC, the overes-timation concerns particularly Brittany, the Atlantic coast,mountains (Alps and Pyrenees), and southeastern France,including Corsica. The overestimation is greater in moun-tainous areas for the whole 1991–2008 period. SAFRAN(8 km) and ERA-I (∼70 km) do not work at the same spa-tial scale and for this reason, the topography is representedbetter by SAFRAN than by ERA-I. In these areas, the over-estimation ofTa is linked to the smoother ERA-I topography.
Hydrol. Earth Syst. Sci., 15, 647–666, 2011 www.hydrol-earth-syst-sci.net/15/647/2011/

C. Szczypta et al.: Verification of the new ECMWF ERA-Interim 657
Table 5. AverageTa, qa, wind speed and ISR for the whole France domain: ERA-I vs. SAFRAN (mean bias (ERA-I minus SAFRAN),RMSE andR2), based on daily values over the 1991–2008 period, forTa andqa at 00:00, 06:00, 12:00 and 18:00 UTC, for wind speed at06:00 and 12:00 UTC, and for ISR at 12:00 UTC, over France.
Variable Time R2 Bias RMSE SAFRAN meanannual value
Air Temperature
00:00 UTC 0.98 1.09 K 1.32 K 282.14 K06:00 UTC 0.99 0.52 K 0.80 K 281.61 K12:00 UTC 0.99 −0.48 K 0.83 K 287.49 K18:00 UTC 0.99 0.58 K 0.82 K 285.63 K
Air Humidity
00:00 UTC 0.99 6.2.10−5 kg kg−1 2.9.10−4 kg kg−1 6.6.10−3 kg kg−1
06:00 UTC 0.99 1.3.10−7 kg kg−1 2.7.10−4 kg kg−1 6.6.10−3 kg kg−1
12:00 UTC 0.98 −4.7.10−4 kg kg−1 6.3.10−4 kg kg−1 7.2.10−3 kg kg−1
18:00 UTC 0.96 −4.7.10−4 kg kg−1 8.5.10−4 kg kg−1 7.3.10−3 kg kg−1
Wind Speed06:00 UTC 0.94 0.95 m s−1 0.99 m s−1 2.5 m s−1
12:00 UTC 0.92 0.60 m s−1 0.81 m s−1 3.7 m s−1
ISR 12:00 UTC 0.93 23.9 Wm−2 69.2 Wm−2 442 Wm−2
At 12:00 UTC, ERA-I tends to underestimateTa for a largepart of France (except for central regions) and particularly incoastal regions (Atlantic and Mediterranean coasts and Cor-sica). In some mountainous areas ERA-I overestimateTa bymore than 4 K. The smoother ERA-I topography on moun-tainous areas triggers higherTa values throughout the diur-nal cycle and has an clear impact on the spatial distributionof the bias at 12:00 UTC.
Air humidity is not independent from air temperature.WhenTa increases,qa tends to be greater. In this study, airhumidity differences between SAFRAN and ERA-I correlatewith Ta differences (R2
= 0.65). Regarding the diurnal cycle,the conclusions obtained forTa are valid forqa and a slightlysmaller ERA-I diurnal cycle is observed, with a mean re-duction of the diurnal amplitude of 5.3× 10⁻⁴ kg kg−1 (Ta-ble 5). In 2001, the latter figure is 5.1× 10⁻⁴ kg kg−1. Con-sistent with the results obtained forTa, the analysis of theERA-I qa at 2 m, in 2001, presents a smaller reduction ofthe diurnal amplitude, of 2.8× 10⁻⁴ kg kg−1. On average,for the 1991–2008 period, ERA-I has virtually no air humid-ity bias at 00:00 and at 06:00 UTC, but the spatial distribu-tion of the bias is not homogeneous. The overestimation ismarked for 29% of France (especially in Corsica, in south-eastern France and in mountainous areas), with a mean biasof 5.7× 10⁻⁴ kg kg−1. Over other regions, ERA-I slightlyunderestimates (mean bias of−2.3× 10⁻⁴ kg kg−1) air hu-midity (Table 5). The same conclusions can be drawn for12:00 and 18:00 UTC, except for Brittany and in southeasternFrance (Mediterranean coast and Corsica) where the bias isvery small. In mountainous areas, where the ERA-I altitudeis smaller than the SAFRAN altitude, the ERA-I air humid-ity tends to be higher, which is consistent with the impact of
altitude on air humidity. In other regions, it can be concludedthat the ERA-I air humidity is really close to SAFRAN.
Regarding wind speed, the correlation between ERA-I andSAFRAN is good (R2 > 0.9). However, a rather large biasis observed between the two estimates, of about 0.9 m s−1
at 06:00 UTC. ERA-I provides higher wind speed values ina large part of France, except for mountainous areas and forsouthwestern France where it slightly underestimates the val-ues. However, it must be noted that SAFRAN tends to un-derestimate wind speed by 0.3 m s−1, on average (Quintana-Segui et al., 2008).
3.4 Performance of ERA-I and ERA-I-R over theSMOSREX site
In order to investigate possible trends in the time series andto compare SAFRAN and ERA-I over a long period of time,the two data sets were studied at the grid-cell correspond-ing to the SMOSREX site in southern France, for the 1991–2008 period. Temporal trends from the SAFRAN data setwere studied over France by Vidal et al. (2010) for precipi-tation and for minimum and maximum air temperature (Tminand Tmax), within the 1958–2008 period. They show thatfor most grid-cells, precipitation trends are not significant,but that significant trends (either positive or negative) canbe detected, locally. While trends derived from referencein situ observations are between 0.02 and 0.04◦C y−1 forTmin, and around 0.035◦C y−1 for Tmax, the values derivedfrom SAFRAN are more scattered (−0.04 to 0.06◦C y−1 forTmin and 0.01 to 0.08◦C y−1 for Tmax). Over the shorter pe-riod considered in this study, the following results are foundwith SAFRAN and ERA-I/ERA-I-R for the SMOSREX site:
www.hydrol-earth-syst-sci.net/15/647/2011/ Hydrol. Earth Syst. Sci., 15, 647–666, 2011
658 C. Szczypta et al.: Verification of the new ECMWF ERA-Interim
Fig. 9. Daily ISR estimates over the period 1995–2006: (top) ERA-I and (middle) SAFRAN vs. Brion and (bottom) ERA-I vs. SAFRAN interms of (left) temporal correlation (R2), and (right) mean bias.
no significant trend is found for precipitation, a signifi-cant increase is found for bothTmin andTmax for SAFRAN(0.073◦C y−1 and 0.036◦C y−1, respectively), and for ERA-I (0.033◦C y−1 and 0.036◦C y−1, respectively).
Table 6 presents the comparison scores obtained for eachvariable. Very good correlations are found between ERA-Iand SAFRAN forqa, incoming longwave radiation and ISR(R2 > 0.7). Correlations are not as good forTa, wind speed(R2
∼ 0.6), and precipitation (R2∼ 0.5). The precipitation
rescaling of ERA-I data slightly improves the correlation.Regarding the bias, it is relatively high for ISR and precipi-tation (difference greater than 15%). The rescaling reducesthe magnitude of the bias for the precipitation (for this site,ERA-I-R overestimates the SAFRAN precipitation by 9.5%).The mean biases for wind speed and air humidity are close to−10% and are smaller for the incoming longwave radiation(about−4%).
Hydrol. Earth Syst. Sci., 15, 647–666, 2011 www.hydrol-earth-syst-sci.net/15/647/2011/

C. Szczypta et al.: Verification of the new ECMWF ERA-Interim 659
Fig. 10. Daily Ta estimates over the period 1991–2008: ERA-I vs. SAFRAN in terms of mean bias, at (top and left) 00:00, (top and right)06:00, (bottom and left) 12:00 and (bottom and right) 18:00 UTC.
Table 6. Performance of ERA-I for the SMOSREX site: mean bias (ERA-I minus SAFRAN), RMSE and square correlation coefficient forthe different atmospheric variables over the period 1991–2008 (with a daily time step), as compared with SAFRAN.
Score Air Wind Air Humidity Incoming Solar Incoming Precipitation PrecipitationTemperature Speed Radiation Longwave (ERA-I) (ERA-I-R)
Radiation
R2 0.69 0.64 0.96 0.84 0.74 0.51 0.55Bias −1.2 K −0.3 m s−1
−8.9 10−4 kg kg−1 22.7 Wm−2−12.9 Wm−2
−0.015 mm h−1 0.008 mm h−1
RMSE 4.6 K 1.2 m s−1 1.2 10−3 kg kg−1 44.9 Wm−2 23.5 Wm−2 0.14 mm h−1 0.15 mm h−1
Mean Annual Value 284.9 K 3.1 m s−1 7.8.10−3 kg kg−1 146.8 Wm−2 325.5 Wm−2 0.084 mm h−1 0.084 mm h−1
Relative Bias (%) – −9.7% −11.8% 15.5% −4.0% −17.9% 9.5%
3.5 Results of offline model simulations
Although ERA-I correlates well with the French SAFRANreference, differences are observed between the two datasets. While the precipitation rescaling performed byECMWF reduced the mean bias by about 50%, no correc-tion was proposed so far for the ISR. Although both ERA-Iand SAFRAN correlate very well with Brion (Sect. 3.2), thedifference between ERA-I and the reference Brion estimates
is larger than the difference between SAFRAN and the ref-erence Brion estimates, especially at summertime. The biasaffecting the ERA-I and SAFRAN ISR, may have an impacton soil moisture, LAI and other biophysical variables pro-duced by land surface models forced by these ISR estimates.The precipitation bias of ERA-I and ERA-I-R may also sig-nificantly impact the simulations.
www.hydrol-earth-syst-sci.net/15/647/2011/ Hydrol. Earth Syst. Sci., 15, 647–666, 2011

660 C. Szczypta et al.: Verification of the new ECMWF ERA-Interim
Fig. 11. Impact of the use of different atmospheric forcings (SAFRAN, ERA-I, ERA-I-R) on the ISBA-A-gs simulations of (top) root zonesoil moisture and (bottom) leaf area index of the SMOSREX grassland in southwestern France (2001–2007).
An attempt was made to quantify the impact of errors inthe atmospheric forcing on the simulations of the ISBA-A-gs model for the SMOSREX grassland. Fig. 11 shows theimpact of using ERA-I and ERA-I-R on the simulated LAIandw2. Regardingw2, the ISBA-A-gs simulations forcedby ERA-I-R are much closer to the simulations forced bySAFRAN than to the simulations forced by ERA-I. Figure11 shows a large difference between the ERA-I and ERA-I-Rderived simulations ofw2. Consistent with the underestima-tion of precipitation by ERA-I (Table 6),w2 driven by ERA-Iis underestimated in comparison tow2 driven by SAFRANand ERA-I-R, at summertime and also, more often than not,at wintertime. Concerning LAI, similar conclusions can bedrawn from Fig. 11. LAI is underestimated when ISBA-A-gsis forced with ERA-I. Moreover, the leaf onset is systemati-cally delayed. This is due to the increased drought limitationto plant growth caused by the underestimated precipitation.
Table 7 presents the various ISBA-A-gs scores obtainedfor soil moisture, LAI and surface fluxes for the 2001–2007period (Albergel et al., 2010b), with the different atmo-spheric forcings (ERA-I and ERA-I-R) compared to the val-ues obtained with the SAFRAN atmospheric data set. TheR2
value between ERA-I- and SAFRAN-derived simulations ofw2, wg, LAI and CO2 flux are improved by the use of theERA-I-R precipitation. The use of ERA-I-R, permits to re-duce the bias for most variables, particularly for root-zoneand surface soil moisture, and for the sensible heat fluxH .On the other hand, the use of ERA-I-R precipitation tends toincrease the bias for the latent heat flux LE. It appears that theprecipitation rescaling improves the differentR2 skill scoresfor all the variables, especially LAI and the CO2 flux.
This first sensitivity study shows that the bias affecting theERA-I precipitation has a large impact on the simulation ofthe different biophysical variables and fluxes, including ontheir mean value. The sensitivity of ISBA-A-gs to differentatmospheric forcings is analyzed further in Sect. 4.
4 Sensitivity analysis
4.1 Impact of ERA-I on simulated biophysical variables
The biases affecting the ERA-I/ERA-I-R precipitation andthe ERA-I ISR, may have a detrimental impact on the simu-lation of biogeophysical variables (e.g., soil moisture, LAI)and on the simulation of surface fluxes. In Sect. 3.5, itwas shown that the use of different precipitation estimatesmarkedly impact the ISBA-A-gs simulations. In order to ver-ify this result and to evaluate the impact of ISR on the ISBA-A-gs simulations, a sensitivity study was performed. Asdescribed in Sect. 2.5, a reference simulation derived fromthe whole SAFRAN data set was altered using the ERA-I-Rprecipitation and the ERA-I ISR. The comparison was per-formed for the 2001–2007 period and is illustrated by Fig. 12.In order to interpret the different ISBA-A-gs simulations gen-erated using different atmospheric forcings, a cross-analysisof Tables 6 and 7 has to be performed. This analysis is pre-sented below for soil moisture, LAI, and surface fluxes:
– w2: regarding the root zone soil moisture simulations,the three curves of Fig. 12 are very similar. However,the root-zone soil moisture obtained from SAFRANwith ERA-I ISR tends to be lower than the refer-ence SAFRAN simulation. This difference is more
Hydrol. Earth Syst. Sci., 15, 647–666, 2011 www.hydrol-earth-syst-sci.net/15/647/2011/

C. Szczypta et al.: Verification of the new ECMWF ERA-Interim 661
Table 7. Performance of the ISBA-A-gs model for the SMOSREX site over the 2001–2007 period with different atmospheric forcing datasets (ERA-I, ERA-I-R): mean bias (SAFRAN minus other data sets), RMSE,R2 and NASH for various biophysical variables and fluxesobtained from the reference SAFRAN atmospheric forcing data on the SMOSREX site.
Score Biophysical variables Surface fluxes
Atmospheric w2 LAI wg H LE F [CO2]data set (Root zone soil (Leaf Area (Surface soil (Sensible heat (Latent heat (Carbon dioxyde
moisture) Index) moisture) flux) flux) flux)
ERA-I
R2 0.82 0.61 0.64 0.62 0.71 0.07Bias 0.030 m3 m−3 0.30 m2 m−2 0.029 m3 m−3
−9.7 Wm−2−0.8 Wm−2
−0.293 µmol m−2 s−1
RMSE 0.039 m3 m−3 0.67 m2 m−2 0.054 m3 m−3 22.9 Wm−2 21.0 Wm−2 1.535 µmol m−2 s−1
NASH 0.27 0.50 0.47 – – –
ERA-I-R
R2 0.93 0.89 0.66 0.62 0.60 0.25Bias 0.001 m3 m−3
−0.20 m2 m−2 0.004 m3 m−3−6.4 Wm−2
−5.8 Wm−2 0.047 µmol m−2 s−1
RMSE 0.012 m3 m−3 0.38 m2 m−2 0.046 m3 m−3 24.8 Wm−2 26.9 Wm−2 1.311 µmol m−2 s−1
NASH 0.93 0.84 0.61 – – –
SAFRAN + ERA-I-R precipitation
R2 0.95 0.86 0.73 0.76 0.74 0.30Bias −0.003 m3 m−3
−0.43 m2 m−2−0.008 m3 m−3 4.8 Wm−2
−4.6 Wm−2 0.065 µmol m−2 s−1
RMSE 0.011 m3 m−3 0.58 m2 m−2 0.040 m3 m−3 16.1 Wm−2 20.5 Wm−2 1.317 µmol m−2 s−1
NASH 0.94 0.62 0.72 – – –
SAFRAN + ERA-I ISR
R2 0.97 0.94 0.91 0.60 0.63 0.59Bias 0.008 m3 m−3
−0.12 m2 m−2 0.006 m3 m−3−9.2 Wm−2
−0.9 Wm−2−0.148 µmol m−2 s−1
RMSE 0.012 m3 m−3 0.26 m2 m−2 0.024 m3 m−3 25.8 Wm−2 23.5 Wm−2 0.926 µmol m−2 s−1
NASH 0.93 0.93 0.90 – – –
pronounced from August to November. Indeed, the pe-riod from April to August is characterized by the overes-timation of ISR by ERA-I. This tends to enhance evap-otranpiration, resulting in a significantly dryer soil fromAugust to November. At wintertime and springtime,when the ERA-I ISR is very close to SAFRAN, the twosimulations are similar. The use of the ERA-I-R pre-cipitation data set, has an opposite effect onw2 andw2is overestimated, consistent with the 7% overestimationof the precipitation by ERA-I-R for this site (Table 6).The impact onw2 of using the ERA-I-R precipitationis shown in Table 7 by the scores of the SAFRAN +ERA-I-R simulation. The impact is small. As shown byTable 6, the ERA-I-R precipitation is slightly overesti-mated and this bias produces a slight overestimation ofw2 (Table 7). The same comparison between SAFRANand SAFRAN + ERA-I ISR shows the impact of theERA-I ISR (overestimated by 22.3 Wm−2 on average),with an underestimation ofw2 of 0.008 m3 m−3, consis-tent with the enhanced evapotranspiration (+3.4 Wm−2
on average). When all the ERA-I-R variables are used,R2 is quite good (0.93) and the bias is very small(0.001 m3 m−3). The overestimation of the ISR offsetsthe impact of the overestimation of precipitation. Onthe other hand, using ERA-I, which markedly underes-timates precipitation, significantly degrades the scores.In particular,w2 is underestimated. It can be concludedthat the underestimation of precipitation by ERA-I hasa marked impact onw2 and that the use of ERA-I-Rprecipitation reduces this bias.
– LAI: the use of the ERA-I ISR has little impact onthe LAI simulations. The difference obtained withSAFRAN with the ERA-I-R precipitation is more sig-nificant, with higher LAI values at summertime and dur-ing the autumn. This is caused by the reduced droughtimpact on LAI caused by the overestimated precipita-tion. Table 7 shows that the use of different precipitationestimates seems to have more impact on LAI (e.g. interms ofR2 or Nash score) than onw2. The slight over-estimation of the precipitation by ERA-I-R produces amarked LAI overestimation (of 0.43 m2 m−2 on aver-age). The use of the ERA-I ISR has less impact than theuse of the ERA-I-R precipitation. As forw2, much bet-ter scores are obtained by the whole ERA-I-R than withSAFRAN + ERA-I-R precipitation (e.g. Nash of 0.84and 0.62, respectively, and a bias reduced by more than50%). The explanation is less evident than forw2 sinceboth the overestimation by ERA-I of the ISR, and theoverestimation of ISR and precipitation tend to enhanceplant growth. It is likely that the use of the ERA-ITa, qa,and wind speed also impact the LAI simulations. As forw2, the score difference between ERA-I and ERA-I-Rin Table 7 shows the positive impact of rescaling theERA-I precipitation.
– wg: except for the simulation using SAFRAN + ERA-IISR, surface soil moisture is quite affected by the useof different atmospheric forcings. Precipitation has aparticularly large impact on this variable, and contrarytow2 and LAI, the whole ERA-I-R simulation markedlydegrades the SAFRAN + ERA-I-R precipitation results.
www.hydrol-earth-syst-sci.net/15/647/2011/ Hydrol. Earth Syst. Sci., 15, 647–666, 2011

662 C. Szczypta et al.: Verification of the new ECMWF ERA-Interim
Fig. 12. As in Fig. 11, except for SAFRAN with ERA-I-R precipitation and SAFRAN with ERA-I ISR (2001–2007).
– H , LE, CO2 fluxes: regarding the CO2 flux, similarlyto LAI and soil moisture, it seems that the quality ofprecipitation is more essential than the quality of ISR.RegardingH and LE, a different response is observed,with a larger impact of the ERA-I ISR. Overall, Fig. 12and Table 7 show that the ERA-I ISR and precipitationimpact the ISBA-A-gs simulations. The surface fluxes(H , LE andF [CO2]) are more sensitive to changes inthe atmospheric forcing thanw2 and LAI, and in gen-eral, lowerR2 values are obtained. The score differencebetween ERA-I and ERA-I-R is particularly marked forF [CO2].
Changes in precipitation affect all the simulations gener-ated by ISBA-A-gs, while ISR more particularly affectsH
and LE.
4.2 Impact of environmental conditions on ERA-I andERA-I-R
Correlations and biases obtained from the comparison be-tween ERA-I (or ERA-I-R for precipitation) and the refer-ence SAFRAN (or Brion for the ISR) data set, were analyzedwith respect to various factors, such as altitude, the differencebetween the altitude used in the SAFRAN analysis and thealtitude used in ERA-I, cloud cover, and the mean monthlyor annual values of the considered variable.
Regarding the distance to coast, France presents severalcoast lines (Mediterranean, Atlantic. . . ) with contrasting cli-matic behaviors, and it was difficult to draw firm conclusionson the impact of this factor. The bias or correlation maps ofthe atmospheric variables (precipitation,Ta, qa, ISR. . . ) didnot show common features close to coastlines. On the other
hand, the grid-point altitude derived from SAFRAN may behigher (up to +1143 m.) or lower (down to−390 m) than theERA-I altitude. It was found that this factor has significantconsequences onTa andqa. A summary of the main findingsof the analysis is given below:
– Precipitation: no correlation was found between theprecipitation scores (bias, RMSE orR2) and the gridpoints’ altitude. Annual and monthly biases of ERA-I and ERA-I-R precipitation were compared with theassociated mean annual and monthly SAFRAN pre-cipitation estimates (18 annual values, and 12× 18monthly values). Figure 12 shows that for monthlyprecipitation values, significant (F-test p-value closeto zero) correlations were found withR2 = 0.70 forERA-I and R2 = 0.28 for ERA-I-R. For annual pre-cipitation values, a significant correlation was foundwith ERA-I (R2 = 0.54, p-value< 0.001), but not forERA-I-R (R2 = 0.11, p-value> 0.05). In brief, the un-derestimation of precipitation by ERA-I is more markedfor larger precipitation amounts (Fig. 13). The remain-ing bias of the ERA-I-R monthly precipitation dependson the precipitation amount, also, but to a lesser ex-tent. The use of a long time series (1991–2008) per-mits to map the standard deviations of the scores overthe France domain (not shown). For the precipitationdata, it is found that the inter-annualR2 variability issmall (the mean standard deviation ofR2 over Franceis 0.13) and fairly homogeneous over France. On theother hand, the inter-annual variability of the bias ismore diverse and is larger in southern France (Corsica,Pyrenees, the Alps and close to the Mediterranean Sea).A possible explanation, for Mediterranean regions, is
Hydrol. Earth Syst. Sci., 15, 647–666, 2011 www.hydrol-earth-syst-sci.net/15/647/2011/

C. Szczypta et al.: Verification of the new ECMWF ERA-Interim 663
Fig. 13. Biases vs. reference values: (left) precipitation ERA-I and ERA-I-R biases vs. SAFRAN over the 1991–2008 period, (right) ISRERA-I and SAFRAN biases vs. Brion over the 1995–2006 period. Large and small dots are for annual and monthly values, respectively.Regression lines correspond to monthly values.
that intense precipitation events occur more frequentlythan in other areas. Figure 6 shows that, like ERA-I, ERA-I-R markedly underestimates the most intenseprecipitation events. Since ERA-I-R tends to overesti-mate precipitation close to the Mediterranean Sea, morefrequent intense precipitation events tend to reduce themean annual bias. Therefore, the latter varies from oneyear to another depending on the occurrence of intenseprecipitation events. As the monthly bias on ERA-I-Rprecipitation tends to increase with the monthly precip-itation value, relative biases (ERA-I-R minus SAFRANprecipitation, scaled by the SAFRAN precipitation)were investigated. The relative biases are similar forlow and high precipitation values over France and, moreoften than not, ERA-I-R underestimates precipitationby about 10%. However, for the Mediterranean re-gions close to the coast, ERA-I-R locally overestimatesprecipitation, up to 79% on a monthly basis. In afew mountainous areas close to Spain and Switzerland,ERA-I-R underestimates precipitation, down to−49%on a monthly basis. The most extreme values (eithernegative or positive) of the relative biases are found inthe areas presenting the largest variability of the biasfrom one year to another (see before).
– ISR: as for precipitation, the scores are not correlatedwith altitude or with any surface characteristic, but themonthly ERA-I bias correlates well (R2 = 0.79) with themean monthly ISR. In order to investigate the impact ofa possible misrepresentation of cloud cover by ERA-I,the ISR biases were compared with the precipitation bi-ases. Although no correlation could be found betweenthe two biases, it is likely that ERA-I tends to underesti-mate the cloud cover, consistent with the overestimation
of the ISR and the underestimation of the precipitation.More studies are needed to investigate the cloud coverimpact.
– Ta andqa: in contrast to precipitation and ISR, the al-titude has a marked impact on the biases onTa andqa. The lapse rates (error per m height difference) are7.10−3 K m−1 and 3.10−6 kg kg−1 m−1, for Ta andqa,respectively. The biases were analyzed as a function ofthe altitude difference between SAFRAN and ERA-I foreach ERA-I grid cell, at different times (00:00, 06:00,12:00 and 18:00 UTC). Significant correlations are ob-tained, especially at 12:00 and 18:00 UTC (R2 = 0.74andR2 = 0.92 forTa, andR2 = 0.54 andR2 = 0.53 forqa, respectively). On average, for grid-points present-ing about the same ERA-I and SAFRAN altitude, nobias is observed forTa, while ERA-I overestimatesqa by3.10−4 kg kg−1. When the SAFRAN altitude is greaterthan the ERA-I altitude (mainly in mountainous areas),ERA-I tends to overestimate bothTa andqa values.
– Wind speed: for wind speed, no relation could be foundbetween the ERA-I scores and the suspected environ-mental conditions presented before.
4.3 Discussion and prospects
The sensitivity analysis shows that errors in forcing datasets significantly affect the ISBA-A-gs flux and soil mois-ture simulations. In particular, soil moisture is quite sen-sitive to errors in precipitation. As soil moisture errorsstrongly impact the runoff estimates (Decharme and Dou-ville, 2007), improving precipitation estimates is essentialfor hydrological applications. For this reason, even if theGPCP rescaling improves the ERA-I precipitation estimates,
www.hydrol-earth-syst-sci.net/15/647/2011/ Hydrol. Earth Syst. Sci., 15, 647–666, 2011
664 C. Szczypta et al.: Verification of the new ECMWF ERA-Interim
more efforts should be made to reduce the remaining biases,either positive or negative. In particular, ERA-I-R tends tooverestimate the precipitation in French coastal regions andcomparing ERA-I-R with GPCC over the whole Mediter-ranean basin would be useful. Moreover, a more detailedstudy of the ERA-I ISR data set could permit the establish-ment of a link between the biases identified in this study andthe cloud cover and, possibly, to propose an ISR rescaling.Satellite-derived ISR values are now available operationally(EUMETSAT LSA-SAF, 2011) and could be used to analyzethe ISR error over larger areas.
In order to complete the analysis performed in Sect. 4.1,it would be interesting to consider other sites over Franceand to compare these new results with those obtained in thisstudy for SMOSREX. These first results did not show a dra-matic impact of ISR on the biophysical variables simulatedfor the SMOSREX site but more studies are needed to in-vestigate the ISR bias effect, together with the precipitationimpact. Performing these simulations over the whole Francedomain, would permit to assess the uncertainties in modeledbiophysical variables for various biomes and environmentalconditions.
5 Conclusions
ERA-I surface meteorological variables and a GPCP-corrected version of ERA-I precipitation (ERA-I-R) werecompared with the SAFRAN high resolution atmosphericanalysis over France and with the Brion reference IncomingSolar Radiation (ISR) product.
– The daily precipitation estimates produced by ERA-Iover France correlate well (R2 > 0.6 for 75% of France,andR2 > 0.8 for 25% of France) with SAFRAN and areunderestimated by 27%. ERA-I-R is less biased (13%),in comparison with SAFRAN.
– The Incoming Solar Radiation from ERA-I is closeto the Brion reference data set. The correlation isvery good (R2 > 0.98 for 75% of France). WhereasSAFRAN underestimates the ISR by 5%, ERA-I over-estimates the ISR by 6%.
– The precipitation product is less satisfactory in moun-tainous areas, in Corsica and close to the Mediterraneancoast, where the correlations are less significant and thebiases are more pronounced.
– ERA-I underestimation and overestimation of precipita-tion and ISR, respectively, tends to depend on the meanprecipitation or ISR associated values.
– Correlations are very high forTa, qa and wind speed.Using 10 m instead of 2 mTa (andqa), tends to produceslightly lowerTa (qa) around midday, and higherTa at
night, at dawn and at dusk. The latter occurs over thewhole France domain and particularly in mountainousareas. On the other hand, the underestimation at 12:00UTC is not systematic: while ERA-I clearly underesti-matesTa in coastal regions (where ERA-I overestimatesthe altitude in comparison to SAFRAN), ERA-I overes-timatesTa in mountainous areas (where ERA-I under-estimates the altitude).
– The ERA-I altitude underestimation in mountainous ar-eas in comparison to SAFRAN altitude generates anoverestimation ofTa andqa in these regions.
– The impact of using ERA-I and ERA-I-R variables onthe biophysical variables simulated by the ISBA-A-gs model over a grassland site in southwestern France(SMOSREX) was assessed. It seems that changes inprecipitation impact more the simulations than changesin ISR. However, more work is needed in order to ana-lyze the impact of using ERA-I.
Acknowledgements.The work of C. Szczypta was supported byRegion Midi-Pyrenees and by Meteo-France. This work wasperformed in the framework of the HYMEX project and S. Lafontwas supported by the GEOLAND2 project, cofunded by theEuropean Commission within the GMES initiative in FP7. Thework of C. Albergel at CNRM was supported by CNES. Theauthors thank B. Decharme and J.-F. Mahfouf (CNRM/GAME) fortheir helpful comments.
Edited by: N. Name
The publication of this article is financed by CNRS-INSU.
References
Adler, R. F., Huffman, G. J., Chang, A., Ferraro, R., Xie, P.-P.,Janowiak, J., Rudolf, B., Schneider, U., Curtis, S., Bolvin, D.,Gruber, A., Susskind, J., Arkin, P., and Nelkin, E.: The Version-2 Global Precipitation Climatology Project (GPCP) MonthlyPrecipitation Analysis (1979-Present), J. Hydrometeorol., 4(6),1147–1167, 2003.
Albergel, C., Calvet, J.-C., Gibelin, A.-L., Lafont, S., Roujean, J.-L., Berne, C., Traulle, O., and Fritz, N.: Observed and modelledecosystem respiration and gross primary production of a grass-land in southwestern France, Biogeosciences, 7, 1657–1668,doi:10.5194/bg-7-1657-2010, 2010a.
Albergel, C., Calvet, J.-C., Mahfouf, J.-F., Rudiger, C., Barbu,A. L., Lafont, S., Roujean, J. L., Walker, J. P., Crapeau,M., and Wigneron, J.-P.: Monitoring of water and carbon
Hydrol. Earth Syst. Sci., 15, 647–666, 2011 www.hydrol-earth-syst-sci.net/15/647/2011/

C. Szczypta et al.: Verification of the new ECMWF ERA-Interim 665
fluxes using a land data assimilation system: a case study forsouthwestern France, Hydrol. Earth Syst. Sci., 14, 1109–1124,doi:10.5194/hess-14-1109-2010, 2010b.
Balsamo, G., Boussetta, S., Lopez, P., and Ferranti, L.: Evaluationof ERA-Interim and ERA-Interim-GPCP-rescaled precipitationover the USA, ERA report series, 5, 10 pp., ECMWF, Read-ing, available at:http://www.ecmwf.int/publications/library/do/references/list/782009, 2010.
Brion, D., Calvet, J.-C., Le Moigne, P., Ghattas, B., and Ha-bets, F.: Reconstitution par arbres de regression du rayon-nement visible descendant horaire sur la France continentale,a partir de donnees in situ et de simulations: Spatialisa-tion et verification sur des donnees independantes, CNRM-GAME GMME Technical Note, Meteo-France, Toulouse, 82,49 pp., available at:http://hal-meteofrance.archives-ouvertes.fr/meteo-00514442/fr/, 2005.
Brut, A., Rudiger, C., Lafont, S., Roujean, J.-L., Calvet, J.-C., Jar-lan, L., Gibelin, A.-L., Albergel, C., Le Moigne, P., Soussana,J.-F., Klumpp, K., Guyon, D., Wigneron, J.-P., and Ceschia, E.:Modelling LAI at a regional scale with ISBA-A-gs: compari-son with satellite-derived LAI over southwestern France, Bio-geosciences, 6, 1389–1404,doi:10.5194/bg-6-1389-2009, 2009.
Calvet, J.-C., Noilhan, J., Roujean, J.-L., Bessemoulin, P., Ca-belguenne, M., Olioso, A., and Wigneron, J.-P.: An interactivevegetation SVAT model tested against data from six contrastingsites, Agr. Forest Meteorol., 92, 73–95, 1998.
Decharme, B. and Douville, H.: Global validation of the ISBA sub-grid hydrology, Clim. Dyn., 17 pp.,doi:10.1007/s00382-006-0216-7, 2007.
Dee, D. P., Uppala, S. M., Simmons, A. J., Berrisford, P., Poli,P., Kobayashi, S., Andrae, U., Balmaseda, M. A., Balsamo, G.,Bauer, P., Bechtold, P., Beljaars, A. C. M., van de Berg, L.,Bidlot, J., Bormann, N., Delsol, C., Dragani, R., Fuentes, M.,Geer, A. J., Haimberger, L., Healy, S., Hersbach, H., Holm, E.V., Isaksen, L., Kallberg, P., Kohler, M., Matricardi, M., Mc-Nally, A. P., Monge-Sanz, B. M., Morcrette, J.-J., Peubey, J., deRosnay, P., Tavolato, C., Thepaut, J.-N., and Vitart, F.: The ERA-Interim reanalysis: Conguration and performance of the data as-similation system, ERA report series, 9, 71 pp., ECMWF, Read-ing, available at:http://www.ecmwf.int/publications/library/do/references/show?id=89988, 2011.
De Rosnay, P., Calvet, J.-C., Kerr, Y., Wigneron, J.-P., Lemaıtre,F., Jose Escorihuela, M., Munoz Sabater, J., Saleh, K., Barrie,J., Bouhours, G., Coret, L., Cherel, G., Dedieu, G., Durbe, R.,Fritz, N., Froissard, F., Hoedjes, J., Kruszewski, A., Lavenu, F.,Suquia, D., Waldteufel, P.: SMOSREX: A long term field cam-paign experiment for soil moisture and land surface processesremote sensing, Remote Sens. Environ., 102, 377–389, 2006.
Dirmeyer, P. A., Dolman, A. J., and Sato, N.: The pilot phase of theglobal soil wetness project, B. Am. Meteorol. Soc., 80, 851–878,1999.
Durand, Y., Brun, E., Merindol, L., Guyomarc’h, G., Lesaffre, B.,and Martin, E.: A meteorological estimation of relevant parame-ters for snow models, Ann. Glaciol., 18, 65–71, 1993.
EUMETSAT: Land surface analysis – Satellite applications facility:Downwelling surface shortwave radiation flux,http://landsaf.meteo.pt, last access: February 2011.
Fuchs, T., Schneider, U., and Rudolf, B.: The Global PrecipitationClimatology Centre (GPCC) – in situ observation based precipi-
tation climatology on regional and global scale, Geophysical Re-search Abstracts, EGU General Assembly, 11, EGU2009-10519,2009.
Georgakakos, K. P. and Carpenter, M.: Potential value of opera-tionally available and spatially distributed ensemble soil waterestimates for agriculture, J. Hydrol., 328, 177–191, 2006.
Gibelin, A. L. and Deque, M.: Anthropogenic climate change overthe Mediterranean region simulated by a global variable resolu-tion model, Clim. Dynam., 20, 327–339, 2003.
Huffman, G. J., Adler, R. F., Bolvin, D. T., and Gu, G.: Improv-ing the global precipitation record: GPCP Version 2.1, Geophys.Res. Lett., 36, L17808,doi:10.1029/2009GL040000, 2009.
HyMeX White Book, Draft 1.3.2, 123 pp., available at:http://www.cnrm.meteo.fr/hymex/, last access: August 2010, 2008.
Kerr, Y.: Soil moisture from space: Where are we?, Hydrogeol. J.,15(1), 117–120, 2007.
Le Moigne, P.: SURFEX scientific documentation, Note de centredu Groupe de Meteorologiea Moyenne Echelle, Meteo-France,CNRM, Toulouse, 87, 211 pp., available at:http://www.cnrm.meteo.fr/surfex/last access: July 2010, 2009.
Njoku, E. G., Jackson, T. J, Lakshmi, V., Chan, T. K., and Nghiem,S. V.: Soil moisture retrieval from AMSER-E, IEEE Trans.Geosci. Remote Sens., 41(2), 215–123, 2003.
Noilhan, J. and Planton, S.: A simple parameterisation of Land Sur-face Processes for meteorological model, Mon. Weather Rev.,117, 356–549, 1989.
Noilhan, J. and 5 Mahfouf, J.-F.: The ISBA land surface parameter-isation scheme, Global Planet. Change, 13, 145–149, 1996.
Oki, T., Nishimura, T., and Dirmeyer, P.: Validating estimates ofland surface parameterizations by annual discharge using totalrunoff integrating pathways, J. Jpn. Soc. Hydrol. Water Resour.,9, 416–425, 1997.
Oki, T. and Sud, Y. C.: Design of Total Runoff Integrating Pathways(TRIP) – A Global River Channel Network, Earth Interact., 2, 1–37, 1998.
Pitman, A. J. and Perkins, S. E.: Global and Regional Comparisonof Daily 2-m and 1000-hPa Maximum and Minimum Temper-atures in Three Global Reanalyses, J. Climate, 22, 4667–4681,doi:10.1175/2009JCLI2799.1, 2009.
Quintana-Segui, P., Lemoigne, P., Durand, Y., Martin, E., Habets,F., Baillon, M., Canellas, C., Franchisteguy, L., and Morel, S.:Analysis of near surface atmospheric variables: Validation of theSAFRAN analysis over France, J. Appl. Meteorol. Clim., 47, 92–107, 2008.
Rudolf, B., Beck, C., Grieser, J., and Schneider, U.: Global Pre-cipitation Analysis Products, Global Precipitation ClimatologyCentre (GPCC), DWD, Internet publication, 1–8, 2005.
Simmons, A., Uppala, S., Dee, D., and Kobayashi, S.: ERA-I :New ECMWF reanalysis products from 1989 onwards, ECMWFNewsletter, 110, 25–35, 2007.
Simmons, A. J., Willett, K. M., Jones, P. D., Thorne, P. W., and Dee,D. P.: Low-frequency variations in surface atmospheric humidity,temperature and precipitation: Inferences from reanalyses andmonthly gridded observational data sets, J. Geophys. Res., 115,D01110,doi:10.1029/2009JD012442, 2010.
Vidal, J.-P., Martin, E., Franchisteguy, L., Baillon, M., and Soubey-roux, J.-M.: A 50-year high resolution atmospheric reanalysisover France with the Safran system, Int. J. Climatol., 30, 1627–1644,doi:10.1002/joc.2003, 2010.
www.hydrol-earth-syst-sci.net/15/647/2011/ Hydrol. Earth Syst. Sci., 15, 647–666, 2011

666 C. Szczypta et al.: Verification of the new ECMWF ERA-Interim
Wagner, W., Lemoine, G., and Rott, H.: A method for estimat-ing soil moisture from ERS scatterometer and soil data, RemoteSens. Environ., 70, 191–207, 1999a.
Wagner, W., Lemoine, G., Borgeaud, M., and Rott, H.: A studyof vegetation cover effects on ERS scatterometer data, Geosci.Remote Sens., 37(2), 938–948, 1999b.
Hydrol. Earth Syst. Sci., 15, 647–666, 2011 www.hydrol-earth-syst-sci.net/15/647/2011/