verification of the quasi-steady approximation for sound ... · approximation for sound generation...
TRANSCRIPT

The 3rd Biennial ICVPB MeetingSept. 13-16 2002, Denver, Colorado
Verification of the quasi-steady approximation for sound generation by
confined pulsating jets
L. Mongeau, Z. Zhang, S. Thompson, and S.H. FrankelSchool of Mechanical Engineering
Purdue University

The 3rd Biennial ICVPB MeetingSept. 13-16 2002, Denver, Colorado
For more information:
see web site at:http://widget.ecn.purdue.edu/%7Evoice/
http://widget.ecn.purdue.edu/%7Evoice/

The 3rd Biennial ICVPB MeetingSept. 13-16 2002, Denver, Colorado
AcknowledgementsSponsor
• subcontract, NIDCD (R01 DC03577)• Ronald C. Scherer, P.I., BGSU
Graduate Students• Zhaoyan Zhang (Postdoc, U. Maryland)• Scott Thomson (Ph.D., summer 2003)• Jong Beom Park
Collaborators• Steve H. Frankel, Assoc. Prof.
Technical Assistance• Gilbert Gordon

The 3rd Biennial ICVPB MeetingSept. 13-16 2002, Denver, Colorado
Objectives
Investigate the range of validity of the quasi-steady approximation• Periodic Component• Random, broadband component
Gain a better understanding of the sound generation mechanisms• periodic and broadband components• steady and pulsating confined jet flows

The 3rd Biennial ICVPB MeetingSept. 13-16 2002, Denver, Colorado
Intra-Glottal Flows
sub-glottal
supra-glottal
glottal
flow
Asub
Asup
Ag
turbulencejet
re-circulation
re-attachment

The 3rd Biennial ICVPB MeetingSept. 13-16 2002, Denver, Colorado
Bernouilli’s equation
2sub sup 0 c
1p p U2
− = ρ
assumptions:• irrotational• flow incompressibe• along a streamline• viscous effects neglected• acceleration effects neglected

The 3rd Biennial ICVPB MeetingSept. 13-16 2002, Denver, Colorado
Bernouilli’s Obstruction Theory
sub upg
0
2(p p )Q KA
−=
ρassumptions:• large area ratio Asub/Ag• flow coefficient K combines discharge
coefficient and approach velocity factor• K=K(shape, area, inflow+outflow condition)• same as Bernouilli’s equation• all variable instantaneous (except density)

The 3rd Biennial ICVPB MeetingSept. 13-16 2002, Denver, Colorado
Simplified Circuit
ps
Rg(t)
Lg=0
vocal tract
0 0L
tube
cRAρ
=LungPressure
assumptions:• infinitely long tube• receiver close to orifice• negligible inductive effects
glottal resistance
Q
psup (t)
x
Flow
z
y
Orifice with area Ag(t)
Tube with area At
x
Flow
z
y
Orifice with area Ag(t)
Tube with area At

The 3rd Biennial ICVPB MeetingSept. 13-16 2002, Denver, Colorado
Glottal Resistance
sub up sub upg
sub upg
0
p p p pR
Q 2(p p )KA
− −= =
−ρ
• K=K(Ag,psub- psup)
• direct measurement of Ag, psup, psub sufficient to
calculate Rg
• quasi-steady approximation states that for
given geometry, Ag and ∆p, Rg is the same for
steady or pulsating flows

The 3rd Biennial ICVPB MeetingSept. 13-16 2002, Denver, Colorado
Non-Stationary Phenomena• dφ/dt• Vorticity shedding• Large scale turbulent structures• Flow induced by motion of wall

The 3rd Biennial ICVPB MeetingSept. 13-16 2002, Denver, Colorado
Rubber Dynamic Physical Models
Advantages• real size (no need for scaling)• allow acoustic and simple flow
measurements• orifice shape easy to modify• easy to add complexity to model geometry
Disadvantages• real size (can’t easily perform detailed flow
measurements for validation of CFD)• some shape distortion at high frequency

The 3rd Biennial ICVPB MeetingSept. 13-16 2002, Denver, Colorado
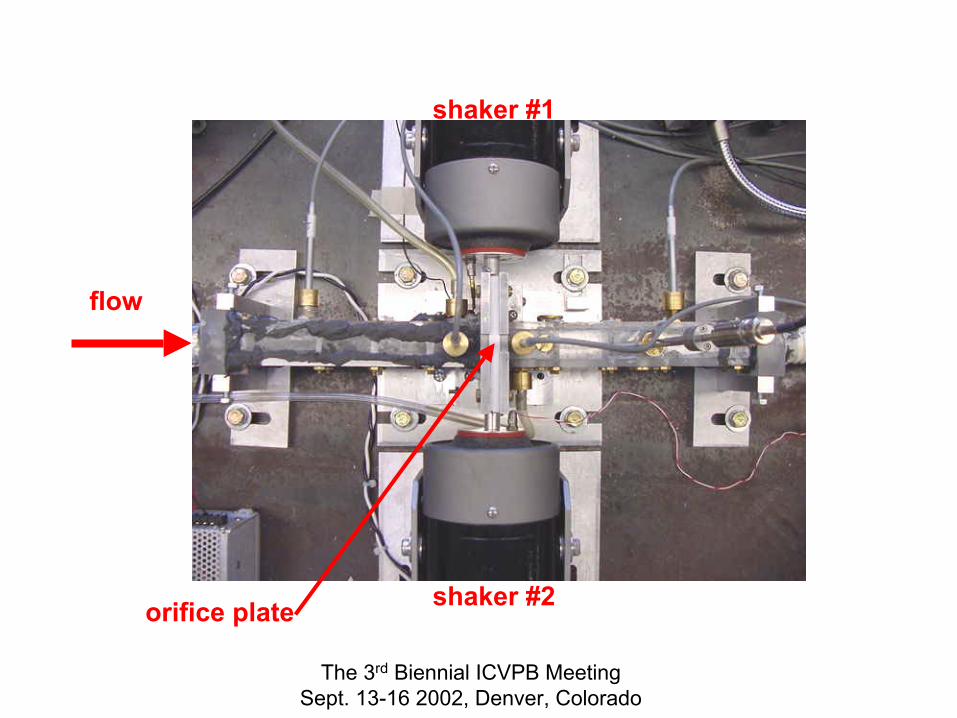
Experimental FacilityInertial base (concrete slab)Two large electro-dynamic shakers+power amplifiersRectangular Acrylic test sections
• anechoic terminations• open tubes of different lengths
Flow supply and controller• air, helium, and CO2 mixtures
Rubber glottis models (real size)• molds machined using Stereo Lithography• geometry defined using CAD (proE)• three geometries (convergent, straight, and
divergent)Belt mechanical drive used for flow visualization
The 3rd Biennial ICVPB MeetingSept. 13-16 2002, Denver, Colorado
shaker #1
shaker #2
flow
orifice plate

The 3rd Biennial ICVPB MeetingSept. 13-16 2002, Denver, Colorado
100 Hz
70°
15° 15°
70° 70°
1.5 1.5 1.5
1.5
17.5
(a) (b) (c)
(d)
Dimensions in mm
70°
15° 15°
70° 70°
1.5 1.5 1.5
1.5
17.5
(a) (b) (c)
(d)
Dimensions in mm

The 3rd Biennial ICVPB MeetingSept. 13-16 2002, Denver, Colorado
Tube configurations
M(14) M(9) P(5)P(5) M(9) M(14)
Anechoic termination Anechoic termination
AA
M(14) M(9) P(5)P(5) M(9) M(14)
Anechoic termination
LL
M(14) M(2.5)
P(2.5)P(2.5)
M(2.5) M(14)
Anechoic termination
HW
AA
LL
HW

The 3rd Biennial ICVPB MeetingSept. 13-16 2002, Denver, Colorado
0 50 100 150 200 250 300 350 400 450 5000.0
0.2
0.4
0.6
0.8
1.0
Mag
nitu
de
Frequency (Hz)
Reflection coefficients
0 500 1000 1500 2000 2500 30000.0
0.2
0.4
0.6
0.8
1.0
Mag
nitu
de
Frequency (Hz)
Downstream
Upstream
AA
LL

The 3rd Biennial ICVPB MeetingSept. 13-16 2002, Denver, Colorado
InstrumentationTwo pairs of phased-matched microphonesPrecision manometerPrecision gas flow meterPhotoelectric detector and light sourceAccelerometersHot-wire anemometer (up to 6 channels)Data acquisition systemsSmoke generatorHigh-speed camera (NAC)

The 3rd Biennial ICVPB MeetingSept. 13-16 2002, Denver, Colorado
microphones
hot-wireprobe
pressure X-ducer
accelerometer
flow
shaker

The 3rd Biennial ICVPB MeetingSept. 13-16 2002, Denver, Colorado
Flow Visualization
1 cm
converging
diverging
span view width view
steady open jet, 4 cm H2O

The 3rd Biennial ICVPB MeetingSept. 13-16 2002, Denver, Colorado

The 3rd Biennial ICVPB MeetingSept. 13-16 2002, Denver, Colorado

The 3rd Biennial ICVPB MeetingSept. 13-16 2002, Denver, Colorado
Bernouilli’s EquationDirect verification
hot-wire anemometer

The 3rd Biennial ICVPB MeetingSept. 13-16 2002, Denver, Colorado
Hot-wire velocity data
Fraction of one cycle
f =100 Hz, ∆ p =12 cm H2O, conv, HW
-0.2 0.0 0.2 0.4 0.6 0.8 1.0 1.2
0
10
20
30
40
50
60
HWBernoulli
Cen
terli
ne v
eloc
ity (m
/s)
closed
open
0 5 10 15 20 25 3010
20
30
40
50
60
70
Cen
terli
ne v
eloc
ity (m
/s)
Pressure drop across orifice (cm H2O)
static
0 5 10 15 20 25 3010203040506070 H.W.
Bernoulli's
Cen
terli
ne v
eloc
ity (m
/s)
Pressure drop across orifice (cm H2O)

The 3rd Biennial ICVPB MeetingSept. 13-16 2002, Denver, Colorado
Bernouilli’s Obstruction TheoryIndirect Method
• can’t easily measure instantaneous flow rate
• use inverse filter methodequivalent monopole strength

The 3rd Biennial ICVPB MeetingSept. 13-16 2002, Denver, Colorado
Assumptions• flow through orifice at any instant same
as steady incompressible flow for same wall geometry and inlet boundary condition
• monopole source• plane waves• source strength is fluctuating volume
velocity at orifice

The 3rd Biennial ICVPB MeetingSept. 13-16 2002, Denver, Colorado
Procedures• iteration method• Predict sound pressure using Bernouilli’s
equation (steady form), using measured orifice area, mean pressure drop across the orifice, and orifice discharge coefficients measured statically
• Reflections accounted for using signal processing techniques (deconvolution)• two-microphone method• low-pass filter

The 3rd Biennial ICVPB MeetingSept. 13-16 2002, Denver, Colorado
equivalent monopole source model
•Dipole source due to unsteady pressure drop
•similar to vibrating piston•Decompose into two monopole sources with equivalent source strength, each radiating to one side of the orifice
•two equivalent monopole sources equal in strength and opposite in phase
InletObserver
Piston
Upstream Downstream
Outlet
- +Upstream Downstream
Orifice
Acousticloading Rup
Acousticloading Rdw
Flow
Monopole sources

The 3rd Biennial ICVPB MeetingSept. 13-16 2002, Denver, Colorado
202
10 ),0('),0(')( cdnup Utptpptp ρ=−+∆=∆
cgd UACQ =
∫ −−=⋅−= +− })({1}{),0(
),0(' 0)()(
0QtQ
AdeRe
cB
tut
kLtjkLtjupup ω
ρω ωω
})({1}{),0(
),0(' 0)()(
0
QtQA
deRec
Btut
kLtjkLtjdndn −=⋅−= ∫ +− ω
ρω ωω
∫ ⋅+= −+−− ωω ωω deRexBtxp xLktjxLktj }ˆ){,(),(' ))(())((
Cd: orifice discharge coefficient obtained in steady flow measurementR: reflection factor measured using two-microphone methodB: coefficient to be determinedAt: orifice area measured using a photoelectric sensor

The 3rd Biennial ICVPB MeetingSept. 13-16 2002, Denver, Colorado
Typical ResultComparison between measured upstream sound pressure and
prediction from quasi-steady assumption
0 0.2 0.4 0.6 0.8 1-3
-2
-1
0
1
2
Fraction of one cycle
Soun
d pr
essu
re (c
m H
2O)
Measured Predicted
f=120Hz∆p=12 cm
H2O

The 3rd Biennial ICVPB MeetingSept. 13-16 2002, Denver, Colorado
Results•f=80 Hz, ∆p0=12 cm H2O, convergent orifice, AA
0 0.2 0.4 0.6 0.8 1-3
-2
-1
0
1
2
3
Fraction of one cycle
Mea
sure
d ac
oust
ic p
ress
ure
(cm
H2O
)
0 0.2 0.4 0.6 0.8 1-3
-2
-1
0
1
2
3
Fraction of one cycle
Mea
sure
d ac
oust
ic p
ress
ure
(cm
H2O
)
0 0.2 0.4 0.6 0.8 1 1.2-300
-250
-200
-150
-100
-50
0
50
100
150
200
Fraction of one cycle
Volu
me
velo
city
sou
rce
stre
ngth
(ml
0 0.2 0.4 0.6 0.8 1 1.2-300
-250
-200
-150
-100
-50
0
50
100
150
200
Fraction of one cycle
Volu
me
velo
city
sou
rce
stre
ngth
(ml
Volume Velocity source
Raw pressure
UpstreamDownstream * (-1)

The 3rd Biennial ICVPB MeetingSept. 13-16 2002, Denver, Colorado
0 0.1 0.2 0.3 0.4 0.5 0.6 0.7 0.8 0.9 1
-4
-2
0
2
4
6
Fraction of one cycle
Non
- dim
ensi
onal
vol
ume
velo
city
so
urce
str
engt
h (m
l/s)
0 0.1 0.2 0.3 0.4 0.5 0.6 0.7 0.8 0.9 1
-4
-2
0
2
4
6
Fraction of one cycle
Non
- dim
ensi
onal
vol
ume
velo
city
so
urce
str
engt
h (m
l/s)
Effects of Mean Pressure
Volume velocity source at different pressure drop scaled by the square root of the mean pressure drop. Straight orifice, f=120 Hz.
12 cmH2O
9 cmH2O
6 cmH2O

The 3rd Biennial ICVPB MeetingSept. 13-16 2002, Denver, Colorado
Effects of Driving Frequency
0 0.2 0.4 0.6 0.8 1
-200
-150
-100
-50
0
50
100
150
200
250
Fraction of one cycle0 0.2 0.4 0.6 0.8 1
-200
-150
-100
-50
0
50
100
150
200
250
Fraction of one cycle0 0.2 0.4 0.6 0.8 1
-200
-150
-100
-50
0
50
100
150
200
250
Fraction of one cycle0 0.2 0.4 0.6 0.8 1
-200
-150
-100
-50
0
50
100
150
200
250
Fraction of one cycle
Raw
Volume velocitysource strength (ml/s)
Convergent orifice∆p0=12 cm H2O
70 Hz100 Hz120 Hz
Deconvolved

The 3rd Biennial ICVPB MeetingSept. 13-16 2002, Denver, Colorado
•Driving frequency has small effect on source strength•consistent with quasi-steady assumption

The 3rd Biennial ICVPB MeetingSept. 13-16 2002, Denver, Colorado
Effects of acoustic loading
-0.2 0.0 0.2 0.4 0.6 0.8 1.0 1.2
-1.0
-0.5
0.0
0.5
1.0
1.5
Aco
ustic
pre
ssur
e (c
m H
2O)
Fraction of one cycle
With FlowWithout Flow
-0.2 0.0 0.2 0.4 0.6 0.8 1.0 1.2-500
-400
-300
-200
-100
0
100
200
300
400
Volu
me
velo
city
sou
rce
(ml/s
)
Fraction of one cycle
DownstreamUpstream * (-1)
• downstream tube modeled as close-open tube
• velocity node at orifice• resonance• monopole ideal velocity source• monopole source amplified• dipole source at pressure anti-node
• f=100 Hz, ∆p0=12 cm H2O, divergent orifice
• Upstream and downstream volume velocity sources agree well

The 3rd Biennial ICVPB MeetingSept. 13-16 2002, Denver, Colorado
Orifice area function
• Resonance in both subglottal and supraglottal systems (first resonance around 450 Hz)
• This causes errors in reflection coefficient measurements and leads to the failure of the iteration method
• Area can still be predicted using measured sound pressure and statically measured orifice discharge coefficient
0 500 1000 1500 20000
10
20
30
40
50
60
10lo
g 10Z
Frequency (Hz)
SupraglottaSubglottal
-0.2 0.0 0.2 0.4 0.6 0.8 1.0 1.202468
1012141618
Orif
ice
area
(mm
2 )
Fraction of one cycle
AreaMeasureAreaPredict
f=100 Hz, ∆p0=12 cm H2O, divergent orifice

The 3rd Biennial ICVPB MeetingSept. 13-16 2002, Denver, Colorado
Tonal Component Results
• Good agreement between measured upstream sound pressure and prediction from quasi-steady assumption
• Quasi-steady assumption valid for different orifice shapes at different operating conditions (driving frequency up to 120Hz)
• Suggests monopole model could be used in conjunction with 3-D incompressible steady numerical models

The 3rd Biennial ICVPB MeetingSept. 13-16 2002, Denver, Colorado
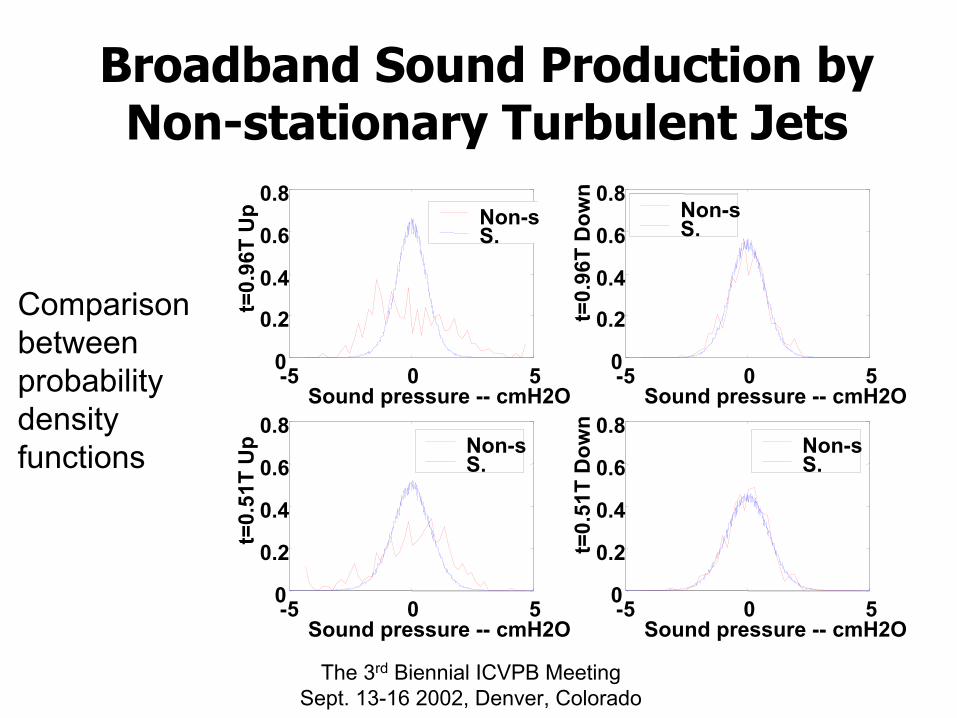
Broadband Sound Production by Non-stationary Turbulent Jets
Periodic component obtained by ensemble-averaging method, and extracted from signals
Statistics of turbulent sound in non-stationary flow at a particular instant compared to those for comparable stationary flow

The 3rd Biennial ICVPB MeetingSept. 13-16 2002, Denver, Colorado
SPEECH
Plosives Phonation Fricatives
Periodic component Broadband random component
Monopolesound
Periodic component of dipole
Random component of dipole
Quadrupolesound
Small in amplitude, neglected
weak acoustic
loadsBroadband sound
Quasi-steady Approximation Verification
Dipole
strong acoustic
loads

The 3rd Biennial ICVPB MeetingSept. 13-16 2002, Denver, Colorado
Broadband Sound in Pulsating JetsOrifice area is forced at specific
frequencySound pressure is decomposed into a
periodic component and a broadband component
Periodic component obtained by ensemble-average method
Broadband sound obtained by removing periodic component sound from measured pressure
Characteristics of broadband sound for non-stationary jet at a particular instant compared to those of stationary jets with same flow and orifice geometry
Two methods:• Probability density function (PDF)• Wavelet transform
Measured sound pressure
Ensemble-averaged periodic component
Turbulence generated sound
The 3rd Biennial ICVPB MeetingSept. 13-16 2002, Denver, Colorado
-5 0 50
0.2
0.4
0.6
0.8
t=0.
96T
Up
Sound pressure -- cmH2O
Non-sS.
-5 0 50
0.2
0.4
0.6
0.8
t=0.
96T
Dow
n
Sound pressure -- cmH2O
Non-sS.
-5 0 50
0.2
0.4
0.6
0.8
t=0.
51T
Up
Sound pressure -- cmH2O
Non-sS.
-5 0 50
0.2
0.4
0.6
0.8
t=0.
51T
Dow
n
Sound pressure -- cmH2O
Non-sS.
Comparison betweenprobabilitydensity functions
Broadband Sound Production by Non-stationary Turbulent Jets

The 3rd Biennial ICVPB MeetingSept. 13-16 2002, Denver, Colorado
0.0 0.2 0.4 0.6 0.8 1.00
2
4
6
8
10
12
14
16
18
gf
edc
ba
Orif
ice
area
(mm
2 )
Fraction of one cycle
•Agreement between PDFs evolves during one cycle• Poor agreement during the
beginning of orifice opening•Agreement improves as the orifice
continues to open•Agreement decreases as the orifice
begins to close
a b c d
gfe f=20 Hz,∆p0=12 cm H2O,Divergent orifice.
-5 -4 -3 -2 -1 0 1 2 3 4 50.0
0.2
0.4
0.6
0.8
1.0PD
F
Acoustic pressure (Pa)-5 -4 -3 -2 -1 0 1 2 3 4 5
0.0
0.2
0.4
0.6
0.8
1.0
Acoustic pressure (Pa)-5 -4 -3 -2 -1 0 1 2 3 4 5
0.0
0.2
0.4
0.6
0.8
1.0
Acoustic pressure (Pa)-5 -4 -3 -2 -1 0 1 2 3 4 5
0.0
0.2
0.4
0.6
0.8
1.0
Acoustic pressure (Pa)
-5 -4 -3 -2 -1 0 1 2 3 4 50.0
0.2
0.4
0.6
0.8
1.0
Acoustic pressure (Pa)-5 -4 -3 -2 -1 0 1 2 3 4 5
0.0
0.2
0.4
0.6
0.8
1.0
Acoustic pressure (Pa)
-5 -4 -3 -2 -1 0 1 2 3 4 50.0
0.2
0.4
0.6
0.8
1.0
Acoustic pressure (Pa)

The 3rd Biennial ICVPB MeetingSept. 13-16 2002, Denver, Colorado
0.0 0.2 0.4 0.6 0.8 1.00
2
4
6
8
10
12
14
16
18
a gf
ed
c
b
Orif
ice
area
(mm2 )
Fraction of one cycle
a b c d
gfe f=200 Hz,∆p0=12 cm H2O,Divergent orifice
-5 -4 -3 -2 -1 0 1 2 3 4 50.0
0.2
0.4
0.6
0.8
1.0PD
F
Acoustic pressure (Pa)-5 -4 -3 -2 -1 0 1 2 3 4 5
0.0
0.2
0.4
0.6
0.8
1.0
Acoustic pressure (Pa)-5 -4 -3 -2 -1 0 1 2 3 4 5
0.0
0.2
0.4
0.6
0.8
1.0
Acoustic pressure (Pa)-5 -4 -3 -2 -1 0 1 2 3 4 5
0.0
0.2
0.4
0.6
0.8
1.0
Acoustic pressure (Pa)
-5 -4 -3 -2 -1 0 1 2 3 4 50.0
0.2
0.4
0.6
0.8
1.0
Acoustic pressure (Pa)-5 -4 -3 -2 -1 0 1 2 3 4 5
0.0
0.2
0.4
0.6
0.8
1.0
Acoustic pressure (Pa)-5 -4 -3 -2 -1 0 1 2 3 4 5
0.0
0.2
0.4
0.6
0.8
1.0
Acoustic pressure (Pa)
•As driving frequency increases, general agreement between PDFsdecreases, especially during the orifice opening stage• quasi-steady approximation may not
be valid for broadband component

The 3rd Biennial ICVPB MeetingSept. 13-16 2002, Denver, Colorado
Wavelet AnalysisProvides time information as well as frequency informationIn STFT the size of the sliding window is fixed, while in
wavelet analysis the window size is changeable, therefore giving same resolution for different frequency component
Daubechies 1 wavelet (a step function) used (similar results obtained with db2)
7-level wavelet transform used in this studySignal
A1 D1
A2 D2
D7A7D: DetailA: Approximation
S=A7+D7+D6+D5+D4+D3+D2+D1
At each level, signal is decomposed into a Detail and an Approximation. The Detail corresponds to the high frequency component while the Approximationcorresponds to the low frequency component.

The 3rd Biennial ICVPB MeetingSept. 13-16 2002, Denver, Colorado
Wavelet Coefficients
0 1 2 3 40.00.51.0
t
j
07
14
i
0.080.12
h
0.080.12
g
0.040.080.12
f
0.10.2
e
0.20.30.4
d
0.20.40.6
c
0.30.6
b
0.40.81.2
a
Straight,20 Hz,12 cmH2O
Divergent,200 Hz,12 cmH2O
Convergent,200 Hz,12 cmH2O
0 1 2 3 40.40.60.8
t
j
51015
i
0.150.200.25
h
0.10.20.3
g
0.20.4
f
0.20.30.4
e
0.20.4
d
0.30.6
c
0.30.60.9
b
0.40.5
a
-2 0 2
60000120000180000
t
i
0.060.09
h
0.05
0.10
g
0.050.100.15
f
0.00.10.2
e
0.00.10.2
d
0.00.10.2
c
0.10.20.3
b
0.20.4
a
0
188
368
764
1504
3072
6184
14576
Hz
A
U6A2

The 3rd Biennial ICVPB MeetingSept. 13-16 2002, Denver, Colorado
Summary• Turbulent sound synchronous with
modulation of orifice area• Two peaks during one cycle:• first peak may be associated with the
developing of the jet• second peak associated with the quenching of
the flow during closure.• First peak less apparent for high-frequency
component• For same level of details, first peak becomes
less apparent as the driving frequency increases

The 3rd Biennial ICVPB MeetingSept. 13-16 2002, Denver, Colorado
• quasi-steady approximation verified in confined jets for tonal sound component across various flow conditions, orifice geometries, and acoustic loads
• non-stationary broadband investigated using PDF comparisons and wavelet analysis
• broadband sound generation appears to be non-stationary (not quasi-steady)
Conclusions

The 3rd Biennial ICVPB MeetingSept. 13-16 2002, Denver, Colorado
Ongoing Work
Validation of quasi-steady assumption• Coanda Effect• Complex geometries (pathological)
Acoustic scaling laws• Tonal and broadband• Evaluate impact on articulatory speech
synthesisAdina Simulations

The 3rd Biennial ICVPB MeetingSept. 13-16 2002, Denver, Colorado
For more …
Zhaoyan Zhang, “Experimental study of sound generation by confined jets with application to human phonation,” Ph.D. Dissertation, Purdue University, 2002.Cheng Zhang, “____,” M.S.M.E. Thesis, Purdue University, 2002.Wei Zhao, “A numerical investigation of sound generated from subsonic jets with application to human phonation,” Ph.D. Thesis, Purdue University, 2000.