verde river tmdl for turbidity - azdeq.gov river turbidity tmdl february 2001, adeq i-verde river...
TRANSCRIPT

Verde River Turbidity TMDL February 2001, ADEQ
i
-VERDE RIVER TMDL- FOR TURBIDITY
February 2001
Arizona Department of Environmental Quality Shad N. Bowman


Verde River Turbidity TMDL February 2001, ADEQ
i
TABLE OF CONTENTS Section Page Number TABLE OF CONTENTS . . . . . . . . . . . . . . . . . . . . . . . . . . . . . . . . . . . . . . . . . . . . . . . . . i EXECUTIVE SUMMARY . . . . . . . . . . . . . . . . . . . . . . . . . . . . . . . . . . . . . . . . . . . . . ii - iii VERDE RIVER TMDL OVERVIEW CHART. . . . . . . . . . . . . . . . . . . . . . . . . . . . . . . . . . . . . . . . . . . . iii BACKGROUND INFORMATION . . . . . . . . . . . . . . . . . . . . . . . . . . . . . . . . . . . . . . . . . . 1 - 4 WATERSHED DESCRIPTION . . . . . . . . . . . . . . . . . . . . . . . . . . . . . . . . . . . . . . . . . . . . . . . . . . . . . 1 ECOSYSTEM BIOLOGY . . . . . . . . . . . . . . . . . . . . . . . . . . . . . . . . . . . . . . . . . . . . . . . . . . . . . 1 - 2 HYDROLOGY . . . . . . . . . . . . . . . . . . . . . . . . . . . . . . . . . . . . . . . . . . . . . . . . . . . . . . . . . . 2 - 3 GEOLOGY . . . . . . . . . . . . . . . . . . . . . . . . . . . . . . . . . . . . . . . . . . . . . . . . . . . . . . . . . . . . . 3 S OILS . . . . . . . . . . . . . . . . . . . . . . . . . . . . . . . . . . . . . . . . . . . . . . . . . . . . . . . . . . . . . . . 3 CLIMATE . . . . . . . . . . . . . . . . . . . . . . . . . . . . . . . . . . . . . . . . . . . . . . . . . . . . . . . . . . . . . . 3 VEGETATION . . . . . . . . . . . . . . . . . . . . . . . . . . . . . . . . . . . . . . . . . . . . . . . . . . . . . . . . . . 3 - 4 LAND USE. . . . . . . . . . . . . . . . . . . . . . . . . . . . . . . . . . . . . . . . . . . . . . . . . . . . . . . . . . . . . . 4 ENDPOINT IDENTIFICATION . . . . . . . . . . . . . . . . . . . . . . . . . . . . . . . . . . . . . . . . . . . 4 - 19 TURBIDITY AND THE LINKAGE OF WATER QUALITY AND POLLUTANT STANDARDS . . . . . . . . . . . . . . . . . . . . . 4 - 6 CONSIDERATION OF S EASONAL VARIATION . . . . . . . . . . . . . . . . . . . . . . . . . . . . . . . . . . . . . . . . . . 7 - 8 BACKGROUND SITE LOCATION AND VALUES . . . . . . . . . . . . . . . . . . . . . . . . . . . . . . . . . . . . . . . . . . . . 9 BACKGROUND TURBIFITY AND S EDIMENT LOAD CALCULATION . . . . . . . . . . . . . . . . . . . . . . . . . . . 9 IDENTIFICATION AND DESCRIPTION OF POLLUTANT S OURCES . . . . . . . . . . . . . . . . . . . . . . . . . . . . . . . 10 - 12 WASTE LOAD ALLOCATIONS . . . . . . . . . . . . . . . . . . . . . . . . . . . . . . . . . . . . . . . . . . . . . . . . . . . 12 LOAD ALLOCATIONS . . . . . . . . . . . . . . . . . . . . . . . . . . . . . . . . . . . . . . . . . . . . . . . . . . . . 12 - 15 MARGIN OF S AFETY . . . . . . . . . . . . . . . . . . . . . . . . . . . . . . . . . . . . . . . . . . . . . . . . . . . . . . . 15 TMDL CALCULATIONS . . . . . . . . . . . . . . . . . . . . . . . . . . . . . . . . . . . . . . . . . . . . . . . . . . . 15 - 19 CRITICAL S TORM FLOW . . . . . . . . . . . . . . . . . . . . . . . . . . . . . . . . . . . . . . . . . . . . . . . 17 AVERAGE BASE FLOW . . . . . . . . . . . . . . . . . . . . . . . . . . . . . . . . . . . . . . . . . . . . . . . . 18 IMPLEMENTATION . . . . . . . . . . . . . . . . . . . . . . . . . . . . . . . . . . . . . . . . . . . . . . . 20 - 25 BEST MANAGEMENT PRACTICES . . . . . . . . . . . . . . . . . . . . . . . . . . . . . . . . . . . . . . . . . . . . . . 20 - 23 OTHER POSSIBLE PROJECTS . . . . . . . . . . . . . . . . . . . . . . . . . . . . . . . . . . . . . . . . . . . . . . . . . . . 23 MONITORING PLAN . . . . . . . . . . . . . . . . . . . . . . . . . . . . . . . . . . . . . . . . . . . . . . . . . . . . . 23 - 24 TIME LINE . . . . . . . . . . . . . . . . . . . . . . . . . . . . . . . . . . . . . . . . . . . . . . . . . . . . . . . . . . . . . 24 MILESTONES . . . . . . . . . . . . . . . . . . . . . . . . . . . . . . . . . . . . . . . . . . . . . . . . . . . . . . . . . . . 25 ASSURANCES . . . . . . . . . . . . . . . . . . . . . . . . . . . . . . . . . . . . . . . . . . . . . . . . . . . . . . . . . . . 25 PUBLIC PARTICIPATION . . . . . . . . . . . . . . . . . . . . . . . . . . . . . . . . . . . . . . . . . . . . 25 - 26 PUBLIC PARTICIPATION IN THE TMDL PROCESS . . . . . . . . . . . . . . . . . . . . . . . . . . . . . . . . . . . . . 25 - 26 WATERSHED GROUP . . . . . . . . . . . . . . . . . . . . . . . . . . . . . . . . . . . . . . . . . . . . . . . . . . . . . . . 26 WEB S ITES . . . . . . . . . . . . . . . . . . . . . . . . . . . . . . . . . . . . . . . . . . . . . . . . . . . . . . . . . . . . 26 LIST OF ABBREVIATIONS . . . . . . . . . . . . . . . . . . . . . . . . . . . . . . . . . . . . . . . . . . . . . . 27 REFERENCES . . . . . . . . . . . . . . . . . . . . . . . . . . . . . . . . . . . . . . . . . . . . . . . . . . 28 - 31 APPENDIX . . . . . . . . . . . . . . . . . . . . . . . . . . . . . . . . . . . . . . . . . . . . . . . . . . . . 31 - 34 Graph 1, Average Discharge values from 1986 – 1999 from USGS gauge stations . . . . . . . . . . . . . . . . . . . . . . . 31 Graph 2, TSS vs. Turbidity for the Verde River . . . . . . . . . . . . . . . . . . . . . . . . . . . . . . . . . . . . . . . . . 31 Graph 3, TSS and Turbidity vs. Discharge for the Verde River . . . . . . . . . . . . . . . . . . . . . . . . . . . . . . . . . 32 Map 1, Location of the Verde River Watershed and the Verde River . . . . . . . . . . . . . . . . . . . . . . . . . . . . . . 33 Map 2, The Verde River USGS sites used for calculations and creation of the regression curves . . . . . . . . . . . . . . . 34

Verde River Turbidity TMDL February 2001, ADEQ
ii
EXECUTIVE SUMMARY Section 303(d) of the Clean Water Act requires that States develop Total Maximum Daily Loads (TMDLs) for surface waters that do not meet, and maintain, applicable water quality standards. A TMDL sets the amount of a given pollutant that the water body can withstand without creating an impairment of that surface water’s designated use. The TMDL by definition (40 CFR Part 130) is the sum of all Waste Load Allocations (point source) and Load Allocations (non-point source) with the inclusion of a margin of safety and natural background conditions. The Verde River originates in Big Chino Valley north of Prescott, Arizona at the confluence of Chino Wash and Granite Creek, and terminates at the confluence to the Salt River, near Mesa, Arizona (see Map 1). The three stream segments of the Verde River that are listed as impaired due to turbidity occur in the upper section (from Perkinsville to below Camp Verde).(5) The turbidity standard for aquatic and wildlife warm water streams is currently set at 50 Nephelometric Turbidity Units (NTU). Excessive turbidity was suspected as a possible stressor to the health of the aquatic ecosystem and detracts from recreational uses. The Verde River was listed as an impaired water due to samples collected from 1991-1995 (see table 2). The Verde River has three reaches listed in the 303(d) lis t, from the Perkinsville bridge to the confluence with West Clear Creek, and two sections which are below Camp Verde -a total of 37 miles (see Map 2).(5)
The Target Load Capacity for the Verde River during the critical storm flows was calculated to be 731,793 lbs./day as Total Suspended Solids (TSS). The Measured Load was estimated to be 964,694 lbs./day as TSS. The TMDL for Turbidity (as TSS) for critical storm flow conditions is 731,793 lbs./day. The Load Reduction necessary is 232,901 lbs./day. During the average base flow conditions no Load Reduction is necessary, as there is no exceedence, there is an estimated –31,255 lbs./day (TSS) gap between the Measured Load (20,672 lbs./day) and the Target Load (51,927 lbs./day). This information is presented as part of the Verde River TMDL Overview Chart which follows. The turbidity impairment appears to be directly correlated to large storm events. Implementation projects and best management practices are aimed at improving the water quality by improving vegetative ground cover -thereby reducing excessive storm runoff and soil erosion through: road maintenance or closures, improved grazing strategies and practices, and watershed improvements on both uplands and riparian areas. Implementation of Best Management Practices (BMPs) will increase riparian vegetation, stabilize the stream banks, promote the development of flood plains, and minimize the impact of cattle in the general area –thus decreasing the contributions of sediment to the Verde River during higher flow storm events.

Verde River Turbidity TMDL February 2001, ADEQ
iii
VERDE RIVER TMDL OVERVIEW CHART
VERDE RIVER WATERSHED INFORMATION: Waterbody Name Verde River Drainage Area 6,624 square miles
Reservoirs Horseshoe Reservoir (1980 acres), Bartlett Lake (2375 acres)
Special Status Wild and Scenic River status on 39.5 miles above Red Creek confluence (near Tangle Creek). Scenic status from Beasley Flat
Unique Waters Oak Creek and the West Fork of Oak Creek
Designated Uses Aquatic and Wildlife warm-water, Fish Consumption, Full Body Contact, Agriculture Irrigation and Agriculture Livestock Watering
Communities Clarkdale, Cottonwood, Jerome, Sedona, and Camp Verde Counties Coconino, Maricopa, Yavapai
Parks and Forests Toozigoot, Montezuma’s Castle and Well National Monuments, Deadhorse, Jerome, Red Rock, and Slide Rock State Parks, Tonto, Prescott, Kaibab, and Coconino National Forests
Land Ownership 64% USFS, 23% Private 10% State, 2% Tribal, and 1% other State and Federal owned Geology Sandstone and limestone primarily border the river from Perkinsville to Clarkdale
303(d) LISTED VERDE RIVER STREAM REACHES OF CONCERN INFORMATION: Waterbody Name, Description Waterbody ID (HUC #), Size Stressors Step in process Verde River, Sycamore - Oak Creek 15060202-025, 25 miles
turbidity TMDL to be completed in 2001
Verde River, Below Railroad Draw 15060202-037, 6 miles
turbidity TMDL to be completed in 2001 Listed Segments
Description
Verde River, Above West Clear Creek 15060203-027, 6 miles
turbidity TMDL to be completed in 2001
T&E Species Present spikedace (Meda fulgida), Colorado pikeminnow (Ptychocheilus lucius), razorback sucker (Xyrauchen texanus)
Applicable Water Quality Standards
Aquatic and Wildlife warm-water (A&Ww) Turbidity standard of 50 NTUs
Potential Sources Pinyon and Juniper causing loss of grasses and shrubs; cattle grazing; OHVs; road cuts; silted in water catchments; and resuspension of sediment moving through the system.
Flow Variability Flows range from low flow conditions (around 20 cfs) to flood events greater than 100,000 cfs (near 150,000 cfs), as per a 65 year period of record from various USGS Gauge Stations.
Public Participation Through the Verde Watershed Association, the internet, and public noticing procedures as prescribed in Arizona House Bill 2610, which includes posting in the Arizona Administrative Register and a response to comments, in a process that totals well over 120 days to complete.
Watershed Group The Verde Watershed Association was formed in 1993 and meets monthly in the watershed. Consists of ADEQ, ADWR, USFS, local groups, private citizens, and local municipalities
VERDE RIVER TMDL CALCULATIONS AND VALUES CRITICAL STORM FLOWS AVERAGE FLOWS
Discharge Designed for 1180 cfs
(763 mgd) Discharge Designed for
84 cfs (54 mgd)
Background, lbs./day TSS 8,736 Background, lbs./day TSS 8,736 Waste Load Allocation, lbs./day TSS 0 Waste Load Allocation, lbs./day TSS 0 Load Allocation, lbs./day TSS 657,325 Load Allocation, lbs./day TSS 39,265 Margin of Safety, lbs./day TSS 65,732 Margin of Safety, lbs./day TSS 3,926 TMDL, lbs./day TSS 731,793 TMDL, lbs./day TSS 51,927 Measured Load, lbs./day TSS 964,694 Measured Load, lbs./day TSS 20,672 Load Reduction, lbs./day TSS 232,901 Load Reduction, lbs./day TSS NONE, (-31,255)


Verde River Turbidity TMDL February 2001, ADEQ
1
BACKGROUND INFORMATION WATERSHED DESCRIPTION The Verde River originates in Big Chino Valley, north of Prescott, Arizona, at the confluence of Chino Wash and Granite Creek. Chino Wash is considered a major source of fine-grained sediments (silt <2mm) into the Verde River system. Granite Creek is considered a major source for coarse grained sediments (sand and cobbles >2mm). The Verde River is a major tributary of the Salt River and serves the agricultural, recreational, and drinking water needs of communities along the river and ultimately, for the Phoenix metropolitan basin. The Verde River flows in an easterly, then southerly, direction for approximately 156 miles, and includes two major water storage reservoirs. The Horseshoe and the Bartlett dams. Both store water for agricultural, municipal, and industrial uses and serve as water impoundment structures for flood control on the lower Verde River. The Verde River is free flowing for approximately 125 miles before being impounded by Horseshoe Dam. The Verde River watershed is located in central Arizona. The upper reaches of the watershed are part of the Colorado Plateau, while its lower portion lies within the Transition Zone-Central Highlands section, below the Basin and Range Province. It contains canyons and gorges comprised of basalt flows interlayered with sandstone and limestone formations.(39) Perennial flow in the Verde River begins below Sullivan Lake Dam, east of Prescott, Arizona (elevation 4500 ft). Initially confined in a steep canyon, the river flows east, then southeast, to where it opens out onto an alluvial plain near the Perkinsville Ranch. Below the Perkinsville Ranch, the river is somewhat confined in a valley, away from anthropogenic influences, until reaching the Clarkdale area (approximately 3 miles below the Clarkdale United States Geological Survey (USGS) gauge station site). Then the Verde River flows, from the Clarkdale area, through Cottonwood and Camp Verde. The Verde River watershed above the Clarkdale USGS gauge station site (elevation 3500 ft) is 3,503 square miles, with 364 square miles of noncontributing land.(40,51)
The Verde River is one of the major perennial streams in Arizona, providing fish/wildlife habitat and recreational opportunities. It has been identified in the Department of the Interior's (DOI) National Rivers Inventory as one of the Nation's most significant free flowing rivers. The Arizona Game and Fish Commission (policy J1l.1) designate much of the riparian habitat along the Verde River, above Horseshoe Reservoir, as a Category 1 Resource for compensation purposes. The U.S. Fish & Wildlife Service (USF&W) has also designated the riparian corridor along the Verde River, from Sullivan Lake to Horseshoe Reservoir, as a Category 1 Resource. In accordance with this policy, this section of river is considered to be of high value for wildlife species and is unique and irreplaceable on a national basis, or in the ecoregion. In addition, the USF&W mitigation policy indicates that no loss of existing habitat value is acceptable in areas within this category. In 1992 the Arizona Department of Water Resources (ADWR) ranked the Verde River watershed as having the highest priority to expedite actions on pending in stream flow applications, due to the impacts imposed by the population growth of the Verde Valley (Harbour 1992). In 1984, 39.5 miles of the Verde River below Beasley Flat was designated as Wild and Scenic under the authority of the 1968 Wild and Scenic Rivers Act. In 1991 American Rivers, one of the Nation's leading river conservation organizations, has named the Verde River one of the 15 highly threatened rivers in the U.S. This designation stems from the significance of the Verde River to the viability of the ecosystem and watershed, along with concern that guidance is needed to protect the threatened ecosystem. The largest threat to the Verde River ecosystem is ground water depletion due to increased pumping to meet water demands of rapidly growing populations in the Prescott and Verde Valley areas. Preliminary findings of a nutrient study suggest that the Verde River has limited buffering capacity, which could be affected by decreasing water quantity in the river.(40) Other threats include previous and ongoing mining operations, sand and gravel extraction, agricultural diversions, livestock grazing, urban development and associated contamination, over-use for recreational purposes, and surface water imp oundments. The land uses in the greater Verde River watershed include mining, timber harvesting, ranching/grazing, commercial land uses, and a rapidly growing residential sector. ECOSYSTEM BIOLOGY Benthic macroinvertebrate data collected over the past several years, for use with the Arizona Department of Environmental Quality’s (ADEQs) Index of Biological Integrity Biocriteria (IBI) monitoring program, indicates that the aquatic invertebrate communities score as “exceptional” (73+), with only one location rated as “good” (53 - 73).

Verde River Turbidity TMDL February 2001, ADEQ
2
Research and monitoring has shown that the largest threat currently facing native fish species in the Verde River ecosystem is the large numbers of nonnative fish species.(49) Dwindling numbers of spikedace (Meda fulgida) have occurred during a time of grazing management changes, lack of flooding, dramatic changes in aquatic habitat, and increases in relative numbers of nonnative species.(34, 35) Because of these multiple and interactive factors, no statements can unequivocally be made as to the specific reason for the decline of spikedace.(38) HYDROLOGY The upper Verde River area, in contrast to much of Arizona, has several contributing perennial streams, which includes Sycamore Creek, Bitter Creek, Oak Creek, Wet Beaver Creek, West Clear Creek, and Fossil Creek. The watershed area, including the lowest listed river segment, is about 4,700 square miles, or about three million acres. This equates to approximately half of the entire Verde River watershed area. The Verde River has a mean annual discharge of 45.9 cubic feet per second (cfs) with a mean annual maximum of 215 cfs, and a mean annual minimum of 24 cfs.(51) Flow above Horseshoe Reservoir on the Verde River varies from 48 cfs to 145,000 cfs, with an annual mean flow of 599 cfs. Nearly 50% of the annual runoff occurs between January and March. However, a mean monthly discharge of 1,441 cfs has been recorded during the winter, with peak discharges exceeding 23,200 cfs at the Paulden gauge station and 53,200 cfs at the Clarkdale gauge station. The 100 year flood corresponds to about a 70,000 cfs flow event, while a 2 year flood is about 6,300 cfs.(33) The Bankfull discharge is about 2,400 cfs and occurs at a 1.3 year recurrence interval.(48)
The USGS operates five gauging stations that have recorded historical flows, two of which are currently delivering real-time data on the Verde River.(51) The minimum, maximum, and average discharges from these five gauge stations are presented in Table 1.
TABLE 1 MINIMUM, MAXIMUM, AND ANNUAL MEAN FLOWS REPORTED IN CFS (CUBIC FEET PER SECOND)
FOR THE USGS GAUGE STATIONS ON TH E VERDE RIVER
Site Name USGS Site
Number Minimum
Daily Flow Maximum Daily Flow (in 1993)
Annual Mean Flow (lowest-highest)
Paulden 09503700 15 23,200
44 (24-215)
Clarkdale 09504000 55 53,200
192 (82-645)
Below West Clear Creek Near Camp Verde
09505800 35 119,000 457
(159-1403) Below Tangle Creek above Horseshoe Dam
09508500 48 145,000 590
(189-2,229) Below Bartlett Dam 09510000 29 110,000 678 1 mile above Salt River 09511300 0 127,000 660
In 1997 Beyer, a graduate student from Arizona State University, studied the fluvial geomorphology of the Verde River, and reached several interesting conclusions. Dryland, or ephemeral, systems exhibit greater “flashiness” in their regimes and extreme variability in flows. She found higher flows, rather than bankfull flows are responsible for performing the geomorphic work of transporting sediment and shaping the channel. Specifically she stated:
1. Low flows perform little geomorphic work along the Verde River. Moderate to high flows are responsible for active channel modification and maintenance.
2. The upper reaches of the basin fill during discharges greater than bankfull, while reaches in the lower basin scour during discharges greater than bankfull. The relationship is reversed for flows less than bankfull. This suggests fragmentation on a sub-basin scale, with higher flows in the upper basin contributing large amounts of sediment to the river, causing filling, and higher flows in the lower basin efficiently evacuating sediment.
3. Tributary inputs of large quantities of water (and probably sediment) appear to impact short distances downstream of confluences, rather than whole river segments.

Verde River Turbidity TMDL February 2001, ADEQ
3
This study found that the sediment load carried by the river during moderate to high flows maintains the Verde River system. GEOLOGY Rock units of the Tertiary age and the Quaternary age underlie the Verde Valley. The Verde Formation is the major geologic formation adjacent to the Verde River corridor, from Packard Ranch downstream to the confluence with Towel Creek, south of Camp Verde. The Verde Formation is comprised of unconsolidated and consolidated, limestone, siltstone, sandstone, and marl, and is highly erodible providing high natural sediment load to the Verde River following storm events. Fluvial deposits were accumulated in alluvial and terrace formations, which overlay the Verde Formation. Terrace deposits are composed of moderately sorted sand-to-boulder size materials, which are very dense and somewhat cemented. Fine-grained material was subsequently deposited over these coarser terrace deposits. The Verde River floodplains and the terrace materials are largely comprised of intermixed sands, coarse gravels, and cobble. The Supai Formation is comprised of interbedded sandstone, siltstone, and mudstone and dominates areas north and east of Clarkdale. Basalt flows and local sediments are found scattered throughout the watershed and occur within the Verde Formation as well. Elevations in the watershed range from 12,000 feet in the San Francisco Mountains to 1,600 feet in the south.(38, 39, 40, 42, 43)
SOILS The Verde River Basin soils are diverse and very influential in the watershed hydrology, erosion, and the sediment supply. Most of the soils at higher elevations are derived from weathered granite and basaltic rocks. Granitic soils have sandy textured surface horizons with weak soil structure and loose consistency making them highly susceptible to water and wind erosion and have a high erosion hazard. These soils probably contribute to natural sediment loads during high storm events. Soils derived from basalt have medium to fine textured surface horizons and clayey subsoils. These soils have low infiltration rates, high surface runoff rates (on slopes greater than about 8 percent), and contribute to increased peak flows and natural sediment loads, during high discharge storm events. Soils derived from the Verde Formation have silty or fine sandy loam surface textures with weak soil structure and loose consistency. These soils are highly erodible and contribute to high natural sediment loads particularly during big storm events. The soils along the mainstem of the Verde River are formed from recent alluvium. Hills, mountains, and plains are the dominant landforms within the watershed. Soils on hills and mountains in the Verde Watershed can be classified as having a high runoff potential with very low infiltration rates. This corresponds to the high flow responses from storm events that have been recorded in the USGS hydrographic records. (38, 39, 40, 42, 43,51) CLIMATE Precipitation in the Verde River watershed ranges from 10 to 20 inches in the valleys, to around 30 inches on the highest mountain elevations.(38) The topographic relief of the Mogollon rim and the Black Hills has an important influence on the climate of the area. These geographic features cause air masses to rise, cool, and release moisture. Precipitation has a strong seasonal pattern throughout the area. Warm winter storms occur in a longer duration and can cause major floods when the rain falls on an accumulated snow pack. Summer monsoon storms are relatively short-duration events, and commonly result in flash flooding.(38)
Most of the precipitation in the Verde River watershed returns to the atmosphere as evapotranspiration. Estimates of evaporation from standard Class A evaporation pans range from 85 to 110 inches per year. Evapotranspiration is estimated to range from 15 inches per year along the mountains to around 25 inches per year in the valley. In 1976 it was estimated that the total evapotransporation for the Verde Valley (between Paulden and Childs) amounted to about 35,000 acre-feet per year of water.(17, 38, 39, 40)
VEGETATION The Ecological Subregions present in the watershed are the Arizona-New Mexico Mountains Section, the White Mountains-San Francisco Peaks-Mogollon Rim Section, the Tonto Transition Section, and a minor component in the Sonoran Desert Section. Predominant vegetation in the White Mountains-San Francisco Peaks-Mogollon Rim Section include ponderosa pine, gambel oak, and a few areas of Douglas fir and white fir in the highest elevations in the watershed. The Tonto Transition Section is dominated by interior chaparral of turbinella oak and birchleaf

Verde River Turbidity TMDL February 2001, ADEQ
4
mountain mahogany on granitic soils. Pinyon and juniper are common on elevations greater than about 4200 feet. Vegetation would also include mixed conifers and some spruce-fir at the highest elevational extremes, These areas are very limited in overall acreage extent. Velvet mesquite, crucifixion thorn, and a variety of graminoids are found on terraces adjacent to the Verde River. The southern part of the watershed is characterized by a predominance of shrubs including velvet mesquite, acacia, and perennial graminoids. The southern tip is located in the Sonoran Desert Section and is dominated by cacti, including giant saguaro and palo verde.(17, 38, 39, 40, 42, 43) LAND USE The population base of the Verde River watershed is 111,000 people.(38) Population centers are concentrated in the headwaters area in Prescott, Prescott Valley and Chino Valley, and in the communities of the Verde Valley: Camp Verde, Cottonwood, Jerome, and Sedona. Most of these communities lie in Yavapai County, which is the fastest growing, non-metropolitan area in the country. Population in the watershed is expected to double in the next 15 years.(17) According to the land use information provided by the Geographic Information System (GIS) data provided by the Arizona Land Resource Information System (ALRIS), most of the Verde River watershed is a mixture of Federal (military reservation and United States Forest Service (USFS)) and State (state trust), with some private and Indian Reservation lands. The Land is comprised of 66% evergreen forest, 30% rangeland, 2% urban, and 1% bare or exposed rock. The majority of the headwaters of the Verde River are USFS lands, compromising parts of the Prescott, Kaibab, and Coconino National Forests. The major land uses on the private lands in the area are residential and agricultural activities (irrigation and cattle grazing.) Other land uses include silviculture, sand and gravel operations, mining, and recreational activities. The land ownership breakdown of lands within the Verde River watershed is: 64% USFS, 23% Private, 10% State, 2% Tribal, 1% other State and Federal.
ENDPOINT IDENTIFICATION TURBIDITY, AND THE LINKAGE OF WATER QUALITY AND POLLUTANT STANDARDS According to the US EPA, the recommended approach to the development of TMDLs, Waste Load Allocations, and Load Allocations, with limited data, is to develop estimates comprising of the best methods and data available.(44) Turbidity is a measure of the refraction of light, caused by the scattering of the photons, as it passes through a sample of water. This scattering can be due to a variety of causes, however the turbidity standard was created as an indirect measure to protect aquatic wildlife uses from excessive sedimentation and excessive algal blooms. Because turbidity is a dimensionless unit, it is not easily transferred into the TMDL framework. For this TMDL a local TSS versus Turbidity correlation was created (see Graph 2).This allows for the correlation of TSS values in mg/L to turbidity standards and measurements. Target Load Reductions of TSS will equate to reductions of turbidity in order to meet the turbidity water quality standard. Turbidity is a qualitative measure of water clarity or opacity. It is reported in nephelometric turbidity units (NTU’s). Turbidity is a measure of the index of refraction of light when it strikes suspended matter in the water sample. A number of fine (<0.45 microns) suspended particles, such as clay, silt organic matter, plankton, and other microscopic organisms, can cause turbidity in surface waters. As a qualitative measurement, turbidity provides a relative assessment of particulate loading and transport. The turbidity standard addresses excessive sedimentation, which can lead to the formation of bottom deposits that can impact the aquatic ecosystem. This implies that suspended sediments impair water quality, but that natural suspended organic, or biological, particles are part of the healthy biological community. The term “verde” itself is Spanish for green, indicating the large biological component historically present in the river. The Verde River has a high biological (plankton) concentration within the water column. The Verde River is characteristically greener in color when visually compared to other Arizona perennial rivers. Natural plankton itself, as compared to sediment, is not considered a stressor within the standard for turbidity. It is instead considered a narrative pollutant. However, the field instruments used can not differentiate between types of suspended particulates. Thus both suspended sediments and suspended organic particulates are considered the same when quantitatively counted in the turbidity measurements. These organic particulates also have a seasonal variation, with higher concentrations occurring during the summer months. This introduces some variability to the discharge versus turbidity and TSS and to the

Verde River Turbidity TMDL February 2001, ADEQ
5
TSS versus turbidity relationships and correlations. In other words, the turbidity readings will be effected more by the organic particulates present in the water at certain times of the year. These threats and impairments have not occurred as a chronic condition along the listed reaches of the Verde River, and the biological assessments already preformed have indicated a healthy aquatic ecosystem. The Benthic macroinvertebrate data collected over the past several years, for use with ADEQs Biocriteria monitoring program, indicates that the aquatic invertebrate communities score as “exceptional”, with one location rated as “good”. In addition, the past, and present, water quality data of mean turbidity values are within the designated warm-water fishery standard of 50 nephelometric turbidity units (NTU’s).
Sampling Upper Verde River
Verde River Turbidity TMDL February 2001, ADEQ
6
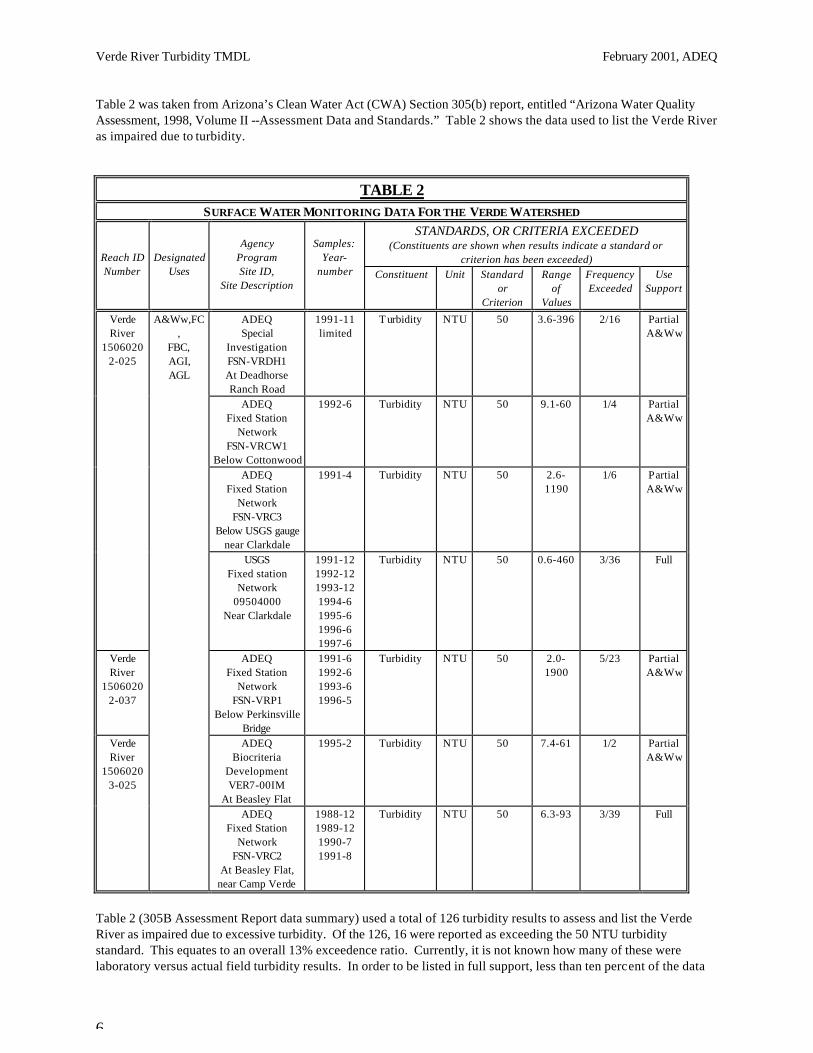
Table 2 was taken from Arizona’s Clean Water Act (CWA) Section 305(b) report, entitled “Arizona Water Quality Assessment, 1998, Volume II --Assessment Data and Standards.” Table 2 shows the data used to list the Verde River as impaired due to turbidity.
TABLE 2 SURFACE WATER MONITORING DATA FOR THE VERDE WATERSHED
STANDARDS, OR CRITERIA EXCEEDED (Constituents are shown when results indicate a standard or
criterion has been exceeded) Reach ID Number
Designated Uses
Agency Program Site ID,
Site Description
Samples: Year-
number
Constituent Unit Standard or
Criterion
Range of
Values
Frequency Exceeded
Use Support
Verde River
15060202-025
A&Ww,FC,
FBC, AGI, AGL
ADEQ Special
Investigation FSN-VRDH1 At Deadhorse Ranch Road
1991-11 limited
T urbidity NTU 50 3.6-396 2/16 Partial A&Ww
ADEQ Fixed Station
Network FSN-VRCW1
Below Cottonwood
1992-6 Turbidity NTU 50 9.1-60 1/4 Partial A&Ww
ADEQ Fixed Station
Network FSN-VRC3
Below USGS gauge near Clarkdale
1991-4 Turbidity NTU 50 2.6-1190
1/6 Partial A&Ww
USGS Fixed station
Network 09504000
Near Clarkdale
1991-12 1992-12 1993-12 1994-6 1995-6 1996-6 1997-6
Turbidity NTU 50 0.6-460 3/36 Full
Verde River
15060202-037
ADEQ Fixed Station
Network FSN-VRP1
Below Perkinsville Bridge
1991-6 1992-6 1993-6 1996-5
Turbidity NTU 50 2.0-1900
5/23 Partial A&Ww
Verde River
15060203-025
ADEQ Biocriteria
Development VER7-00IM
At Beasley Flat
1995-2 Turbidity NTU 50 7.4-61 1/2 Partial A&Ww
ADEQ Fixed Station
Network FSN-VRC2
At Beasley Flat, near Camp Verde
1988-12 1989-12 1990-7 1991-8
Turbidity NTU 50 6.3-93 3/39 Full
Table 2 (305B Assessment Report data summary) used a total of 126 turbidity results to assess and list the Verde River as impaired due to excessive turbidity. Of the 126, 16 were reported as exceeding the 50 NTU turbidity standard. This equates to an overall 13% exceedence ratio. Currently, it is not known how many of these were laboratory versus actual field turbidity results. In order to be listed in full support, less than ten percent of the data
Verde River Turbidity TMDL February 2001, ADEQ
7
set must be below the standard. Ten percent to 25% exceedences are assessed as being in partial support. A total of 214 field turbidity results have been found, of these 24 were documented to have exceeded the turbidity standard. This equates to an 11% exceedence ratio, or 1% away from full support. CONSIDERATION OF SEASONAL VARIATION Collecting historical field turbidity, laboratory Total Suspended Solids (TSS), and discharge data for analyses yielded 163 data points from 1986 to 1999 at the Clarkdale USGS Gauge Station. Only 17 of 163 exceeded the aquatic and wildlife warmwater turbidity standard of 50 NTU’s. This equates to 10.4% exceedences, or partial support. A comparison of exceedences to local rainfall events near the sampling point at Clarkdale shows 71% of the samples were collected after a significant storm event (accumulated measured rainfall of at least 0.25”). This indicates that the majority of the turbidity exceedences occurred during responses to storm events. The Verde River encompasses a very large watershed that is subject to flashy conditions and experiences extreme flow regimes, as demonstrated by the USGS gauge station hydrographs.(51) These conditions can cause a flushing of the system at lower flows, due to a storm surge through the system. In the late summer, after flows have been diminishing for some time, a small storm event can create a “flushing flow” which washes excessive amounts of sediment into the system and resuspends the sediments already present. However, the actual discharge value for some of these “flushing flows” can be lower than the more steady, yet higher spring flow discharge values caused by snow melt and rain events. These spring flows are higher in value, yet are decreasing over time, loosing energy, and dropping out sediments. This relationship between flushing flows and steady flows is responsible for introducing variability into the discharge versus TSS and turbidity relationships. Another way that variability is introduced into the TSS and turbidity versus discharge relationships is through the functionality of the ephemeral tributaries to the Verde River.(23) Ephemeral dry washes accumulate sediment, as shown by recent studies conducted in the Verde River watershed.(17, 47) Then an intense, and localized, thunderstorm can generate significant precipitation in a relatively short duration. This precipitation can generate sheet that corresponds to localized in-stream flows within the ephemeral stream channels. In-stream flows effectively “flush” the stored sediments down the ephemeral stream channel and into the Verde River. While significant amounts of sediment, and thus turbidity, are added to the Verde River itself, the localized storm cell may not generate significant amounts of flow to effectively increase the discharge of the Verde River mainstem, relative to the amount of contributed sediment and turbidity. In this situation sediment and turbidity are significantly increased, while flow itself in the mainstem of the Verde River is not affected to the same degree.(23) This TMDL was designed to address those concerns. Its corresponding load allocations and load reductions separate the large storm event driven high flows from the average steady flows. As per the TMDL guidance protocol set forth by the US EPA, the critical flow regime for the impairment of the turbidity water quality standard is storm-event driven large flows. The turbidity impairment is associated with excessive sediments suspended in the water column. These sediments are contributed to the system and resuspended during the higher flow events, which increase the stream velocity, energy, shear stress, and erosional forces present within the watershed. These critical storm driven flows were separated from the average base flows, and average values for both the critical storm driven flow and the average base flow were calculated. Data from over 13 years of record for the Clarkdale USGS gauge station (April 1987 to March 1998) were used to calculate the critical storm flow.(51) Critical storm values are based on separating all the discharge values above 100 cfs (generally at or above bank full) for the last 13 years in order to derive a mean critical storm stream flow of 1,180 cfs. This critical storm flow value equates to approximately half of a bankfull discharge event (2,400 cfs) that occurs in a 1.3 year recurrence interval. This critical flow flood event will overtop numerous silt laden water catchments, and contribute excessive fine sediments during infrequent, large storm (flash flood) events. This results in an unusually high, short duration sediment transportation event, as opposed to a gradual, evenly distributed sediment contribution to the river system. The average flow value for a 13 year period of information (October 1986 to May 1999 at the Clarkdale USGS gauge station) was also calculated, and found to be 84 cfs. To take into consideration this discharge variation, and address the critical flow for the turbidity exceedence, this TMDL is designed for the critical storm flows. The critical flow will be the critical spring flow value, which was
Verde River Turbidity TMDL February 2001, ADEQ
8
calculated to be 1,180 cfs. The critical flow value was then used to calculate a corresponding turbidity and TSS reading by utilizing the Turbidity & TSS vs. Discharge graph (Graph 3, Appendix) and the TSS vs. Turbidity graph (Graph 2, Appendix). Both of the correlation graphs, and the resulting equations, are based on data obtained through field measurements and records on the Verde River. This correlation allows a numeric estimate of the amount of sediment and turbidity present in the stream during critical flow. The average base flow was calculated and found to be considerably lower, 84 cfs as opposed to 1,180 cfs. Recalculation of the TMDL values using the average flow value of 84 cfs (in place of the storm flow value of 1,180 cfs) reveals some interesting information about the watershed and sediment transport during regular flow events, and will be used in guiding TMDL milestones, load allocations, and implementation guidelines.

Verde River Turbidity TMDL February 2001, ADEQ
9
View of the Upper Verde River Near the Verde River Ranch

Verde River Turbidity TMDL February 2001, ADEQ
10
BACKGROUND SITE LOCATION AND VALUES A search was conducted to identify another watershed consisting of the same geography, geology, hydrology, vegetation, channel mo rphology, and watershed size as the Verde River watershed. The next criteria was that the watershed have no, or minor, anthropogenic influences. No suitable site could be found that was near the same watershed size, or flow regime, as the Verde River. A background site is essential for this TMDL, in order to compare natural sediment levels and turbidity values. Therefore, the search was modified to identify any relatively undisturbed, or unlisted, waterbody within the watershed (or a tributary to the Ve rde River) that could be used to approximate natural background values. Finding another watershed, of the same size and characteristics as the Verde River watershed, would be augmented through the use of a ratio to estimate the background TSS for the Verde River. Instead of directly substituting the turbidity and TSS values from the background location, it will now be necessary to perform a minor calculation to estimate what the comparable background values would be for the larger, higher flow Verde River system. Criteria for the search consisted of the following:
1. The potential site must lie within, or tributary to, the Verde River watershed 2. Must be an unlisted (303(d)) water body for exceedences of the surface water quality turbidity standard 3. It should have no, or few, anthropogenic disturbances within it’s watershed boundary 4. There should be a sufficient amount of TSS and discharge data to perform the necessary calculations
The search resulted in choosing West Clear Creek to serve as the background site for establishing a background sediment load value. West Clear Creek fits the unlisted, relatively undisturbed criteria, while having the most TSS data available. In addition, its confluence with the Verde River is at the termination of the Verde River listed reaches due to turbidity impairments. This provides a proximal spatial comparison (physical and meteorological similarities) within the watershed, while not contributing to the sediment loading within the listed reaches of the Verde River. A simple ratio of mean flow to TSS, over two distinct time periods (1996, and the end of 1998 to the end of 1999), will be used for determination of the background sediment values. These values will be compared to the Verde River for the same time periods.
BACKGROUND SEDIMENT LOAD VALUES Equation 1. CALCULATION OF BACKGROUND VALUE (lbs. of TSS per day), “Q” represents the average flow in mgd, and “TSS” represents the average TSS value (as measured for WCC) West Clear Creek (WCC) Verde River (VR)
Solve equation 1 for TSSVR, using the values from the following chart, to arrive at a corresponding background load value of TSS for the Verde River in mg/L (19.4). Then to convert the 19.4 mg/L into a daily load value for TSS in the Verde River, input the 19.4 mg/L TSS value into the following equation to arrive at a background TSS load value in lbs./day (8,736).
Flow (mgd) x average TSS (mg./L) x 8.34@ = Background, TSS (lbs./day)
VERDE RIVER: CALCULATION OF BACKGROUND VALUE
AVERAGE WEST CLEAR CREEK VALUES AVERAGE VERDE RIVER VALUES
Flow (cfs) Flow (mgd) TSS (mg/L) Flow (cfs)
Flow (mgd) TSS (mg/L)
Background, TSS (lbs./day)
18+ 12 4.3* 84++ 54 19.4# 8,736
@ - 8.34 is a conversion factor to transform mg./L to lbs./day, the units are (lbs).(L)/(mg)(106 gallons) + - Average flow values taken from USGS Gauge Station 09505800 having TSS data * - Average of TSS values taken from USGS Gauge Station 09505800 having discharge data # - Calculated using Equation 1 ratio from average West Clear Creek TSS/flow to Verde River flow ++ - Average flow values from USGS Gauge Station at Clarkdale, AZ on the Verde River
TSSWCC
QWCC
=TSSVR
QVR

Verde River Turbidity TMDL February 2001, ADEQ
11
IDENTIFICATION AND DESCRIPTION OF POLLUTANT SOURCES In order to verify and identify a turbidity impairment on the Verde River, a watershed wide sampling effort by ADEQ was undertaken in October and December of 1999. One hundred and eighty turbidity readings were obtained from above Perkinsville to Camp Verde. All turbidity values observed were below the 50 NTU aquatic and wildlife warmwater standard. These turbidity readings were not taken following a storm event. The purpose of this sampling effort was to identify any potential sediment sources in the watershed contributing excessive amounts of sediment during lower flows. No TSS data was collected during these field visits; therefore these values were not used in the creation of the turbidity versus TSS correlation. However, historic data gathered from various sources confirms that there is an exceedence of the Aquatic and Wildlife warm (A&Ww) water turbidity standard during higher storm driven flows. Proper Functioning Condition (PFC) assessments by the Rocky Mountain Forest and Range Experiment Station concluded that the Verde River is in a slow degradational phase. They found fine grained sediments (<2mm) to be generally absent from the upper Verde River.(24, 51) ADEQ verified this conclusion with observations of selective erosion, or headcutting, occurring at tributary confluences. Sediment features (bars) were generally comprised of just cobbles and gravels. Sandbars were present only above the bank full to flood prone features where established vegetation was present. The results from the watershed wide sampling effort suggest there are no “hot spots” for turbidity, or smaller sections where the sediment load is occurring in excessive amounts. The turbidity values suggest an even distribution of sediment along the entire Verde River. PINYON PINE AND JUNIPER COMMUNITIES Many portions of the watershed are experiencing a substantial increase in the density of pinyon pine and juniper trees, while some areas have remained relatively stable over time.(8) Heavy grazing along with fire suppression, has contributed to the increase in pinyon/juniper woodlands and a reduction in open grasslands. The density of trees, and the aerial extent of these communities, is evidenced by historic photos and the age structure of these woodlands.(8) These trees effectively out compete other shrub and herbaceous species resulting in increased soil erosion and reduced nutrient cycling. The deep, tap roots of pinyon and juniper are much less effective in retaining soil than the fibrous, surface roots of herbaceous species.(17) As pinyon/juniper woodlands continue to increase, and as the rill and gully erosion areas continue to expand and become connected, these communities will be an increasing source of sediment into the Verde system, particularly in large storm events that generate overland flow. GRAZING Cattle grazing has been a historic use of the Verde Watershed. Past grazing management practices around the turn of the century, during the times of ‘free range’ practices, had drastic impacts on the soil, vegetation, and streams in the watershed. These grazing practices resulted in reduced vegetation and stream bank stability in the riparian areas. On upland areas much of the soil surface (A horizon) was eroded away. This is the layer where organic matter is cycled and soil building occurs. The loss of soil resulted in changes in vegetation from herbaceous species dominance to pinyon/juniper and desert shrub communities. The effects of these practices are still an impact in the watershed today, evidenced by a lack of surface organic matter, nutrient cycling, and soil building, rocky soil surfaces where fine size soil particles have been eroded, and bare soils.(17, 38) Recent livestock grazing on Forest Service administered portions of the Verde River riparian corridor varies by grazing allotment. No livestock grazing has been permitted by the Forest Service (FS) on the upper portions of the Verde River (above Clarkdale) since 1997. Some ranchers removed their cattle from these lands before this time. Most Forest Service lands in the Verde Valley have not been grazed since the early 1980’s. Limited livestock grazing is still permitted on small sections of the river below Camp Verde. Livestock grazing on privately owned sections of the river is still occurring. Elk populations in the higher elevations of the watershed are creating new management problems, as herds tend to concentrate and overuse certain areas, especially riparian areas.(17, 38) ROAD CUTS Roads are a major source of sediment. Roads directly accessing riparian habitat along the Verde River are limited on Forest Service administered lands, except in the Verde Valley. Vehicles crossing and traveling in the river are a large

Verde River Turbidity TMDL February 2001, ADEQ
12
source of sediment and disturbance in the Verde Valley. While USFS can issue citations on public lands, this activity is legal on private lands.(17, 38) OFF HIGHWAY VEHICLES (OHVs) OHV recreation continues to increase in the Verde Watershed. The USFS has designated Hayfield Draw as an OHV recreation area, and has it monitored as to which treatments and structures (i.e. BMPs) are the most effective in reducing soil erosion on these soil types. .Hayfield Draw is located near the river and OHV use outside of the designated site, and in the river, continues to be a problem and is contributing sediment to the river.(17, 38) STRUCTURES The water and sediment budget of the Verde River has been altered by the construction of numerous water retention and diversion structures including: Sullivan Lake Dam, hundreds of cattle tanks, and irrigation diversions. These structures affect water and sediment transport in the system, but their impact on the total sediment budget is unknown. Cattle tanks serve to trap fine sediments and may reduce the overall delivery to the river. However, they also trap water, which is evaporated or used by livestock and wildlife.(17, 38) While these structures can reduce sediment there are other sources such as roads, recreation, pinyon/juniper communities, diversions and other management practices that are increasing sediment.(17, 38) Sullivan Lake Dam was constructed in 1938 and was full of sediment four years later. For a period of time this dam had a significant impact on sediment delivery into the river, particularly fine sediments.(24) The continued impact of Sullivan Lake Dam on the amount of sediment in the Verde River has not been effectively quantified. Sullivan Lake dam is silted to the crest line, and has retained the fine grained sediments normally contributed to the Verde River by the Chino Valley drainage system. The contained silt only enters the river system when there is a significant flow event to crest the dam. During a large storm event, water in the Chino Valley area flows towards Sullivan Lake Dam. If the increased water flow succeeds in over-topping the structure, turbulence and energies are increased at the lip of the dam. This transports a large amount of the stored fine sediments to the river system in a relatively short duration.(24, 43)
SEDIMENT SLUFFS/SLUGS Headcutting, incision, mass wasting, and cutbanks contribute a sediment load to the system during high energy, flash flood driven flow events. This contribution is mostly natural in this system. Also large amounts of sediment are contributed to the Verde River during relatively short duration, high flow events. This is done through a combination of mechanisms, which includes the functionality of the ephemeral tributaries to the Verde River, and the water impoundment structures on the Verde. The ephemeral dry washes accumulate sediment.(47) When an intense precipitation event occurs within the watershed it can generate significant precipitation in a relatively short duration. The precipitation generates sheet flow that leads to discharge in the ephemeral stream channels. These in stream flows effectively “flush” the stored sediments down the ephemeral stream channels and into the Verde River. This action combined with water overtopping the water catchment structures during these high flow events leads to an increase in sediment loads to the river during the large precipitation events. This creates a “slug” of sediment moving down the river, which is deposited in the channel (or flood plain where applicable) and is then resuspended and transported during subsequent large flow events. Resulting in “slugs” of sediment resuspended and transported only during the large flow events.(17, 23, 38) BIOLOGICAL ACTIVITY As described earlier in this document, organic particulates (such as plankton) suspended in the water column account for a small portion of the actual turbidity measurements. Other biological activity disturbs the soils and introduces sediments to the system, but these effects are negligible at best. Turbidity data collected by Rocky Mountain Research Station indicates organic sources cause a majority of the turbidity in measurements.(29, 49) NATURAL CONDITIONS Natural levels for sediment are believed to be significant inputs into the Verde River, but have been accelerated due to anthropogenic influences. These inputs are highly variable both seasonally, and between years depending upon natural conditions. In years of major storm events, background levels of sediment are high, and during years of mild climate sediment levels will be lower. There are several sources of fine sediments within the watershed. Many of the
Verde River Turbidity TMDL February 2001, ADEQ
13
soil types in the watershed have inherently high amounts of bare soil, resulting in high levels of soil erosion. On certain soil types, such as the Coconino sandstone, barren soils are a geologic property. On other soil types, such as basalt soil types, past land management practices have modified the soil surface and plant communities present to create the barren soils.(17, 38)
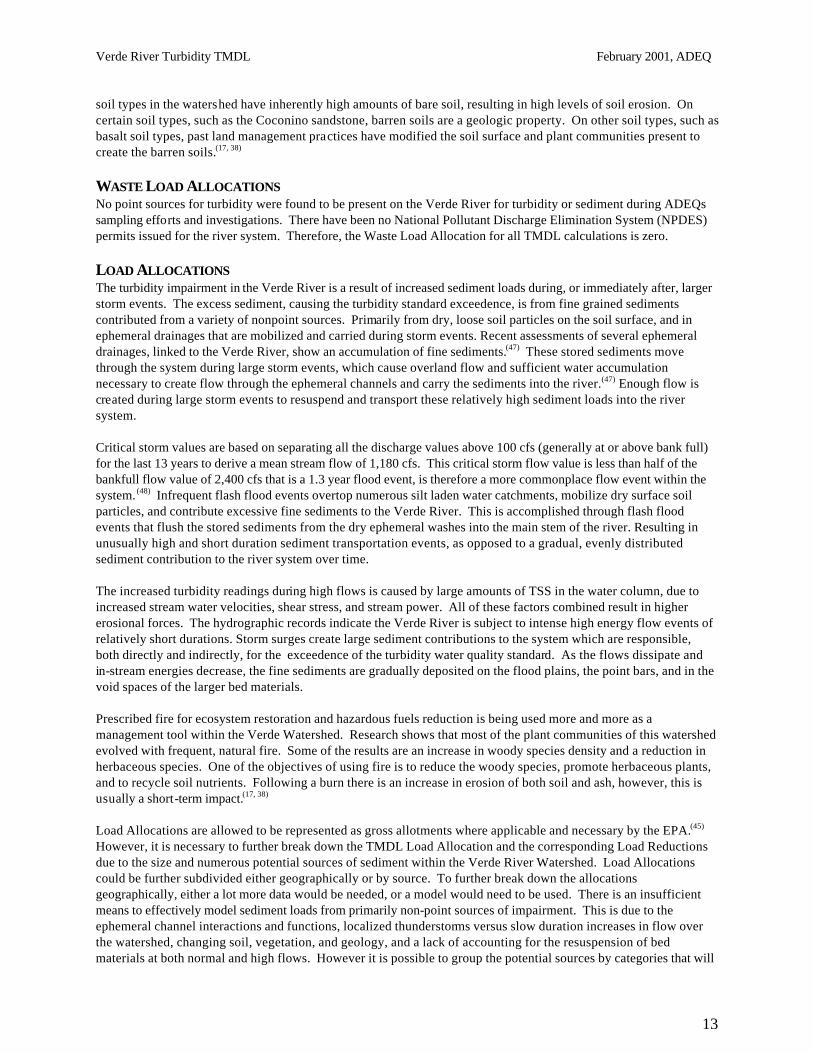
WASTE LOAD ALLOCATIONS No point sources for turbidity were found to be present on the Verde River for turbidity or sediment during ADEQs sampling efforts and investigations. There have been no National Pollutant Discharge Elimination System (NPDES) permits issued for the river system. Therefore, the Waste Load Allocation for all TMDL calculations is zero. LOAD ALLOCATIONS The turbidity impairment in the Verde River is a result of increased sediment loads during, or immediately after, larger storm events. The excess sediment, causing the turbidity standard exceedence, is from fine grained sediments contributed from a variety of nonpoint sources. Primarily from dry, loose soil particles on the soil surface, and in ephemeral drainages that are mobilized and carried during storm events. Recent assessments of several ephemeral drainages, linked to the Verde River, show an accumulation of fine sediments.(47) These stored sediments move through the system during large storm events, which cause overland flow and sufficient water accumulation necessary to create flow through the ephemeral channels and carry the sediments into the river.(47) Enough flow is created during large storm events to resuspend and transport these relatively high sediment loads into the river system. Critical storm values are based on separating all the discharge values above 100 cfs (generally at or above bank full) for the last 13 years to derive a mean stream flow of 1,180 cfs. This critical storm flow value is less than half of the bankfull flow value of 2,400 cfs that is a 1.3 year flood event, is therefore a more commonplace flow event within the system. (48) Infrequent flash flood events overtop numerous silt laden water catchments, mobilize dry surface soil particles, and contribute excessive fine sediments to the Verde River. This is accomplished through flash flood events that flush the stored sediments from the dry ephemeral washes into the main stem of the river. Resulting in unusually high and short duration sediment transportation events, as opposed to a gradual, evenly distributed sediment contribution to the river system over time. The increased turbidity readings during high flows is caused by large amounts of TSS in the water column, due to increased stream water velocities, shear stress, and stream power. All of these factors combined result in higher erosional forces. The hydrographic records indicate the Verde River is subject to intense high energy flow events of relatively short durations. Storm surges create large sediment contributions to the system which are responsible, both directly and indirectly, for the exceedence of the turbidity water quality standard. As the flows dissipate and in-stream energies decrease, the fine sediments are gradually deposited on the flood plains, the point bars, and in the void spaces of the larger bed materials. Prescribed fire for ecosystem restoration and hazardous fuels reduction is being used more and more as a management tool within the Verde Watershed. Research shows that most of the plant communities of this watershed evolved with frequent, natural fire. Some of the results are an increase in woody species density and a reduction in herbaceous species. One of the objectives of using fire is to reduce the woody species, promote herbaceous plants, and to recycle soil nutrients. Following a burn there is an increase in erosion of both soil and ash, however, this is usually a short-term impact.(17, 38) Load Allocations are allowed to be represented as gross allotments where applicable and necessary by the EPA.(45) However, it is necessary to further break down the TMDL Load Allocation and the corresponding Load Reductions due to the size and numerous potential sources of sediment within the Verde River Watershed. Load Allocations could be further subdivided either geographically or by source. To further break down the allocations geographically, either a lot more data would be needed, or a model would need to be used. There is an insufficient means to effectively model sediment loads from primarily non-point sources of impairment. This is due to the ephemeral channel interactions and functions, localized thunderstorms versus slow duration increases in flow over the watershed, changing soil, vegetation, and geology, and a lack of accounting for the resuspension of bed materials at both normal and high flows. However it is possible to group the potential sources by categories that will
Verde River Turbidity TMDL February 2001, ADEQ
14
allow for smaller allocations, and will make it possible to set goals and judge the effectiveness of Implementation Plans to meet the necessary Load Reductions to meet the TMDL Load Allocations. Load Allocations that are grouped by potential source can more readily be tied to implementation goals and efforts. The Load Allocations were broken down by potential source through discussions amongst ADEQ staff and Regional and Local USFS personnel until agreements were reached that represented the watershed characteristics and a feasible management strategy and goals for implementation.(17, 23, 38) PINYON PINE AND JUNIPER COMMUNITIES (25%) While some areas of high pinyon/juniper concentrations are well armored with rock on the surface, other areas have fine textured surface soils and reduced soil stability that results in soil losses through both wind and water erosion. Observations indicate this is a large source of fine sediments during storm events, which generate sheet flow. These sediments are eventually available for delivery to the Verde River system during larger storm events. Evidence of increasing rill erosion and the formation of gullies has been observed in areas of dense pinyon/juniper canopies, which will result in more soil erosion and faster delivery of water and sediment to the river system. Heavy grazing along with fire suppression has contributed to the increase in pinyon/juniper woodlands and a reduction in open grasslands. The density of trees, and the aerial extent of these communities, is evidenced by historic photos and the age structure of these woodlands. Pinyon/juniper outcompete herbaceous species for moisture and sunlight. Pinyon/juniper communities are much less effective in stabilizing the soil surface than the shallow, fibrous rooted herbaceous grass species. Observations indicate this is a large source of fine sediments on certain soil types with fine textured surface soils. As pinyon/juniper woodlands continue to expand, they will be an increasing source of sediment into the Verde system, particularly in large storm events that generate sheet flow. Reduction of pinyon/juniper densities affords an opportunity to increase vegetative ground cover, increase infiltration, slow over surface runoff, and increase perennial herbaceous species.(17, 38, 42, 43)
GRAZING (20%) Ungulate grazing within a watershed can contribute sediment to the system by disruption of the soil surface, soil compaction, removal of organic matter, and trailing. In riparian areas grazing can reduce riparian vegetation, destabilize banks, and cause in-stream disturbances that reduces the functionality of the stream. (17, 38) Past grazing management practices around the turn of the century, during the times of ‘free range’ grazing practices, had drastic impacts on the soil and vegetation of the Verde Watershed. Much of the soil surface (A horizon) was eroded away, this is the layer where organic matter is cycled and soil building occurs. The loss of soil resulted in changes in vegetation from herbaceous species dominance to pinyon/juniper and desert shrub communities. The effects of these practices are still an impact in the watershed today. Livestock continue to graze most of the watershed, and elk populations continue to increase. Improper livestock and wildlife grazing is a source of fine grained sediment. When ungulates overuse an area there is the potential for increased soil loss, compaction and accelerated overland flow due to: removal of organic matter, soil surface disturbance, and trailing.(17, 38) Improved range management techniques and implementation of best management practices are helping to reduce soil erosion. These practices include: rest, grazing rotations, exclusion, salting practices, utilization limits, and timing of grazing. These Best Management Practices (BMPs) are being used throughout the watershed. However, in the higher elevations concentrated over-utlization by elk is an increasing problem, and management of these herds to reduce resource impacts has had little success. ROAD CUTS (10%) Roads are a source of sediment to the watershed. The Forest Service is mandated to maintain system roads to certain standards, however, non system roads created by recreationists are always a problem. Much effort is spent on closing non-system roads and reducing off road travel. While road maintenance is a priority for the Forest Service, adequate funding is not always available. Recent research and testing by the USDA on water and road interactions should help reduce sedimentation from roads as these practices are implemented.(17, 38) Heavy recreation use on the Verde River, it’s tributaries, and in the watershed is a source of fine sediment. This source is expected to continue to increase along with the projected population increases in Yavapai County and in

Verde River Turbidity TMDL February 2001, ADEQ
15
the Phoenix metropolitan area. Recreation can contribute sediment from soil compaction on camp sites, trails, stream crossings, off road vehicle travel, and stream bank tramping.(17, 38)
Although roads directly accessing the river are limited on USFS lands, all roads within the watershed contribute sediments that eventually reach the river. The USFS follows guidelines for road design, maintenance, and obliteration. However, recreationists are continually creating new roads, and funding for road maintenance are sometimes insufficient. This is an area with potential for sediment reduction.(17, 38) OFF HIGHWAY VEHICLES (OHVs) (10%) OHV recreation continues to increase within the Verde Watershed. The USFS has designated Hayfield Draw as an OHV recreation area. The area is monitored as to which treatments and structures (i.e. BMPs) are the most effective in reducing soil erosion on these soil types. The most effective BMPs have been installed and/or implemented. Hayfield Draw is located near the river and OHV use outside of the designated boundaries, and in the river, continues to be a problem and is contributing sediment to the river.(17) OHVs can channel and redirect water flow, cause erosion, and the subsequent sediment delivery to stream courses. The potential to reduce fine sediment erosion from OHV activities is limited in the Verde Watershed. Most OHV use occurs in the Verde Valley, where Forest Service management of the riparian corridor is limited. There are areas, near Hayfield Draw and Black Canyon, that would benefit from improved management and increased enforcement activities, which could reduce sediment contributions to the Verde River. However, in most other areas woodland/shrubland vegetation and steep terrain limit most OHV use to the designated trails.(17, 38) STRUCTURES (10%) As mentioned previously, water impoundment structures (such as Sullivan Lake Dam and other cattle tanks) have greatly effected the delivery mechanisms for fine grained sediments into the Verde River system. Observations and studies suggest that, during lower base flows, there is a deficit of fine sediments in the Verde River, but that during higher discharge events there is an excessive amount of fine sediments contributed to the Verde River. This is caused, in part, due to these water impoundment structures. Modification or management of these structures could reduce sediment contributions to the Verde River during high discharge, large precipitation driven flow events.(17, 23,
24, 38, 49) SEDIMENT SLUFFS/SLUGS (6%) Fine sediments are currently stored in the void spaces of larger bed materials (and flood plains and point bars where applicable) within the Verde River system. During large flow events, these fine sediments are resuspended and transported further down the system. These fine sediment “slugs” continue to advance their way through the system during high energy, large flow events, which are typically driven by storms.(23)
BIOLOGICAL ACTIVITY (3%) Organic suspended materials and organisms present in the water column can also effect the turbidity readings themselves by scattering the light of the turbidity meter in the same manner as suspended solids, such as fine sediment particles. Recent studies on the upper Verde River by Rocky Mountain Research Station have found that most of the turbidity during the average base flows is due to organic sources.(49)
NATURAL CONIDTIONS (15%) Natural sediment contributions are the result of geologic formations and processes and their interactions with the vegetation, soils, and wildlife occurring within the watershed. Sediment inputs from land management activities will be highly variable since these are affected by daily, seasonal, and annual variations in weather and climate. A major long-term investment of time and money would be necessary to increase any likelihood of detecting the estimated changes in the channel morphology, aquatic habitat, and other factors which could allow for a quantification as to the amount of naturally occurring erosion and sediment transportation to the Verde River. A lot of the natural erosion and sediment delivery has been adversely effected by human interactions with the system. One of the primary objectives for most Forest Service implementation projects is to increase Vegetative Ground Cover (VGC). This increase in VGC would allow for greater soil stability and effectively reduce some of the anthropogenic influences to the natural conditions. Projects include range, recreation, watershed, and road management. The

Verde River Turbidity TMDL February 2001, ADEQ
16
amount of VGC is used as an indicator of soil stability and nutrient cycling. However, for this TMDL and the implementation plans for reaching the necessary load reductions, no reduction in sediment from natural conditions is expected, or allocated for.(17, 23, 38)
MARGIN OF SAFETY The Margin of Safety (MOS) for this TMDL is set to be 10% of the Load Allocation value. This MOS accounts for errors in calculating the critical and average flows, the innate errors present in the correlation of TSS with turbidity and discharge, the possible error in the use of a ratio to estimate historic natural background values, and for the accuracy of the measurements and instruments. An implicit MOS exists as part of the implementation plan. The goals for the Load Reductions in the implementation portion of this TMDL actually add up to be greater than the necessary Load Reductions set forth in this document to comply with the TMDL and Load Allocations called for to maintain compliance with the Water Quality Standards. TMDL CALCULATION Calculations for the TMDL for turbidity for the critical storm flows are as follows: The following equations were derived from values obtained from USGS sample locations, field measurements, and previous data collection efforts. USGS field turbidity readings, laboratory TSS data, and discharge measurements were compared and graphed as scatter plots to allow for the determination of a relationship between those variables. A correlation coefficient, or regression analysis, was performed on each graphical representation of the data. These regression analysis values (R2) are listed on their corresponding graphs. Regression (R2)) is given as, two stochastically dependent random variables, that measure the mean expectation of one -relative to the other. A regression analysis value (R2) equal to one is the best-fit line between all scatter plot points on a graph. Thus, scatter point graphs having a regression of one (R2=1) would be a perfect straight line, and thus a perfect correlation between those variables. As a general rule, if the absolute value of R2 exceeds 0.85, the fit is considered good.(22) However, natural systems do not readily lend themselves to simple trend, or regression, analyses. Seasonal variations and chaotic events can all introduce randomness to the data, or slightly change the relationship. Efforts to improve R2 were taken, without significant improvements -such as researching and using all available field data, and removing out-layer scatter points. The following equations represent all available data that contains a single sample event in time that was analyzed for turbidity in the field, TSS in the laboratory, and discharge in the field. The following equations are used repeatedly throughout subsequent data calculations:
Equation 2. Taken from the solution to the line best fitting the data in Graph 2, TSS vs. Turbidity (Appendix) TSS=2.3069(turbidity), R2=0.7783
Equation 3. Taken from the solution to the line best fitting the data in Graph 3, TSS and Turbidity vs. Discharge
(Appendix)
TSS = 0.0965(Q) + 37.774, R2=0.5483
Equation 4. Taken from the solution to the line best fitting the data in Graph 3, TSS and Turbidity vs. Discharge (Appendix)
Turbidity = 0.0263(Q) + 15.954, R2=0.2581
The regression fit of R2=0.7783 for TSS vs. Turbidity is a good relationship for a natural system and is therefore acceptable. A regression of R2=0.5483 for the TSS correlation to discharge is acceptable for a natural system of this type, and under these conditions. The regression value for turbidity to discharge, R2=0.2581, is questionable at best. Therefore the TSS to Discharge relationship will be utilized in this TMDL for the purpose of calculating and

Verde River Turbidity TMDL February 2001, ADEQ
17
estimating sediment loads at various flows, which were unable to be directly monitored. Equation 4, the turbidity to discharge correlation, will not be utilized for the purposes of this TMDL report or calculations. However, it should be pointed out that some innate variability will be built into any natural system. Trying to define a statistical relationship from data gathered from these natural systems (which are subject to chaotic behaviors at times, and unforeseen events) is often difficult. This is especially true in Arizona, where flows vary given the time of year. A system has decreasing “steady” flows for several months in a row through the summer (following the snowmelts and any spring storms) until the summer monsoons start. The monsoon storms generate “flushing” flows, which flush the sediment into the system from the ground surface as sheet flow. They also resuspend stored fine sediments, which were previously deposited as the flows slowly decreased in discharge, lost energy, and dropped out their sediment loads. Although these monsoon storm generated flows may be an increased discharge at that point in time, when compared to the rest of the year, other “steady” flows may have actually had higher discharge values. In other words, after a long dry spell (such as the summer) even a small precipitation event will lead to an increased contribution of sediment, although the actual discharge measurement may be lower than at other times of the year.
Recreational Activities are a Primary Use of the Verde River
Verde River Turbidity TMDL February 2001, ADEQ
18
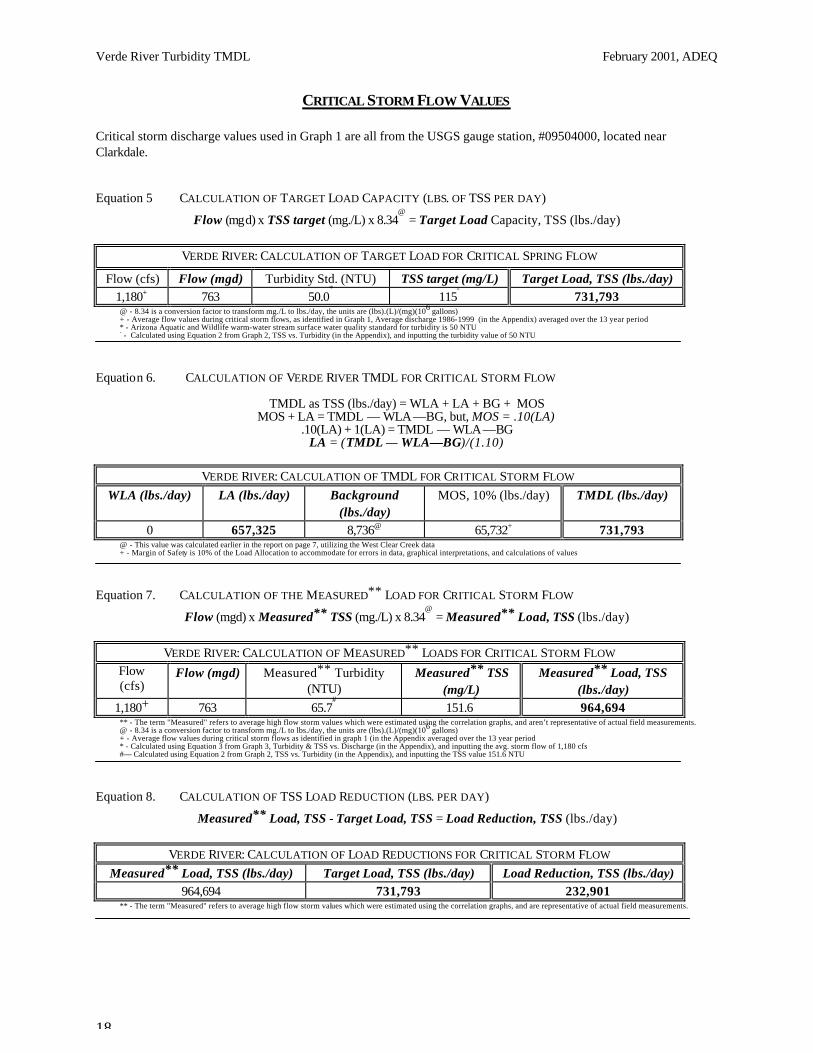
CRITICAL STORM FLOW VALUES Critical storm discharge values used in Graph 1 are all from the USGS gauge station, #09504000, located near Clarkdale. Equation 5 CALCULATION OF TARGET LOAD CAPACITY (LBS. OF TSS PER DAY)
Flow (mgd) x TSS target (mg./L) x 8.34@
= Target Load Capacity, TSS (lbs./day)
VERDE RIVER: CALCULATION OF TARGET LOAD FOR CRITICAL SPRING FLOW
Flow (cfs) Flow (mgd) Turbidity Std. (NTU) TSS target (mg/L) Target Load, TSS (lbs./day) 1,180+ 763 50.0
* 115-
731,793 @ - 8.34 is a conversion factor to transform mg./L to lbs./day, the units are (lbs).(L)/(mg)(106 gallons) + - Average flow values during critical storm flows, as identified in Graph 1, Average discharge 1986-1999 (in the Appendix) averaged over the 13 year period * - Arizona Aquatic and Wildlife warm-water stream surface water quality standard for turbidity is 50 NTU - - Calculated using Equation 2 from Graph 2, TSS vs. Turbidity (in the Appendix), and inputting the turbidity value of 50 NTU
Equation 6. CALCULATION OF VERDE RIVER TMDL FOR CRITICAL STORM FLOW
TMDL as TSS (lbs./day) = WLA + LA + BG + MOS MOS + LA = TMDL — WLA—BG, but, MOS = .10(LA)
.10(LA) + 1(LA) = TMDL — WLA—BG LA = (TMDL — WLA—BG)/(1.10)
VERDE RIVER: CALCULATION OF TMDL FOR CRITICAL STORM FLOW
WLA (lbs./day) LA (lbs./day) Background (lbs./day)
MOS, 10% (lbs./day) TMDL (lbs./day)
0 657,325 8,736@ 65,732+ 731,793
@ - This value was calculated earlier in the report on page 7, utilizing the West Clear Creek data + - Margin of Safety is 10% of the Load Allocation to accommodate for errors in data, graphical interpretations, and calculations of values
Equation 7. CALCULATION OF THE MEASURED** LOAD FOR CRITICAL STORM FLOW
Flow (mgd) x Measured** TSS (mg./L) x 8.34@
= Measured** Load, TSS (lbs./day)
VERDE RIVER: CALCULATION OF MEASURED** LOADS FOR CRITICAL STORM FLOW Flow (cfs)
Flow (mgd) Measured** Turbidity (NTU)
Measured** TSS (mg/L)
Measured** Load, TSS (lbs./day)
1,180+ 763 65.7# 151.6
* 964,694 ** - The term "Measured" refers to average high flow storm values which were estimated using the correlation graphs, and aren’t representative of actual field measurements. @ - 8.34 is a conversion factor to transform mg./L to lbs./day, the units are (lbs).(L)/(mg)(106 gallons) + - Average flow values during critical storm flows as identified in graph 1 (in the Appendix averaged over the 13 year period * - Calculated using Equation 3 from Graph 3, Turbidity & TSS vs. Discharge (in the Appendix), and inputting the avg. storm flow of 1,180 cfs #— Calculated using Equation 2 from Graph 2, TSS vs. Turbidity (in the Appendix), and inputting the TSS value 151.6 NTU
Equation 8. CALCULATION OF TSS LOAD REDUCTION (LBS. PER DAY)
Measured** Load, TSS - Target Load, TSS = Load Reduction, TSS (lbs./day)
VERDE RIVER: CALCULATION OF LOAD REDUCTIONS FOR CRITICAL STORM FLOW Measured** Load, TSS (lbs./day) Target Load, TSS (lbs./day) Load Reduction, TSS (lbs./day)
964,694 731,793 232,901 ** - The term "Measured" refers to average high flow storm values which were estimated using the correlation graphs, and are representative of actual field measurements.
Verde River Turbidity TMDL February 2001, ADEQ
19
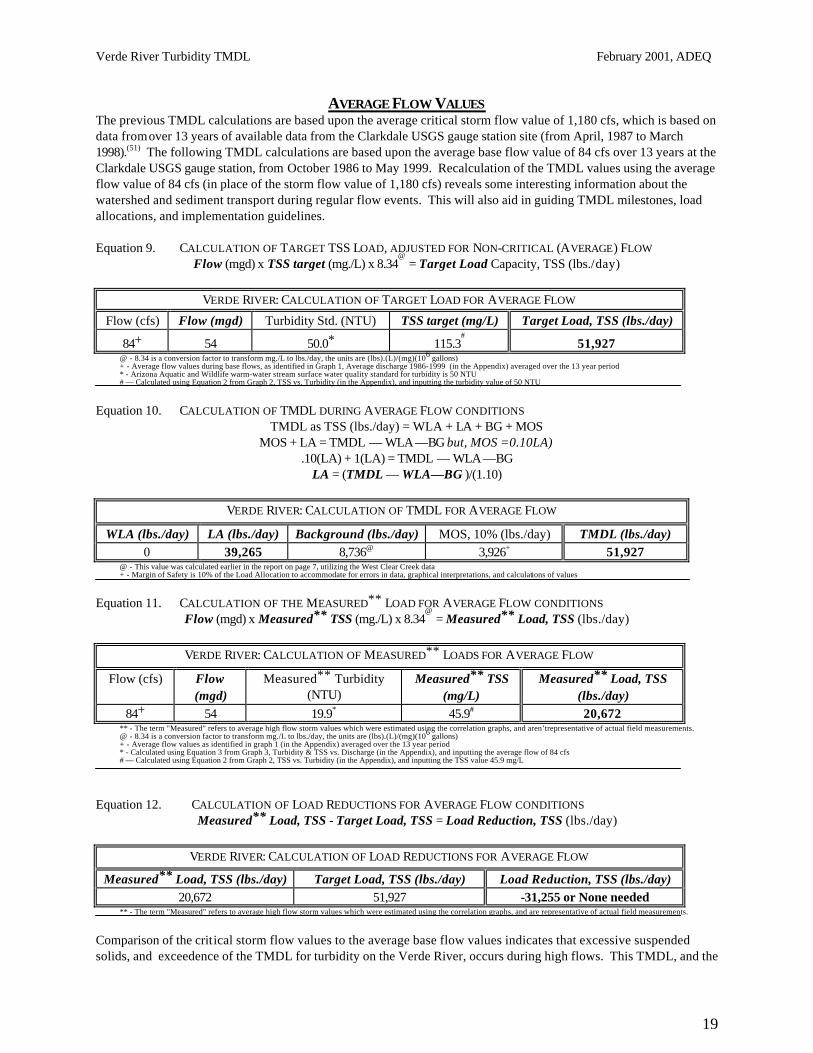
AVERAGE FLOW VALUES The previous TMDL calculations are based upon the average critical storm flow value of 1,180 cfs, which is based on data from over 13 years of available data from the Clarkdale USGS gauge station site (from April, 1987 to March 1998).(51) The following TMDL calculations are based upon the average base flow value of 84 cfs over 13 years at the Clarkdale USGS gauge station, from October 1986 to May 1999. Recalculation of the TMDL values using the average flow value of 84 cfs (in place of the storm flow value of 1,180 cfs) reveals some interesting information about the watershed and sediment transport during regular flow events. This will also aid in guiding TMDL milestones, load allocations, and implementation guidelines. Equation 9. CALCULATION OF TARGET TSS LOAD, ADJUSTED FOR NON-CRITICAL (AVERAGE) FLOW
Flow (mgd) x TSS target (mg./L) x 8.34@
= Target Load Capacity, TSS (lbs./day)
VERDE RIVER: CALCULATION OF TARGET LOAD FOR AVERAGE FLOW
Flow (cfs) Flow (mgd) Turbidity Std. (NTU) TSS target (mg/L) Target Load, TSS (lbs./day)
84+ 54 50.0* 115.3# 51,927
@ - 8.34 is a conversion factor to transform mg./L to lbs./day, the units are (lbs).(L)/(mg)(106 gallons) + - Average flow values during base flows, as identified in Graph 1, Average discharge 1986-1999 (in the Appendix) averaged over the 13 year period * - Arizona Aquatic and Wildlife warm-water stream surface water quality standard for turbidity is 50 NTU # — Calculated using Equation 2 from Graph 2, TSS vs. Turbidity (in the Appendix), and inputting the turbidity value of 50 NTU
Equation 10. CALCULATION OF TMDL DURING AVERAGE FLOW CONDITIONS
TMDL as TSS (lbs./day) = WLA + LA + BG + MOS MOS + LA = TMDL — WLA—BG but, MOS =0.10LA)
.10(LA) + 1(LA) = TMDL — WLA—BG LA = (TMDL — WLA—BG )/(1.10)
VERDE RIVER: CALCULATION OF TMDL FOR AVERAGE FLOW
WLA (lbs./day) LA (lbs./day) Background (lbs./day) MOS, 10% (lbs./day) TMDL (lbs./day) 0 39,265 8,736@ 3,926+ 51,927
@ - This value was calculated earlier in the report on page 7, utilizing the West Clear Creek data + - Margin of Safety is 10% of the Load Allocation to accommodate for errors in data, graphical interpretations, and calculations of values
Equation 11. CALCULATION OF THE MEASURED** LOAD FOR AVERAGE FLOW CONDITIONS
Flow (mgd) x Measured** TSS (mg./L) x 8.34@
= Measured** Load, TSS (lbs./day)
VERDE RIVER: CALCULATION OF MEASURED** LOADS FOR AVERAGE FLOW
Flow (cfs) Flow (mgd)
Measured** Turbidity (NTU)
Measured** TSS (mg/L)
Measured** Load, TSS (lbs./day)
84+ 54 19.9* 45.9# 20,672 ** - The term "Measured" refers to average high flow storm values which were estimated using the correlation graphs, and aren’trepresentative of actual field measurements. @ - 8.34 is a conversion factor to transform mg./L to lbs./day, the units are (lbs).(L)/(mg)(106 gallons) + - Average flow values as identified in graph 1 (in the Appendix) averaged over the 13 year period * - Calculated using Equation 3 from Graph 3, Turbidity & TSS vs. Discharge (in the Appendix), and inputting the average flow of 84 cfs # — Calculated using Equation 2 from Graph 2, TSS vs. Turbidity (in the Appendix), and inputting the TSS value 45.9 mg/L
Equation 12. CALCULATION OF LOAD REDUCTIONS FOR AVERAGE FLOW CONDITIONS
Measured** Load, TSS - Target Load, TSS = Load Reduction, TSS (lbs./day)
VERDE RIVER: CALCULATION OF LOAD REDUCTIONS FOR AVERAGE FLOW
Measured** Load, TSS (lbs./day) Target Load, TSS (lbs./day) Load Reduction, TSS (lbs./day) 20,672 51,927 -31,255 or None needed
** - The term "Measured" refers to average high flow storm values which were estimated using the correlation graphs, and are representative of actual field measurements.
Comparison of the critical storm flow values to the average base flow values indicates that excessive suspended solids, and exceedence of the TMDL for turbidity on the Verde River, occurs during high flows. This TMDL, and the
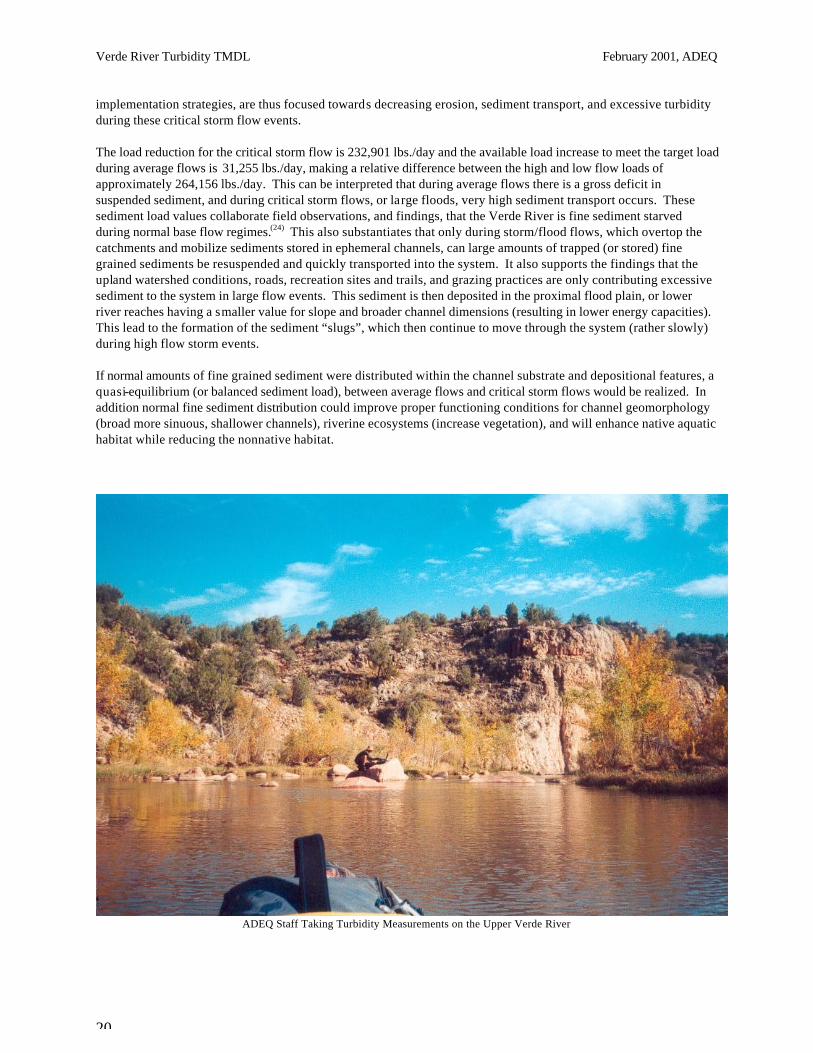
Verde River Turbidity TMDL February 2001, ADEQ
20
implementation strategies, are thus focused towards decreasing erosion, sediment transport, and excessive turbidity during these critical storm flow events. The load reduction for the critical storm flow is 232,901 lbs./day and the available load increase to meet the target load during average flows is 31,255 lbs./day, making a relative difference between the high and low flow loads of approximately 264,156 lbs./day. This can be interpreted that during average flows there is a gross deficit in suspended sediment, and during critical storm flows, or large floods, very high sediment transport occurs. These sediment load values collaborate field observations, and findings, that the Verde River is fine sediment starved during normal base flow regimes.(24) This also substantiates that only during storm/flood flows, which overtop the catchments and mobilize sediments stored in ephemeral channels, can large amounts of trapped (or stored) fine grained sediments be resuspended and quickly transported into the system. It also supports the findings that the upland watershed conditions, roads, recreation sites and trails, and grazing practices are only contributing excessive sediment to the system in large flow events. This sediment is then deposited in the proximal flood plain, or lower river reaches having a smaller value for slope and broader channel dimensions (resulting in lower energy capacities). This lead to the formation of the sediment “slugs”, which then continue to move through the system (rather slowly) during high flow storm events. If normal amounts of fine grained sediment were distributed within the channel substrate and depositional features, a quasi-equilibrium (or balanced sediment load), between average flows and critical storm flows would be realized. In addition normal fine sediment distribution could improve proper functioning conditions for channel geomorphology (broad more sinuous, shallower channels), riverine ecosystems (increase vegetation), and will enhance native aquatic habitat while reducing the nonnative habitat.
ADEQ Staff Taking Turbidity Measurements on the Upper Verde River
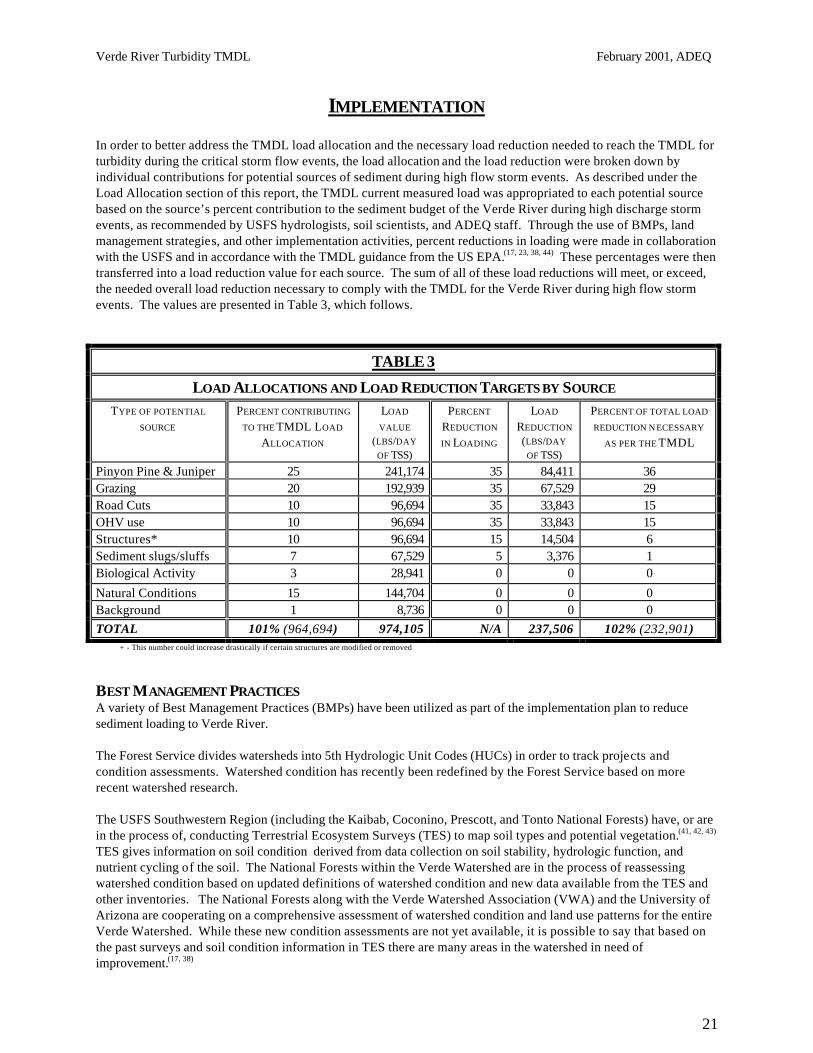
Verde River Turbidity TMDL February 2001, ADEQ
21
IMPLEMENTATION In order to better address the TMDL load allocation and the necessary load reduction needed to reach the TMDL for turbidity during the critical storm flow events, the load allocation and the load reduction were broken down by individual contributions for potential sources of sediment during high flow storm events. As described under the Load Allocation section of this report, the TMDL current measured load was appropriated to each potential source based on the source’s percent contribution to the sediment budget of the Verde River during high discharge storm events, as recommended by USFS hydrologists, soil scientists, and ADEQ staff. Through the use of BMPs, land management strategies, and other implementation activities, percent reductions in loading were made in collaboration with the USFS and in accordance with the TMDL guidance from the US EPA.(17, 23, 38, 44) These percentages were then transferred into a load reduction value for each source. The sum of all of these load reductions will meet, or exceed, the needed overall load reduction necessary to comply with the TMDL for the Verde River during high flow storm events. The values are presented in Table 3, which follows.
TABLE 3
LOAD ALLOCATIONS AND LOAD REDUCTION TARGETS BY SOURCE TYPE OF POTENTIAL
SOURCE PERCENT CONTRIBUTING
TO THE TMDL LOAD
ALLOCATION
LOAD
VALUE (LBS/DAY
OF TSS)
PERCENT
REDUCTION
IN LOADING
LOAD
REDUCTION (LBS/DAY
OF TSS)
PERCENT OF TOTAL LOAD
REDUCTION N ECESSARY
AS PER THE TMDL
Pinyon Pine & Juniper 25 241,174 35 84,411 36 Grazing 20 192,939 35 67,529 29 Road Cuts 10 96,694 35 33,843 15 OHV use 10 96,694 35 33,843 15 Structures* 10 96,694 15 14,504 6 Sediment slugs/sluffs 7 67,529 5 3,376 1 Biological Activity 3 28,941 0 0 0
Natural Conditions 15 144,704 0 0 0 Background 1 8,736 0 0 0 TOTAL 101% (964,694) 974,105 N/A 237,506 102% (232,901)
+ - This number could increase drastically if certain structures are modified or removed
BEST MANAGEMENT PRACTICES A variety of Best Management Practices (BMPs) have been utilized as part of the implementation plan to reduce sediment loading to Verde River. The Forest Service divides watersheds into 5th Hydrologic Unit Codes (HUCs) in order to track projects and condition assessments. Watershed condition has recently been redefined by the Forest Service based on more recent watershed research. The USFS Southwestern Region (including the Kaibab, Coconino, Prescott, and Tonto National Forests) have, or are in the process of, conducting Terrestrial Ecosystem Surveys (TES) to map soil types and potential vegetation.(41, 42, 43) TES gives information on soil condition derived from data collection on soil stability, hydrologic function, and nutrient cycling of the soil. The National Forests within the Verde Watershed are in the process of reassessing watershed condition based on updated definitions of watershed condition and new data available from the TES and other inventories. The National Forests along with the Verde Watershed Association (VWA) and the University of Arizona are cooperating on a comprehensive assessment of watershed condition and land use patterns for the entire Verde Watershed. While these new condition assessments are not yet available, it is possible to say that based on the past surveys and soil condition information in TES there are many areas in the watershed in need of improvement.(17, 38)

Verde River Turbidity TMDL February 2001, ADEQ
22
The USFS has implemented a variety of Best Management Practices aimed at reducing sedimentation and improving resource conditions.(17, 23, 38) Some of these projects include:
1. Removal of livestock grazing from the Verde River and many of it’s perennial tributaries. 2. Livestock grazing has not been permitted on almost all of the Verde River for the past four years, longer on
some allotments. There are small areas where grazing continues and efforts are underway to limit access to the river by the installation of additional fences and cattleguards. Several livestock exclosures, or riparian pasture fences, have been built on many of the major tributaries to the Verde River. The objectives of these fences/pastures is to eliminate livestock grazing from the area, or to control the season of use in order to utilize more effective grazing strategies for managing the land and vegetation resources present. Streams where this management strategy has already been implemented are: Oak Creek, West Clear Creek, Wet Beaver Creek, Copper Canyon Creek, and Spring Creek.
3. Efforts to improve livestock management are on-going within the Verde River Watershed. Analysis of
grazing allotments has been completed, or is on-going, for those adjacent to the Verde River. Several improved management practices have been implemented in addition to livestock exclusion from the riparian areas, including: improved livestock distribution, utilization levels, reduce areas of livestock concentration and trailing, improve/increase water sources away from the river, season of use, rest, and rotational grazing. These practices are being implemented to help meet overall objectives of improving soil condition and the perennial herbaceous species composition.
4. Off Highway Vehicle Use - The Forest Service has designated Hayfield Draw as an OHV use area, and has
also built extensive OHV trail systems across the forests. Best Management Practices were installed and monitored at Hayfield Draw to determine which practices were the most effective. The FS continues to manage the site using these practices and monitor their effectiveness. OHV trails were built and are maintained to standard.
5. The Forest Service continues to enforce off road travel regulations. Despite these efforts several miles of
two track roads are created each year by recreationists. Efforts are on-going to reduce exceedences, educate the public, and close these roads. Maintenance of system roads to standards is also on-going. Efforts to relocate, or close, roads in meadows and riparian areas are ongoing.
6. Forest road 638 has been closed, but not obliterated. Sediment delivery has been reduced, but not
eliminated by this closure. In-stream vehicle traffic at this site has been eliminated. The USFS has recommended that this road be closed.
7. “Red Rock Passport” is a comprehensive recreation plan (for the area around Sedona) to reduce impacts
from dispersed recreation. As part of this program additional staff have been hired to provide visitor information and education. Dispersed recreation opportunities have been limited on heavily used areas to help reduce soil erosion and compaction from these activities.
8. Grassland restoration projects have been implemented on several areas throughout the watershed from the
headwater to near the Verde River to reduce pinyon/juniper densities. The objectives of these projects are to increase vegetative ground cover, increase infiltration, reduce soil erosion, and increase perennial grass species.
9. River access sites in the Verde Valley have been improved in cooperation with the State Lakes Improvement
Funds. Parking lots, picnic facilities, and restrooms have been installed at seven recreation sites adjacent to the river.
10. The USFS, Verde Watershed Association, and Verde Natural Resources Conservation District continue to
sponsor educational opportunities on the unique values of the Verde River, and encourage public involvement in decisions regarding long-term management of this resource.
Verde River Turbidity TMDL February 2001, ADEQ
23
11. The USFS, Verde River Greenway, and The Nature Conservancy have been actively acquiring land adjacent
to the Verde River through land exc hanges and purchasing in an effort to reduce development in the active floodplain, maintain fish and wildlife habitat, and to allow public access.
12. Several agencies including: ADEQ, the University of Arizona, Northern Arizona University, ADWR, USGS,
USFS, and the Salt River Project are actively studying various aspects of the Verde River and ground water supplies in the Verde watershed. The objectives are to improve our understanding of the resource and develop improved management practices.
13. Riparian restoration on several springs and streams in the headwaters areas are ongoing in cooperation
with the Water Protection Fund, Water Quality Improvement Grants, Northern Arizona University, and the Forest Service.
14. Recreation trail maintenance is ongoing within the watershed. 15. Prescribed fire treatments are being implemented to help reduce adverse watershed effects from uncontrolled
wildfire. 16. Law enforcement patrols along the Verde River are conducted during the summer months to ensure
compliance with road closures and livestock exclusions. 17. Rocky Mountain Research Station is conducting research on aquatic habitat, fish populations, and water
quality for the Verde River. Proper Functioning Condition (PFC) surveys were completed in 1997, which indicate that most of the Upper Verde River is in “proper functioning condition.” Since the implementation of the before mentioned BMPs, there has been an increase in vegetation and stream-bank stability. This has resulted in less sediment transport and delivery in the river during higher discharges, and has thus effectively reduced the turbidity in that portion of the Verde River.(17, 38) Soils are relatively stable, however there continues to be a lack of litter cover and nutrient cycling, which limits soil development. Historic photos and data indicate that pinyon pine and juniper shades out the herbaceous understory vegetation, resulting in increased soil erosion, reduced nutrient cycling, and a loss of species diversity. The long-term impacts could be increased sedimentation in the Verde River. Thus, removal of pinyon and juniper species combined with promoting understory brush and grass development will be key to limiting the contribution of sediment, and thus turbidity, to the Verde River from these sources.(17, 38)
BMPs along the section of the Verde River from Clarkdale through Camp Verde are varied and complex for the scope of this report. This is due to the numerous land owners (private, tribal, municipal, and federal ownership is intermingled) all having different uses and objectives for the land and water resources involved. Some of the municipalities are proposing NPDES permits for drinking water and waste-water treatment discharge points to tributaries of the Verde River. The tribal lands have sand and gravel operations within the floodplain that contribute sediment during flood events, and leads to turbidity exceedences of the 50 NTU standard. Also, numerous unauthorized roads access the floodplain, some having river crossings. These roads that are still present in the watershed, and currently in use, need to be addressed.(17, 38)
While the major land management agency is the USFS and they are, and will continue, to improve the land resources within their jurisdiction, the large sector of private lands is being developed for residential and commercial uses. This will also create an increase in recreational activities within the watershed. These activities may lead to new sources of sediment and erosion, which could contribute excessive sediments to the system in the future. This future development may continue to increase sediments due to increased development, decreased water quantity, increased recreations, increased disturbances in the Verde Valley. Therefore additional projects and BMPs for use on private
Verde River Turbidity TMDL February 2001, ADEQ
24
lands will be important in the future. Private property owners can apply for grants and seek assistance in securing finances and technical expertise to assist in meeting and maintaining the goals set forth in this TMDL report. OTHER POSSIBLE PROJECTS Maintenance and modifications to silted in water catchment structures (such as cattle tanks and Sullivan Lake Dam) will allow for historic sediment contribution during smaller base flows. This will also stop the contribution of unordinarily large amounts of fine sediments being introduced into the river system during high discharges. Other projects to improve VGC in uplands and along ephemeral washes in the Verde River watershed may also help to address the sediment contributions during high discharge, storm drive events. In addition to the before-mentioned USFS plans for BMPs and implementation projects, priority will be given to parties who effectively apply for 319 grant projects that would help to address the TMDL and implementation goals set forth in this TMDL report. MONITORING PLAN ADEQ staff will continue to monitor turbidity, TSS, flow, and stream morphology over the next several years during varied flow stages. The Verde River watershed is scheduled for more intensive amb ient monitoring in 2004 as a part of the Fixed Station Network (FSN) rotating watershed approach. Macroinvertebrate sampling will be undertaken in the Spring/Summer of 2004 in order to obtain the necessary information to calculate an Index of Biological Integrity (IBI) score. This information coupled with a forthcoming Arizona Game and Fish Department (AGFD) study of the aquatic health of native species and the Proper Functioning Condition (PFC) monitoring, will allow for a more direct measure of the health of the Verde River aquatic ecosystem. This data will augment the turbidity and TSS data, as it is a more direct measure of stream health for the Aquatic and Wildlife warm (A&Ww) water designated use currently being impaired. This data will also allow for the reevaluation of the implementation strategies, milestones, and goals set forth in this TMDL document. Various other data has been obtained that will allow ADEQ to monitor water quality and physical integrity of Verde River, which includes:
1. Historic photo monitoring sites that are present on some sites on the Verde River, which can be utilized for future comparisons.
2. Additional aerial photo analysis can be utilized to monitor the vegetative cover that could assist in
retaining fine grained sediments during higher precipitation and flow events from becoming mobile and transported into the channel substrate.
3. Stream channel cross sections were collected at certain sites and will be used for future comparisons to see
how the channel morphology has changed. 4. Permanent follow-up monitoring sites will be selected depending upon the location of future
implementation projects and sampled to establish simple trend analysis. 5. A monitoring plan is being developed by the Forest Service, in cooperation with the U.S. Fish and Wildlife
Service, to monitor aquatic Threatened and Endangered species critical habitat on the Verde River. 6. Condition and trend monitoring of upland vegetation and soil is being conducted by the Forest Service in
cooperation with various stake holders to determine the effectiveness of management treatments and BMP implementation
7. Several monitoring projects are in progress by various agencies, partners and interested publics. Some of
these include efforts by University of Arizona, Northern Arizona University, Friends of the Forest, local schools, and others.
The USFS conducted river profile studies on the Verde River between 1995 and 1999, which included measuring the channel cross-sections, doing longitudinal profiles, and estimating the bank stability at several locations along the

Verde River Turbidity TMDL February 2001, ADEQ
25
Verde River. This information will be used for long term monitoring of changes in the geomorphology of the Verde River channel. Additional work has been completed to determine regional relationship curve for bankfull discharge for channel morphology in Arizona by Tom Moody.(27, 28, 48) Potential volunteer monitoring of native threatened and endangered aquatic species and the displacement, or die-off, of introduced aquatic species would contribute valuable data, which could help to guide implementation, future BMPs, and the reevaluation of this TMDL and the milestones set forth. Volunteer monitoring of discharge, turbidity, and TSS, along with general erosional and sedimentation features, could be of assistance in the future for reevaluation and assessment of the goals and values set forth, and to track progress of the implementation plan. A key would be to obtain potential volunteers and provide them with the correct equipment and training necessary to create valid data sets and information for future assessment use. The USFS has several monitoring projects in place, in addition to the channel cross-sections already mentioned. They have several range transects to monitor long-term condition and trends related to livestock grazing. The USFS is installing additional plant frequency transects to monitor the trend of vegetation and vegetative ground cover to determine if they are meeting the objectives for range management, pinyon/juniper reduction, and prescribed fires. Several permanent photo points have been installed. Ecological inventory projects are on-going to assess the condition of vegetation and soils within the watershed, and to make improved management recommendations. A monitoring plan is being developed to continue to assess aquatic habitats in relation to Threatened and Endangered fish species which will include: photos, fish surveys, pebble counts, and bank stability ratings. Proper Functioning Condition has been, and will continue to be, assessed on the river and it’s tributaries.(17, 38) TIME LINE The Verde River TMDL will use a phased approach to TMDL implementation. Watershed projects will be started incrementally as they are funded. The time frame for implementation is estimated to be 10 years. Therefore the timeframe estimated for the Verde River to meet the turbidity standard during critical storm flows is approximately 15-30 years, depending upon the amount, and duration, of flow events in the Verde River. The US EPA recognizes that sediment TMDLs with primarily non-point sources of pollution can be difficult to manage, and that these problems are often generated over multiple generations and may require as long to correct.(44)
IMPLEMENTATION YEAR NUMBER
IMPLEMENTATION ACTIONS 1 2 3 4 5 6 7 8 9 10
Public outreach & involvement X X X X X X X X X X Establish Milestones X X X Secure project funding, as needed X X X X X X X X X X Best Management Practices X X X X X X X X X X Determine BMPs effectiveness X X X Reevaluate Milestones and strategies X X

Verde River Turbidity TMDL February 2001, ADEQ
26
MILESTONES Milestones will be used to determine if control measures and BMPs are having a positive impact on reducing turbidity and the erosional forces present in the Verde River. Various measures will be utilized as milestones to measure the success of the projects and the BMPs. This could include an overall percent reduction in aquatic T&E species, an increased amount of natural vegetation in the stream course, a more stable channel geometry, lowered stream velocities, lower TSS and turbidity values during higher discharges, and more balanced TSS and turbidity values during different flow regimes. The milestones will be reevaluated periodically to determine their validity and effectiveness, as more data becomes available. Some goals of the TMDL implementation strategies will be to:
1. Increase education and public awareness to local landowners through the public participation process and watershed group activities
2. Create milestones for each BMP and Project and reevaluate the effectiveness as necessary 4. Increase vegetation and Vegetative Ground Cover (VGC), monitoring is being conducted 5. Promote the development and use of various BMPs in the watershed 6. Increase density of grasses and vegetative ground cover in order to improve soil stability, soil hydrologic
function and perennial herbaceous species in upland areas 7. Promote channel stability by utilizing:
a) Revegetation of the stream channel in cooperation with private landowners b) Promote BMPs implementation on both private and public lands c) Use stream restoration techniques to speed up recovery of stream corridor sections as
needed/applicable 8. Limit sediment contributions during storm flows, and increase the sediment loads during lower average base
flows. 9. Maintain or modify existing water retention structures and roads to reduce sediment delivery during storm
events (i.e. keep them from breaching and dumping sediment) 10. Implement ecosystem restoration projects such as prescribed fires, juniper reduction, and noxious weed
control in order to enhance long-term soil productivity 11. Promote water conservation within the watershed to reduce ground water pumping and maintain water
quantity
ASSURANCES Arizona Revised Statutes (ARS) do not contain specific language that allows for enforceable actions to be taken against non-point sources of pollution.(1) This Implementation plan depends solely upon the volunteer approach of Federal land management agencies and private landowners (with ADEQ's assistance, securing grant money for implementation projects and BMPs). Cooperation of State and Federal Agencies, private landowners, and municipalities will be paramount in the implementation of this TMDL.
PUBLIC PARTICIPATION PUBLIC PARTICIPATION IN THE TMDL PROCESS Public participation in the TMDL process begins long before public noticing and can continue even after the document has been approved. The ADEQ TMDL Unit has made public participation one of the highest priorities in developing its TMDLs. A TMDL document is a working water quality management plan. The ADEQ is open to comments and solicits suggestions on TMDL work throughout the entire process of development. This is primarily accomplished through local watershed groups. This generally is an informal exchange of information at local watershed meetings, but has also included formal presentations at public forums. Formal public noticing is carried out by the guidelines established through Arizona House Bill 2610.(1) Through this process, the ADEQ provides a 30-day public notice in a local newspaper within the watershed which allows for public comment on the draft TMDL. The ADEQ is then required to publish in the Arizona Administrative Register its determinations of total pollutant loadings and a summary of the response to comments on the estimated loadings for at least 45 days. After

Verde River Turbidity TMDL February 2001, ADEQ
27
the final loadings have been adopted, the Department is required to publish draft load allocations and a summary of the response to comments on the allocations in the Arizona Administrative Register for at least 45 days. Publication of both the loadings and allocations in the Arizona Administrative Register is an appealable agency action pursuant to Title 41, Chapter 6, Article 10 and may be appealed by any party that submitted written comments on the drafts within the established 45 days of publication. Finally, if there are no administrative appeals, the TMDL is forwarded to the Environmental Protection Agency for a 30-day approval period. The total time required for the public participation process after the completion of the initial draft TMDL report is a minimum of 150 days, and could last well beyond that. The public participation process is extensive and is not written for efficiency, but for redundancy. In this way, the public has ample time for thoughtful review and comment. Time is given for decisions to be evaluated and re-evaluated in order to produce a scientifically sound TMDL. WATERSHED GROUP The Verde River waterhsed group, known as the Verde River Watershed Association (VWA), meets monthly in Cottonwood, Arizona. The VWA was formed in 1993 and maintains an internet site at http://vwa.southwest-water.org, which has online copies of the VWA’s newsletter the Verde Currents and information on meetings, meeting dates, and a bulletin board among other information. Informal public participation has taken place through VWA meetings throughout the TMDL. The VWA is an association of concerned citizens in the community, users of the Verde River watershed’s resources, and local, state, and federal agencies. Members have aided in determining areas of concern, as well as initiating identification of the sources of turbidity. As a locally led effort, the VWA has been invaluable in disseminating information on this TMDL via their newsletter the Verde Currents (formerly the Confluence), internet website (http://vwa.southwest-water.org), and public forums. Throughout the development of this TMDL, watershed stakeholders have provided advice and counsel on the sampling plan, potential sources of turbidity pollution, and potential areas of concern along the Verde River. WEB SITES ADEQ has a website at http://www.adeq.state.az.us that will provide information and links to other data relevant to this Verde River TMDL and contact information. This TMDL should be available for download from the website in the foreseeable future, when the draft is made available for public review and comment. The Verde River Watershed Association also maintains a website with information at at: http://vwa.southwest-water.org.
Verde River Turbidity TMDL February 2001, ADEQ
28
LIST OF ABBREVIATIONS A&Ww - Aquatic and Wildlife warmwater designated use waterbody AGI - Agricultural Irrigation designated use waterbody AGL - Agricultural Livestock designated use waterbody ADEQ - Arizona Department of Environmental Quality ADWR - Arizona Department of Water Resources AGFD - Arizona Game and Fish Department ALRIS - Arizona Land Resource Information System ARS - Arizona Revised Statues AZ - Arizona BG - Background BLM - Bureau of Land Management BMPs - Best Management Practices cfs - Cubic Feet per Second CWA - Clean Water Act DOI - Department of the Interior EPA - Environmental Protection Agency FC - Fish Consumption FS - Forest Service FSN - Fixed Station Network Ft. - Feet GIS - Geographic Informational Systems HUC - Hydrologic Unit Code IBI - Index of Biological Integrity LA - Load Allocation lbs./day - Pounds per Day LR - Load Reduction MDEQ - Montana Department of Environmental Quality mg./L - Milligrams per Liter mgd - Millions of Gallons per Day ML - Measured Load mm - Millimeters MOS - Margin of Safety NMED - New Mexico Environmental Department NPDES - National Pollutant Discharge Elimination System NTU - Nephelometric Turbidity Units OHV - Off Highway Vehicle PFC - Proper Functioning Condition Q - Discharge Std. - Standard T&E - Threatened and Endangered TES - Terrestrial Ecosystem Survey TL - Total Load TLC - Target Load Capacity TMDL - Total Maximum Daily Load TSS - Total Suspended Solids Turb - Turbidity US - United States USDA - United State Department of Agriculture USFS - United States Forest Service USF&W - United States Fish and Wildlife Service USGS - United States Geological Survey VGC - Vegetative Ground Cover VR - Verde River VWA - Verde Watershed Association WCC - West Clear Creek WLA - Waste Load Allocation

Verde River Turbidity TMDL February 2001, ADEQ
29
REFERENCES 1. ADEQ. Arizona Administrative Code, Title 18, Chapter 11. Department of Environmental Quality Water Quality
Standards. 1996. 2. ADEQ. Fixed Station Network Procedures Manual for Surface Water Quality Monitoring. 1995. 3. ADEQ. Arizona Water Quality Assessment 1998, volume II — Assessment Data and Standards. (305b of
Federal Clean Water Act) EQR-98-14 November 1998. 4. ADEQ. Arizona Water Quality Assessment 1998, volume I — Assessment Process and Analysis. (305b of
Federal Clean Water Act) EQR-98-14 November 1998. 5. ADEQ. Arizona's 1998 Water Quality Limited Waters List (Arizona's 303(d) List). EQR-98-8 July 1998. 6. Arizona Department of Water Resources, prepared by the USGS (by Owen-Joyce, Sandra J. and Bell, C. K.).
ADWR Bulletin 2, Hydrology of a Stream-Aquifer System in the Camp Verde Area, Yavapai County, Arizona. 1984.
7. Arizona Department of Water Resources, prepared by the USGS (by Owen-Joyce, Sandra J.). ADWR Bulletin 3,
Appraisal of Water Resources in the Upper Verde River Area, Yavapai and Coconino Counties, Arizona. March 1983.
8. Beyer, P. J. Integration and Fragmentation in a Fluvial Geomorphic System, Verde River, Arizona. Arizona State
University Ph.D. Thesis, Tempe, AZ. 1997. 9. Bureau of Land Management. Grazing Management for Riparian-Wetlands Areas. TR 1737-11 1989. 10. Bureau of Land Management. Process for Assessing the Proper Functioning Condition. TR 1737-14 1997. 11. Bureau of Land Management. Process for Assessing the Proper Functioning Condition for Lentic Riparian-
Wetlands Areas. TR 1737-6 1992. 12. Bureau of Land Management. Management Techniques in Riparian Areas. TR 1737-3 1989. 13. Bureau of Land Management. Managing Change —Livestock Grazing on Western Riparian Areas. July 1993. 14. Bureau of Land Management. Riparian Area Management. TR 1737-9 1993. 15. Dunne, Thomas and Leopold, Luna. Water in Environmental Planning 1978. 16. Endicott, Carol and McMahon, Thomas, MDEQ. Development of a TMDL to Reduce Non-Point Source
Sediment Pollution in Deep Creek, Montana. March 1996. 17. Girard, Michele, Ph.D. USFS Hydrologist, Prescott National Forest. Personal Communications. 1999-2001. 18. Gordon, Nancy, McMahon Thomas, and Finlayson, Brian. Stream Hydrology An Introduction for Ecologists.
1992. 19. Graf, William and Randall, Kris. A Guidance Document for Monitoring and Assessing the Physical Integrity of
Arizona's Streams. ADEQ Contract # 95-0137 April 1998. 20. Harrelson, Cheryl C., Rawlins, C. L., and Potyondy, John P. USFS Rocky Mountain Forest and Range Experiment
Station. Stream Channel Reference Sites: An Illustrated Guide to Field Techniques. General Technical Report RM-245 Fort Collins, CO. 1994.

Verde River Turbidity TMDL February 2001, ADEQ
30
21. Leopold, Luna. A View of the River. 1994. 22. Lindeburg, N., P.E. Civil Engineering Reference Manual. 5th Edition. 1989. 23. Loomis, Grant. USFS Hydrologist, Tonto National Forest. Personal Communications. 1999-2001. 24. Medina, Alvin L., Baker, Malchus B., Jr., and Turner, Jack D. Channel Types and Geomorphology of the Upper
Verde River. 1997. 25. McCammon, Bruce, Rector, John, and Gebhardt, Karl. USFS and BLM. A Framework for Analyzing the
Hydrologic Condition of Watersheds. BLM Technical note 405 BLM/RS/ST-98/004+7210 June 1998. 26. McNab, W. Henry: Avers, Peter E., comps. 1994. Ecological Subregions of the United States: Section
Descriptions. Administrative Publication WO-WSA-5. Washington, DC: U.S. Department of Agriculture, Forest Service. 267 p.
27. Moody, Thomas. Integrating Regional Relationships for Bankfull Stage in Natural Channels of Arizona and New
Mexico DRAFT. May 2000. 28. Moody, Thomas and Odem, Wilbert. Regional Relationships for Bankfull Stage in Natural Channels of Central
and Southern Arizona. February 1999. 29. Neary, Dan. Personal coummincations to USFS. December 2000. 30. NMED. Total Maximum Daily Load for Turbidity, Stream Bottom Deposits, and Total Phosphorus in the
Canadian Basin (Cimarron). 1999. 31. NMED. Total Maximum Daily Load for Turbidity and Stream Bottom Deposits in the Rio Grande Basin (Jemez).
1999. 32. Odem, Wilbert. Stream channel and Erosional Control Structures: Prediction and Evaluation of Performance. AZ
Water Protection Fund Commision Information Transfer Forum on Riparian and Stream Restoration in AZ. March 2000.
33. Pope, Greg. USGS. Personal communications. August 2000. 34. Rinne, John N. (USFS Rocky Mountain Research Station Research Fisheries Biologist). Fish and Grazing
Relationships: The Facts and Some Pleas. 35. Rinne, John N. (USFS Rocky Mountain Research Station Research Fisheries Biologist). Status of Spikedace
(Meda fulgida) in the Verde River, 1999: Implications for Management and Research. 1999. 36. Rosgen, D. Applied River Morphology. Wildland Hydrology. Pagosa Springs, CO. 1996. 37. Shaw, Harley. Wood Plenty, Grass Good, Water None. The Juniper Institute, POB 370 Chino Valley, AZ 86323.
1999. 38. Steinke, Rory. USFS Soil Scientist, Coconino National Forest. Personal Communications. 1999-2001. 39. Tetra Tech, Inc. and ADEQ. Peck’s Lake TMDL Final Draft. November 2000. 40. Tetra Tech, Inc. Verde River Assimilative Capacity Data Summary Report. May 2000. 41. US Department of Agriculture, Forest Service, Southwestern Region. Terrestrial Ecosystem Survey Handbook.
Albuquerque, NM 1986. 42. US Department of Agriculture, Forest Service, Southwestern Region. Terrestrial Ecosystems Survey of the
Coconino National Forest. Albuquerque, NM 1995. 43. US Department of Agriculture, Forest Service, Southwestern Region. Terrestrial Ecosystems Survey of the
Prescott National Forest. Albuquerque, NM 2000.

Verde River Turbidity TMDL February 2001, ADEQ
31
44. US EPA. Protocol for Developing Sediment TMDL's, 1st Edition. EPA 841-B-99-004 October 1999. 45. US EPA. Garcia River Sediment Total Maximum Daily Load. March 1998. 46. US EPA. Summary of Comments and Responses on the Proposed Garcia River Sediment Total Maximum Daily
Load dated January 29, 1998. March 1998. 47. USFS. DRAFT of Ephemeral Channel Conditions in the Verde River Watershed. 2001 48. USFS, by the Northern Arizona University College of Engineering (Moody, Thomas, E.I.T., and Odem, Wilbert,
Ph.D., P.E.). Regional Relationships for Bankfull Discharge and Channel Geometry for Central and Southern Arizona. Final Report to ADEQ. May 31, 1998.
49. USFS Rocky Mountain Research Station (Neary, Rinne, Medina, and Baker). Chronology of Monitoring
Activities on the Upper Verde River, Prescott National Forest DRAFT. 2000. 50. USGS (Twenter, F. R. and Metzger, D. G.). USGS Bulletin 1177. Geology and Ground Water in Verde Valley—the
Mogollon Rim Region Arizona. 1963 51. USGS. USGS Current and Historic Flow data from internet and water quality reports. 52. Verde River Corridor Project Steering Committee. Verde River Corridor Project Final Report and Plan of Action.
June 1991. 53. WEST Consultants, Inc. for USFS Rocky Mountain Experiment Station. WinXSPRO A Channel Cross-Section
Analyzer User's Manual. 1997.

Verde River Turbidity TMDL February 2001, ADEQ
32
APPENDIX GRAPH 1:
AVERAGE MONTHLY STREAM DISCHARGE AT USGS GAUGE STATIONS
GRAPH 2:
TSS VS. TURBIDITY FOR THE VERDE RIVER
GRAPH 1Average Discharges (CFS) for 1986 - 1999
10
100
1000
10000
100000
10/8
6
10/8
7
10/8
8
10/8
9
9/94
12/9
6
10/9
7
1986 to 1999 YEAR
Avg
. DIS
CH
AR
GE
CF
S
CRITICAL STORM FLOW
AVERAGE FLOW FLOW
GRAPH 2TSS vs. Turbidity for Verde River
TSS= 2.3069(Turb)R2 = 0.7838
0.1
1
10
100
1000
10000
0.1 1 10 100 1000
Turbidity, NTU
TSS
, mg/
L

Verde River Turbidity TMDL February 2001, ADEQ
33
GRAPH 3 TSS AND TURBIDITY VS. DISCHARGE FOR THE VERDE RIVER
GRAPH 3TSS and Turbidity vs. Discharge
Turb. = 0.0263(Flow) + 15.954R
2 = 0.2581
TSS= 0.0965(Flow)+ 37.774R
2 = 0.5483
0.1
1
10
100
1000
10 100 1000 10000
Discharge (Q) in CFS
Turb
idity
(N
TU)
0.1
1
10
100
1000
TSS
(mg/L)
turbidity
tss
Linear(turbidity)
Linear (tss)