venture hackathon velocity modelling project
TRANSCRIPT

Hackathon
Velocity Modelling Project
Kick Off
Saturday morning, we announced the schedule, projects and forming teams. We had a packed agenda and attendees could choose and set their own schedule. There were tutorials running throughout the two days on Pytorch, Pangeo and Dask. Another option was to participate in working on open source projects like Segio, Devito and Pylops, the core developers for these projects were at the Hackathon and they were leading sprints. A third option was to participate in projects and again we had several options: a project on getting data from google earth into an xarray format, getting it ready for remote sensing workflows and a project on analysing velocity and depth conversion models.
The Event
Approximately 50 people attended from various Oil majors, service companies and academia. Our sponsors were Sword Venture, BP, Earth Science Analytics, Equinor and Agile Scientific. The venue was Work.Life at Clerkenwell in London. It usually serves as a co-working environment, a great venue with good facilities and a few breakout meeting rooms. The food was amazing it was provided by Elysia Catering and most of it was prepared fresh at the location.
Attila Balazs - My Role
I announced a couple of ideas around predicting Non-Productive Time (NPT) which got some attention and other ideas around data quality and scraping. In the end I decided to try and help the Velocity Model project. My motivation was twofold it was a problem I haven’t encountered before so an opportunity to learn something new and we had real data, which meant we did not have to spend time on collecting datasets, which can be time consuming as there are limited open datasets out there.
Who are Swung? The Software Underground is an open geoscience community with over 1500 members. This year there was an opportunity to organise a hackathon the weekend before the EAGE conference in London to get together and code.
Hackathon
Velocity Modelling Project
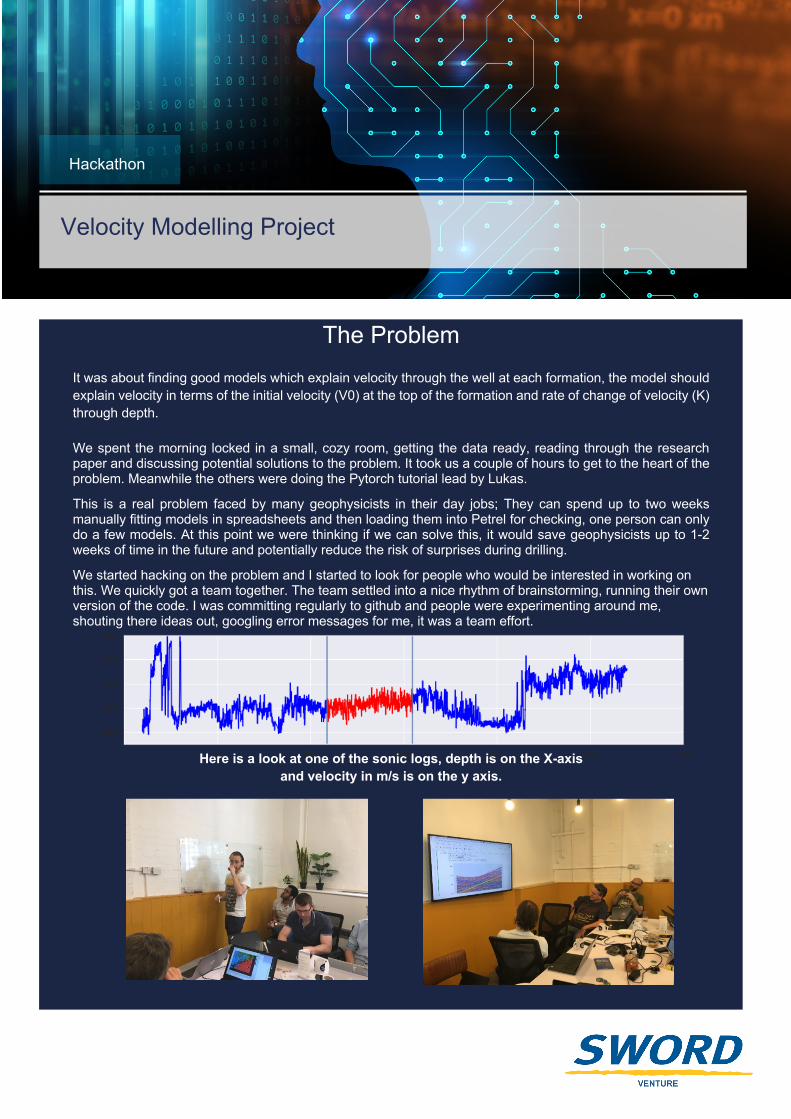
The Problem It was about finding good models which explain velocity through the well at each formation, the model should explain velocity in terms of the initial velocity (V0) at the top of the formation and rate of change of velocity (K) through depth. We spent the morning locked in a small, cozy room, getting the data ready, reading through the research paper and discussing potential solutions to the problem. It took us a couple of hours to get to the heart of the problem. Meanwhile the others were doing the Pytorch tutorial lead by Lukas.
This is a real problem faced by many geophysicists in their day jobs; They can spend up to two weeks manually fitting models in spreadsheets and then loading them into Petrel for checking, one person can only do a few models. At this point we were thinking if we can solve this, it would save geophysicists up to 1-2 weeks of time in the future and potentially reduce the risk of surprises during drilling.
We started hacking on the problem and I started to look for people who would be interested in working on this. We quickly got a team together. The team settled into a nice rhythm of brainstorming, running their own version of the code. I was committing regularly to github and people were experimenting around me, shouting there ideas out, googling error messages for me, it was a team effort.
Here is a look at one of the sonic logs, depth is on the X-axis and velocity in m/s is on the y axis.

Hackathon
Velocity Modelling Project
Sword Venture Station Approach Staines-Upon-Thames TW18 4LY Tel: +44 (0) 203 141 0500 www.venture.co.uk
About Sword Venture Sword Venture are trusted advisors to the E&P industry. We Design, Implement and Support practical technology, data and information solutions to enable you to gain insight and make effective business decisions. Our scale, flexibility and technology neutral standpoint ensure that we deliver you impartial expertise, focused on your unique business needs.
The Solution We came up with a nice solution, it seems very simple in hindsight, but we explored lots of options before ending up here. We simulated lots of linear models through a section of the sonic log (VS) velocity measurement, the section represented a formation as it was picked by a geologist. We generated linear models; we selected the best models by calculated the root mean squared error (RMSE). The research paper contained a nice contour plot of the parameters and RMSE we spent some time on this and by the end of the day we managed to reproduce the plot from the paper. We then spent some time on clustering, just for fun we wanted to see if we run a couple of clustering algorithms to pick the formation intervals would they pick something sensible. In the first stage of the project we just used an interval as it was picked by the geologist. Turns out our first model using K-Means did really well, we tried a few parameters and a few other algorithms, in the end we landed on GaussianMixtures, we used scikit-learn for the clustering work. During a review several ideas came up, we worked a little bit on our plots eventually settling on the plot below which shows the solution clearly. The plot describes the data through the chosen interval and our best models our shown. From red to yellow we show 500 models with decreasing RMSE scores, red is low RMSE, yellow high RMSE. We also show the best model in green, and then we randomly sample 10 models which are shown in blue. These models are exported to a csv file, and this is what ‘our customer’ needs to load into Petrel and to continue thier work there, matching them up with seismic data. After getting this plot everyone was excited, what else can we do? We eventually landed on making the plots more interactive, so we spent the rest of the day cleaning up the solution and adding interactive sliders to the plots.