venture capital trusts statistics · 2.4 the number of venture capital trusts managing and raising...
TRANSCRIPT
1
Coverage: United Kingdom Theme: The Economy Released: 19 October 2017 Next release: Autumn 2018 Frequency of release: Annual Media contact: HMRC Press Office (Business) 03000 585028 Out-of-hours: 07860 359544 Statistical contacts: Akash Patel [email protected] Dominica Parry [email protected] KAI Direct Business Taxes HM Revenue and Customs 100 Parliament Street London SW1A 2BQ Website: https://www.gov.uk/government/organisations/hm-revenue-customs/about/statistics
Venture Capital Trusts Statistics Table 8.6
An Official Statistics Release

2
Contents
Section 1: Introduction 3
About these statistics 3 Policy background 3
What does this publication tell me? 4
Section 2: Statistics and Commentary 5
2.1 Key points 5 2.2 Table 8.6: Funds raised and number of Venture Capital Trusts 6 2.3 Amount of funds raised and number of Venture Capital Trusts
raising funds 7 2.4 The number of Venture Capital Trusts managing and raising funds 9
Section 3: Background information 10
Data sources 10
Methodology 10 Who might be interested in these statistics? 11
User engagement 11
UKSA Assessment 11 Contact points 12
3
Section 1: Introduction
About these statistics
This is an Official Statistics publication produced by HM Revenue & Customs (HMRC)
which provides statistics on the amount of funds raised by Venture Capital Trusts (VCTs) and the number of VCTs. This release includes the first officially published VCT estimates for tax year 2016-17.
The Official Statistics enclosed are produced to professional standards set out in the Code of Practice for Official Statistics (2009). They undergo regular Quality Assurance
reviews and also seek to engage users in their refinement and development to ensure they meet customers' needs.
The statistics in this publication are based on publicly available internet sources and news announcements. As a result, these figures are outside the managerial control of HMRC and consequently are published as Official Statistics rather than National
Statistics. However, they are published annually by HMRC as the current best indicators of the number of VCT funds and the amounts they raise. Figures in this release refer to tax years; the tax year runs from 6 April in one year to 5 April the next year.
For more information on Official and National Statistics and governance of statistics
produced by public bodies, please see the UK Statistics Authority website: www.statisticsauthority.gov.uk
HMRC Official and National Statistics can be found on the internet at: https://www.gov.uk/government/organisations/hm-revenue-customs/about/statistics
Policy background
The Venture Capital Trust (VCT) scheme, introduced in 1995, is one of four tax-based Venture Capital Schemes, the others being the Enterprise Investment Scheme (EIS),
the Seed Enterprise Investment Scheme (SEIS) and Social Investment Tax Relief (SITR). VCTs raise funds for investments, normally annually, through new and/or top-up share issues to investors.
For information on the policy background and key policy changes in the VCT scheme follow the link:
https://www.gov.uk/government/statistics/venture-capital-trusts-statistics-introductory-note
4
What does this publication tell me?
This publication provides information regarding the number of Venture Capital
Trusts (VCTs) operating each tax year and the amount of funds they raise during this period.
Table 8.6 presents annual figures for 1995-96 to 2016-17 on:
- The amounts raised by Venture Capital Trusts (VCTs) - The number of VCTs raising funds - The number of existing VCTs managing funds
Section 2 provides a statistical commentary on the figures and trends. Section 3 provides background information including hyperlinks to explain in more detail the
policy background and the key policy changes since the inception of the scheme in 1995. This section also covers the data sources and methodology used to derive these statistics.
5
Section 2: Statistics and Commentary 2.1 Key points
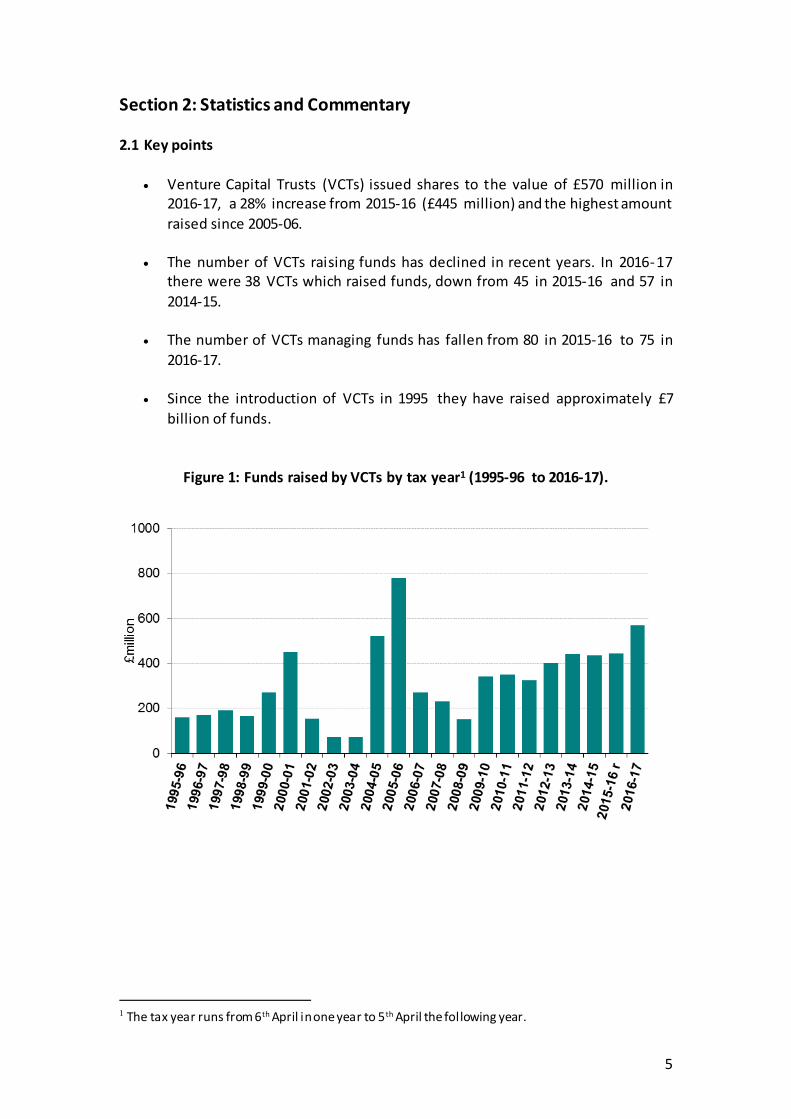
Venture Capital Trusts (VCTs) issued shares to the value of £570 million in
2016-17, a 28% increase from 2015-16 (£445 million) and the highest amount
raised since 2005-06.
The number of VCTs raising funds has declined in recent years. In 2016-17 there were 38 VCTs which raised funds, down from 45 in 2015-16 and 57 in
2014-15.
The number of VCTs managing funds has fallen from 80 in 2015-16 to 75 in
2016-17.
Since the introduction of VCTs in 1995 they have raised approximately £7
billion of funds.
Figure 1: Funds raised by VCTs by tax year1 (1995-96 to 2016-17).
1 The tax year runs from 6th April in one year to 5th April the following year.

6
2.2: Table 8.6 Funds raised and number of Venture Capital Trusts
Table 8.6 (below) summarises information on the number of Venture Capital Trusts
(VCTs) operating by tax year and the amount of funds they have raised.
____________________________________________
The data sources are outside the managerial control of HM Revenue & Customs (HMRC) and therefore we cannot ensure their completeness and quality; hence this table falls outside the scope of National Statistics. r. Revised. 1*Tax year runs from the 6th April in one year to the 5th Apri l the following year. 2 The amount of funds raised by VCTs in each tax year, rounded to the nearest £5 million. 3 The number of VCTs raising funds in each tax year, consisting of new VCTs raising funds for the first time, existing ones raising further funds and also VCTs raising funds which are in wind down. 4 The number of VCTs in existence in each tax year. 5 The rate of investors’ income tax relief in each tax year; capital gains tax deferral relief was available until 5th April 2004. *The totals are not given to avoid duplication of number of VCTs as VCTs can raise funds in multiple tax years.
Numbers: actual; Amounts: £ million
Year 1* Funds raised 2VCTs raising
funds in the year3
VCTs managing
funds 4Rate of Income Tax
Relief (%)5
Amount Number Number
1995-96 160 12 12 20
1996-97 170 13 18 20
1997-98 190 16 26 20
1998-99 165 11 34 20
1999-00 270 20 43 20
2000-01 450 38 61 20
2001-02 155 45 70 20
2002-03 70 32 71 20
2003-04 70 31 71 20
2004-05 520 58 98 40
2005-06 780 82 108 40
2006-07 270 32 121 30
2007-08 230 54 131 30
2008-09 150 46 129 30
2009-10 340 68 122 30
2010-11 350 78 128 30
2011-12 325 76 124 30
2012-13 400 65 118 30
2013-14 440 66 97 30
2014-15 435 57 94 30
2015-16 r 445 45 80 30
2016-17 570 38 75 30
Total 6,955 * *
7
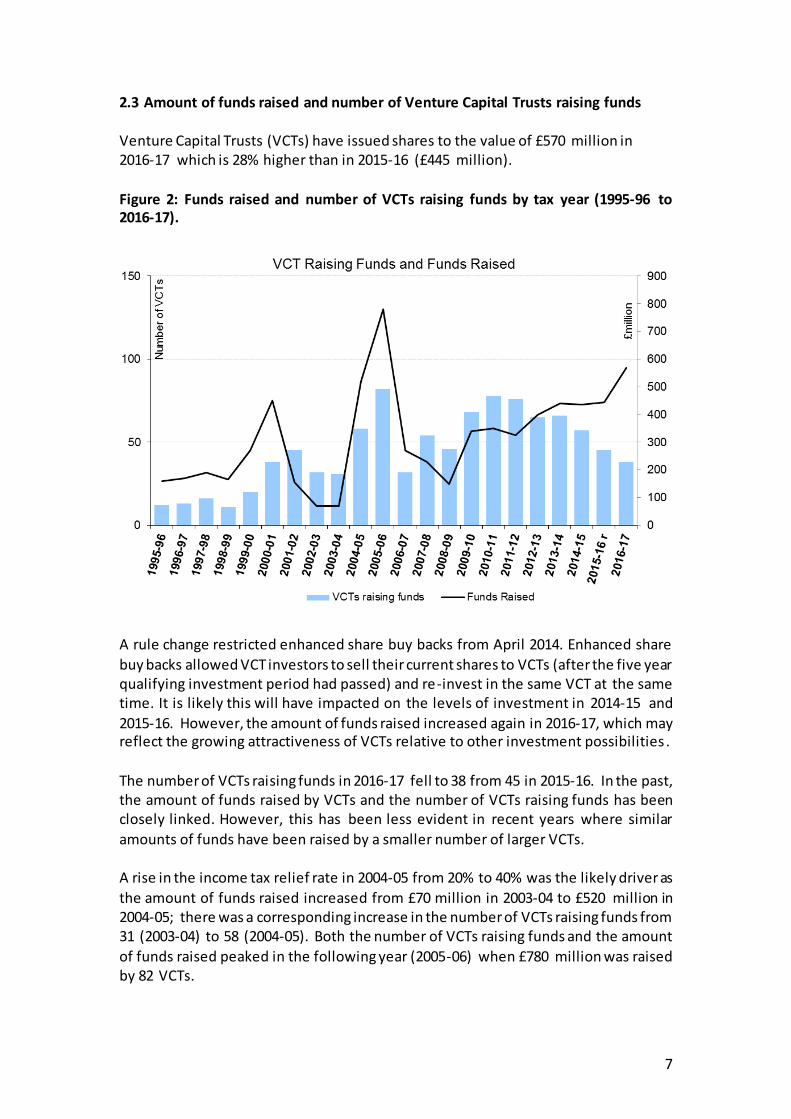
2.3 Amount of funds raised and number of Venture Capital Trusts raising funds
Venture Capital Trusts (VCTs) have issued shares to the value of £570 million in 2016-17 which is 28% higher than in 2015-16 (£445 million).
Figure 2: Funds raised and number of VCTs raising funds by tax year (1995-96 to 2016-17).
A rule change restricted enhanced share buy backs from April 2014. Enhanced share
buy backs allowed VCT investors to sell their current shares to VCTs (after the five year qualifying investment period had passed) and re-invest in the same VCT at the same time. It is likely this will have impacted on the levels of investment in 2014-15 and
2015-16. However, the amount of funds raised increased again in 2016-17, which may reflect the growing attractiveness of VCTs relative to other investment possibilities .
The number of VCTs raising funds in 2016-17 fell to 38 from 45 in 2015-16. In the past, the amount of funds raised by VCTs and the number of VCTs raising funds has been closely linked. However, this has been less evident in recent years where similar
amounts of funds have been raised by a smaller number of larger VCTs. A rise in the income tax relief rate in 2004-05 from 20% to 40% was the likely driver as
the amount of funds raised increased from £70 million in 2003-04 to £520 million in 2004-05; there was a corresponding increase in the number of VCTs raising funds from 31 (2003-04) to 58 (2004-05). Both the number of VCTs raising funds and the amount
of funds raised peaked in the following year (2005-06) when £780 million was raised by 82 VCTs.
8
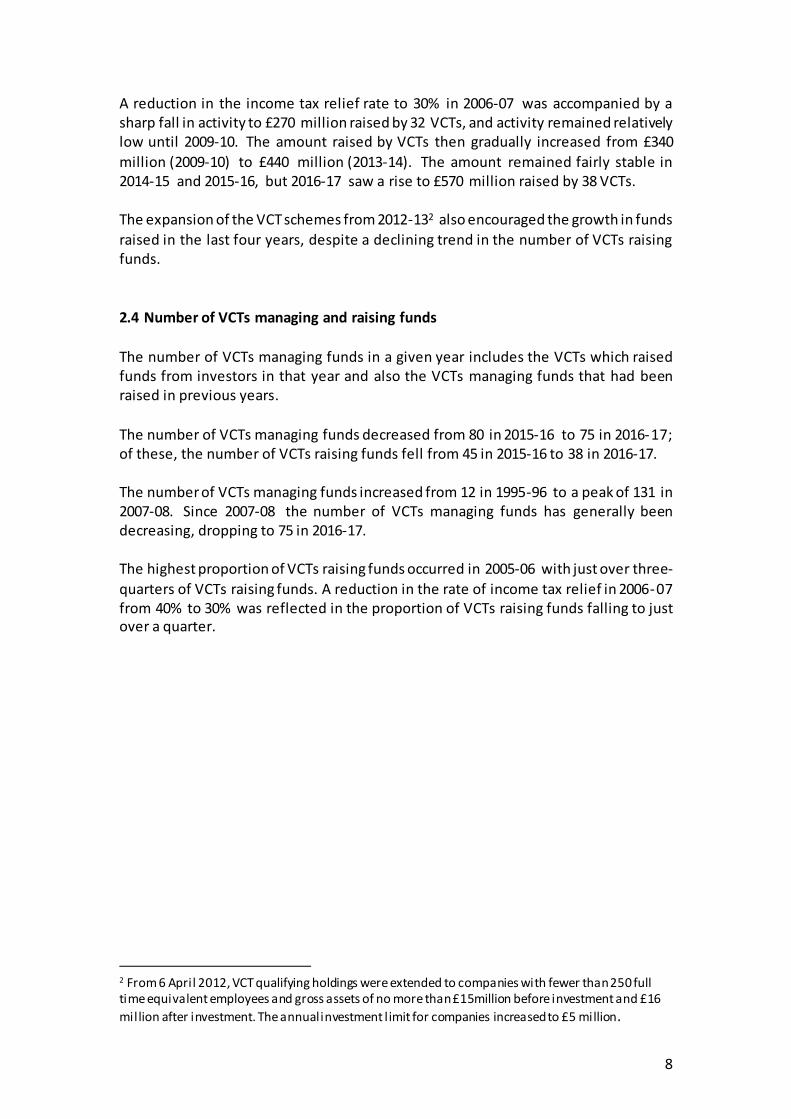
A reduction in the income tax relief rate to 30% in 2006-07 was accompanied by a sharp fall in activity to £270 million raised by 32 VCTs, and activity remained relatively low until 2009-10. The amount raised by VCTs then gradually increased from £340
million (2009-10) to £440 million (2013-14). The amount remained fairly stable in 2014-15 and 2015-16, but 2016-17 saw a rise to £570 million raised by 38 VCTs. The expansion of the VCT schemes from 2012-132 also encouraged the growth in funds
raised in the last four years, despite a declining trend in the number of VCTs raising funds.
2.4 Number of VCTs managing and raising funds
The number of VCTs managing funds in a given year includes the VCTs which raised funds from investors in that year and also the VCTs managing funds that had been raised in previous years.
The number of VCTs managing funds decreased from 80 in 2015-16 to 75 in 2016-17; of these, the number of VCTs raising funds fell from 45 in 2015-16 to 38 in 2016-17.
The number of VCTs managing funds increased from 12 in 1995-96 to a peak of 131 in 2007-08. Since 2007-08 the number of VCTs managing funds has generally been decreasing, dropping to 75 in 2016-17.
The highest proportion of VCTs raising funds occurred in 2005-06 with just over three-
quarters of VCTs raising funds. A reduction in the rate of income tax relief in 2006-07 from 40% to 30% was reflected in the proportion of VCTs raising funds falling to just over a quarter.
2 From 6 April 2012, VCT qualifying holdings were extended to companies with fewer than 250 full time equivalent employees and gross assets of no more than £15million before investment and £16
million after investment. The annual investment l imit for companies increased to £5 million.

9
Figure 3: Number of VCTs managing funds by tax year (1995-96 to 2016-17).
10
3: Background information
Data sources
Investments in VCTs are notified to HMRC, but not in a form suitable for data capture.
Therefore, information on the number of VCT trusts and funds raised are obtained from publicly available internet sources such as Pricewaterhousecoopers, Allenbridge, Tax Efficient Review, FE Investegate and London Stock Exchange VCTs information and
news announcements. As a result, these figures are outside the managerial control of HM Revenue & Customs (HMRC) and are not considered National Statistics. However, they are published annually by HMRC as our current best indicators of the number of VCT funds and the amounts they raise.
Methodology
The figure on the amount of funds raised by tax year is the aggregation of the amount raised by each individual VCT company. The data on individual VCT funds’ activity are manually recorded from the daily news announcements on UK quoted companies.
The figure on the number of VCT funds is produced base d on the news announcements regarding new VCT funds formed and VCT funds merged, liquidated or dissolved. The figures cover all VCTs and consequently—as no sampling is necessary—the results are not subject to sampling error. Figures in this release refer to tax years; the tax year runs from 6th April in one year to 5th April the following year.
A number of checks against other external commercial websites such as Allenbridge (taxshelterreport.co.uk) and Tax Efficient Review (taxefficientreview.com) and against figures annually published by Association of Investment Companies (AIC) are carried
out to validate the figures. As these figures are outside the managerial control of HM Revenue & Customs (HMRC), these checks are at a high-level. This includes comparison of the total funds raised by all and individual VCTs in a given tax year with those published on commercial websites.
It is assumed that small discrepancies with AIC industry figures arise due to differences
in the methodology and assumptions used to compile the figures; for example, AIC figures exclude enhanced share buy-backs. In the case of large discrepancies, this is reported to VCT policy colleagues and further investigation takes place until the discrepancy is understood. The latest figures published by AIC are available here:
https://www.theaic.co.uk/search?keys=vct+tax+year+2016%2F2017

11
Who might be interested in these statistics?
This publication is likely to be of interest to policy makers in government, academics,
research organisations, the media, the Venture Capital associations and Venture Capital Trusts (VCTs) themselves. It will be of particular interest to investors investing in VCTs.
People interested in this publication may also be interested in the National Statistics publications on the other Venture Capital Schemes:
https://www.gov.uk/government/collections/enterprise-investment-scheme-and-seed-enterprise-investment-scheme-statistics
User engagement HMRC is committed to providing impartial quality statistics that meet our users’
needs. We encourage our users to engage with us so that we can improve our National Statistics and identify gaps in the statistics that we produce.
If you would like to comment on these statistics or have any enquiries on the statistics please use the statistical contacts named at the end of this section and on the cover page.
UKSA Assessment
These statistics have been assessed for compliance with the Code of Practice for Official Statistics by the UK Statistics Authority (UKSA). The assessment report is available on the UKSA website:
http://www.statisticsauthority.gov.uk. UKSA is an independent body directly accountable to Parliament with the overall
objective to promote and safeguard the production and publication of official statistics. It is also required to promote and safeguard the quality and comprehensiveness of official statistics and good practice in relation to official
statistics.

12
Contact points
Enquiries about these statistics should be directed to the responsible statisticians:
Akash Patel
[email protected] 03000 599791
Dominica Parry
[email protected] 03000 589593
KAI Direct Business Taxes HM Revenue & Customs
100 Parliament Street London SW1A 2BQ
Media enquiries should be directed to the HMRC Press Office contacts listed on the front page of this release.