ventilator waveforms waveforms: basic interpretation and analysis. american thoracic society. viewed...
TRANSCRIPT

Ventilator Waveforms where do I start and what do they tell me?
Danica HansenClinical Nurse Specialist
Intensive CareNepean Hospital
2016

Objectives
• Very briefly review lung anatomy and physiology, including resistance and compliance
• Review normal flow patterns and pressure curve
• “Where to start”: waveform 5-point assessment
• “What do they tell me?”: interpreting waveforms
• Troubleshooting signs of resistance and compliance

Lung Anatomy and Physiology
• Function: Gas exchange

• Structure: lower airway
Lung Resistance
• The ability of gas to move through the conducting airway: ETT and patient airway.
• Dependent on whether flow is laminar of turbulent.
• Dependent on ETT size, airway size and flow rate.
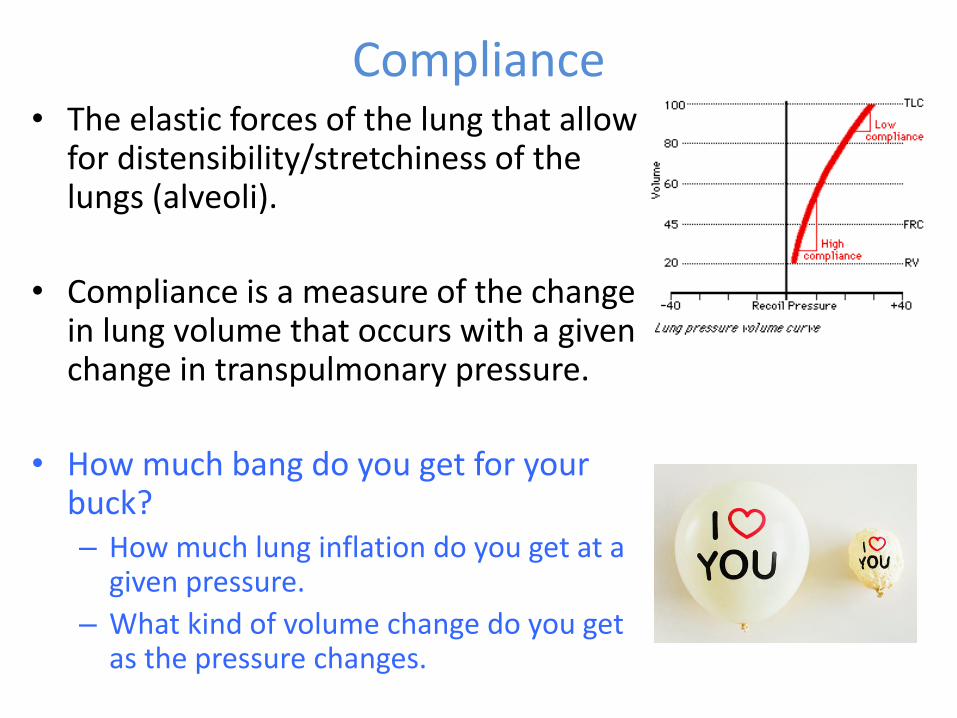
Compliance• The elastic forces of the lung that allow
for distensibility/stretchiness of the lungs (alveoli).
• Compliance is a measure of the change in lung volume that occurs with a given change in transpulmonary pressure.
• How much bang do you get for your buck?– How much lung inflation do you get at a
given pressure.
– What kind of volume change do you get as the pressure changes.

A bit on lung pressure• Transpulmonary pressure =
alveolar pressure pleural pressure
minus
It is the transpulmonary pressure that maintains alveolar inflation and keeps the lungs from collapsing.
Pleural pressure must always be more negative than both alveolar and atmospheric pressure to prevent lung collapse- it is approx. 4mmHg-6mmHg less than alveolar pressure.

A bit more on lung pressure (and compliance)
• How transpulmonary pressure is increased:– In spontaneous breathing the pleural pressure becomes more -ve
– In positive pressure ventilation the PPV increases the alveolar pressure
• Transpulmonary pressure is also affected by gravity.– The higher up the lung, the greater the
distending/transpulmonary pressure and therefore the more open alveoli will become:
greater transpulmonary pressure = greater lung expansion

Flow Patterns
With square flow With a descelerating flow
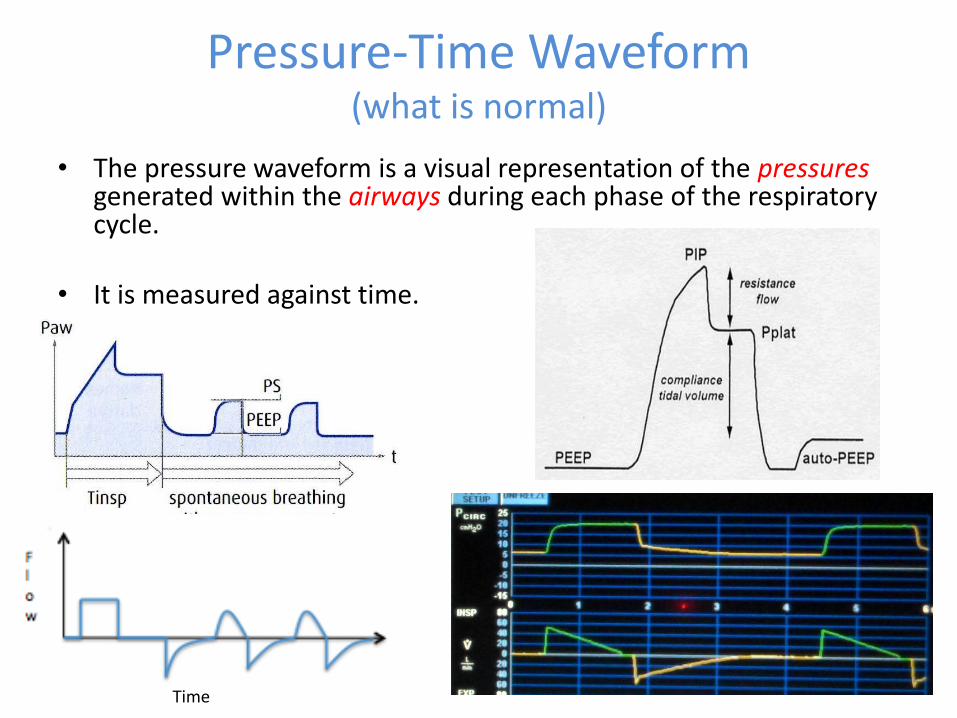
Pressure-Time Waveform(what is normal)
• The pressure waveform is a visual representation of the pressuresgenerated within the airways during each phase of the respiratory cycle.
• It is measured against time.
Time

A: At the top.Q: Where do I start?
• Identify what mode of ventilation and the type of flow pattern
• Keep it simple with a
5-point assessment

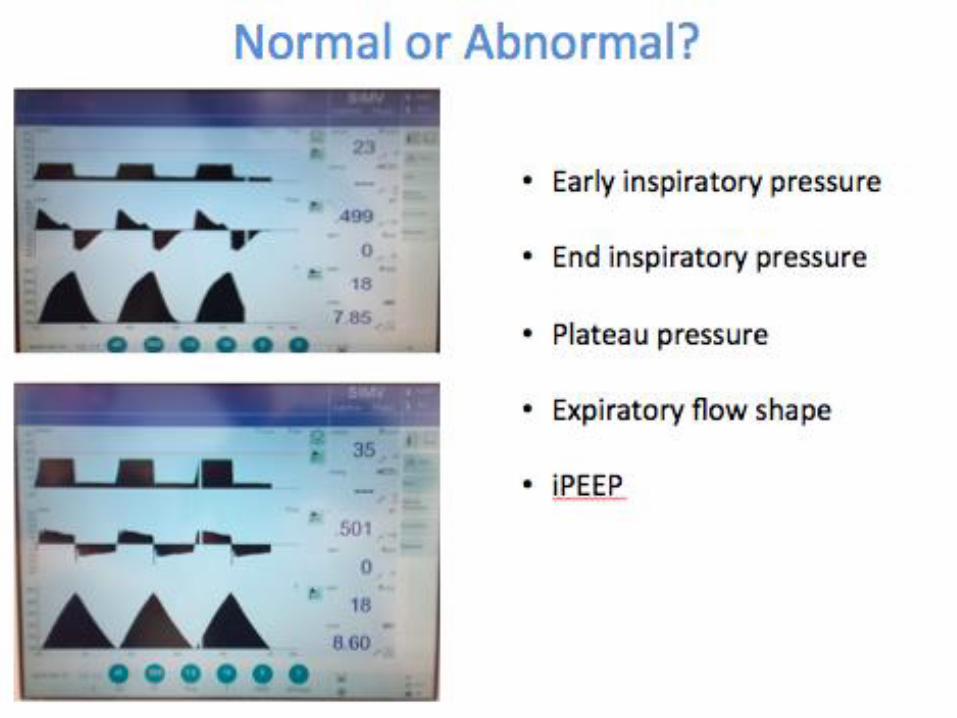
Waveforms 5-point assessment (from the top)
1) Early inspiratory pressure
2) End inspiratory pressure
3) Plateau pressure
4) Expiratory flow curve
5) AutoPEEP

1) Early Inspiratory Pressure
• The initial pressure generated to overcome resistance in the airways.
• No volume is delivered at this time, simply a rise in pressure enough to start pushing air in.
• An abnormal rise in this pressure is an indication of increased airway resistance.

Early Inspiratory Pressure Waveforms
Normal pressure-time curve with descending ramp flow pattern
Raised early inspiratory pressure with descending flow pattern
PIP 40cm H20
Normal pressure-time curve with square flow pattern
Paw
PIP
Pplat
Tinsp Texp Tinsp Texp
time
flo
w
Raised early inspiratory pressure with square flow pattern
PIP

2) End Inspiratory Pressure
• The pressure generated to overcome lung compliance.
• Added on top of Pres.
• An abnormal rise in this pressure is an indication of decreased lung compliance.

End Inspiratory Pressure Waveforms
Raised end inspiratory pressure with square flow pattern
time
flo
w
Tinsp Texp
Pplat
PIP 30cm H20
Normal pressure-time curve with descending ramp flow pattern
Raised end inspiratory pressure with descending flow patterm
Normal pressure-time curve with square flow pattern
PIP
3) Plateau Pressure
• An increase in pressure at end inspiration as a result of decreased compliance.
• Measured by performing an ‘inspiratory hold’ on the ventilator.
• Causes of increased Pplat include: lung, pleura, chest wall, patient-ventilator dyssynchrony.
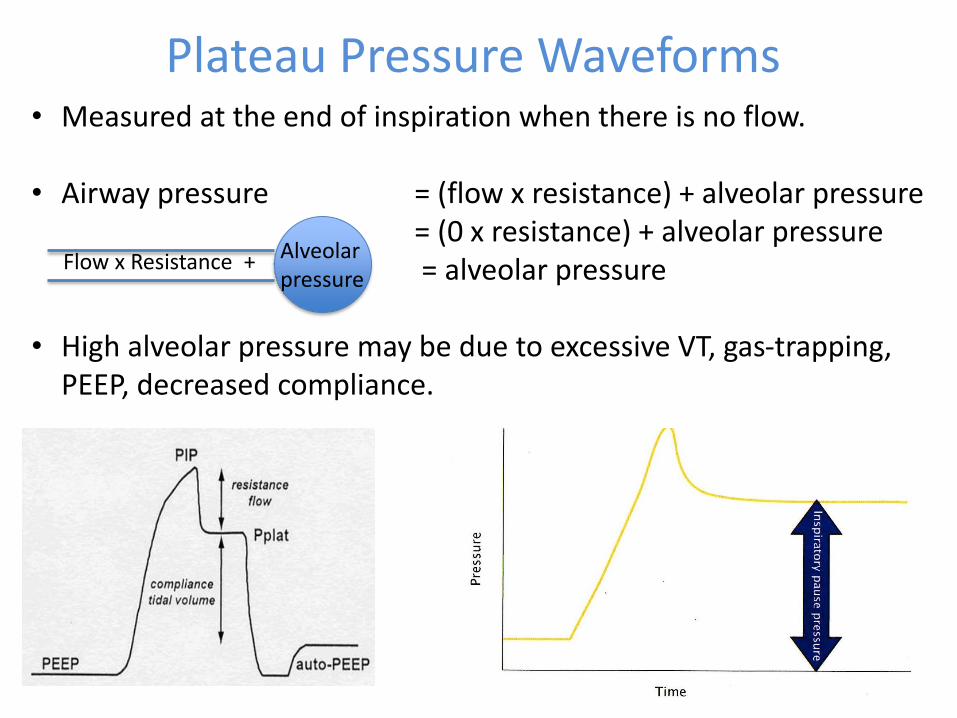
Plateau Pressure Waveforms• Measured at the end of inspiration when there is no flow.
• Airway pressure = (flow x resistance) + alveolar pressure= (0 x resistance) + alveolar pressure= alveolar pressure
• High alveolar pressure may be due to excessive VT, gas-trapping, PEEP, decreased compliance.
Alveolarpressure
Flow x Resistance +

4) Expiratory Flow Waveforms
• Expiratory flow is a passive process reliant on the natural recoil of the lungs and chest wall.
• Like the pressure waveform the expiratory flow curve too can illustrate resistance and compliance.
• Essentially increased resistance is a linear expiratory waveform and decreased compliance is a concave expiratory waveform.

Expiratory flow shapes• Normal:
• Expiratory flow curve triangular (shallow curve returning to baseline).
• >80% gas expired in first second of expiration.
• Increased resistance:• Expiratory flow curve horizontal/linear.• <80% gas expired in first second of
expiration.• Resistance constant, may not return to
baseline.
• Decreased compliance:• Expiratory flow curve is deep and concave.• <80% gas expired in first second of
expiration.• Resistance increases as lung volume
decreases.
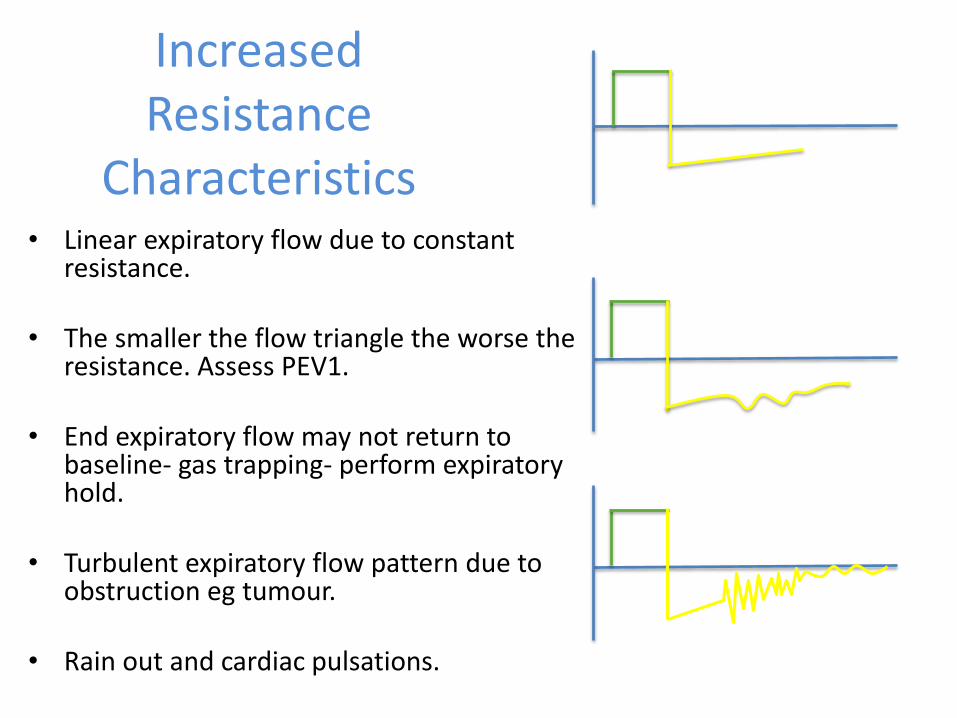
Increased Resistance
Characteristics• Linear expiratory flow due to constant
resistance.
• The smaller the flow triangle the worse the resistance. Assess PEV1.
• End expiratory flow may not return to baseline- gas trapping- perform expiratory hold.
• Turbulent expiratory flow pattern due to obstruction eg tumour.
• Rain out and cardiac pulsations.

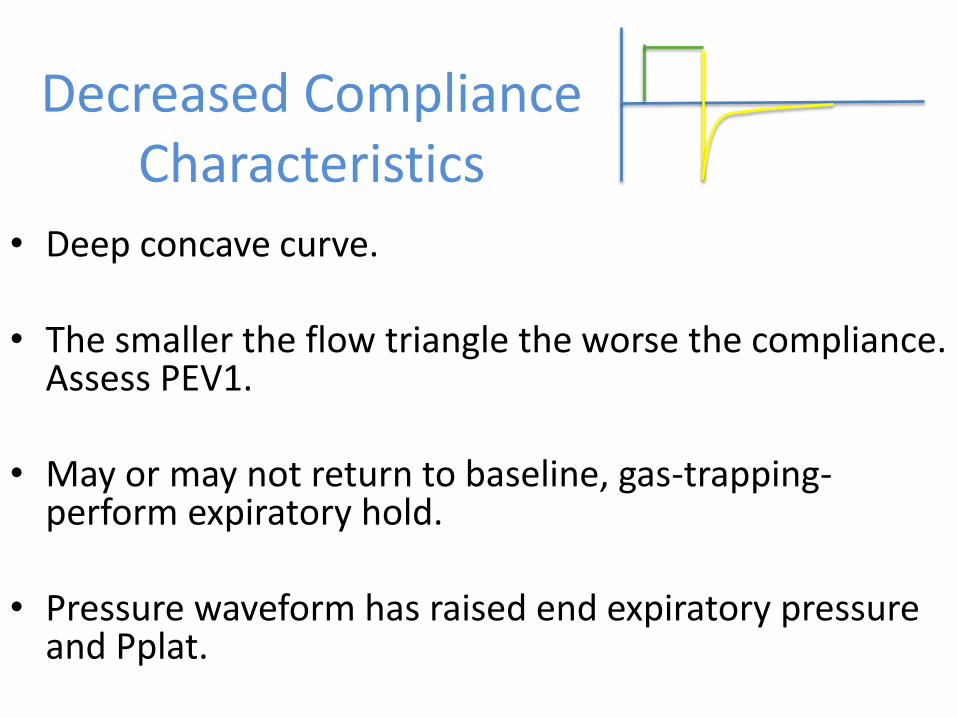
Decreased ComplianceCharacteristics
• Deep concave curve.
• The smaller the flow triangle the worse the compliance. Assess PEV1.
• May or may not return to baseline, gas-trapping-perform expiratory hold.
• Pressure waveform has raised end expiratory pressure and Pplat.


5) iPEEP
• Also known as autoPEEP, gas/air trapping, dynamic hyperinflation.
• An increase in pressure at end expiration due to baseline lung volume that is greater than the FRC as a result of increased Raw and insufficient expiratory time.
• Measured by performing an ‘expiratory hold’ on the ventilator.
• Most commonly seen in diseases such as COPD and asthma.

iPEEP Waveforms
• Pressure rise during expiratory hold.
• Expiratory flow fails to return to baseline.
• Plateau (A) in volume waveform as VTe is less than VT due to gas-trapping.
Flo
w

What does it tell me?... interpreting waveforms
Putting the 5-point assessment into action


Linear expiratory flow (resistance), not returning to baseline (gas-trapping), plateau in expiratory volume curve (gas-trapping), perform exp. hold.
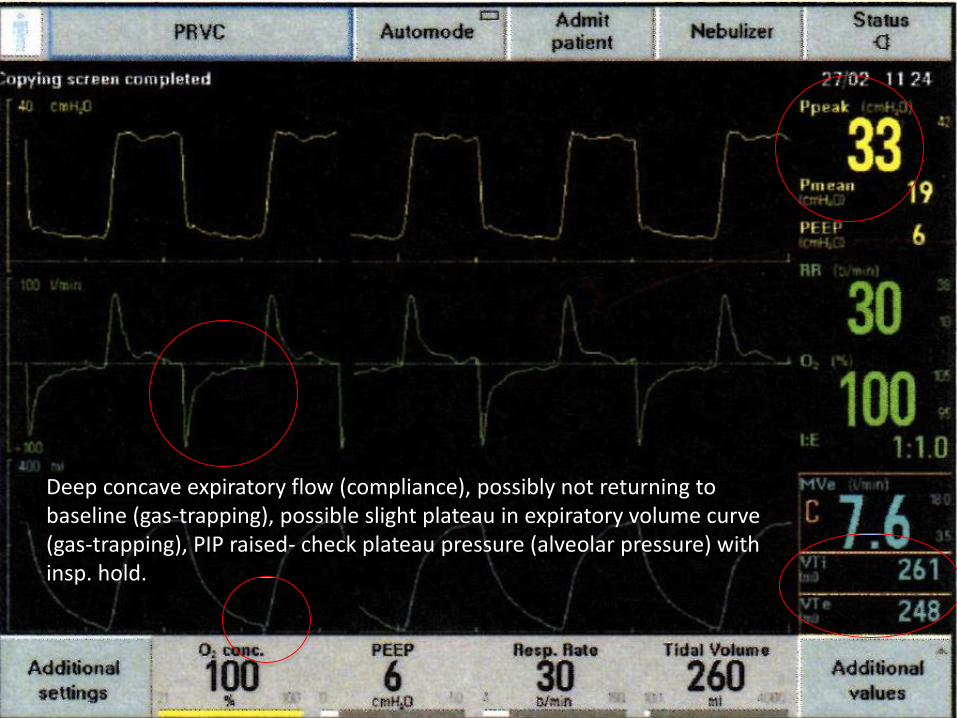
Deep concave expiratory flow (compliance), possibly not returning to baseline (gas-trapping), possible slight plateau in expiratory volume curve (gas-trapping), PIP raised- check plateau pressure (alveolar pressure) with insp. hold.
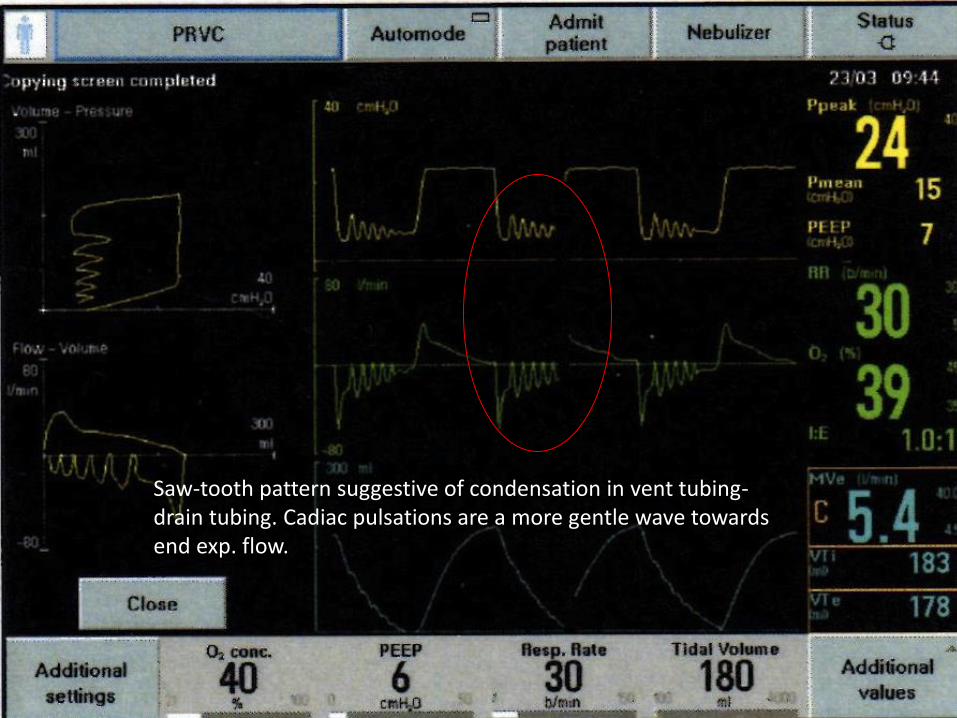
Saw-tooth pattern suggestive of condensation in vent tubing-drain tubing. Cadiac pulsations are a more gentle wave towards end exp. flow.

Classic shark fin- increased early inspiratory pressure (resistance) pushing PIP high-noted plateau pressure looks normal. Linear expiratory flow (resistance), not returning to baseline (gas-trapping), slight plateau in expiratory volume curve (gas-trapping), PIP raised- check autoPEEP with exp. hold.

Expiratory pressure curve delayed (patient breathing out against obstruction). Linear expiratory flow (resistance). Check for obstruction in outflow tract.

Double breath- adjsut insp. cycle off to lower % of peak flow to make breath bigger or increase PS to increase VT.
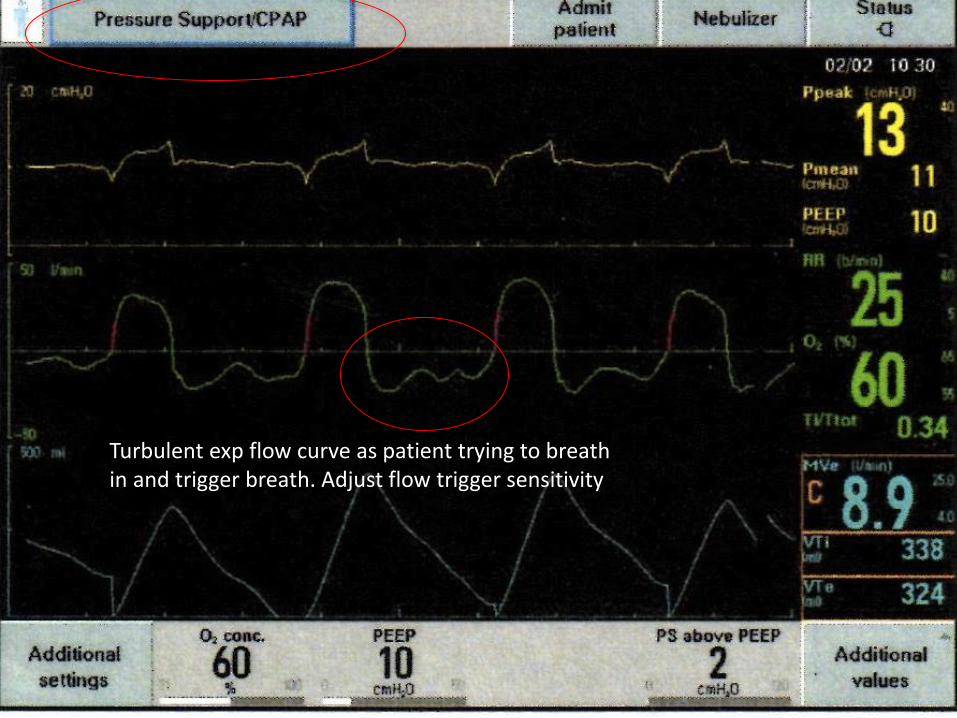
Turbulent exp flow curve as patient trying to breath in and trigger breath. Adjust flow trigger sensitivity

What’s the intervention?
High early insp. Pressure and linear exp. flow = increased resistance.
Intervention= suctioning, bronchodilators
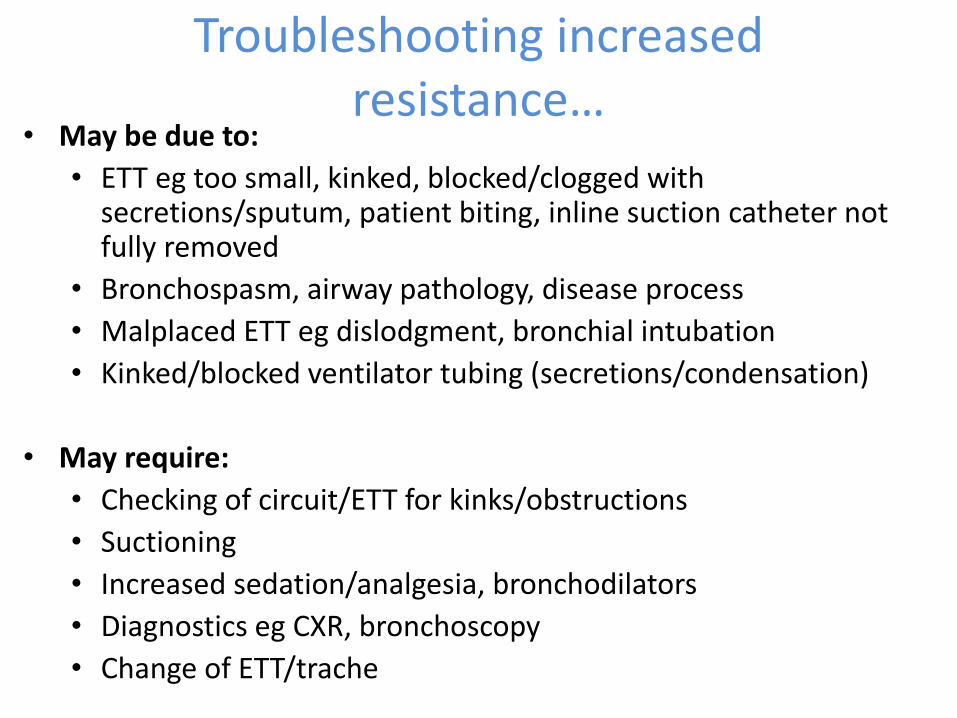
Troubleshooting increased resistance…
• May be due to:
• ETT eg too small, kinked, blocked/clogged with secretions/sputum, patient biting, inline suction catheter not fully removed
• Bronchospasm, airway pathology, disease process
• Malplaced ETT eg dislodgment, bronchial intubation
• Kinked/blocked ventilator tubing (secretions/condensation)
• May require:
• Checking of circuit/ETT for kinks/obstructions
• Suctioning
• Increased sedation/analgesia, bronchodilators
• Diagnostics eg CXR, bronchoscopy
• Change of ETT/trache

Troubleshooting decreased compliance…
• May be due to:
• Lung e.g. collapse, consolidation, pulmonary oedema, asthma, COPD, ARDS
• Pleura e.g. pleural effusion, pneumo/haemothorax
• Chest wall e.g. abdominal distention, obesity, kyphoscoliosis
• Patient-ventilator dysynchrony, coughing
• May require:
• CXR
• Bronchodilators, chest drain
• Repositioning eg sitting upright, lateral lie to favour lung, proning
• Change in ventilation strategy

END!

References
Covidien (2012). Ventilator Waveforms Graphical Presentation. Covidien.
Garg, S. (2010). Mechanical Ventilation. SlideShare. Viewed 16th November 2016,
<http://www.slideshare.net/doctorshalinigarg/mechanical-ventilation-3355414>
Gommersall, C., Joynt, G., Tang, S., Reade, M., Flaatten, H., Freebairn, R. & Loew, C. (2014). Mechanical ventilation: beyond basic. Department of Anaesthesia & Intensive Care, The Chinese University of Hong Kong, Shatin, Hong Kong.
Iyer, V. (2016). Ventilator waveforms: basic interpretation and analysis. American Thoracic Society. Viewed 16th November 2016,
https://www.thoracic.org/professionals/clinical-resources/critical-care/clinical-education/mechanical-ventilation/ventilator-waveform-analysis.php
LITFL. (2015). High airway and alveolar pressures. Viewed 27th Nov 2016, <http://lifeinthefastlane.com/ccc/high-airway-and- alveolar-pressures/>
John Hopkins School of Medicine. (1995). Interactive Respiraotry Physiology: airway resistance. Viewed 25th Oct 2017,
http://oac.med.jhmi.edu/res_phys/Encyclopedia/AirwayResistance/AirwayResistance.HTML
John Hopkins School of Medicine. (1995). Interactive Respiraotry Physiology: compliance. Viewed 25th Oct 2017,
http://oac.med.jhmi.edu/res_phys/Encyclopedia/Compliance/Compliance.HTML
Workshop notes from Prof D. Tuxen’s Airway Obstruction Waveforms Workshop, The Alfred Mechanical Ventilation Conference 2015, The Alfred, Melbourne.
Image References• Gas exchange: http://byjus.com/biology/exchange-regulation-of-gases/
• Blaming the dog: https://floroy1942.wordpress.com/tag/cartoons/
• Bronchial tree: https://www.dreamstime.com/stock-images-bronchial-tree-image20704714
• Compliance Curve: http://oac.med.jhmi.edu/res_phys/Encyclopedia/Compliance/Compliance.HTML
• I love you balloons: http://www.dimitri.co.uk/romance/inflated-deflated-baloons-love.html
• Resistance/Compliance Pressure Curve:http://www.slideshare.net/bibinibaby5/mechanical-ventilation-ppt?next_slideshow=1
• Googling diagnosis: https://www.pinterest.com/crickeygirl/medical-cartoons/
• Normal Pressure Curve: Kremeier, P. & Woll, C. (2015). The Kronburg List of Ventilation Modes. Pabst Science Publishers. Lengerich.
• Paw waveforms:http://www.slideshare.net/doctorshalinigarg/mechanical-ventilation-3355414
• Thermometer: https://www.pinterest.com/crickeygirl/medical-cartoons/
• Maquet (date unknown). Waveforms and troubleshooting. Beyond Basic course material, May 29th 2016, Nepean Hospital.