ventilation strategies for good indoor climate and energy ... · contents of the presentation •...
TRANSCRIPT

Ventilation strategies for good indoor climate and energy performance in
schools
Air distribution and temperature control in classrooms
Jarek
KurnitskiDocent, D.Sc.
Helsinki University of Technology Heating, Ventilation and Air Conditioning
1TKK
Swegon Air Academy 11.11.2008
Utrecht

Introduction
• Many studies have reported poor ventilation and thermal comfort in schools worldwide
• Recent studies have investigated the linkage of ventilation rates and temperature to objectively measured school work performance:– Norwegian study (Myhrvold and Olesen 1997)– U.S. study (Shaughnessy et al. 2006)– Japanese study (Ito et al. 2006 and Murakami et al. 2006)– Danish study (Wargocki & Wyon 2006)– Dutch study (TNO 2006)– UK intervention (Bakó-Biró et al. 2007)
• All these studies have quite similar outcome indicating:1. the need for higher ventilation rates than used today, as positive effects are
shown at least up to 10 L/s per person (about 5 L/s per floor m2)2. and the need for more strict temperature control than commonly used, as
temperature increase has lead to performance decrement of about 2% per 1°C

Normal office situation
(Thanks to C. Derikx and Atze Boestra)
15 m2
per person

Translated to school situation...
2–3 m2
per person

Contents of the presentation
• What should be done to achieve healthy and productive indoor environment quality (IEQ) in classrooms?
• “Ventilate well and strictly control the temperature” IEQ differs quite from IEQ in a typical school with ventilation rate ≤4 L/s per person and no special attention to temperature control
• Alternative solutions for ventilation systems• Main IEQ-problems in schools• Measurement and simulation results
• Special attention to air distribution solutions capable for low air velocities and supply air temperature at high ventilation rates:– air distribution measurements to assess do we have presently available
cost efficient solutions for good IEQ – all studied cases without mechanical cooling in common classrooms

In office buildings we use a lot of effort for good IEQ

And we accept the need of HVAC as essential…

In schools we often discuss is the ventilation really needed…
• We often believe that window opening compensates ventilation,• or natural ventilation does the task,• or very simple mechanical solutions are enough…• Such discussions are typically held in air conditioned rooms…

Basic question of IEQ: how to manage temperature and air distribution in classrooms with highly varying loads?
South classroom: 30 students + solar radiation =
cooling need
North classroom, 15 students:
heating need
No air conditioning, cost efficient ventilation system: • Constant ventilation or demand controlled ventilation • Supply air temperature compensation (cooling with
outdoor air)
The same system should serve all classrooms

Control in AC-system
Chilled beam
ME TE
TE
TE
TC
TC
TC
TE
a)
a)
Air-handling unit
Radiator andthermostatic
valve
District heating supply
District heating return
District heating substation
Air cooledcondenser
Water chiller
Chilled watertank
In AC system:
Room controller for cooling and room conditioning device
Thermostat for heating and radiator
CAV ventilation very often
The room

Control in a simple ventilation and heating system
• Thermostat/radiator in the heating mode• Supply air temperature and air flow rate control for cooling (with
outdoor air + night ventilative cooling) – T and CO2 controlled ventilation (DCV)
Air-handling unit
Radiator andthermostatic valve
District heating supply
District heating return
District heating substation
Ven
tila
tio
nra
te,q
v
CO -
concentration2
Min(~600 ppm)
Max(~1000 ppm)
Max
Min
TS 22
23 TE19
16

Alternatives for ventilation systems
• Natural ventilation – was used before mechanical and hybrid systems
• Mechanical exhaust ventilation – cannot be used in cold climate in classrooms due to draft (as well as noise, dust, PM2.5 )
• Mechanical supply and exhaust ventilation (balanced ventilation) with heat recovery:– Constant air volume (CAV) system– Demand controlled ventilation (DCV or VAV)– Low pressure DCV + night time ventilative cooling
• Hybrid ventilation system:– Fan assisted natural ventilation systems– Mechanical supply and exhaust ventilation + natural ventilation (double
system)– Stack and wind assisted mechanical ventilation system (more or less
the same as the low pressure system)
• No AC (air conditioning) in common classrooms in cold climate (computer classrooms/server rooms need AC)

Energy performance
• EP-target values are as essential as IEQ-target values, i.e. design objective
• Good IEQ and EP are not conflicting requirements
• Good energy performance can be ensured by:– Heat recovery
– exhaust air heats up supply air in the heat exchanger
– Demand controlled ventilation
– shorter operation time and lower fan speeds
– Low pressure design and high efficiency components
(fans, pumps etc.) – less electricity for running of ventilation
– As well as overall design quality regarding solar protection, windows and thermal insulation, building shape etc.

Examples of ventilation systems Fan assisted natural ventilation system,
Ruusutorppa
school, Espoo, Finland
• Fan assisted natural ventilation• Supply air fan operates when needed• No exhaust fans, no heat recovery• Cold climate => preheated and filtered supply air• Cross ventilation may be used between lessons

Supply air chamberExhaust fan
Classroom
Classroom
Corridor
Corridor
Toilet
Toilet
Outdoor air
Deflectionplates
Damper
Electrostaticprecipitator
Ventilation principle in Ruusutorppa school, Helsinki

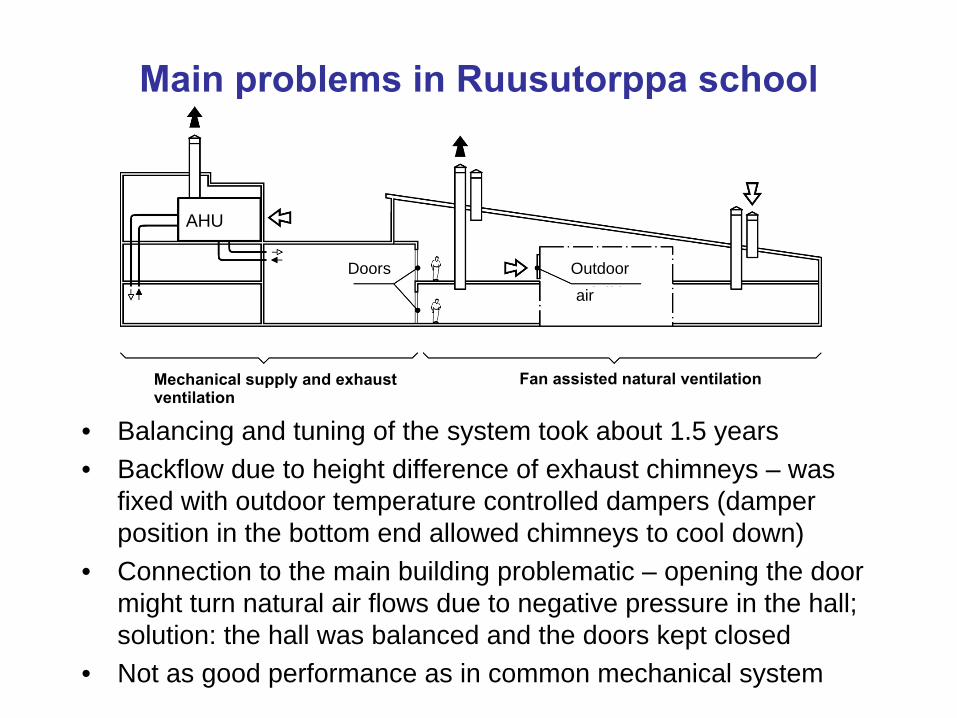
Main problems in Ruusutorppa
school
AHU
Doors Outdoor air
Mechanical supply and exhaust ventilation
Fan assisted natural ventilation
• Balancing and tuning of the system took about 1.5 years• Backflow due to height difference of exhaust chimneys – was
fixed with outdoor temperature controlled dampers (damper position in the bottom end allowed chimneys to cool down)
• Connection to the main building problematic – opening the door might turn natural air flows due to negative pressure in the hall; solution: the hall was balanced and the doors kept closed
• Not as good performance as in common mechanical system

Examples of ventilation systems Hybrid ventilation, Mediå
School, Grong, Norway
Architect:
Architects: Letnes Arkitekter A/S
(Thanks to Per Heiselberg)

Mediå
Primary School
• Typical hybrid ventilation system in Nordic countries• Architect driven design, from natural to mechanical ventilation• Demonstrates the evolution of these systems:
– First systems were natural ventilation systems (and failed)– The last ones are stack and wind assisted low pressure mechanical
systems with heat recovery
• Brief description of ventilation strategy– The hybrid ventilation system (Stack and wind assisted
mechanical ventilation) is a balanced, low-pressure mechanical system with both central air supply and exhaust. The system includes filtering, heat recovery, preheating in underground culvert and heating. The system is demand controlled by CO2 sensors in each classroom.

Air Supply
System

Air Exhaust
System
• More complicated systems than common mechanical ones• Less controlled air distribution and less stable airflows in classrooms• Lower fan energy use, but higher heating energy use due to less
effective heat recovery

Poikkilaakso
school, Helsinki, Finland
• One of modern schools in Helsinki, completed 2001• Well designed and construction integrated mechanical ventilation
system – no compromises between indoor climate and architecture

Poikkilaakso
school, ventilation concept• low pressure mechanical ventilation with heat recovery • the building serves as an air flow route => no visible ducts inside• central spaces ventilated with transfer air from classrooms
where the CO2 sensors are located
Large exhaust air ducts 2.5 m by 1.6 m on the roof
Large supply air ducts 2.0 m by 1.6 m on the roof
Vertical ducts, 200 mmAir extract in the central hall
Transfer air

Supply air ducts in Poikkilaakso
school
• No visible equipment• Very quiet operation
Horizontal ducts (2 m by 1.6 m) are part of the roof structure
Vertical ducts from the roof to the classrooms
Displacement air supply

• Silent and invisible mechanical ventilation system – many users have pointed out that the building has a feeling of natural ventilation but also superior air quality

What are most common IEQ-problems and complaints in schools?

Most common IEQ-problems in schools 2007 vs. 1996
0 10 20 30 40
Visible mold or smellof mold
Stuffy air
Inadequate ventilation
Draught (in winter)
Weekly prevalence, %
0 10 20 30 40
Mold
Moisture problem
Noise
Impractical rooms
Lack of space
Temperature
Inadequate ventilation
Prevalence, %
1164 schools, Finland (Kurnitski
et al. 1996)
460 schools, Finland (Putus
& Rimpelä
2007)

IEQ-problems according to ventilation system (Kurnitski
et al. 1996)
0 10 20 30 40 50 60 70
Unpleasant odorsspring/autumn
Unpleasant odors, winter
Stuffy air, spring/autumn
Stuffy air, winter
Draught, spring/autumn
Draught, winter
Inadequate ventilationspring/autumn
Inadequate ventilationwinter
Weekly prevalence [%]
Natural ventilationMechanical exhaustMechanical supply and exhaust

3.5
1.6
2.3
5.5
1.2
0.4
0.9
1.9
1061
1285
1181
8360
1
2
3
4
5
6
7
8
Average valueof all
measurements
Naturalventilation
Mechanicalexhaust
Mechanicalsupply and
exhaust
Vent
ilatio
n ra
tes
[ l/s
,per
s;m
²]
800
900
1000
1100
1200
1300
1400
CO
2 con
cent
ratio
ns [
ppm
]
[ l/s,person] [ l/s m²] [ppm] (Kurnitski
et al. 1996)

Outcome of Finnish school studies
• Most common IEQ-problems in schools:1. Inadequate ventilation (41%)2. Room temperature (27%)3. Lack of space (25%)
• Much more problems in natural and mechanical exhaust ventilation relative to mechanical supply and exhaust ventilation

Situation in 11 Dutch schools
(van Dijken 2004)

Room temperature and CO2
performance (Kurnitski
et al. 2008)
• Sample of schools:– 6 schools 1910-1960– 10 schools 1960-1970– 10 schools 1970-1980– 28 schools 1980-2000– 6 schools 2000-
• Room temperature data during one week in May (21-25.5.2007, mean outdoor temperature 13°C) from 63 classrooms. Data from the school time, from 8:00 to 14:00 on week-days.
18
20
22
24
26
28
0 0,2 0,4 0,6 0,8 1
Cumulative frequency, -
Roo
m te
mpe
ratu
re, °
C

Temperature fluctuations during one week
• only occupied hours from 8:00 to 14:00 from Monday to Friday considered (21-25.5.2007)
• results from three classrooms represent 10th, 50th (median) and 90th percentile of the weekly temperature difference
• the temperature variation is from 1 to 3 °C during couple of hours
19
20
21
22
23
24
0:00 0:00 0:00 0:00 0:00 0:00
Time, h:mm
Roo
m te
mpe
ratu
re, °
CGood design, stable temp.

Outdoor temperature dependency – typical temperature patterns in classrooms
y = 0,02x + 21,66R2 = 0,01
18
20
22
24
26
0 4 8 12 16 20
Outdoor temperature, °C
Indo
or te
mpe
ratu
re, °
C
y = 0,09x + 20,25R2 = 0,13
18
20
22
24
26
0 4 8 12 16 20
Outdoor temperature, °C
Indo
or te
mpe
ratu
re, °
C
y = 0,17x + 19,89R2 = 0,36
18
20
22
24
26
0 4 8 12 16 20
Outdoor temperature, °C
Indo
or te
mpe
ratu
re, °
C
y = 0,02x2 - 0,28x + 22,70R2 = 0,54
18
20
22
24
26
28
0 4 8 12 16 20 24 28Outdoor temperature, °C
Indo
or te
mpe
ratu
re, °
C

Temperature in August (warm period) 14-30.8.2007, just after summer holidays
20
22
24
26
28
0 0,2 0,4 0,6 0,8 1
Cumulative frequency, -
Indo
or te
mpe
ratu
re, °
C
y = 0,39x + 18,92R2 = 0,84
20
22
24
26
28
30
6 10 14 18 22 26Outdoor temperature, °C
Indo
or te
mpe
ratu
re, °
C
y = 0,23x + 20,96R2 = 0,79
20
22
24
26
28
30
6 10 14 18 22 26Outdoor temperature, °C
Indo
or te
mpe
ratu
re, °
C

Temperature simulations
• 2 or 6 classroom simulations with part load vs. full load occupancy• Determining air flow rate and the control curve needed for the temperature
control (no cooling!)• CAV vs. DCV and heating season vs. summer performance
30 students South
20 studentsSouth
20 students South
20 studentsNorth
20 students North
30 students North
0
5
10
15
20
25
30
35
6:00
6:45
7:30
8:15
9:00
9:45
10:30
11:15
12:00
12:45
13:30
14:15
15:00
15:45
16:30
17:15
18:00
Time, hh:mm
No
of p
erso
ns
30 students/South20 students/North

Results, summer
• Two ventilation rates, 6 L/s per person, 180 L/s per classroom in total or 10 L/s per person, 300 L/s per classroom in total.
• For both rates CAV system and DCV system with CO2 and temperature control was simulated. DCV system had two air flow steps, 100 % and 40% of total airflow.
South classroom in the summer
1819202122232425262728293031
0 50 100 150 200 250 300 350Time, h
Roo
m te
mpe
ratu
re, °
C
CAV 180l/sDCV 180l/s, 40% / 100% CAV 300l/sDCV 300l/s, 40% / 100%
North classroom in the summer
1819202122232425262728293031
0 50 100 150 200 250 300 350Time, h
Roo
m te
mpe
ratu
re, °
C
CAV 180l/sDCV 180l/s, 40% / 100%
CAV 300l/sDCV 300l/s, 40% / 100%
DCV 300 l/s with night ventilative cooling <100 °Ch above 25 °C

Results, heating season
• Excess degree-hours over 22°C should be less than 100°Ch• (excess of 2°C during 5 hours is 2*5=10°Ch)
South classroom in the heating season
1819202122232425262728293031
0 100 200 300 400 500 600 700 800 900 1000 1100Time, h
Roo
m te
mpe
ratu
re, °
C
CAV 180l/s
DCV 180l/s, 40% / 100%
CAV 300l/s
DCV 300l/s, 40% / 100%
North classroom in the heating season
1819202122232425262728293031
0 100 200 300 400 500 600 700 800 900 1000 1100Time, h
Roo
m te
mpe
ratu
re, °
C
CAV 180l/s
DCV 180l/s, 40% / 100%
CAV 300l/s
DCV 300l/s, 40% / 100%

Which system works in all conditions?
Sum of degree hours in weekdays at 08:00-15:00, °Ch Heating season Summer periodVentilation system and classroom orientation Over 22°C Below 20°C Over 25°C Below 22°C
Criterion, °Ch 100 0 100 100CAVSouth classroom 300 L/s 181 0 200 118South classroom 300 L/s, with solar protection glasses 92 0 116 47North classroom 300 L/s, with low occupancy 0 56 11 212CAV + heating coil in supply duct for each classroomSouth classroom 300 L/s, with solar protection glasses 96 0 114 70North classroom 300 L/s, with low occupancy 0 0 11 106DCV 40-100%South classroom 120-300 L/s, with solar protection glasses 99 0 162 15North classroom 120-300 L/s, with low occupancy 0 0 7 105DCV 40-100% + night ventilative coolingSouth classroom 120-300 L/s, with solar protection glasses 99 0 83 31North classroom 120-300 L/s, with low occupancy 0 0 4 114

Temperature control
Effective temperature control was possible by:1. Supply air temperature going down to 14-15 °C with free cooling 2. Demand controlled ventilation (T and CO2 control to avoid excessive
cooling in North facade classrooms at part load)3. Ventilation rate of 10 L/s per person (5 L/s per m2)
Supply air temperaturecontrol curve
13
14
15
16
17
18
19
17 18 19 20 21 22 23 24
Exhaust air temperature °C
Supp
ly a
ir te
mpe
ratu
re °C
Supply air to classrooms in theheating seasonSupply air to classrooms in thesummer

Which air distribution solutions are capable for 15°C supply air temperature and 5 L/s per m2
airflow rate without draft?

Many solutions for air distribution
Intake air (not in use any more) Wall diffusers (ref. case)
Ceiling or duct diffusers (many available options) Displacement ventilation

How about suitable air distribution solutions for 15°C/300 L/s supply air?
• Air velocity, room temperature and CO2 measurements in 6 schools• All schools relatively new or renovated, having modern mechanical
supply and exhaust ventilation systems with ventilation rates, corresponding at least to Finnish minimum code requirements
• Air distribution in schools A to F:
APerforated duct
BWall diffusers (ref.)

CDuct diffusers
DCeiling diffusers
E F
EDuct diffusers
FDisplacement diffusers

Results –
airflow rates
• E was a new school having almost doubled supply airflow rate (design value of 12 l/s per person, 340 l/s in total) and also other target values of the highest indoor climate class
• Schools A and B had CO2 - and CO2 & temperature controlled ventilation with 3 and 2 airflow steps respectively
• CAV systems in other schools• A to D had a constant supply air temperature and in E and F supply
air temperature was controlled according to exhaust air temperature
School Occupancy, pers. Supply air flow rate, L/s per pers.
Supply air flow rate, L/s
Design supply air flow rate, L/s
A 20 7 138 210/150/90B 27 7 186 210/30C 22 6 136 175D 20-25 6.8-8.2 168 170E 348 340F 180 180

Room temperature & CO2 measurements/ heating season
• One week in early spring, outdoor temperature between 9…12 °C • Results from the school time only, from 8.00 to 15.00 on week-days
19
20
21
22
23
24
25
0 % 20 % 40 % 60 % 80 % 100 %Time, %
Roo
m te
mpe
ratu
re, °
C
A, West B, West
C, East D, South
300
400
500
600
700
800
900
1000
1100
1200
1300
0 % 20 % 40 % 60 % 80 % 100 Time, %
CO
2 con
cent
ratio
n, p
pm
A B
C D

Air velocity
results• Air velocity measurements were done from the locations selected with the
smoke test (i.e. identifying the locations with highest air movement)• Maximum velocities from the occupied zone at three measured heights
A
0.1m 1.10m 1.80mA, perforated ducts, 138 L/s
2 0.25 0.06 0.13 24.7 20.4 4.36 0.03 0.13 0.20 24.9 20.4 4.59 0.18 0.29 0.08 24.6 20.4 4.2
DT, room - supply air
temperature, Measurement height
Meas. point Air Velocity, m/s Operative temperature,
°C
Supply air temperature,
°C

0.1m 1.10m 1.80mB, wall diffusers, 186 L/s
1 0.18 0.43 0.15 22.6 20.4 2.22 0.30 0.09 0.06 22.7 20.4 2.3
DT, room - supply air
temperature, Measurement height
Meas. point Air Velocity, m/s Operative temperature,
°C
Supply air temperature,
°C
B

0.1m 1.10m 1.80mC, duct diffusers, 136 L/s
1 0.10 0.07 0.16 22.6 19.8 2.9
DT, room - supply air
temperature, Measurement height
Meas. point Air Velocity, m/s Operative temperature,
°C
Supply air temperature,
°C
C

0.1m 1.10m 1.80mD, ceiling diffusers, 168 L/s
4 0.03 0.05 0.14 21.0 19.4 1.67 0.11 0.06 0.06 20.7 19.4 1.38 0.08 0.09 0.07 20.7 19.4 1.3
DT, room - supply air
temperature, Measurement height
Meas. point Air Velocity, m/s Operative temperature,
°C
Supply air temperature,
°C
D

0.1m 1.10m 1.80mE, duct diffusers 348 l/s
3 0.17 0.09 0.09 21.7 17.4 4.47 0.07 0.11 0.13 21.4 17.3 4.1
E, duct diffusers 348 l/s7 0.10 0.14 0.19 21.9 16.2 5.7
DT, room - supply air
temperature, Measurement height
Meas. point Air Velocity, m/s Operative temperature,
°C
Supply air temperature,
°C
E

0.1m 1.10m 1.80mF, dicplacement diffusers 180 l/s
4 0.28 - - - - 3
DT, room - supply air
temperature, Measurement height
Meas. point Air Velocity, m/s Operative temperature,
°C
Supply air temperature,
°C
F

Conclusions 1/2
• IEQ-problems in existing schools are typical (shown in many studies):– Ventilation rates– Temperature control– Air distribution– …
• Healthy, comfortable and productive IEQ can be achieved only through the performance based design: – Specify IEQ and EP target values/design values– Simulate temperatures with part- and full-load conditions– Check air distribution – reserve enough pressure for supply air device, all
other ductwork can be low-pressure one• Relevant standards and national guidelines can highly be
recommended for the target values: EN15251, EN13779 and CR1752
• Solid evidence showing that mechanical ventilation systems are cost efficient, and provide good indoor climate and energy performance

Conclusions 2/2
• It was demonstrated that high airflow rates up to 12 L/s,pers, 6 L/s,m2 were achieved without draft with cost-efficient solutions
• Remarkable differences between air distribution schemes:– Duct and ceiling diffusers showed good performance
with a
maximum velocity less than 0.2 m/s– Wall diffusers were clearly not suitable
for classrooms due to high
velocities up to 0.43 m/s.– Displacement ventilation was sensitive to supply air temperature
• Measurements indicated room temperature control problems (poor temperature control of supply air and low airflow rates)
• Supply air flow rates up to 10 L/s per person with DCV and cool supply air down to 14–15 °C with free cooling was needed for room temperature control (no mechanical cooling in common classrooms)
• There do exist solutions for healthy and productive classroom ventilation and application of these should be lead to substantial increase in student performance