vengeance - nber
TRANSCRIPT
NBER WORKING PAPER SERIES
VENGEANCE
Naci H. Mocan
Working Paper 14131http://www.nber.org/papers/w14131
NATIONAL BUREAU OF ECONOMIC RESEARCH1050 Massachusetts Avenue
Cambridge, MA 02138June 2008
I thank Armando Gomes, Volkan Topalli, Julie Hotchkiss, Sudipta Sarangi, Julie Berry Cullen, MuratIyigun and Kaj Gittings for helpful comments. Paul Mahler, Michelle McCown, Umut Ozek and DuhaAltindag provided excellent research assistance. The views expressed herein are those of the author(s)and do not necessarily reflect the views of the National Bureau of Economic Research.
NBER working papers are circulated for discussion and comment purposes. They have not been peer-reviewed or been subject to the review by the NBER Board of Directors that accompanies officialNBER publications.
© 2008 by Naci H. Mocan. All rights reserved. Short sections of text, not to exceed two paragraphs,may be quoted without explicit permission provided that full credit, including © notice, is given tothe source.

VengeanceNaci H. MocanNBER Working Paper No. 14131June 2008JEL No. H56,I0,K4,K42,O1,P16
ABSTRACT
This paper investigates the extent of vengeful feelings and their determinants using data on more than89,000 individuals from 53 countries. Country characteristics (such as per-capita income, averageeducation of the country, presence of an armed conflict, the extent of the rule-of-law, uninterrupteddemocracy, individualism) as well as personal attributes of the individuals influence vengeful feelings.The magnitude of vengeful feelings is greater for people in low-income countries, in countries withlow levels of education, low levels of the rule-of-law, in collectivist countries and in countries thatexperienced an armed conflict in recent history. Females, older people, working people, people wholive in high-crime areas of their country and people who are at the bottom 50% of their country's incomedistribution are more vengeful. The intensity of vengeful feelings dies off gradually over time. Thefindings suggest that vengeful feelings of people are subdued as a country develops economicallyand becomes more stable politically and socially and that both country characteristics and personalattributes are important determinants of vengeance. Poor people who live in higher-income societiesthat are ethno-linguistically homogeneous are as vengeful as rich people who live in low-income societiesthat are ethno-linguistically fragmented. These results reinforce the idea that some puzzles about individualchoice can best be explained by considering the interplay of personal and cultural factors.
Naci H. MocanDepartment of EconomicsLouisiana State University2119 Patrick F. Taylor HallBaton Rouge, LA 70803-6306and [email protected]
1
Vengeance
“Thou shalt give life for life, eye for eye, tooth for tooth, hand for hand, foot for foot.” Exodus 21:23-24
“An eye for an eye makes the whole world blind”
Attributed to Mahatma Gandhi.
I. Introduction
It has been argued that revenge serves a number of objectives, ranging from righting
perceived injustice to restoring self-worth of the vengeful individual (Cota-McKinley et al.
2001). The idea that vengeful behavior can stop potential offenders from committing similar
crimes or from even considering similar crimes (Cota-McKinley et al. 2001, Wilson 1983) also
suggests a deterrence effect of vengeance.
It has been indicated that “Revenge is often tied to self-worth of the originally offended
individual. Frequently, individuals with little power seek revenge against powerful adversaries
even though the action has overwhelming costs” (Kim and Smith, 1993). This argument implies
that investigation of the existence of vengeance, its extent and its determinants may be important
not only for theoretical and practical aspects of the criminal justice system, but also because it
may shed light into extremely violent behavior such as suicide bombings and other terrorist
attacks.
Although vengeance is assumed to be an integral part of human behavior, little
quantitative research exists on vengeance. One obvious reason for the dearth is the difficulty of
measurement. A common procedure to measure an individual’s extent of vengeful feelings is to
employ the widely-used Vengeance Scale (Stuckless and Goranson 1992). This is a 7-point
scale index based subjects’ responses to such hypothetical statements as “I am not a vengeful
2
person”, “I try to even the score with anyone who hurts me,” and “It is always better not to seek
vengeance,” Researchers have investigated the relationship between a vengeance index created
this way and various behaviors, such as aggressive driving (Wiesenthal, Hennessy, and Gibson,
2000).
The dictionary definition of vengeance is “Punishment inflicted or retribution exacted for
an injury or wrong.” Consider a situation where having been subjected to a “wrong” means
having been a victim of burglary in recent past and consider two individuals who are identical in
all respects. If one of these individuals was then burglarized, vengeful feelings can be identified
by the difference in the severity of punishment these individuals wish to inflict on a convicted
burglar. This paper operationalizes this concept and provides evidence on the extent of
vengeance using data on more than 89,000 individuals from 53 countries. It also investigates the
extent to which personal attributes of individuals, and cultural and country characteristics explain
the degree of their vengeful feelings.
People are likely to differ in their notions of fairness and in their beliefs about the level of
appropriate punishment. Furthermore, victimization may prompt enhanced demand for
protection, which may be mistaken for vengeance. To address these issues, empirical analyses
control for a host of personal characteristics that may be correlated with potential victimization
and the demand for punishment. These variables include, among others, age, gender, and
education of the person, the rank of family income in the income distribution of the country and
the burglary rate in the area of the residence of the person. Furthermore, I present evidence
indicating that having been victimized by burglary triggers vengeful feelings against a burglar,
but having been victimized by other crimes such as robbery and theft does not trigger demand for
harsher punishment for a burglar. This indicates that the results are not due to a general desire to
punish or a pre-existing demand for protection. It is conceivable that vengeful feelings of people
3
get stronger as they are exposed to more incidents of victimization. I find evidence that this is
the case for people who live in countries with undesirable political and economic environments.
The paper is related to an emerging literature in economics that analyzes the impact of
culture on violent or illicit behavior. For example, Fisman and Miguel (2007) show that the
parking violations of the foreign diplomats who live in New York City are related to the extent
of corruption in their home country. Miguel, Saiegh and Satyanath (2008) analyze the actions of
the soccer players in five European soccer leagues and find that the cautions and ejections
handed out by the referees due to rough play are correlated with whether or not the player’s
home country was involved in a war or armed conflict. They conclude that having been exposed
to war or armed conflict increases the propensity for violence.1
This paper documents that the degree to which people want retaliation depends on both
personal attributes and a number of country characteristics. For example, vengeful feelings are
stronger for people in low-income countries, in countries with low levels of education, low levels
of rule-of-law, in countries that experienced a war in recent history and in countries which are
fragmented ethno-linguistically. Females, older people, working people, people who live in
high-crime areas of their country and people who are at the bottom 50% of their country’s
income distribution are more vengeful. There is also evidence indicating that vengeful feelings
dissipate over time: having been victimized in recent past is associated with stronger vengeful
feelings than having been victimized in more distant past.
1 There is also a broader literature in economics that investigates the impact of culture on
economic behavior and outcomes. For example, Fernandez and Fogli (2006) investigate the link between culture and fertility. Alesina and Giulianao (2008) study the impact of culture, as measured by the strength of family ties, on labor force participation, living arrangements and geographical mobility of second generation immigrants in the U.S. A summary on recent research on the impact of culture can be found in Guiso, Sapienza and Zingales (2006).
4
There are also implications for the criminal justice system. The assumption that
vengeance is an integral part of human psyche, and vengeful behavior is common and natural,
along with the presumed deterrent effect of vengeful behavior give rise to the discussions of the
role of vengeance in criminal justice system, and the extent to which vengeance should be an
explicit part of the landscape of criminal law. For example, Whitman (2004) argues that
individuals who have committed violent acts of vengeance are compelled to justify these acts in
the language of self-defense or extreme emotional disturbance. He further states that “There is
thus a kind of mismatch between our criminal law doctrine and the human motivations that give
rise to violent crime.” If vengeance is indeed hardwired into the human psychology, and if it is
conceptually inseparable from justice itself as argued by Hegelian philosophy, then there may be
reason to discuss the room for vengeance in an optimal punishment regime. (For a detailed
discussion of this issue, see Whitman 2004).2
In a different framework, Glaeser and Sacerdote (2003) provide compelling evidence for
the existence of vengeance in criminal punishment. They find that victim characteristics affect
sentence lengths in vehicular homicide, which is a crime where the victim is random. This
suggests that sentence lengths are determined, in part, by a taste for vengeance, which implies a
need for a theory that incorporates the taste for vengeance.
2 The United States penal system is based on retributive justice, where punishment is based on the assumption of “just deserts” (Wasserstrom 1978). An individual may be punished only if he/she has committed the crime voluntarily; and the blameworthiness determines the level of punishment. In the tradition of Bentham (1823) and Becker (1968), punishment has also a role of deterrence, but the extent of punishment should not be determined by emotion or vengeance. The desire for vengeance is not considered as legitimate in criminal law (Whitman, 2004); and it is argued that criminal law defenses reflect the need for a liberal polity to control vengeance (Nourse 2003). Any indication of vengeance-tainted punishment raises trepidations for legal scholars. For example, concerns have been raised that the 1991 Supreme Court decision in Payne v. Tennessee to allow victim impact statements during the penalty phase of a murder trial would introduce inappropriate emotion and vengeance to the sentencing hearing (Hoffman 2003, Bandes 1996, Long 1995).
5
Section II describes the data. Section III presents information on the vengeful feelings at
the country level. Section IV describes the analyses conducted at the individual level and
Section V presents the results of these analyses. Section VI investigates the determinants of
vengeance. A discussion of the results and their implications are provided in Section VII, and
Section VIII offers a conclusion.
II. Data and the Measurement of the Desire to inflict Punishment
The data are obtained from the International Crime Victim Survey compiled by the
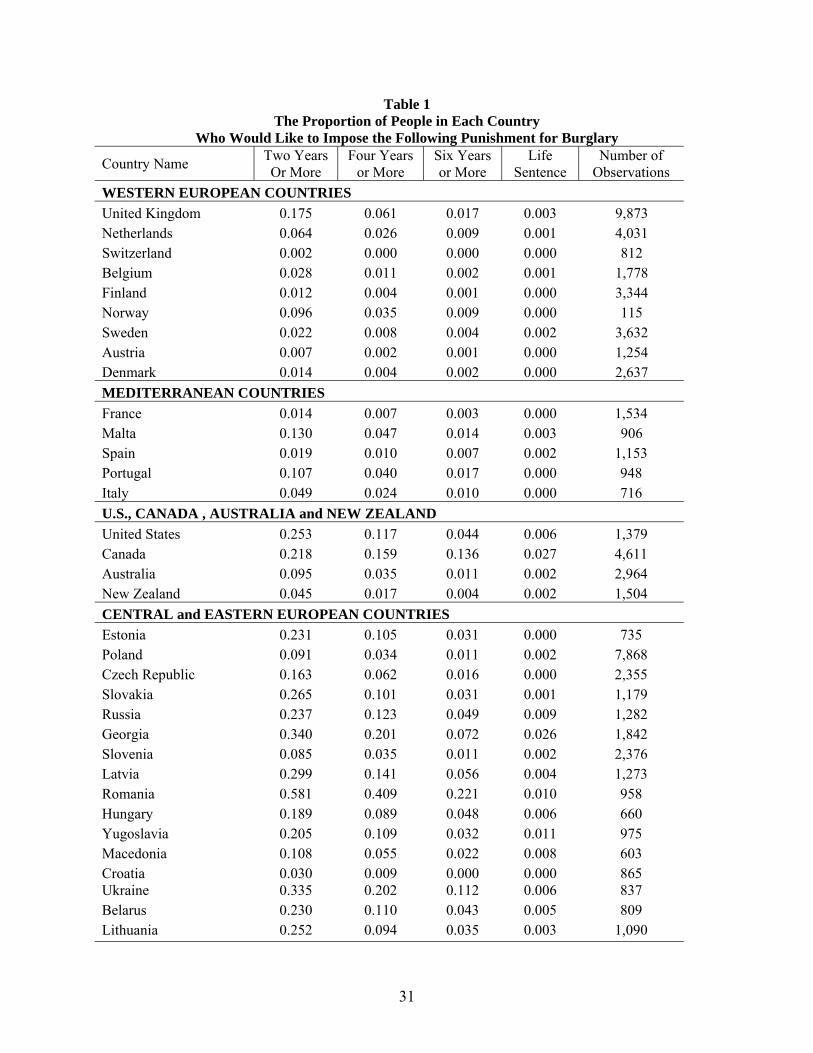
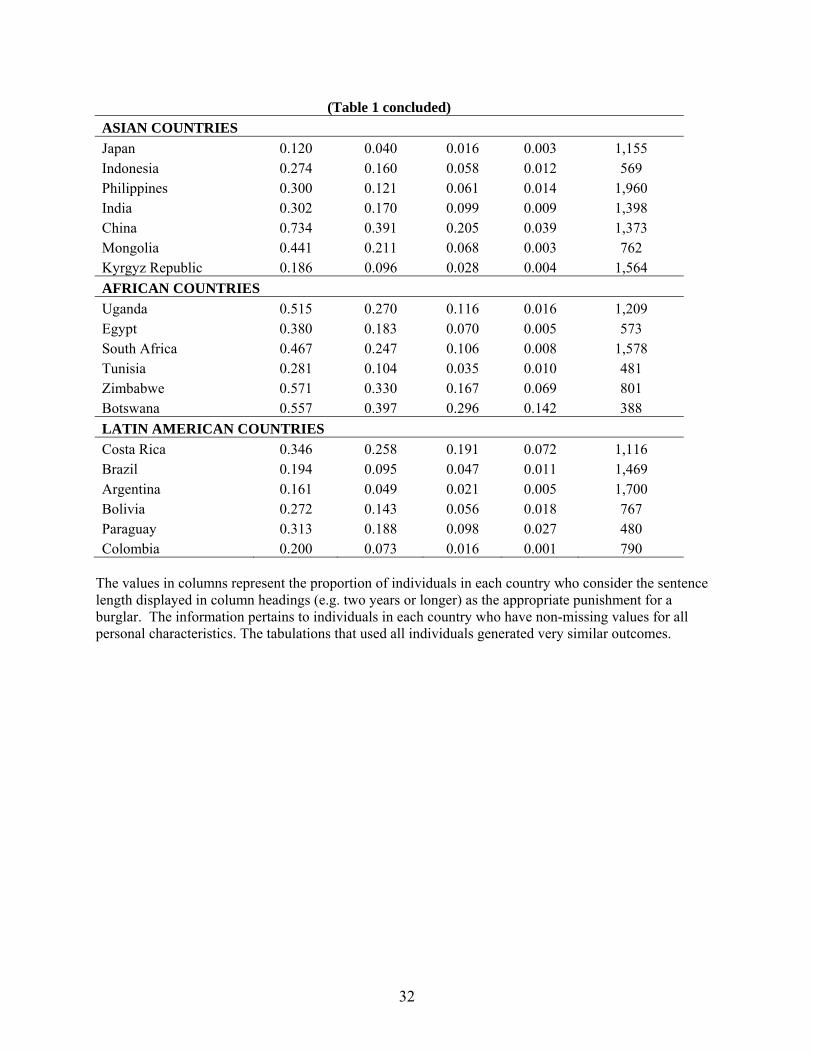
United Nations Inter-regional Crime and Justice Research Institute. Table 1 presents the list of
countries included in the analysis. The countries were surveyed either in 1989, 2000, or
between 1992 and 1996. Some countries were surveyed in more than one year. The key variable
for this paper is based on the answer to the following two questions: “People have different ideas
about the sentences which should be given to offenders. Take for instance the case of a man of
20 years old who is found guilty of burglary for the second time. This time, he has stolen a
colour TV. Which of the following sentences do you consider the most appropriate for such a
case?” The alternatives given are: fine, prison, community service, suspended sentence, any
other sentence (to specify), and don’t know. For those respondents who declared that a prison
sentence is appropriate, the following question is asked: “For how long do you think he should
go to prison?” Fifteen alternatives are given to this question, which are: one month or less, 2-6
months, 6 months-1 year, 1 year, 2 years, 3 years, 4 years, 5 years, 6-10 years, 11-15 years, 16-
19 years, 20-24 years, more than 24 years, life sentence, and don’t know.
Table 1 displays the percentage of individuals in each country who declared the
appropriateness (according to them) of various sentence lengths. The first column displays the
proportion of individuals in each country who indicated that a prison sentence of two years or
6
longer would be appropriate punishment for a burglar who is convicted for stealing a color TV
as his second offense. The second column displays the proportion of respondents who would
like to impose a sentence of 4 or more years; and the third column reports the proportion who
suggests a prison sentence of at least 6 years. These percentages include every respondent
regardless of whether they were a victim of a crime themselves. As expected, the proportion of
individuals who prefer longer prison terms declines in each country. The last column exhibits
the proportion of the respondents who would like to administer a life sentence for burglary.
Although a very negligible fraction of the respondents suggested a life sentence for burglary in
most countries, a sizable portion of individuals chose this option in some countries. For
example, 14 percent of the respondents in Botswana, and 7 percent in both Costa Rica and
Zimbabwe declared that a life sentence would be appropriate. The rate is about 4 percent in
China.
A comparison of countries for a given desired sentence length reveals substantial
differences. For example, in China, Romania and Botswana 39-to-40 percent of the people
prefer a prison sentence of 4 or more years. The rate is 25 percent in South Africa, 18-to-20
percent in Egypt, Ukraine, Paraguay and Georgia, 16 percent in Canada and Indonesia, 12
percent in the U.S. and Philippines, about 4 percent in Norway and Slovenia, and 1 percent in
Belgium and Spain.
III. Vengeful Feelings at the Country Level
The information displayed in Table 1 is not a reflection of vengeful feelings. It merely
pertains to the level of the desired stiffness of punishment. There are at least three reasons why
the preference for harsh punishment might differ across countries. First, the question pertains to
stealing a color TV. This action carries different monetary values in different countries. A color
7
TV constitutes a larger fraction of personal income in a developing country than a developed
one. Thus, the desired penalty for the theft of a color TV is expected to differ between countries.
Second, criminal penalties and the culture of illegality differ between countries. Imagine two
otherwise similar countries. If the first country has developed a more strict penal code with
harsher penalties than the second country, the citizens of the first country may be expected to
propose more strict penalties for burglary in comparison to those of the second country.5 Third,
the desired punishment level of each person may, in part, be determined by the level of
prevailing criminal activity. Put differently, an individual’s response to the desired punishment
for burglary may contain his/her reactions to the extent of the crime rate in the region of country
that he/she resides.
Because of these reasons, I will analyze the data by focusing on the variation of the
responses to the revealed desired punishment within a country. As will be demonstrated in the
next section, personal characteristics (such as age, education etc.) are similar between those who
were victimized and who were not. Further, I will address the issue of potential differences
between the individuals who were victimized and who were not victimized in the next section
when I analyze the individual-level data. However, as a first approximation, the strength of
vengeful feelings at the country level can be measured as the difference between the proportion
of individuals who would like to assign a particular prison sentence for a burglar given that they
themselves were victims of burglary, and the proportion of individuals who were not victimized
but who would like to see the same sentence handed out to a burglar. For example, in Brazil 8
percent of the individuals, who were not victims of burglary, consider a prison term of at least 4
years as the appropriate punishment for a burglar who stole a color TV as a second offense. On
5 On the other hand, it should be noted that if a country has a very harsh penalty for burglary (e.g. losing a limb), then, suggesting a 6 year prison term for burglary in that country may be considered a lenient treatment.
8
the other hand, 14 percent of the people who were victimized by a burglar in Brazil believe that
the same punishment is appropriate. The six percentage-point difference can be attributable to
the effect of vengeful feelings due to having been victimized by a burglar.
If being burglarized does not trigger vengeful feelings towards a burglar, then the
proportion of individuals who desire a certain level of punishment should be the same among
groups of victimized and non-victimized people. Figure 1 displays, for each country, the
proportion of individuals who desire at least a 2-years prison term for a burglar who stole a color
TV as his second offense. The horizontal axis displays the rate among people who were not
victimized, and the vertical axis measures the rate among those who were victimized. The solid
line is the 45-degree line. As Figure 1 demonstrates most countries lie above the 45-degree line,
indicating that the tendency to demand a stiffer penalty is higher among those who are
victimized.6
Figures 2 and 3 display similar information. Figure 2 presents the proportion of people in
each country who believe that a sentence of at least 4 years in prison is appropriate; and Figure 3
displays the rates pertaining to desired sentence of at least 6 years. Figures 4A and 4B present
the rates of males and females who prefer a punishment of at least 4 years in prison. The gender-
specific rates pertaining to the proportion of individuals who would like a sentence of at least 2
years or at least 6 years were similar to Figures 4A and 4B. As can be seen the disparity between
the reaction of victims and non-victims is particularly significant in some countries. On the other
hand a few countries, such as Botswana and China are located under the 45-degree line.
6 For these figures I employ all people with non-missing responses to victimization and desired punishment questions even if some of their personal attributes are missing. Thus, the sample sizes are larger behind these figures, a total of more than 175,000 people in all countries. Albania, which is included in the graphs, could not be included in empirical analyses because it has only six individuals with non-missing values for all explanatory variables.
9
IV. Individual-level Analysis
I hypothesize that vengeful feelings can be measured by the discrepancy in desired
punishment between victims and non-victims. On the other hand, the discrepancy, or part of the
discrepancy, may pre-exist. Individuals who live in high crime areas (where the risk of
victimization is higher) may have higher demands for punishment. That is, these individuals
may prefer stiffer penalties for a deterrent effect to reduce their risk of victimization. Similarly,
individuals who have lower risks of victimization may prefer lesser punishments. If the risk of
victimization is highly correlated with actual victimization revealed in the data, then the
observed differences displayed in Figures 1-4 may be due to pre-existing preferences about
optimal punishment, and not necessarily because of the vengeful feelings that emerge after
victimization.
The risk of victimization can be related to personal characteristics of the person, such as
age, education and income level, labor market activity, and marital status. Although the
descriptive statistics presented in Table 3 below do not reveal differences in personal
characteristics of individuals by victimization, it is important to control for potential
confounding. Thus, I estimate individual-level regressions depicted by Equation (1) below.
(1) Pij= δ0+δ1Vij +Xij’δ2+Kj’δ3+uij,
where Pij stands for desired punishment for burglary as revealed by individual i who lives in
country j. Vij is a dichotomous variable to indicate if the individual has been a victim of burglary
in the recent past. The coefficient δ1 is expected to be positive if, all else the same, being a
victim of a burglary prompts a desire to inflict harsher punishment. X is a vector of personal
characteristics, including age, gender, marital status, gun ownership, the level of education, labor
market status of the individual and whether the individual’s family income is located in the upper

10
50 percent of the income distribution in that country. These attributes may be correlated with the
risk of victimization and the desire to impose stiffer punishment. Other variables that
potentially impact the risk of victimization are the size of the city the person resides in, and the
burglary rate in the region of the country where the individual lives.
The variables in vector K pertain to country characteristics. They allow for an
investigation of the impact of country attributes on the desire to impose punishment. In addition
to acting as control variables, these country characteristics will allow for an investigation as to
whether the extent of vengeful feeling are influenced by such country attributes. Following La
Porta et al. (1999) and Treisman (2000), I include variables that measure the structure of the
existing legal system in the country. La Porta et al. (1999) argue that the common law system
developed in England in the 17th century has been shaped by the parliament and aristocracy at
the expense of the crown and it is intended to limit the power of the sovereign. As a
consequence, British common law puts emphasis on individuals’ private and property rights, and
it intends to limit, rather than strengthen, the power of the state (David and Brierley 1978, Finer
1997, La Porta et al., 1999). In comparison, French civil law, Scandinavian civil law and
German civil law are designed as instruments of the state to expand its power; and socialist law
is a manifestation of the state’s intent to create institutions to maintain power and extract
resources without much regard for protecting economic interests (La Porta et al. 1999). To
control for the structure of the existing legal system in the country, I include variables to measure
the legal origin of the country. They are: whether the country’s legal system is based on British
common law, French civil law, Scandinavian civil law, German civil law, or Socialist legal
origin.
Religious make-up of the country may be a potentially important determinant of both
individuals’ demand for stiff penalties and the extent of the demand for retribution. Religious

11
composition is controlled for by the proportion of Catholic, proportion of Muslim and proportion
of Protestant in the country. If interrupted democracy in the country and involvement in a war
in recent history are correlated with social disorder, they may impact people’s exposure to
violence and as a result, the extent of their willingness to punish. I employ the same measure of
war/armed conflict as used by Miguel et al. (2008), obtained from the PRIO/Uppsala Armed
Conflict data set.
Per-capita income in the country is another country attribute included in the analyses. A
large government may create more occasions for individuals to interact with government
workers, increasing the exposure to corruption, potentially influencing their desire to punish. On
the other hand a large government may be correlated with a more developed welfare system that
may mitigate strong feelings to punish. To control for this effect, I add a variable which is the
share of government in per-capita gross domestic product. The average level of education in the
country, which is an aggregate measure of the human capital, the size of the population of the
country, the percentage of young people in the population and the proportion of seats held by
women in the parliament are additional variables that are added to control for country attributes.
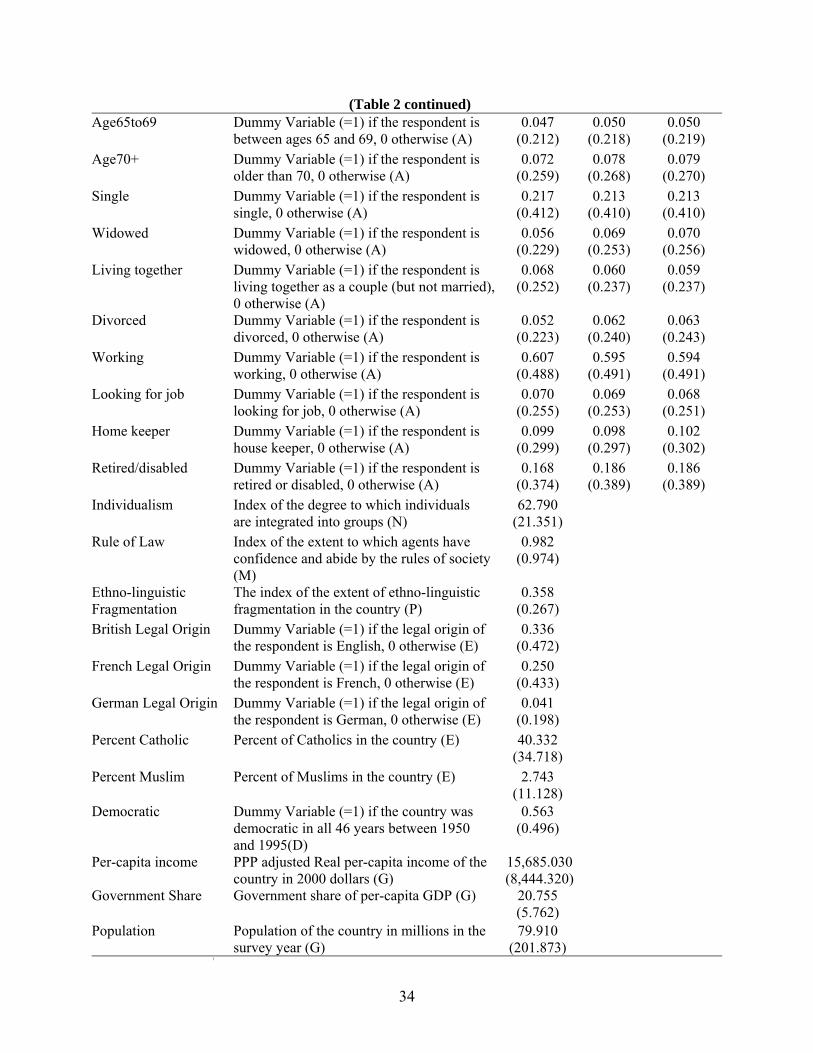
Ethno-linguistic fragmentation of the country, the extent of individualistic culture
prevailing in the country, and prevalence of the rule-of-law in the country are additional control
variables to capture some cultural dimensions of the countries. The Rule-of-Law index is
obtained from the World Bank.7 It measures “the extent of which agents have confidence in and
abide by the rules of society, and in particular the quality of contract enforcement, the police, and
the courts, as well as the likelihood of crime and violence.” Kaufmann, Kraay and Mastruzzi
(2007). The range of the index is from -2.5 indicating the weakest rule-of-law environment, to
2.5 representing the strongest. In our sample, the lowest score of rule-of-law is -1.71 and it 7 (http://info.worldbank.org/ governance/wgi2007/ mc_countries.asp.)
12
belongs to Zimbabwe. Kyrgyzstan and Belarus have second and third lowest scores of -1.18 and
-1.16. Norway and Denmark have the highest scores of the rule-of-law, with 2.02 and 2.03
respectively. Slovakia is at the sample median with 0.43.
Another measure of cultural differences is the index of individualism as employed
Hermann, Thőni and Gächter (2008). The index is developed by Hofstede (2001) and Hofstede
(2005).8 Lower values indicate the extent of collectivism of the society, which stands for the
extent to which individuals are integrated into groups. Higher values of the index represent
individualistic societies where the ties between individuals are loose, and where people are
expected to look after themselves and their immediate family. In collectivist societies, people
from birth onwards are integrated into strong, cohesive in-groups, often extended families (with
uncles, aunts and grandparents) which continue protecting them in exchange for unquestioning
loyalty.9 In our sample, the United States is the most individualistic country with a score of 91,
followed by Australia with a score of 90 and the U.K. with 89. The most collectivist societies
in the data are Colombia with a score of 13, Indonesia with a score of 14 and Costa Rica with a
score of 15. Slovakia Czech Republic and Austria are around the median score of 57.
The ethno-linguistic fragmentation index measures the probability that two randomly
selected people in a given country in 1985 will not belong to the same ethno-linguistics group.
This index, which is obtained from (Roeder 2001), has been used in research in both economics
and political science (Smith 2004, Easterly and Levine 1997). In the data, the most ethno-
linguistically homogenous country is Portugal with the value of the index being 0.007, followed
by Hungary with 0.01. The two most heterogeneous countries are Uganda and South Africa with
8 The data are downloaded from http://www.geert-hofstede.com/hofstede_dimensions.php. 9 The description is obtained from (http://www.geert-hofstede.com/geert_hofstede_ resources.shtml).
13
score of 0.922 and 0.886, respectively. Belarus is at the mean with score of 0.374, and the U.S.
has a score of 0.575.
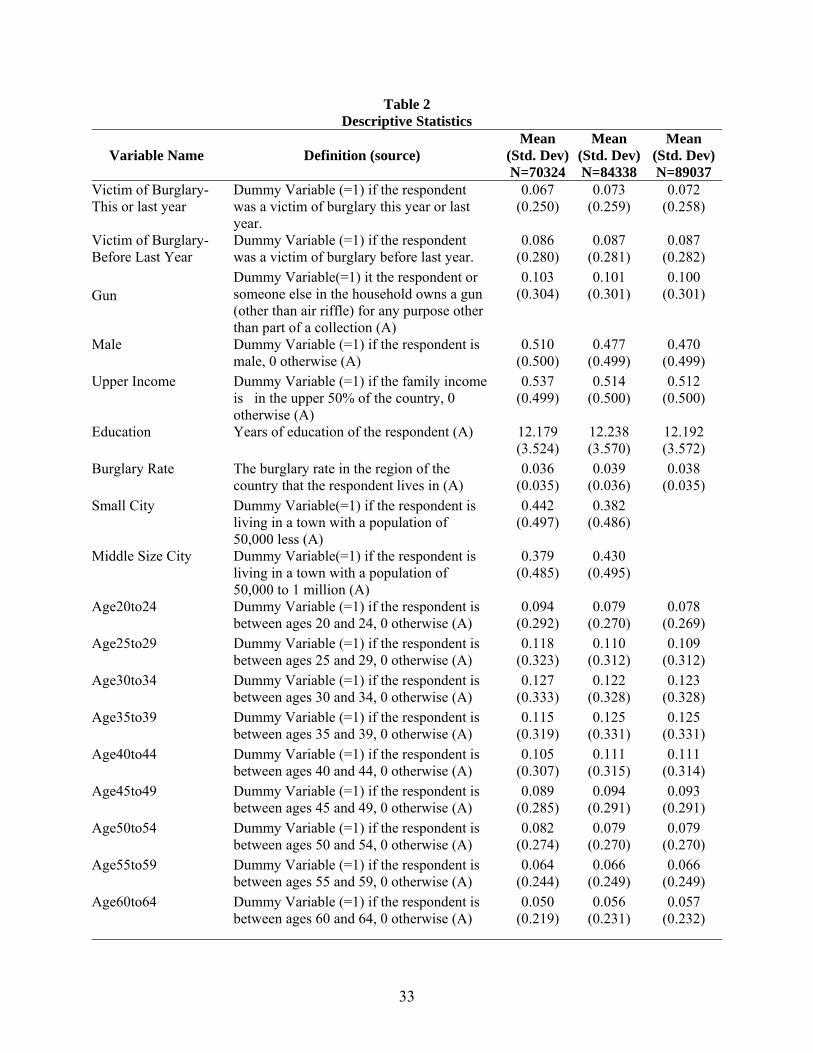
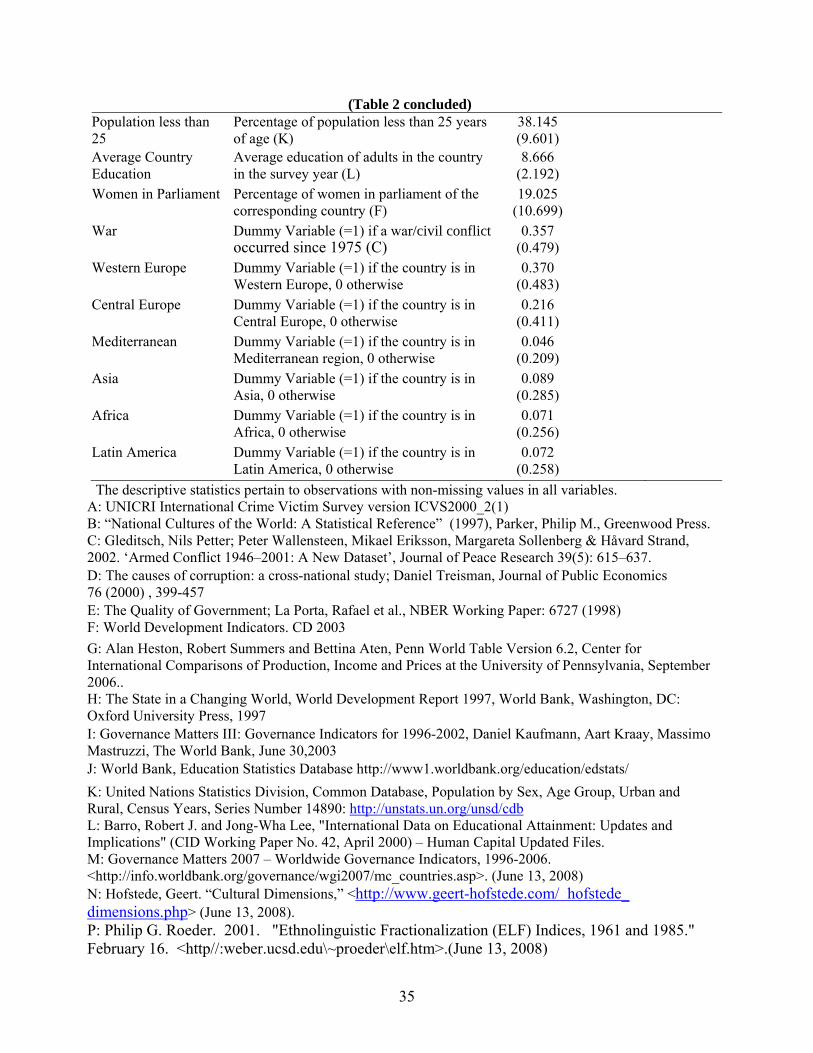
Table 2 displays the definitions and the descriptive statistics of the variables employed in
empirical analyses. The first column of numbers provides the descriptive statistics of the
observations with non-missing personal and country characteristics. The second column displays
the descriptive statistics of the sample which with non-missing personal characteristics. The
third column provides the same information with the omission of the two variables that gauge the
size of the city. Exclusion of these city size variables from the regressions did not alter either the
magnitude or the statistical significance of the other coefficients, but allowed an increase in the
sample size.
To provide a sense of the difference between people who were and who were not
victimized, Table 3 presents the descriptive statistics of the personal characteristics by
victimization. The average personal characteristics, including gun ownership, income and
education, of those who were victimized this year or last year and who were not victimized
during the same time period are similar. The same is true for victimization before last year,
indicating that there are no obvious and systematic differences in observable characteristics
between those were victimized and those who were not. In fact, the burglary rate in the locality
of those where were victimized are lower than the burglary rate in the locality of people who
were not victimized.
V. Results
Table 4 displays the results of the ordered probit models, where the dependent variable
consists of 6 categories, measuring the severity of desired punishment. These are: 1) if the
person declared that the appropriate punishment is something other than a prison sentence (such
14
as fine, community service, suspended sentence); 2) if the person declared that the appropriate
punishment is a prison sentence of 1-to-6 months; 3) the appropriate punishment is declared as 6
months-to-a year prison term; 4) 2-to-3 years in prison; 5) 4-to-5 years in prison; 5) 6 years-to-
life in prison. The proportions of responses in each category are: 62 %, 10%, 12%, 8%, 4% and
4%, respectively.
Three specifications are displayed in Table 4. All specifications include time dummies to
control for the year in which the survey was registered in that country and the standard errors are
adjusted for clustering at the country-level. The first column reports the results obtained from
the entire sample with non-missing personal and country attributes. Because the variables which
measure the size of the city the person lives in were never significant and because in a few
countries this information was not collected, and because dropping these variables did not alter
the remaining coefficients, I dropped these two variables and re-estimated the model. The results
that are reported in column II are almost identical to the ones displayed in column I. Finally,
results of column III are based on the specification that includes country fixed effects, instead of
the country characteristics. Again, the magnitudes and the statistical significance of the
estimated coefficients do not change.
The existence of vengeful feelings is identified by comparing the reactions of individuals
who have identical observable personal characteristics but who differ in their victimization
experience. The first two coefficient reported at the top of Table 4 demonstrate evidence of
vengeful behavior. Specifically, individuals who were victims of burglary this year or last year,
prefer stiffer penalties for burglars in comparison to those who were not victimized. In addition,
being a victim of burglary two years ago or earlier has an additional positive effect on the desire
to impose stiffer penalties.

15
Other coefficients listed in Table 4 demonstrate the impact of a particular personal or
country attribute on the level of desired punishment. For example, if the individual or anyone
else in that household owns a gun, the intensity of the desire for stiffer punishment is stronger,
suggesting that characteristics of the individuals that make them more likely to own a gun induce
them to impose harsher penalties. An increase in the burglary rate in the region that the
individual lives in has also a positive impact on the intensity of the desire to impose harsher
punishment. Males prefer stronger punishment in comparison to females, and older individuals
are more lenient in comparison to younger individuals. Singles and widows are also more
lenient. On the other hand, working people, and retired or disabled individuals are harsher
regarding the desired level of punishment. The legal origin of the country has an impact on the
desired level of punishment as do other country attributes such as rule-of-law, individualism,
women in the parliament and uninterrupted democracy. The proportion of women in the
parliament is negatively associated with the intensity of the desire to impose harsh punishment.
Although the rule of law in the country and the extent of individualism in the country are highly
positively correlated, these variables have different impacts on the desired stiffness of
punishment. While the extent of individualism in the country has a negative impact on the
desired level of punishment, a higher value for the rule-of-law is positively associated with
stiffer desired punishment.
As described in the introduction, Glaeser and Sacerdote (2003) find that victim
characteristics affect sentence lengths in vehicular homicide. To justify this result, an argument
can be made that juries and judges implicitly calculate the social welfare loss associated with
each victim’s death, and they assign differential values for each victim type, which is then
translated to the severity of the sentence. In our case, however, such a justification is not valid.
This is because the individuals who are analyzed here were asked to provide information about a
16
hypothetical 20 year old male burglar. This does not imply that the respondent in our data set
would not be more or less vengeful against females, older criminals, or towards certain race or
ethnicity classes, but the results in Table 4 demonstrate that there is an overall vengeful attitude,
which stems from the person’s own past victimization experience.
Note that the results of Table 4 indicate that vengeful feelings dissipate slowly over time.
Individuals who were victims of burglary this year or last year would like to impose stiffer
penalties on a burglar. If victimization took place before last year, this event still has an impact
on the demand for retribution, but the magnitude of the impact is smaller. This suggests that
people forgive and forget slowly. This finding is reinforced below when I estimate probit
equations for the probability of asking for various sentence lengths.
Are Vengeful Feelings Event-Specific?
The results of Table 4 indicate that people who were victims of burglary demand stiffer
penalties for a burglar in comparison to those individuals who were not victimized. An
interesting question is whether or not other types of victimization trigger vengeful feelings
towards burglars as well. In other words, do people who were victims of other crimes, such as
theft or robbery, demand stiffer punishments for a burglar? To investigate this question, I re-
estimated the models displayed in Table 4 by including an indicator variable to represents if the
person was a victim of robbery this year or last year. I also ran the models with the following
indicator variables: if the person was a victim of personal theft, victim of bicycle theft, or if
he/she was physically assaulted.
Table 5 displays the results. In each of the four specifications reported, an additional
victimization indicator is included (in addition to being a victim of burglary). For example, the
model in column 1 includes an additional dichotomous indicator to measure if the individual was
17
a victim of robbery this year or last year. Columns 2, 3 and 4 report the models which include
indicator variables of whether the person suffered from personal theft this or last year, had a
bicycle stolen this or last year, or was assaulted this or last year, respectively. As can be seen,
having been a victim of robbery, theft, or bicycle theft in the past has no additional impact on
vengeful feelings towards a burglar; but being a victim of an assault increases the extent of
vengeful feelings (column 4). Dropping the burglary victimization variables but keeping the
variable to indicate victimization for other crimes did not alter at all the remaining coefficients;
and estimating the models with country fixed-effects provided the same results as in Table 5.
The results of Table 5 indicate that vengeful feelings are specific. They are targeted to
the person who is believed to have generated the harm in the first place. People who were
victimized by burglary have vengeful feelings about burglars; but having been victims of
robbery, theft or bicycle theft does not evoke vengeful feelings about burglars. This suggests that
the identified vengeance effect is not likely to be driven by a general attitude about crime, or by a
demand for protection that would be correlated with all types of victimization. The exception is
physical assault. Having been physically assaulted increases people’s desire to impose heavier
punishment for burglary, indicating that physical victimization triggers stronger feelings than
being victims of other crimes. This may suggest that having been targeted for violence may
augment retaliatory feelings.
VI. What Determines Vengeance?
The identification of the extent of vengeful feelings is obtained from the responses of
individuals who differ in their victimization experience. As shown in the previous section,
controlling for personal characteristics and a host of country attributes (or country fixed effects),
having been a victim of burglary increases one’s desire to impose harsher punishment on a
18
hypothetical burglar. In this section I investigate the extent to which these vengeful feelings are
influenced by personal characteristics of the individuals or the attributes of the countries they
live in. For example, I will ask question such as: are males more vengeful than females? Are
more educated people in a country more vengeful than less educated people in the same country?
Are people who live in high-crime areas in a country more vengeful than people in the same
country who live in low-crime areas? Are people who live in poorer countries more vengeful
than people who live in richer countries? What are the impacts on the strength of vengeful
feelings of the rule-of-law, the level of individualism, having experienced a war in recent history,
or having an uninterrupted democracy in the country?
To identify the impact of personal and country characteristics on vengeful feelings, I
estimate a sequence of probit regressions, where the world population in the data set is divided
into two groups for each regression. For example, I classify people by their gender. I run
separate probit regressions for males and females to investigate if being a victim of burglary has
an impact on the probability of a) imposing any prison sentence on a burglar, b) imposing a
sentence of at least 2 years, c) imposing a sentence of at least 4 years.
The Impact of Personal Attributes
Table 6A reports the marginal effects obtained from running these probit regressions for
males and females in the sample. Each regression contains the complete set of explanatory
variables used in column II of Table 4. I also report the marginal effects obtained from the
models that control for country fixed-effects instead of country characteristics. They are reported
in [brackets]. The top panel of Table 6A shows that in the sample of 35,443 men from 53
countries, controlling for all personal and country characteristics, if a man was a victim of
burglary this year or last year, his propensity to impose a prison sentence (as opposed to no
19
sentence, a fine, or community service) is 2 percentage points higher in comparison to a man
who was not victimized. Table 6A also reports that in the model with country fixed-effects,
where the sample size is [41,832], victimization of men increases the probability of suggesting a
prison sentence by 2.4 percentage points. The top panel of table 6A also reports that the mean
of the dependent variable is 0.413 for men, indicating that 41.3% of the men in the world want to
impose a prison sentence for burglary.
The right-hand panel of Table 6A displays the same information for females. Using
39,345 females from 53 countries, I find that having been burglarized increases females’
propensity to impose a prison sentence for a hypothetical burglar by 3.7 percentage points.
Thus, according to top panel of Table 6A females are more vengeful than males, because having
been burglarized this year or last year increases females’ propensity to impose a prison sentence
more than that of males (3.7 percentage point vs. 2.0 percentage point in models with country
characteristics and 3.3 percentage points vs. 2.4 percentage points in models with country fixed
effects). Furthermore, the baseline demand for punishment is lower for females: 36.8 percent of
females versus 41.3 percent of males demand a prison term, implying that the effects are
relatively stronger for females.
Another way to put these numbers into perspective is to consider the following
simulation. At the bottom line of the top panel of Table 6A, the descriptive statistics reveal that
36.8 % of all females would like to impose a prison term punishment for burglary. If all females
in the world were switched from being non-victimized to victimized, this would increase the
demand for a prison term by females by 10% (0.037/0.368). If all males in the world were
switched from being non-victimized to victimized, this would increase males’ demand for a
prison term by 4.8% (0.020/0.413).
20
The top panel of Table 6A indicates that having been victimized before last year has no
statistically significant vengeful effects for either gender if the desired punishment pertains to
any prison term. The middle panel of the table, however, shows that having been victimized this
or last year and having been victimized before last year both have impacts on vengeful feelings if
the punishment for burglary involves at least a two-year prison term. However, as discussed
earlier, the marginal effects of having been victimized before last year are smaller, suggesting
that victimization in more distant past triggers vengeful feelings that are weaker. In the middle
panel the marginal effects are almost identical between males and females, and the baseline
desired punishment rates also similar (0.180 and 0.156). The bottom panel of Table 6A presents
the same information based on the desire to impose a prison term of at least 4 years.
Culture vs. Individual Characteristics
The results displayed in Table 6A are summarized in the first two rows of Table 7.
Specifically, Table 7 presents the calculations based on the coefficients reported in Table 6 to
address the issue of relative vengefulness of various groups, such as males-females, people in
high income countries vs. people in low income countries, people who live in areas of their
countries with above-median burglary rate vs. people who live in below-median burglary rate
areas. For example, the first two rows of Table 7 display the difference in vengeful feelings
between males and females. Based on the marginal effects reported in Table 6A and the existing
rates of desired punishment in these groups, also reported in Table 6A, if males were switched
from being non-victims to being victims of burglary, this would increase their existing desire to
impose a sentence of 4-plus years by 23 percent [and 19 percent in case of the model with
country fixed effects]. If all females were victimized, this would increase females’ desire to
inflict a 4-plus years of punishment by 26 percent [or 23% in the model with fixed effects]. Note
that in column III of Table 7 the rate of increase in the desire to punish is zero for men (row A1),
21
because the estimated marginal effect is not significantly different from zero in this case (the
bottom panel of table 6A for males). However, the impact is 16% in the model with country
fixed-effects. Looking across the rows A1 and A2 of Table 7, we see that in all cases
victimization increases the desire to inflict punishment more strongly for women than men; that
is, women seem to be more vengeful than men.
Table 4 demonstrates that the coefficient of male is positive and significant in the models
that explain the propensity to impose stiffer penalties, while the results displayed in Table 6A
and summarized in Table 7 suggest that females are more vengeful than males. These results are
not inconsistent, because the first groups of results indicate the desired level of harshness of the
penalty, while the second is about vengeance. Put differently, while men demand stiffer
penalties, women react more strongly than men in response to being victimized.
Table 6B reports the results of the investigation of the impact of personal education on
vengeful feelings. Each person in the data set is classified as having above-median education or
below-median education in comparison to the median education level of their own country. As
shown in the top panel of Table 6B, the mean of the dependent variable for highly-educated
people is 0.362 for a jail or prison term. This means that 36.2 percent of people who are
relatively more educated (in comparison to their country’s median education) would like impose
a prison term on a burglar. Victimization among this group increases this propensity by 2.1
percentage points. Among people who are less educated (those who have less education than
their country median) the proportion who wants to impose a prison sentence is 0.413, and
victimization among less-educated people increases their propensity to impose a prison term by
3.4 percentage points. As before, these results are summarized in Table 7. Victimization has a
similar impact on the propensity to impose a prison sentence between people who have above-
median education and below-median education in their own country. If all relatively more
22
educated people were victimized, this would increase the proportion who wants to impose a
prison sentence of 2 year or more by 30% in this group. On the other hand, if all relatively less-
educated people were victimized, this would increase the rate of those who wants to impose a
minimum 2 years of prison term by 11 percent among less-educated group, suggesting that more
educated people are more vengeful. The third column of Table 7 shows that the reverse is true if
we analyze the propensity to impose a sentence of at least 4 years. Thus, looking across rows
B1 and B2 of Table 7, it is hard to make a statement about relative vengefulness of more
educated people in comparison to less educated ones.
Rows C-F of Table 7, on the other hand, depict a clearer picture as to the impact of
personal attributes on vengeful feelings. Specifically, burglarization of working people around
the world prompts stronger reactions about their desired punishment to be imposed on a burglar
in comparison to burglarization of nonworking people (rows E1 and E2). The same is true for
people who live in above-median burglary areas of their countries in comparison to those who
live in low burglary areas (rows F1 and F2), and people who are older than 40 years of age (C1
and C2). Similarly, people who are at the bottom 50% of their country’s income distribution are
more vengeful than those who are in the top 50% (rows D1 and D2). Summary tables pertaining
to these results are presented in Tables 6C to 6F in the Appendix.
Rows G-M of table 7 display the impacts pertaining to the classification of people by
their country characteristics. Some of these characteristics pertain to economic development
such as per-capita income; some others can be claimed to be correlated with “cultural” aspects of
these societies such as the extent of individualism or ethno-linguistic fragmentation in the
country. The corresponding regression results are summarized in tables 6G-6M in the Appendix.
Section G divides people into two groups: Those who live in countries where the average
education in the country is above the world median in the sample of 53 countries, (which is 8
23
years); and those people who live in countries where the average country education is below the
world mean. Rows G1 and G2 demonstrate that people who live in countries with low education
are more vengeful than those who live in more educated countries. Other country differences
also influence vengeful feelings. For example, people who live in countries that are more
fragmented ethno-linguistically are more vengeful than people who live in more homogeneous
countries. Similarly, people who live in more collective (less individualistic) societies, and those
who live in countries that experienced a war or armed conflict in recent history, are more
vengeful. People who live in countries where per-capita income is less than $8,000, which is the
world median in the sample, are more vengeful than people who live in richer countries.
Although some of these country characteristics are reasonably highly correlated with per-
capita income in the country, this is not the case for all country attributes. For example, there are
six countries in the sample that experienced a war or armed conflict since 1975 although their
average per-capita income is greater than $8,000. These countries are United Kingdom, Spain,
United States, Russia, Slovenia and Argentina. There are also 16 countries with less than
$8,000 per-capita income but have not involved in a war or armed conflict since 1975 (Poland,
Latvia, Macedonia, Ukraine, Belarus, Bulgaria, Lithuania, Mongolia, Kyrgyzstan, Egypt,
Botswana, Costa Rica, Brazil and Bolivia). Similarly, there is no strong correlation between
ethno-linguistic fragmentation and per-capita income in the country.
Table 7 demonstrates that both personal characteristics and country characteristics are
important in determining the extent of vengeful feelings. This suggests that country attributes
alone are not reliable predictors in identifying vengeful behavior. For example, although low
levels of per-capita income in a country, ethno-linguistics fragmentation or having experienced a
war are positively related to vengeful feelings, personal characteristics of the individuals such as
24
age, the crime rate in the locality of the individual, and the ranking of the individual’s family
income in his/her country’s income distribution are also important.
To make the point visible, I classified the people in the world into two categories: those
who live in countries with low per-capita income (<$8,000) and with high ethno-linguistic
fragmentation (above the world mean), but whose incomes rank in the top 50% of their own
country’s income distribution. The second category consists of people who live in richer
countries, that also have low ethno-linguistic fragmentation. But people in this group have
incomes that are in the bottom 50% of the income distribution of their country. Estimating
probit regressions as the ones reported in Tables 6 revealed that there is no meaningful difference
in terms of the strength of vengeful feelings between these two groups of people. In all cases,
having been victimized sparks vengeful feelings. However, the strength of these feelings is not
different between these two groups. The results are summarized in rows N1 and N2 of Table 7.
In the group of (relatively) rich people who live in low-per-capita GDP and highly fragmented
societies, switching them group from being non-victims to victims of burglary increases their
demand for a prison term for a burglar by 9 percent (shown in the first column). Row N2
displays that the same switch among relatively poor people who live in richer and more
homogeneous countries increases the demand for a prison term by 6 percent. Looking across
rows N1 and N2 reveals that there is no substantial difference in the strength of the reaction to
victimization between these groups; i.e. their vengeful feelings are similar.
Rows O1 and O2 present the results of a similar analysis conducted for the following two
groups: Poorer people (people who are in the bottom of the 50% of their countries income
distribution), who are older (greater than 40 years of age), who live in high-burglary areas of
their own countries, and who live in countries with no war or armed conflict experience since
1975. As rows C, D and F of Table 7 display, these personal attributes are positively correlated
25
with vengeful feelings. On the other hand, having experienced no war in the country in recent
history is associated with less vengeful feelings (row H). The second group of people possesses
the opposite attributes. They live in a country that experienced a war or armed conflict since
1975, but they are younger than 40, located in the upper 50% of their country’s income
distribution and live in low-burglary areas. The comparison between these two groups reveals
that the strength of their vengeful feelings is comparable (rows O1 and O2).
The upshot of these results is the following. Although a number of personal and country
attributes have significant impacts on vengeful feelings, a more complete picture of vengeful
behavior involves a combination of these attributes. As shown in Table 7, some of these factors
can counter-balance each other (such as being a rich person in a poor country) and it may be
misleading to attribute vengeful feelings to a particular characteristic.
Excess Vengeance
The results presented so far demonstrate that there is evidence for vengeful feelings. All
else the same, people who were victimized by burglary demand stiffer penalties for a burglar in
comparison to those who were not victimized; and the strength of these vengeful feelings
depends on a number of personal and country characteristics. In this sub-section I ask the
following question. Among the group of people who were victimized, does the strength of
vengeful feelings depend on repeated victimization? To address this issue, I analyze the sample
of people who were victimized this year or last year, or who were victimized before last year.
An indicator variable is created that differentiates between two groups of people: 1) People who
were victimized both during this year or last year and before last year. 2) People who were
victimized in either during this year or last year or before last year, but not both.
26
In this sample which consists of victimized people, any residual unobservable that may
be correlated with victimization should be similar between individuals. Using this sample I
investigate if having been victimized more heavily (repeatedly) makes people more vengeful in
comparison to those who have less severe victimization experience. Estimating probit
regressions to analyze the impact of heavy victimization defined this way on the probability of
demanding i) any prison sentence ii) a prison sentence of at least 2 years and iii) a sentence of
at least 4 years revealed that the coefficient of heavy victimization was positive in all cases but
significant only in the range of 0.15-0.4 level. However, estimation of the same models in sub-
samples of the world population, displayed in Table 8, revealed very interesting patterns.
Table 8 shows that there is no difference in the severity of the vengeful feelings between
those who were victimized less heavily and those who are victimized more heavily if these
victims live in countries where the average country education is above the world median (row
A1), if there was no war or military conflict in the country since 1975 (row B1), if the rule-of-
law rating of the country is high (row C1), if the country’s per-capita income is higher than
$8,000 (row D1), if the country is individualistic (row E1), if the country is homogeneous ethno-
linguistically (row F1), or has enjoyed uninterrupted democracy (row G1).
On the other hand, people who are victimized more heavily are more vengeful in
comparison to those who are victimized less heavily if the country they live in has poor
education (row A2), has experienced a war (row B2), suffers from low rule-of-law (row C2), if
the country is poor (row D2), if the country is collectivist (row E2), ethno-linguistically
fragmented (row F2), or if the democratic structure has been interrupted (row G2).
In other words, additional victimization triggers additional vengeance only in countries
that suffer from low income, low education, no adherence to the rule-of-law and similar
attributes listed in Table 8. This finding is interesting because it suggests that a feeling such as
27
vengeance, which usually is thought of as primal, is subdued as the country develops
economically and becomes more stable politically and socially.
VII . Discussion
These results reinforce the idea that some puzzles about individual choice can best be
explained by considering the interplay of personal and cultural factors. For example, it is well-
known that the proportion of rejected offers in ultimatum games differs substantially between
experiments conducted in different countries (Oosterbeek, Sloof and Van de Kuilen 2004,
Heinrich et al. 2001, Fehr and Gaehter 2000). 10 Although the average offers made by the first
player in an ultimatum game is around 40% of the endowment in experiments conducted around
the world, the rejection rates differ substantially between countries, ranging from no rejected
offers to one-third of the offers being rejected (Oosterbeek, Sloof and Van de Kulien 2004).
Similarly, there is significant variation in the rates antisocial punishment in experiments
conducted in various countries (Herrmann, Thoni and Gaehter, 2008). Although researchers
recognize the complicated nature of behavioral responses in these environments, “culture” turns
out to be a primary suspect as a determinant of behavior around the notions of fairness,
individualism vs. collectivism, and retaliation. The results of this paper suggest that the variation
in these behaviors can be best explained by taking into account both the personal and the cultural
factors as well as the interplay between them.
On the other hand, country attributes are very important in explaining the extent of
vengeful feelings. Furthermore, the finding that repeated victimization makes people more
10 In an ultimatum game one player is given a certain amount of money (or tokens than can be used for money or other items at the end of the experiment). The first player then proposes a division of this money between him/herself and the second player. If the second payer accepts the offer the game ends, and the players receive the proposed amount. If the second player rejects the offer no player receives anything.
28
vengeful only if they live in countries with less desirable economic and political environments
seems to quantify a mechanism through which the observed “cycles violence” take place. People
in societies with low-income, low education, poor rule-of-law, and military conflict are more
prone to heightened vengeful feelings. Thus, violence between countries with these attributes
may have a self-feeding mechanism that is fueled by retribution, if the impact of having been
victimized by violence on vengeful feelings is as large as vengeance targeted towards a burglar,
detected in this paper.
VIII. Conclusion
Although it has been argued that revenge is an integral part of human psyche, and
vengeful behavior is common, there has been very limited research to quantify its extent. The
investigation of the existence of vengeance, its extent and its determinants may be important not
only for theoretical and practical aspects of criminal justice system, but also because it may shed
interesting light into extremely violent behavior such as suicide bombings and other terrorist
attacks.
This paper employs data on more than 89,000 individuals from 53 countries to directly
investigate the presence and the extent of vengeful feelings. Since the definition of vengeance is
“infliction of punishment in return for a wrong committed,” the extent of vengeance is measured
by the difference in the propensity to assign a particular punishment for the burglary of a color
TV between two people: one, who has been burglarized himself/herself during this year or last
year, and the other, who has not been burglarized. Empirical analyses control for potential
differences in victimization propensities and other factors that may be correlated with both the
demand for punishment and likelihood of victimization.
29
Descriptive statistics reveal that there are substantial differences between countries
regarding the extent to which people are willing to impose harsh punishment. For example,
while 1% of the population in Belgium believes that a prison term of four years to life is
appropriate for a 20 year old man who is found guilty of stealing a color TV as a second offense,
the rate is about12 percent in the U.S., 19 percent in Paraguay, 21 percent in Mongolia, and 25
percent in South Africa. These average differences between countries are interesting, but they
can be reflections of a number of country characteristics, ranging from the effectiveness of the
legal system to economic conditions and culture.
Individual-level analyses compare the reactions of observationally equivalent individuals,
who differ in terms of their victimization experience. The results show that people’s desire to
impose stiffer punishment is positively related to their own victimization experience.
Controlling for a large set of personal characteristics ranging from education, the rank of the
family income in the income distribution of the country, to the crime rate of the region of the
country, along with a host of country attributes, having been a victim of burglary increases one’s
willingness to impose harsh prison sentences on a hypothetical 20 year old burglar.
The strength of vengeful feelings are influenced by country characteristics, such as per-
capita income, the extent of individualism and rule-of-law in the country, the extent of ethno-
linguistics fragmentation in the country and the existence or a war in recent history as well as
uninterrupted democracy. Vengeful feelings towards a burglar are not influenced by having been
a victim of robbery, theft or bicycle theft, suggesting that the identified vengeance effect is not a
reflection of a general demand for law and order or the demand for protection. The findings,
which are summarized in Table 7, indicate that the magnitude of vengeful feelings is greater for
people in low-income countries, in countries with low levels of education, low level of rule-of-
law, and countries that experienced a war in recent history. Females, older people, working
30
people, people who live in high-crime areas of their country and people who are at the bottom
50% of their country’s income distribution are more vengeful. The intensity of vengeful feelings
dies off gradually over time. Furthermore, the analysis of victims reveals that repeated
victimization generates more vengeance, but this difference exists only in countries with poor
economic and political circumstances.
These results have implications on at least two fronts. First, they suggest that a complete
understanding of economic behavior should incorporate the context and the environment in
which the decision is taking place, including measures of culture. But also, they highlight the
dangers of attributing too much of the impact to “culture” as the economic conditions pertaining
to the individual (independent of culture) are important determinants of behavior. For example,
as summarized in Table 7, poor people who live in higher-income societies that are ethno-
linguistically homogeneous are as vengeful as rich people who live in low-income societies that
are ethno-linguistically fragmented.
31
Table 1 The Proportion of People in Each Country
Who Would Like to Impose the Following Punishment for Burglary
Country Name Two YearsOr More
Four Years or More
Six Yearsor More
Life Sentence
Number of Observations
WESTERN EUROPEAN COUNTRIESUnited Kingdom 0.175 0.061 0.017 0.003 9,873 Netherlands 0.064 0.026 0.009 0.001 4,031 Switzerland 0.002 0.000 0.000 0.000 812 Belgium 0.028 0.011 0.002 0.001 1,778 Finland 0.012 0.004 0.001 0.000 3,344 Norway 0.096 0.035 0.009 0.000 115 Sweden 0.022 0.008 0.004 0.002 3,632 Austria 0.007 0.002 0.001 0.000 1,254 Denmark 0.014 0.004 0.002 0.000 2,637 MEDITERRANEAN COUNTRIES France 0.014 0.007 0.003 0.000 1,534 Malta 0.130 0.047 0.014 0.003 906 Spain 0.019 0.010 0.007 0.002 1,153 Portugal 0.107 0.040 0.017 0.000 948 Italy 0.049 0.024 0.010 0.000 716 U.S., CANADA , AUSTRALIA and NEW ZEALANDUnited States 0.253 0.117 0.044 0.006 1,379 Canada 0.218 0.159 0.136 0.027 4,611 Australia 0.095 0.035 0.011 0.002 2,964 New Zealand 0.045 0.017 0.004 0.002 1,504 CENTRAL and EASTERN EUROPEAN COUNTRIESEstonia 0.231 0.105 0.031 0.000 735 Poland 0.091 0.034 0.011 0.002 7,868 Czech Republic 0.163 0.062 0.016 0.000 2,355 Slovakia 0.265 0.101 0.031 0.001 1,179 Russia 0.237 0.123 0.049 0.009 1,282 Georgia 0.340 0.201 0.072 0.026 1,842 Slovenia 0.085 0.035 0.011 0.002 2,376 Latvia 0.299 0.141 0.056 0.004 1,273 Romania 0.581 0.409 0.221 0.010 958 Hungary 0.189 0.089 0.048 0.006 660 Yugoslavia 0.205 0.109 0.032 0.011 975 Macedonia 0.108 0.055 0.022 0.008 603 Croatia 0.030 0.009 0.000 0.000 865 Ukraine 0.335 0.202 0.112 0.006 837 Belarus 0.230 0.110 0.043 0.005 809 Lithuania 0.252 0.094 0.035 0.003 1,090
32
(Table 1 concluded) ASIAN COUNTRIES Japan 0.120 0.040 0.016 0.003 1,155 Indonesia 0.274 0.160 0.058 0.012 569 Philippines 0.300 0.121 0.061 0.014 1,960 India 0.302 0.170 0.099 0.009 1,398 China 0.734 0.391 0.205 0.039 1,373 Mongolia 0.441 0.211 0.068 0.003 762 Kyrgyz Republic 0.186 0.096 0.028 0.004 1,564 AFRICAN COUNTRIES Uganda 0.515 0.270 0.116 0.016 1,209 Egypt 0.380 0.183 0.070 0.005 573 South Africa 0.467 0.247 0.106 0.008 1,578 Tunisia 0.281 0.104 0.035 0.010 481 Zimbabwe 0.571 0.330 0.167 0.069 801 Botswana 0.557 0.397 0.296 0.142 388 LATIN AMERICAN COUNTRIES Costa Rica 0.346 0.258 0.191 0.072 1,116 Brazil 0.194 0.095 0.047 0.011 1,469 Argentina 0.161 0.049 0.021 0.005 1,700 Bolivia 0.272 0.143 0.056 0.018 767 Paraguay 0.313 0.188 0.098 0.027 480 Colombia 0.200 0.073 0.016 0.001 790
The values in columns represent the proportion of individuals in each country who consider the sentence length displayed in column headings (e.g. two years or longer) as the appropriate punishment for a burglar. The information pertains to individuals in each country who have non-missing values for all personal characteristics. The tabulations that used all individuals generated very similar outcomes.
33
Table 2 Descriptive Statistics
Variable Name Definition (source) Mean
(Std. Dev)N=70324
Mean (Std. Dev) N=84338
Mean(Std. Dev)N=89037
Victim of Burglary- This or last year
Dummy Variable (=1) if the respondent was a victim of burglary this year or last year.
0.067(0.250)
0.073 (0.259)
0.072(0.258)
Victim of Burglary- Before Last Year
Dummy Variable (=1) if the respondent was a victim of burglary before last year.
0.086(0.280)
0.087 (0.281)
0.087(0.282)
Gun
Dummy Variable(=1) it the respondent or someone else in the household owns a gun (other than air riffle) for any purpose other than part of a collection (A)
0.103(0.304)
0.101 (0.301)
0.100(0.301)
Male Dummy Variable (=1) if the respondent is male, 0 otherwise (A)
0.510(0.500)
0.477 (0.499)
0.470(0.499)
Upper Income Dummy Variable (=1) if the family income is in the upper 50% of the country, 0 otherwise (A)
0.537(0.499)
0.514 (0.500)
0.512(0.500)
Education Years of education of the respondent (A) 12.179(3.524)
12.238 (3.570)
12.192(3.572)
Burglary Rate The burglary rate in the region of the country that the respondent lives in (A)
0.036(0.035)
0.039 (0.036)
0.038(0.035)
Small City Dummy Variable(=1) if the respondent is living in a town with a population of 50,000 less (A)
0.442(0.497)
0.382 (0.486)
Middle Size City Dummy Variable(=1) if the respondent is living in a town with a population of 50,000 to 1 million (A)
0.379(0.485)
0.430 (0.495)
Age20to24 Dummy Variable (=1) if the respondent is between ages 20 and 24, 0 otherwise (A)
0.094(0.292)
0.079 (0.270)
0.078(0.269)
Age25to29 Dummy Variable (=1) if the respondent is between ages 25 and 29, 0 otherwise (A)
0.118(0.323)
0.110 (0.312)
0.109(0.312)
Age30to34 Dummy Variable (=1) if the respondent is between ages 30 and 34, 0 otherwise (A)
0.127(0.333)
0.122 (0.328)
0.123(0.328)
Age35to39 Dummy Variable (=1) if the respondent is between ages 35 and 39, 0 otherwise (A)
0.115(0.319)
0.125 (0.331)
0.125(0.331)
Age40to44 Dummy Variable (=1) if the respondent is between ages 40 and 44, 0 otherwise (A)
0.105(0.307)
0.111 (0.315)
0.111(0.314)
Age45to49 Dummy Variable (=1) if the respondent is between ages 45 and 49, 0 otherwise (A)
0.089(0.285)
0.094 (0.291)
0.093(0.291)
Age50to54 Dummy Variable (=1) if the respondent is between ages 50 and 54, 0 otherwise (A)
0.082(0.274)
0.079 (0.270)
0.079(0.270)
Age55to59 Dummy Variable (=1) if the respondent is between ages 55 and 59, 0 otherwise (A)
0.064(0.244)
0.066 (0.249)
0.066(0.249)
Age60to64 Dummy Variable (=1) if the respondent is between ages 60 and 64, 0 otherwise (A)
0.050(0.219)
0.056 (0.231)
0.057(0.232)
34
(Table 2 continued)Age65to69 Dummy Variable (=1) if the respondent is
between ages 65 and 69, 0 otherwise (A) 0.047
(0.212) 0.050
(0.218) 0.050
(0.219) Age70+ Dummy Variable (=1) if the respondent is
older than 70, 0 otherwise (A) 0.072
(0.259) 0.078
(0.268) 0.079
(0.270) Single Dummy Variable (=1) if the respondent is
single, 0 otherwise (A) 0.217
(0.412) 0.213
(0.410) 0.213
(0.410) Widowed Dummy Variable (=1) if the respondent is
widowed, 0 otherwise (A) 0.056
(0.229) 0.069
(0.253) 0.070
(0.256) Living together Dummy Variable (=1) if the respondent is
living together as a couple (but not married), 0 otherwise (A)
0.068(0.252)
0.060 (0.237)
0.059(0.237)
Divorced Dummy Variable (=1) if the respondent is divorced, 0 otherwise (A)
0.052(0.223)
0.062 (0.240)
0.063(0.243)
Working Dummy Variable (=1) if the respondent is working, 0 otherwise (A)
0.607(0.488)
0.595 (0.491)
0.594(0.491)
Looking for job Dummy Variable (=1) if the respondent is looking for job, 0 otherwise (A)
0.070(0.255)
0.069 (0.253)
0.068(0.251)
Home keeper Dummy Variable (=1) if the respondent is house keeper, 0 otherwise (A)
0.099(0.299)
0.098 (0.297)
0.102(0.302)
Retired/disabled Dummy Variable (=1) if the respondent is retired or disabled, 0 otherwise (A)
0.168(0.374)
0.186 (0.389)
0.186(0.389)
Individualism Index of the degree to which individuals are integrated into groups (N)
62.790(21.351)
Rule of Law Index of the extent to which agents have confidence and abide by the rules of society (M)
0.982(0.974)
Ethno-linguistic Fragmentation
The index of the extent of ethno-linguistic fragmentation in the country (P)
0.358(0.267)
British Legal Origin Dummy Variable (=1) if the legal origin of the respondent is English, 0 otherwise (E)
0.336(0.472)
French Legal Origin Dummy Variable (=1) if the legal origin of the respondent is French, 0 otherwise (E)
0.250(0.433)
German Legal Origin Dummy Variable (=1) if the legal origin of the respondent is German, 0 otherwise (E)
0.041(0.198)
Percent Catholic Percent of Catholics in the country (E) 40.332(34.718)
Percent Muslim Percent of Muslims in the country (E) 2.743(11.128)
Democratic Dummy Variable (=1) if the country was democratic in all 46 years between 1950 and 1995(D)
0.563(0.496)
Per-capita income PPP adjusted Real per-capita income of the country in 2000 dollars (G)
15,685.030(8,444.320)
Government Share Government share of per-capita GDP (G)
20.755(5.762)
Population Population of the country in millions in the survey year (G)
79.910(201.873)
)
35
(Table 2 concluded)Population less than 25
Percentage of population less than 25 years of age (K)
38.145(9.601)
Average Country Education
Average education of adults in the country in the survey year (L)
8.666(2.192)
Women in Parliament Percentage of women in parliament of the corresponding country (F)
19.025(10.699)
War Dummy Variable (=1) if a war/civil conflictoccurred since 1975 (C)
0.357(0.479)
Western Europe Dummy Variable (=1) if the country is in Western Europe, 0 otherwise
0.370(0.483)
Central Europe Dummy Variable (=1) if the country is in Central Europe, 0 otherwise
0.216(0.411)
Mediterranean Dummy Variable (=1) if the country is in Mediterranean region, 0 otherwise
0.046(0.209)
Asia Dummy Variable (=1) if the country is in Asia, 0 otherwise
0.089(0.285)
Africa Dummy Variable (=1) if the country is in Africa, 0 otherwise
0.071(0.256)
Latin America Dummy Variable (=1) if the country is in Latin America, 0 otherwise
0.072(0.258)
The descriptive statistics pertain to observations with non-missing values in all variables. A: UNICRI International Crime Victim Survey version ICVS2000_2(1)B: “National Cultures of the World: A Statistical Reference” (1997), Parker, Philip M., Greenwood Press.C: Gleditsch, Nils Petter; Peter Wallensteen, Mikael Eriksson, Margareta Sollenberg & Håvard Strand, 2002. ‘Armed Conflict 1946–2001: A New Dataset’, Journal of Peace Research 39(5): 615–637. D: The causes of corruption: a cross-national study; Daniel Treisman, Journal of Public Economics 76 (2000) , 399-457 E: The Quality of Government; La Porta, Rafael et al., NBER Working Paper: 6727 (1998) F: World Development Indicators. CD 2003G: Alan Heston, Robert Summers and Bettina Aten, Penn World Table Version 6.2, Center for International Comparisons of Production, Income and Prices at the University of Pennsylvania, September 2006.. H: The State in a Changing World, World Development Report 1997, World Bank, Washington, DC:Oxford University Press, 1997 I: Governance Matters III: Governance Indicators for 1996-2002, Daniel Kaufmann, Aart Kraay, MassimoMastruzzi, The World Bank, June 30,2003 J: World Bank, Education Statistics Database http://www1.worldbank.org/education/edstats/ K: United Nations Statistics Division, Common Database, Population by Sex, Age Group, Urban and Rural, Census Years, Series Number 14890: http://unstats.un.org/unsd/cdbL: Barro, Robert J. and Jong-Wha Lee, "International Data on Educational Attainment: Updates and Implications" (CID Working Paper No. 42, April 2000) – Human Capital Updated Files. M: Governance Matters 2007 – Worldwide Governance Indicators, 1996-2006. <http://info.worldbank.org/governance/wgi2007/mc_countries.asp>. (June 13, 2008) N: Hofstede, Geert. “Cultural Dimensions,” <http://www.geert-hofstede.com/ hofstede_ dimensions.php> (June 13, 2008). P: Philip G. Roeder. 2001. "Ethnolinguistic Fractionalization (ELF) Indices, 1961 and 1985." February 16. <http//:weber.ucsd.edu\~proeder\elf.htm>.(June 13, 2008)
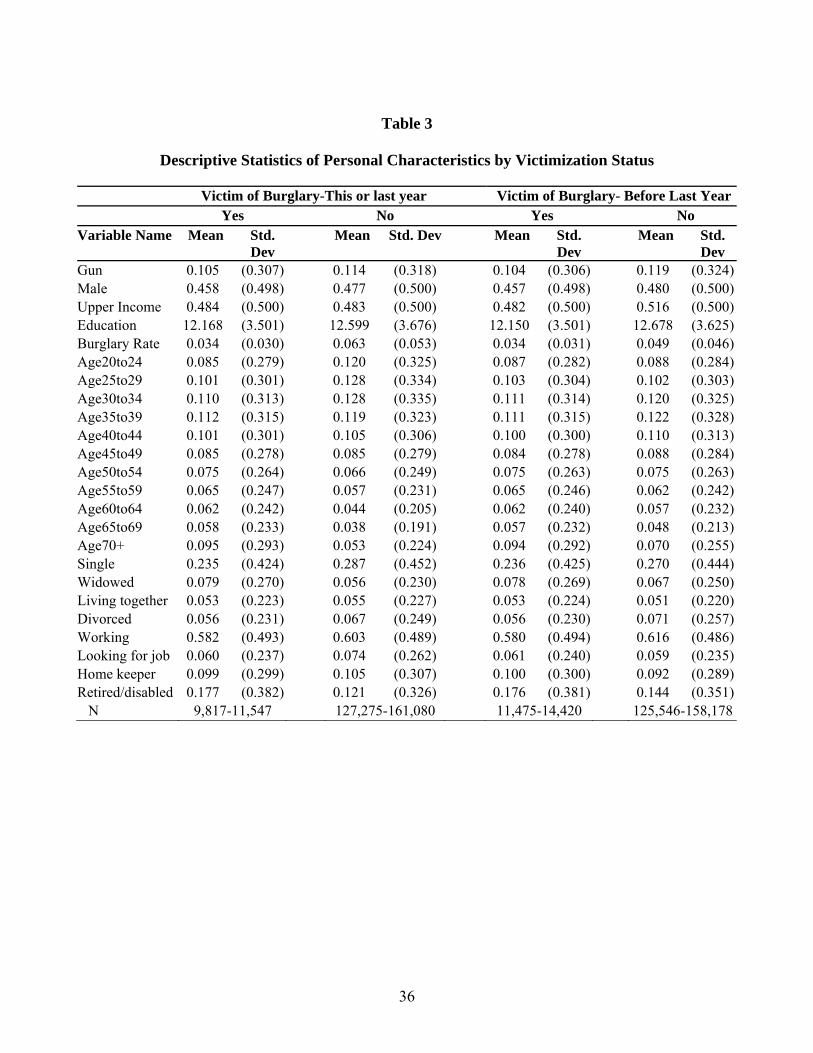
36
Table 3
Descriptive Statistics of Personal Characteristics by Victimization Status
Victim of Burglary-This or last year Victim of Burglary- Before Last Year Yes No Yes NoVariable Name Mean Std.
Dev Mean Std. Dev Mean Std.
Dev Mean Std.
DevGun 0.105 (0.307) 0.114 (0.318) 0.104 (0.306) 0.119 (0.324)Male 0.458 (0.498) 0.477 (0.500) 0.457 (0.498) 0.480 (0.500)Upper Income 0.484 (0.500) 0.483 (0.500) 0.482 (0.500) 0.516 (0.500)Education 12.168 (3.501) 12.599 (3.676) 12.150 (3.501) 12.678 (3.625)Burglary Rate 0.034 (0.030) 0.063 (0.053) 0.034 (0.031) 0.049 (0.046)Age20to24 0.085 (0.279) 0.120 (0.325) 0.087 (0.282) 0.088 (0.284)Age25to29 0.101 (0.301) 0.128 (0.334) 0.103 (0.304) 0.102 (0.303)Age30to34 0.110 (0.313) 0.128 (0.335) 0.111 (0.314) 0.120 (0.325)Age35to39 0.112 (0.315) 0.119 (0.323) 0.111 (0.315) 0.122 (0.328)Age40to44 0.101 (0.301) 0.105 (0.306) 0.100 (0.300) 0.110 (0.313)Age45to49 0.085 (0.278) 0.085 (0.279) 0.084 (0.278) 0.088 (0.284)Age50to54 0.075 (0.264) 0.066 (0.249) 0.075 (0.263) 0.075 (0.263)Age55to59 0.065 (0.247) 0.057 (0.231) 0.065 (0.246) 0.062 (0.242)Age60to64 0.062 (0.242) 0.044 (0.205) 0.062 (0.240) 0.057 (0.232)Age65to69 0.058 (0.233) 0.038 (0.191) 0.057 (0.232) 0.048 (0.213)Age70+ 0.095 (0.293) 0.053 (0.224) 0.094 (0.292) 0.070 (0.255)Single 0.235 (0.424) 0.287 (0.452) 0.236 (0.425) 0.270 (0.444)Widowed 0.079 (0.270) 0.056 (0.230) 0.078 (0.269) 0.067 (0.250)Living together 0.053 (0.223) 0.055 (0.227) 0.053 (0.224) 0.051 (0.220)Divorced 0.056 (0.231) 0.067 (0.249) 0.056 (0.230) 0.071 (0.257)Working 0.582 (0.493) 0.603 (0.489) 0.580 (0.494) 0.616 (0.486)Looking for job 0.060 (0.237) 0.074 (0.262) 0.061 (0.240) 0.059 (0.235)Home keeper 0.099 (0.299) 0.105 (0.307) 0.100 (0.300) 0.092 (0.289)Retired/disabled 0.177 (0.382) 0.121 (0.326) 0.176 (0.381) 0.144 (0.351) N 9,817-11,547 127,275-161,080 11,475-14,420 125,546-158,178
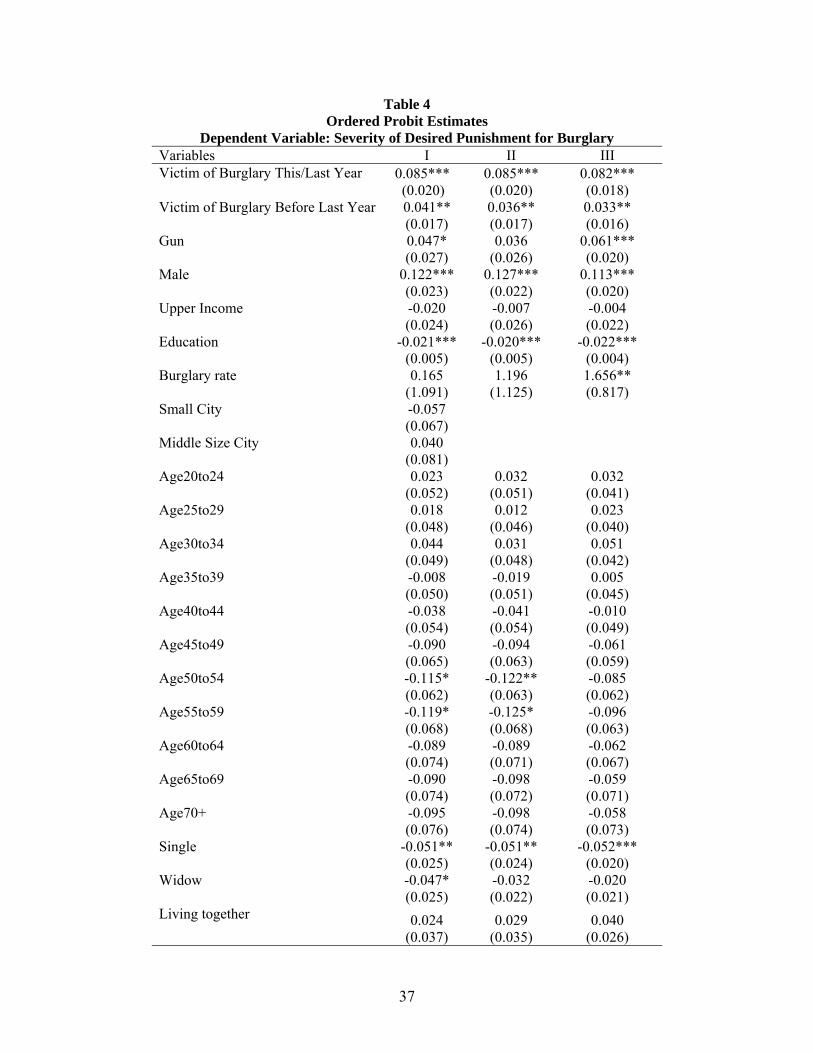
37
Table 4 Ordered Probit Estimates
Dependent Variable: Severity of Desired Punishment for Burglary Variables I II III Victim of Burglary This/Last Year 0.085***
(0.020) 0.085*** (0.020)
0.082*** (0.018)
Victim of Burglary Before Last Year 0.041** (0.017)
0.036** (0.017)
0.033** (0.016)
Gun 0.047* (0.027)
0.036 (0.026)
0.061*** (0.020)
Male 0.122*** (0.023)
0.127*** (0.022)
0.113*** (0.020)
Upper Income -0.020 (0.024)
-0.007 (0.026)
-0.004 (0.022)
Education -0.021*** (0.005)
-0.020*** (0.005)
-0.022*** (0.004)
Burglary rate 0.165 (1.091)
1.196 (1.125)
1.656** (0.817)
Small City -0.057 (0.067)
Middle Size City 0.040 (0.081)
Age20to24 0.023 (0.052)
0.032 (0.051)
0.032 (0.041)
Age25to29 0.018 (0.048)
0.012 (0.046)
0.023 (0.040)
Age30to34 0.044 (0.049)
0.031 (0.048)
0.051 (0.042)
Age35to39 -0.008 (0.050)
-0.019 (0.051)
0.005 (0.045)
Age40to44 -0.038 (0.054)
-0.041 (0.054)
-0.010 (0.049)
Age45to49 -0.090 (0.065)
-0.094 (0.063)
-0.061 (0.059)
Age50to54 -0.115* (0.062)
-0.122** (0.063)
-0.085 (0.062)
Age55to59 -0.119* (0.068)
-0.125* (0.068)
-0.096 (0.063)
Age60to64 -0.089 (0.074)
-0.089 (0.071)
-0.062 (0.067)
Age65to69 -0.090 (0.074)
-0.098 (0.072)
-0.059 (0.071)
Age70+ -0.095 (0.076)
-0.098 (0.074)
-0.058 (0.073)
Single -0.051** (0.025)
-0.051** (0.024)
-0.052*** (0.020)
Widow -0.047* (0.025)
-0.032 (0.022)
-0.020 (0.021)
Living together 0.024 (0.037)
0.029 (0.035)
0.040 (0.026)
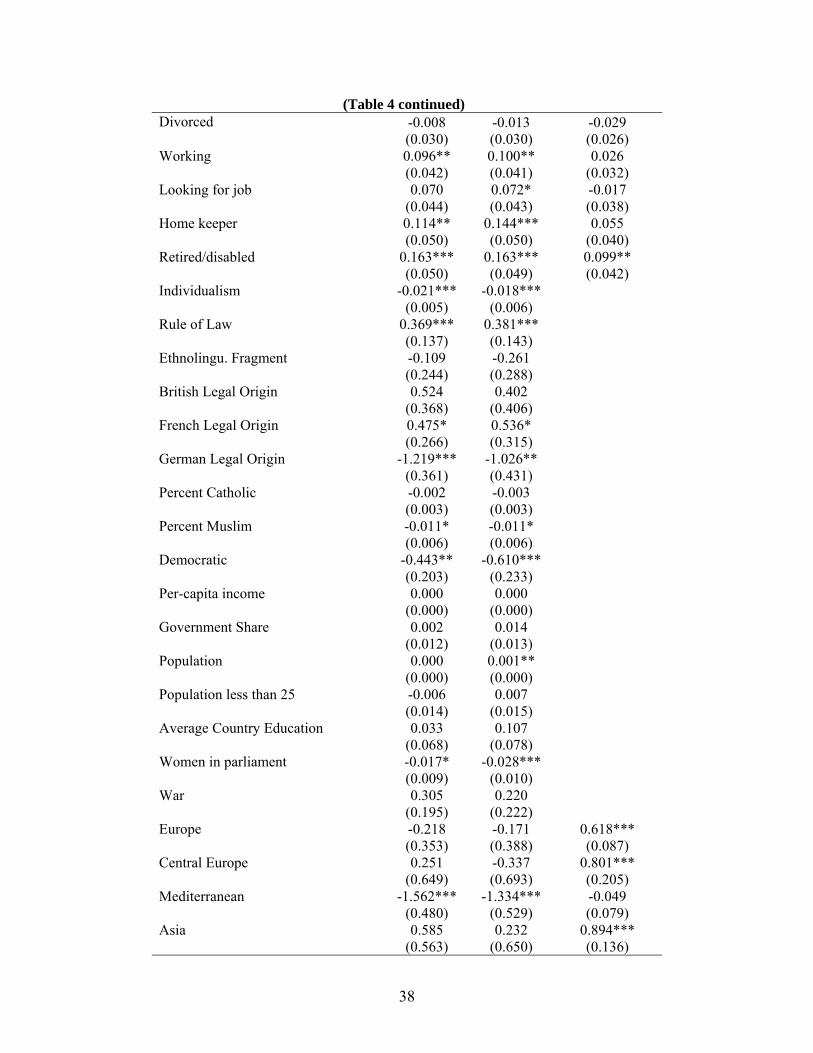
38
(Table 4 continued) Divorced -0.008
(0.030) -0.013 (0.030)
-0.029 (0.026)
Working 0.096** (0.042)
0.100** (0.041)
0.026 (0.032)
Looking for job 0.070 (0.044)
0.072* (0.043)
-0.017 (0.038)
Home keeper 0.114** (0.050)
0.144*** (0.050)
0.055 (0.040)
Retired/disabled 0.163*** (0.050)
0.163*** (0.049)
0.099** (0.042)
Individualism -0.021*** (0.005)
-0.018*** (0.006)
Rule of Law 0.369*** (0.137)
0.381*** (0.143)
Ethnolingu. Fragment -0.109 (0.244)
-0.261 (0.288)
British Legal Origin 0.524 (0.368)
0.402 (0.406)
French Legal Origin 0.475* (0.266)
0.536* (0.315)
German Legal Origin -1.219*** (0.361)
-1.026** (0.431)
Percent Catholic -0.002 (0.003)
-0.003 (0.003)
Percent Muslim -0.011* (0.006)
-0.011* (0.006)
Democratic -0.443** (0.203)
-0.610*** (0.233)
Per-capita income 0.000 (0.000)
0.000 (0.000)
Government Share 0.002 (0.012)
0.014 (0.013)
Population 0.000 (0.000)
0.001** (0.000)
Population less than 25 -0.006 (0.014)
0.007 (0.015)
Average Country Education 0.033 (0.068)
0.107 (0.078)
Women in parliament -0.017* (0.009)
-0.028*** (0.010)
War 0.305 (0.195)
0.220 (0.222)
Europe -0.218 (0.353)
-0.171 (0.388)
0.618*** (0.087)
Central Europe 0.251 (0.649)
-0.337 (0.693)
0.801*** (0.205)
Mediterranean -1.562*** (0.480)
-1.334*** (0.529)
-0.049 (0.079)
Asia 0.585 (0.563)
0.232 (0.650)
0.894*** (0.136)
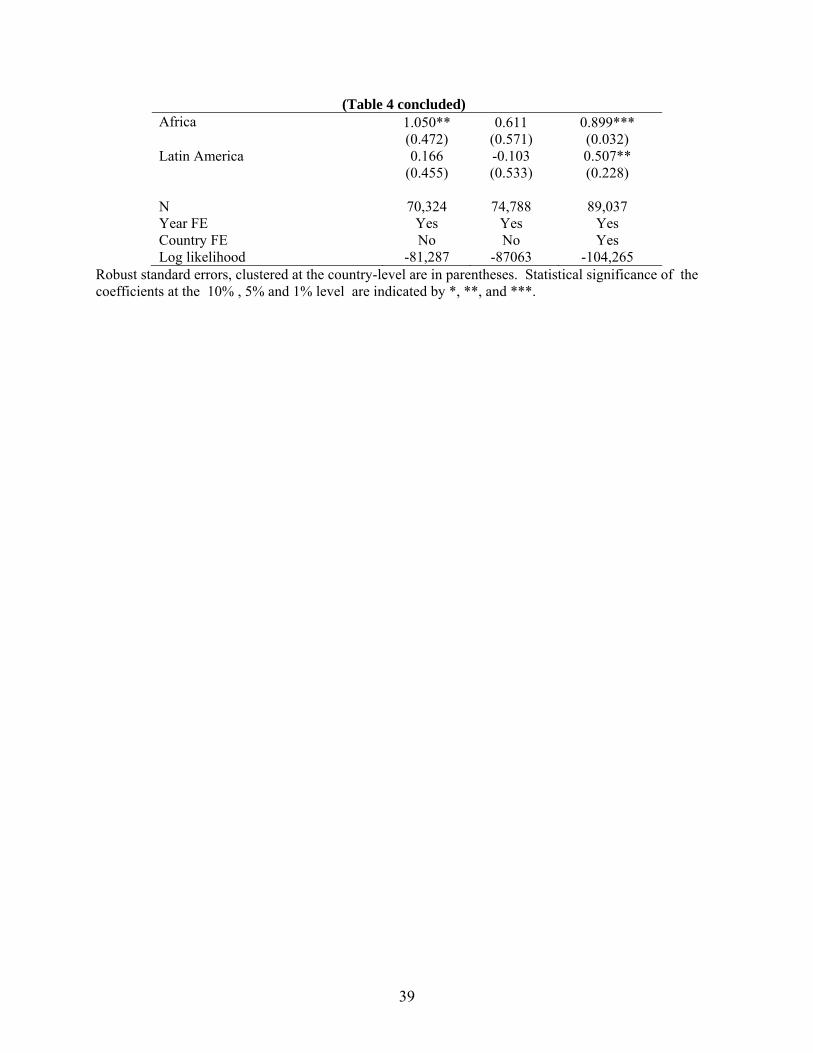
39
(Table 4 concluded) Africa 1.050**
(0.472) 0.611
(0.571) 0.899*** (0.032)
Latin America 0.166 (0.455)
-0.103 (0.533)
0.507** (0.228)
N 70,324 74,788 89,037 Year FE Yes Yes Yes Country FE No No Yes Log likelihood -81,287 -87063 -104,265
Robust standard errors, clustered at the country-level are in parentheses. Statistical significance of the coefficients at the 10% , 5% and 1% level are indicated by *, **, and ***.
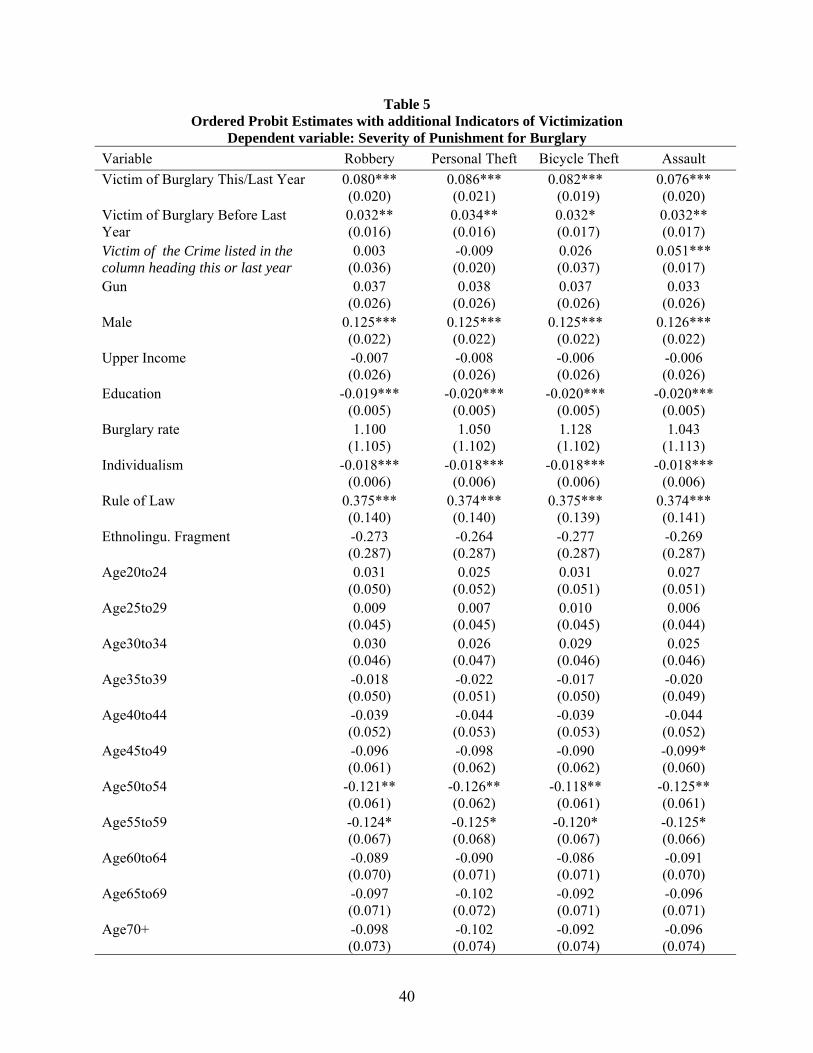
40
Table 5 Ordered Probit Estimates with additional Indicators of Victimization
Dependent variable: Severity of Punishment for Burglary Variable Robbery Personal Theft Bicycle Theft Assault Victim of Burglary This/Last Year 0.080***
(0.020) 0.086***(0.021)
0.082*** (0.019)
0.076***(0.020)
Victim of Burglary Before Last Year
0.032**(0.016)
0.034**(0.016)
0.032* (0.017)
0.032**(0.017)
Victim of the Crime listed in the column heading this or last year
0.003(0.036)
-0.009(0.020)
0.026 (0.037)
0.051***(0.017)
Gun 0.037(0.026)
0.038(0.026)
0.037 (0.026)
0.033(0.026)
Male 0.125***(0.022)
0.125***(0.022)
0.125*** (0.022)
0.126***(0.022)
Upper Income -0.007(0.026)
-0.008(0.026)
-0.006 (0.026)
-0.006(0.026)
Education -0.019***(0.005)
-0.020***(0.005)
-0.020*** (0.005)
-0.020***(0.005)
Burglary rate 1.100(1.105)
1.050(1.102)
1.128 (1.102)
1.043(1.113)
Individualism -0.018***(0.006)
-0.018***(0.006)
-0.018*** (0.006)
-0.018***(0.006)
Rule of Law 0.375***(0.140)
0.374***(0.140)
0.375*** (0.139)
0.374***(0.141)
Ethnolingu. Fragment -0.273(0.287)
-0.264(0.287)
-0.277 (0.287)
-0.269(0.287)
Age20to24 0.031(0.050)
0.025(0.052)
0.031 (0.051)
0.027(0.051)
Age25to29 0.009(0.045)
0.007(0.045)
0.010 (0.045)
0.006(0.044)
Age30to34 0.030(0.046)
0.026(0.047)
0.029 (0.046)
0.025(0.046)
Age35to39 -0.018(0.050)
-0.022(0.051)
-0.017 (0.050)
-0.020(0.049)
Age40to44 -0.039(0.052)
-0.044(0.053)
-0.039 (0.053)
-0.044(0.052)
Age45to49 -0.096(0.061)
-0.098(0.062)
-0.090 (0.062)
-0.099*(0.060)
Age50to54 -0.121**(0.061)
-0.126**(0.062)
-0.118** (0.061)
-0.125**(0.061)
Age55to59 -0.124*(0.067)
-0.125*(0.068)
-0.120* (0.067)
-0.125*(0.066)
Age60to64 -0.089(0.070)
-0.090(0.071)
-0.086 (0.071)
-0.091(0.070)
Age65to69 -0.097(0.071)
-0.102(0.072)
-0.092 (0.071)
-0.096(0.071)
Age70+ -0.098(0.073)
-0.102(0.074)
-0.092 (0.074)
-0.096(0.074)
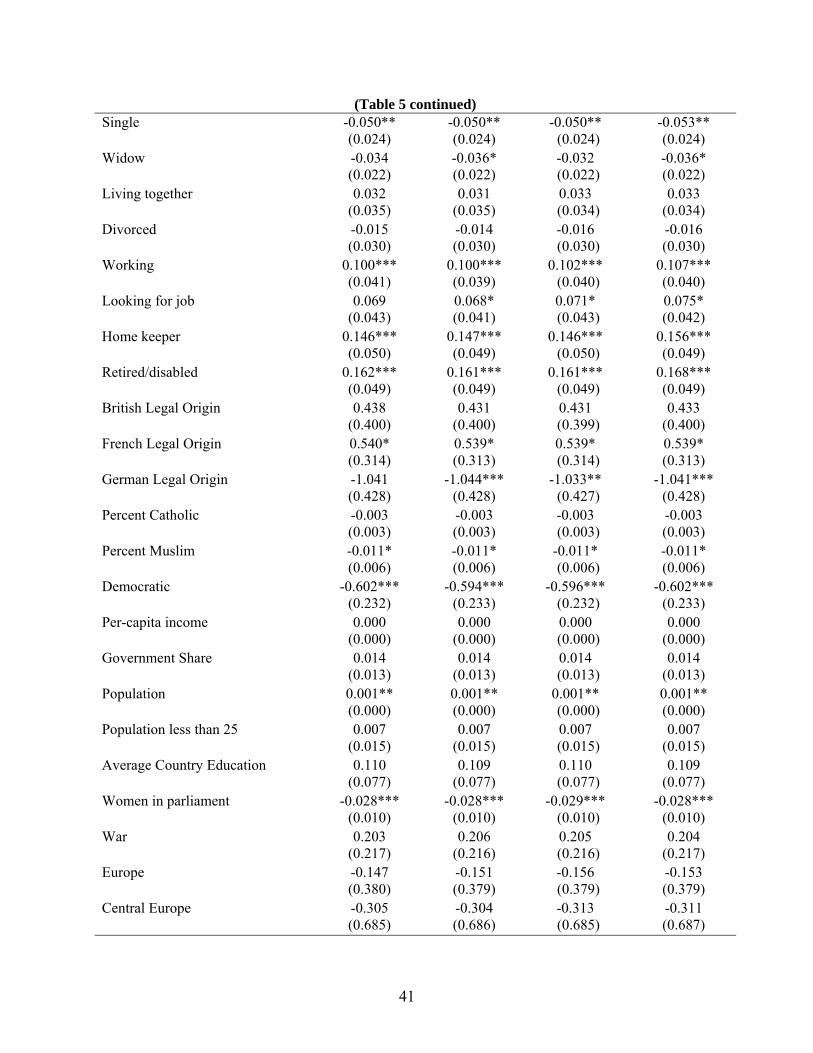
41
(Table 5 continued) Single -0.050**
(0.024) -0.050** (0.024)
-0.050** (0.024)
-0.053** (0.024)
Widow -0.034 (0.022)
-0.036* (0.022)
-0.032 (0.022)
-0.036* (0.022)
Living together 0.032 (0.035)
0.031 (0.035)
0.033 (0.034)
0.033 (0.034)
Divorced -0.015 (0.030)
-0.014 (0.030)
-0.016 (0.030)
-0.016 (0.030)
Working 0.100*** (0.041)
0.100*** (0.039)
0.102*** (0.040)
0.107*** (0.040)
Looking for job 0.069 (0.043)
0.068* (0.041)
0.071* (0.043)
0.075* (0.042)
Home keeper 0.146*** (0.050)
0.147*** (0.049)
0.146*** (0.050)
0.156*** (0.049)
Retired/disabled 0.162*** (0.049)
0.161*** (0.049)
0.161*** (0.049)
0.168*** (0.049)
British Legal Origin 0.438 (0.400)
0.431 (0.400)
0.431 (0.399)
0.433 (0.400)
French Legal Origin 0.540* (0.314)
0.539* (0.313)
0.539* (0.314)
0.539* (0.313)
German Legal Origin -1.041 (0.428)
-1.044*** (0.428)
-1.033** (0.427)
-1.041*** (0.428)
Percent Catholic -0.003 (0.003)
-0.003 (0.003)
-0.003 (0.003)
-0.003 (0.003)
Percent Muslim -0.011* (0.006)
-0.011* (0.006)
-0.011* (0.006)
-0.011* (0.006)
Democratic -0.602*** (0.232)
-0.594*** (0.233)
-0.596*** (0.232)
-0.602*** (0.233)
Per-capita income 0.000 (0.000)
0.000 (0.000)
0.000 (0.000)
0.000 (0.000)
Government Share 0.014 (0.013)
0.014 (0.013)
0.014 (0.013)
0.014 (0.013)
Population 0.001** (0.000)
0.001** (0.000)
0.001** (0.000)
0.001** (0.000)
Population less than 25 0.007 (0.015)
0.007 (0.015)
0.007 (0.015)
0.007 (0.015)
Average Country Education 0.110 (0.077)
0.109 (0.077)
0.110 (0.077)
0.109 (0.077)
Women in parliament -0.028*** (0.010)
-0.028*** (0.010)
-0.029*** (0.010)
-0.028*** (0.010)
War 0.203 (0.217)
0.206 (0.216)
0.205 (0.216)
0.204 (0.217)
Europe -0.147 (0.380)
-0.151 (0.379)
-0.156 (0.379)
-0.153 (0.379)
Central Europe -0.305 (0.685)
-0.304 (0.686)
-0.313 (0.685)
-0.311 (0.687)
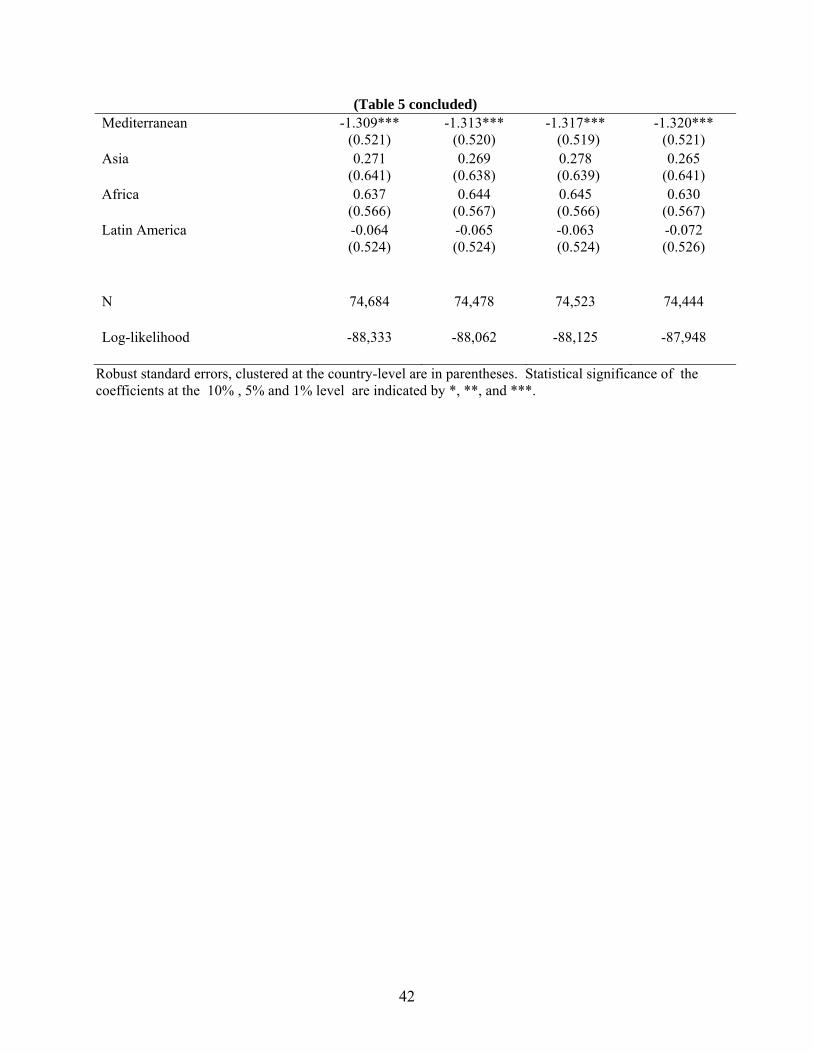
42
(Table 5 concluded) Mediterranean -1.309***
(0.521) -1.313***
(0.520) -1.317***
(0.519) -1.320***
(0.521) Asia 0.271
(0.641) 0.269
(0.638) 0.278 (0.639)
0.265 (0.641)
Africa 0.637 (0.566)
0.644 (0.567)
0.645 (0.566)
0.630 (0.567)
Latin America -0.064 (0.524)
-0.065 (0.524)
-0.063 (0.524)
-0.072 (0.526)
N 74,684 74,478 74,523 74,444
Log-likelihood -88,333 -88,062 -88,125 -87,948
Robust standard errors, clustered at the country-level are in parentheses. Statistical significance of the coefficients at the 10% , 5% and 1% level are indicated by *, **, and ***.
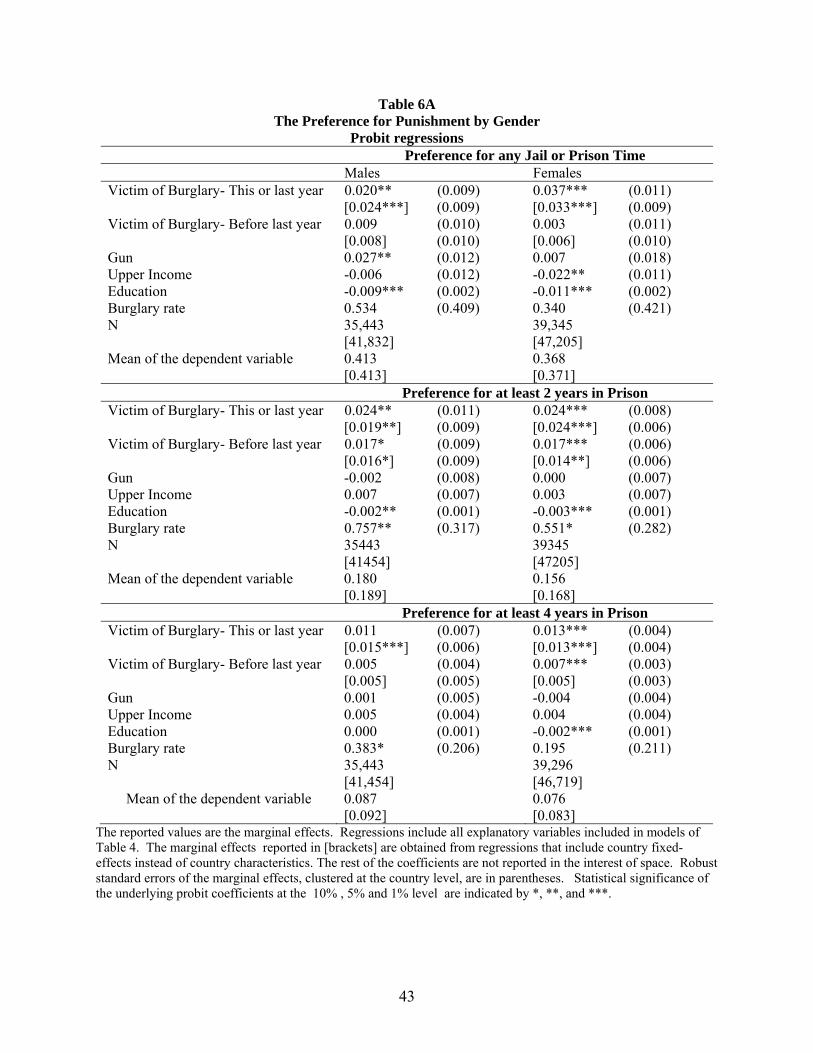
43
Table 6A The Preference for Punishment by Gender
Probit regressions Preference for any Jail or Prison Time Males Females Victim of Burglary- This or last year 0.020** (0.009) 0.037*** (0.011) [0.024***] (0.009) [0.033***] (0.009) Victim of Burglary- Before last year 0.009 (0.010) 0.003 (0.011) [0.008] (0.010) [0.006] (0.010) Gun 0.027** (0.012) 0.007 (0.018) Upper Income -0.006 (0.012) -0.022** (0.011) Education -0.009*** (0.002) -0.011*** (0.002)Burglary rate 0.534 (0.409) 0.340 (0.421)N 35,443 39,345 [41,832] [47,205] Mean of the dependent variable 0.413 0.368
[0.413] [0.371] Preference for at least 2 years in Prison Victim of Burglary- This or last year 0.024** (0.011) 0.024*** (0.008) [0.019**] (0.009) [0.024***] (0.006) Victim of Burglary- Before last year 0.017* (0.009) 0.017*** (0.006) [0.016*] (0.009) [0.014**] (0.006) Gun -0.002 (0.008) 0.000 (0.007) Upper Income 0.007 (0.007) 0.003 (0.007) Education -0.002** (0.001) -0.003*** (0.001) Burglary rate 0.757** (0.317) 0.551* (0.282) N 35443 39345 [41454] [47205] Mean of the dependent variable 0.180 0.156
[0.189] [0.168] Preference for at least 4 years in Prison Victim of Burglary- This or last year 0.011 (0.007) 0.013*** (0.004) [0.015***] (0.006) [0.013***] (0.004) Victim of Burglary- Before last year 0.005 (0.004) 0.007*** (0.003) [0.005] (0.005) [0.005] (0.003) Gun 0.001 (0.005) -0.004 (0.004)Upper Income 0.005 (0.004) 0.004 (0.004)Education 0.000 (0.001) -0.002*** (0.001)Burglary rate 0.383* (0.206) 0.195 (0.211)N 35,443 39,296 [41,454] [46,719]
Mean of the dependent variable 0.087 0.076 [0.092] [0.083]
The reported values are the marginal effects. Regressions include all explanatory variables included in models of Table 4. The marginal effects reported in [brackets] are obtained from regressions that include country fixed-effects instead of country characteristics. The rest of the coefficients are not reported in the interest of space. Robust standard errors of the marginal effects, clustered at the country level, are in parentheses. Statistical significance of the underlying probit coefficients at the 10% , 5% and 1% level are indicated by *, **, and ***.
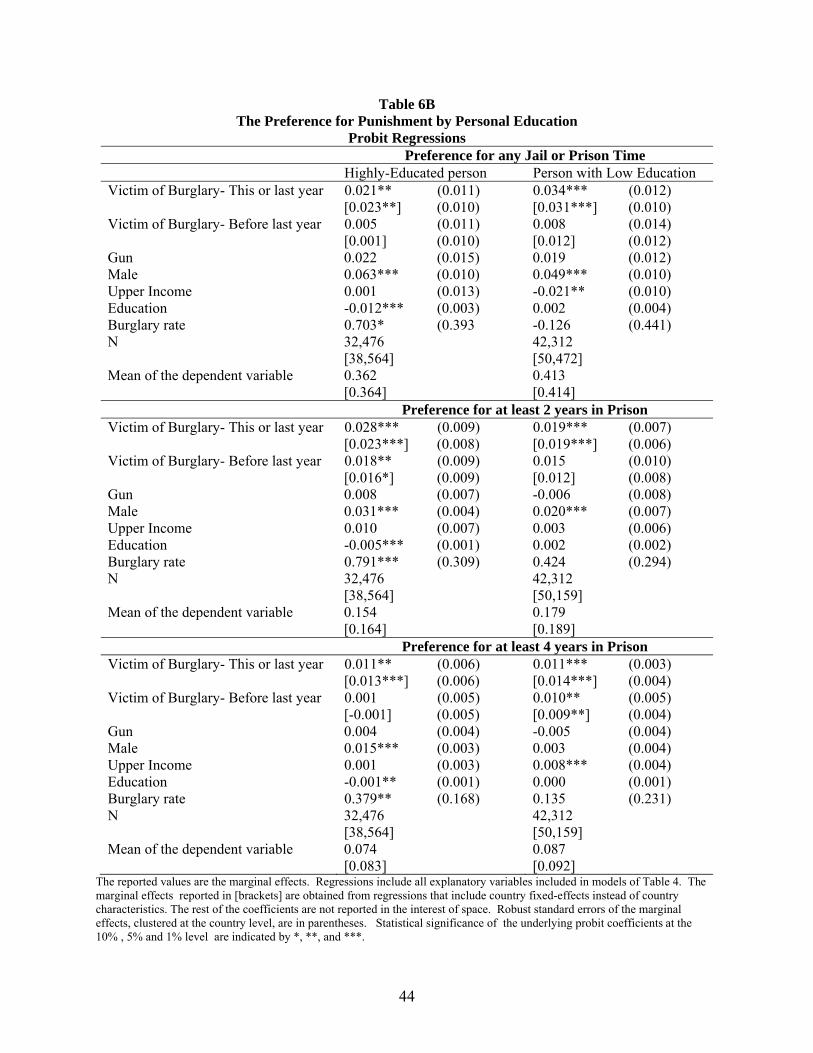
44
Table 6B The Preference for Punishment by Personal Education
Probit Regressions Preference for any Jail or Prison Time Highly-Educated person Person with Low Education Victim of Burglary- This or last year 0.021** (0.011) 0.034*** (0.012) [0.023**] (0.010) [0.031***] (0.010) Victim of Burglary- Before last year 0.005 (0.011) 0.008 (0.014) [0.001] (0.010) [0.012] (0.012) Gun 0.022 (0.015) 0.019 (0.012) Male 0.063*** (0.010) 0.049*** (0.010) Upper Income 0.001 (0.013) -0.021** (0.010) Education -0.012*** (0.003) 0.002 (0.004) Burglary rate 0.703* (0.393 -0.126 (0.441) N 32,476 42,312 [38,564] [50,472] Mean of the dependent variable 0.362 0.413
[0.364] [0.414] Preference for at least 2 years in Prison Victim of Burglary- This or last year 0.028*** (0.009) 0.019*** (0.007) [0.023***] (0.008) [0.019***] (0.006) Victim of Burglary- Before last year 0.018** (0.009) 0.015 (0.010) [0.016*] (0.009) [0.012] (0.008) Gun 0.008 (0.007) -0.006 (0.008) Male 0.031*** (0.004) 0.020*** (0.007) Upper Income 0.010 (0.007) 0.003 (0.006) Education -0.005*** (0.001) 0.002 (0.002) Burglary rate 0.791*** (0.309) 0.424 (0.294) N 32,476 42,312 [38,564] [50,159] Mean of the dependent variable 0.154 0.179
[0.164] [0.189] Preference for at least 4 years in Prison Victim of Burglary- This or last year 0.011** (0.006) 0.011*** (0.003) [0.013***] (0.006) [0.014***] (0.004) Victim of Burglary- Before last year 0.001 (0.005) 0.010** (0.005) [-0.001] (0.005) [0.009**] (0.004) Gun 0.004 (0.004) -0.005 (0.004) Male 0.015*** (0.003) 0.003 (0.004) Upper Income 0.001 (0.003) 0.008*** (0.004) Education -0.001** (0.001) 0.000 (0.001) Burglary rate 0.379** (0.168) 0.135 (0.231) N 32,476 42,312
[38,564] [50,159] Mean of the dependent variable 0.074 0.087
[0.083] [0.092] The reported values are the marginal effects. Regressions include all explanatory variables included in models of Table 4. The marginal effects reported in [brackets] are obtained from regressions that include country fixed-effects instead of country characteristics. The rest of the coefficients are not reported in the interest of space. Robust standard errors of the marginal effects, clustered at the country level, are in parentheses. Statistical significance of the underlying probit coefficients at the 10% , 5% and 1% level are indicated by *, **, and ***.
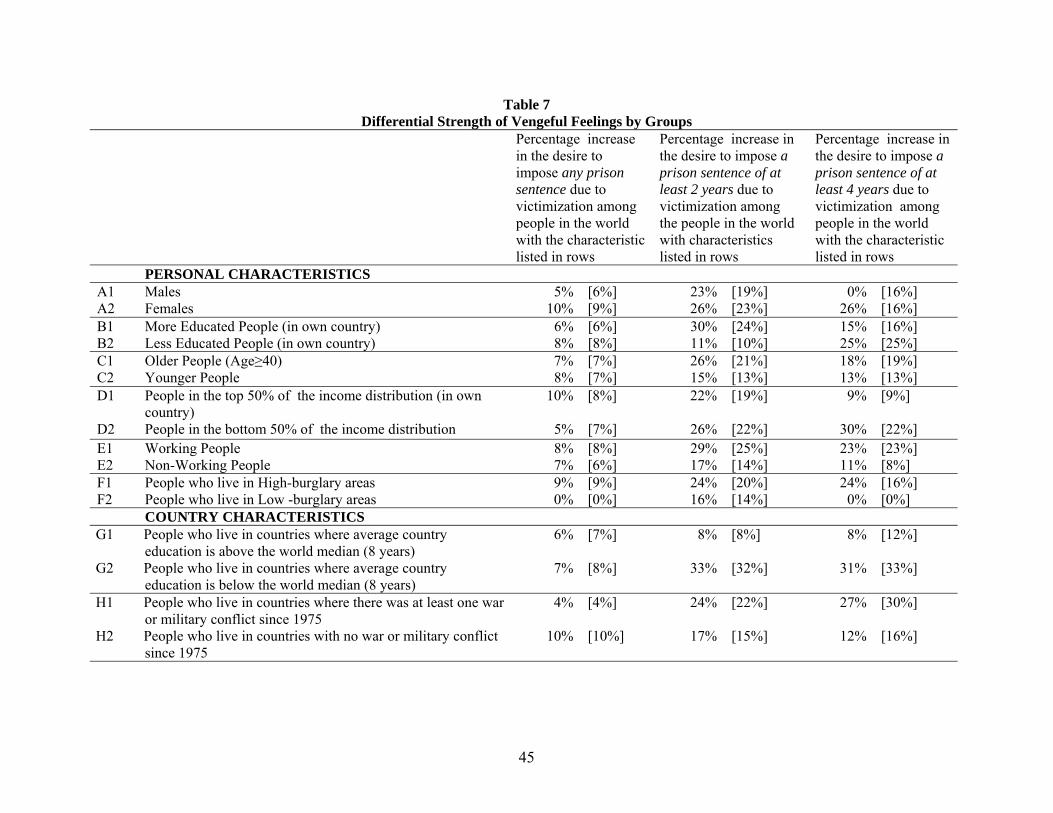
45
Table 7 Differential Strength of Vengeful Feelings by Groups
Percentage increase in the desire to impose any prison sentence due to victimization among people in the world with the characteristic listed in rows
Percentage increase in the desire to impose a prison sentence of at least 2 years due to victimization among the people in the world with characteristics listed in rows
Percentage increase in the desire to impose a prison sentence of at least 4 years due to victimization among people in the world with the characteristic listed in rows
PERSONAL CHARACTERISTICS A1 Males 5% [6%] 23% [19%] 0% [16%] A2 Females 10% [9%] 26% [23%] 26% [16%] B1 More Educated People (in own country) 6% [6%] 30% [24%] 15% [16%] B2 Less Educated People (in own country) 8% [8%] 11% [10%] 25% [25%] C1 Older People (Age≥40) 7% [7%] 26% [21%] 18% [19%] C2 Younger People 8% [7%] 15% [13%] 13% [13%] D1 People in the top 50% of the income distribution (in own
country) 10% [8%] 22% [19%] 9% [9%]
D2 People in the bottom 50% of the income distribution 5% [7%] 26% [22%] 30% [22%] E1 Working People 8% [8%] 29% [25%] 23% [23%] E2 Non-Working People 7% [6%] 17% [14%] 11% [8%]F1 People who live in High-burglary areas 9% [9%] 24% [20%] 24% [16%]F2 People who live in Low -burglary areas 0% [0%] 16% [14%] 0% [0%] COUNTRY CHARACTERISTICS G1 People who live in countries where average country
education is above the world median (8 years) 6% [7%] 8% [8%] 8% [12%]
G2 People who live in countries where average country education is below the world median (8 years)
7% [8%] 33% [32%] 31% [33%]
H1 People who live in countries where there was at least one war or military conflict since 1975
4% [4%] 24% [22%] 27% [30%]
H2 People who live in countries with no war or military conflict since 1975
10% [10%] 17% [15%] 12% [16%]
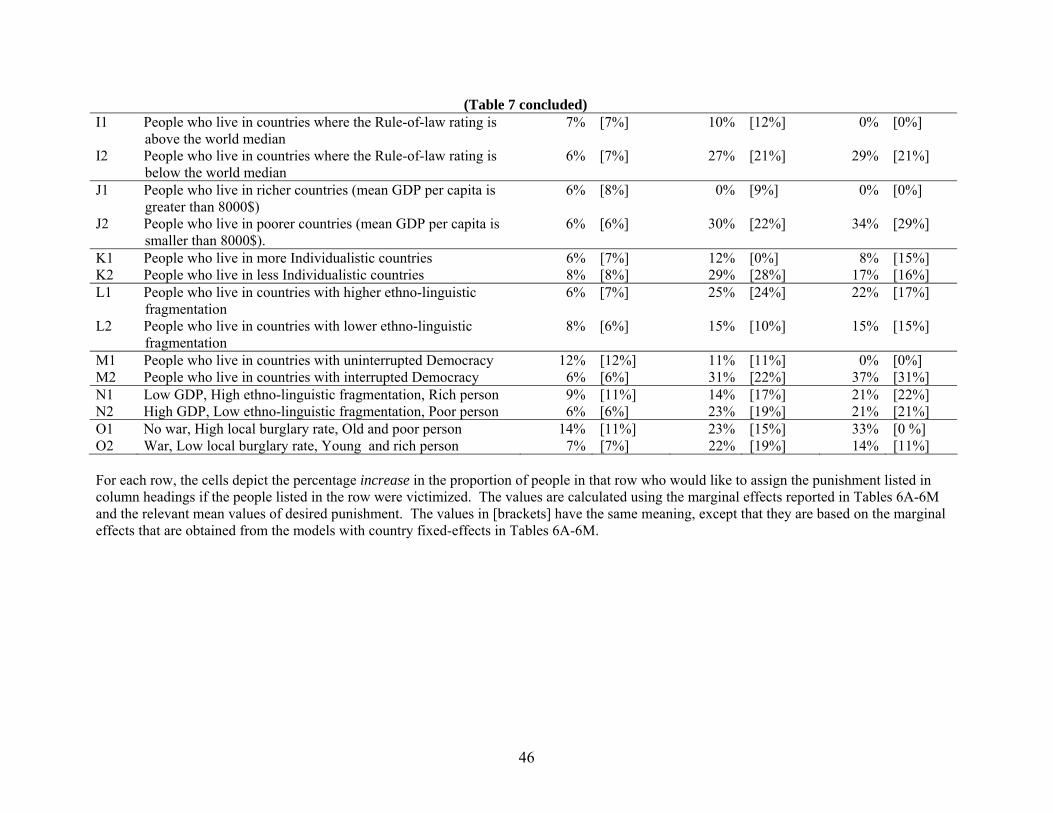
46
(Table 7 concluded) I1 People who live in countries where the Rule-of-law rating is
above the world median 7% [7%] 10% [12%] 0% [0%]
I2 People who live in countries where the Rule-of-law rating is below the world median
6% [7%] 27% [21%] 29% [21%]
J1 People who live in richer countries (mean GDP per capita is greater than 8000$)
6% [8%] 0% [9%] 0% [0%]
J2 People who live in poorer countries (mean GDP per capita is smaller than 8000$).
6% [6%] 30% [22%] 34% [29%]
K1 People who live in more Individualistic countries 6% [7%] 12% [0%] 8% [15%] K2 People who live in less Individualistic countries 8% [8%] 29% [28%] 17% [16%] L1 People who live in countries with higher ethno-linguistic
fragmentation 6% [7%] 25% [24%] 22% [17%]
L2 People who live in countries with lower ethno-linguistic fragmentation
8% [6%] 15% [10%] 15% [15%]
M1 People who live in countries with uninterrupted Democracy 12% [12%] 11% [11%] 0% [0%] M2 People who live in countries with interrupted Democracy 6% [6%] 31% [22%] 37% [31%] N1 Low GDP, High ethno-linguistic fragmentation, Rich person 9% [11%] 14% [17%] 21% [22%] N2 High GDP, Low ethno-linguistic fragmentation, Poor person 6% [6%] 23% [19%] 21% [21%] O1 No war, High local burglary rate, Old and poor person 14% [11%] 23% [15%] 33% [0 %] O2 War, Low local burglary rate, Young and rich person 7% [7%] 22% [19%] 14% [11%] For each row, the cells depict the percentage increase in the proportion of people in that row who would like to assign the punishment listed in column headings if the people listed in the row were victimized. The values are calculated using the marginal effects reported in Tables 6A-6M and the relevant mean values of desired punishment. The values in [brackets] have the same meaning, except that they are based on the marginal effects that are obtained from the models with country fixed-effects in Tables 6A-6M.
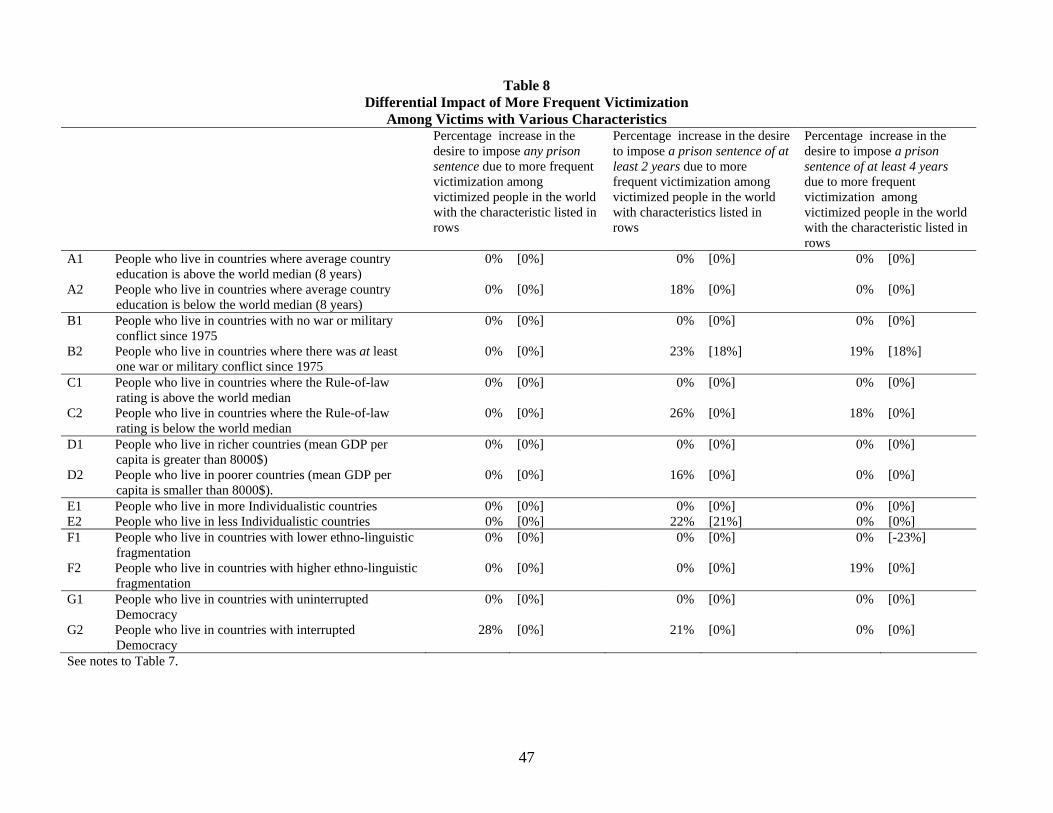
47
Table 8 Differential Impact of More Frequent Victimization
Among Victims with Various Characteristics Percentage increase in the
desire to impose any prison sentence due to more frequent victimization among victimized people in the world with the characteristic listed in rows
Percentage increase in the desire to impose a prison sentence of at least 2 years due to more frequent victimization among victimized people in the world with characteristics listed in rows
Percentage increase in the desire to impose a prison sentence of at least 4 years due to more frequent victimization among victimized people in the world with the characteristic listed in rows
A1 People who live in countries where average country education is above the world median (8 years)
0% [0%] 0% [0%] 0% [0%]
A2 People who live in countries where average country education is below the world median (8 years)
0% [0%] 18% [0%] 0% [0%]
B1 People who live in countries with no war or military conflict since 1975
0% [0%] 0% [0%] 0% [0%]
B2 People who live in countries where there was at least one war or military conflict since 1975
0% [0%] 23% [18%] 19% [18%]
C1 People who live in countries where the Rule-of-law rating is above the world median
0% [0%] 0% [0%] 0% [0%]
C2 People who live in countries where the Rule-of-law rating is below the world median
0% [0%] 26% [0%] 18% [0%]
D1 People who live in richer countries (mean GDP per capita is greater than 8000$)
0% [0%] 0% [0%] 0% [0%]
D2 People who live in poorer countries (mean GDP per capita is smaller than 8000$).
0% [0%] 16% [0%] 0% [0%]
E1 People who live in more Individualistic countries 0% [0%] 0% [0%] 0% [0%] E2 People who live in less Individualistic countries 0% [0%] 22% [21%] 0% [0%] F1 People who live in countries with lower ethno-linguistic
fragmentation 0% [0%] 0% [0%] 0% [-23%]
F2 People who live in countries with higher ethno-linguistic fragmentation
0% [0%] 0% [0%] 19% [0%]
G1 People who live in countries with uninterrupted Democracy
0% [0%] 0% [0%] 0% [0%]
G2 People who live in countries with interrupted Democracy
28% [0%] 21% [0%] 0% [0%]
See notes to Table 7.
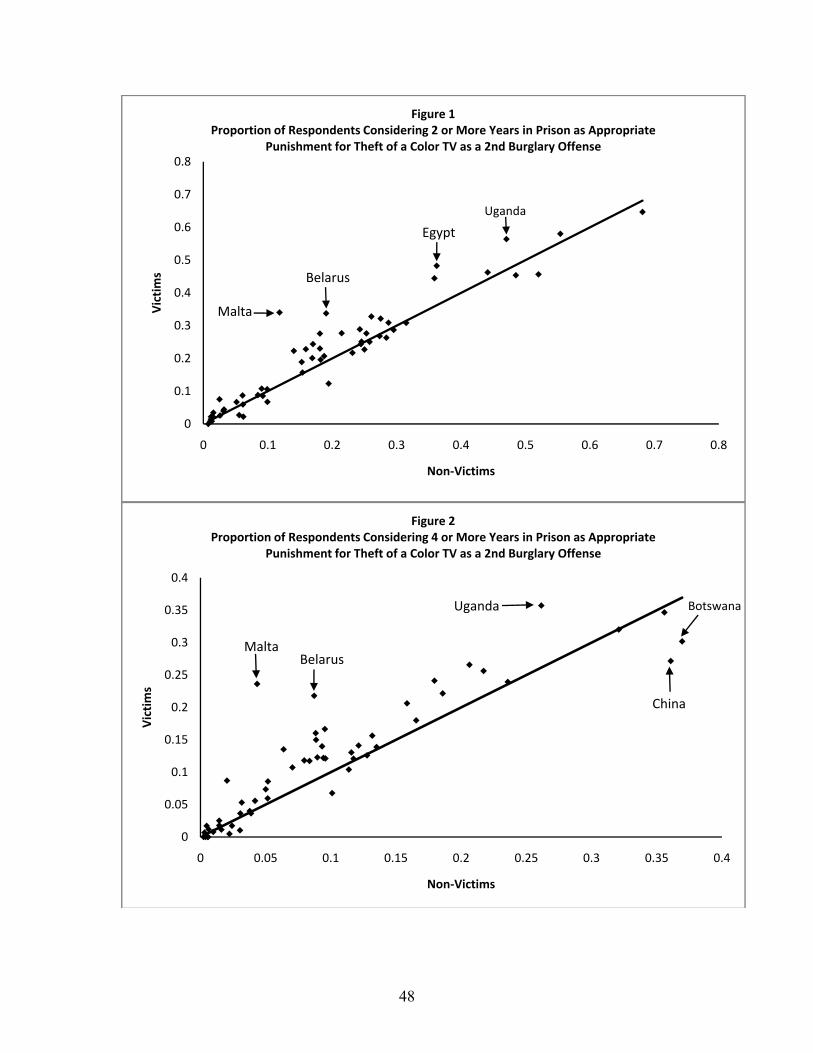
48
0
0.1
0.2
0.3
0.4
0.5
0.6
0.7
0.8
0 0.1 0.2 0.3 0.4 0.5 0.6 0.7 0.8
Victims
Non‐Victims
Figure 1Proportion of Respondents Considering 2 or More Years in Prison as Appropriate
Punishment for Theft of a Color TV as a 2nd Burglary Offense
Malta
Belarus
Egypt
Uganda
0
0.05
0.1
0.15
0.2
0.25
0.3
0.35
0.4
0 0.05 0.1 0.15 0.2 0.25 0.3 0.35 0.4
Victims
Non‐Victims
Figure 2Proportion of Respondents Considering 4 or More Years in Prison as Appropriate
Punishment for Theft of a Color TV as a 2nd Burglary Offense
MaltaBelarus
Uganda Botswana
China
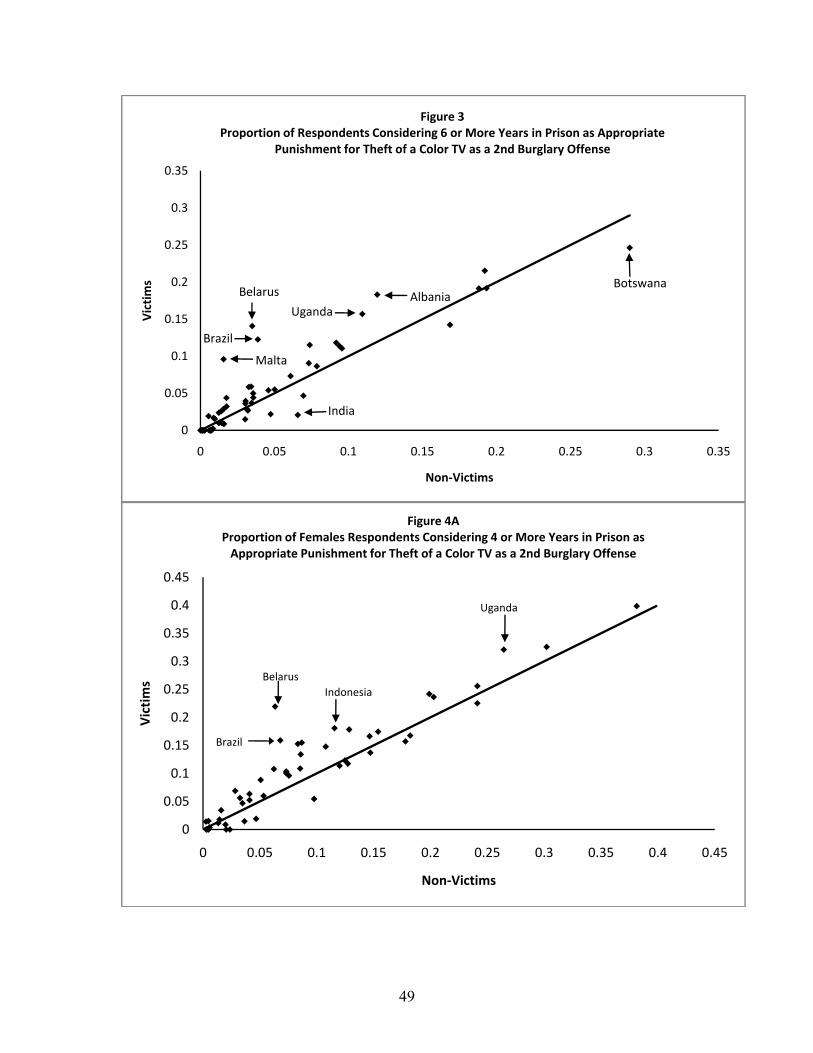
49
0
0.05
0.1
0.15
0.2
0.25
0.3
0.35
0 0.05 0.1 0.15 0.2 0.25 0.3 0.35
Victims
Non‐Victims
Figure 3Proportion of Respondents Considering 6 or More Years in Prison as Appropriate
Punishment for Theft of a Color TV as a 2nd Burglary Offense
Belarus
Brazil
UgandaAlbania
Malta
India
Botswana
0
0.05
0.1
0.15
0.2
0.25
0.3
0.35
0.4
0.45
0 0.05 0.1 0.15 0.2 0.25 0.3 0.35 0.4 0.45
Victims
Non‐Victims
Figure 4AProportion of Females Respondents Considering 4 or More Years in Prison as Appropriate Punishment for Theft of a Color TV as a 2nd Burglary Offense
Belarus
Uganda
Indonesia
Brazil
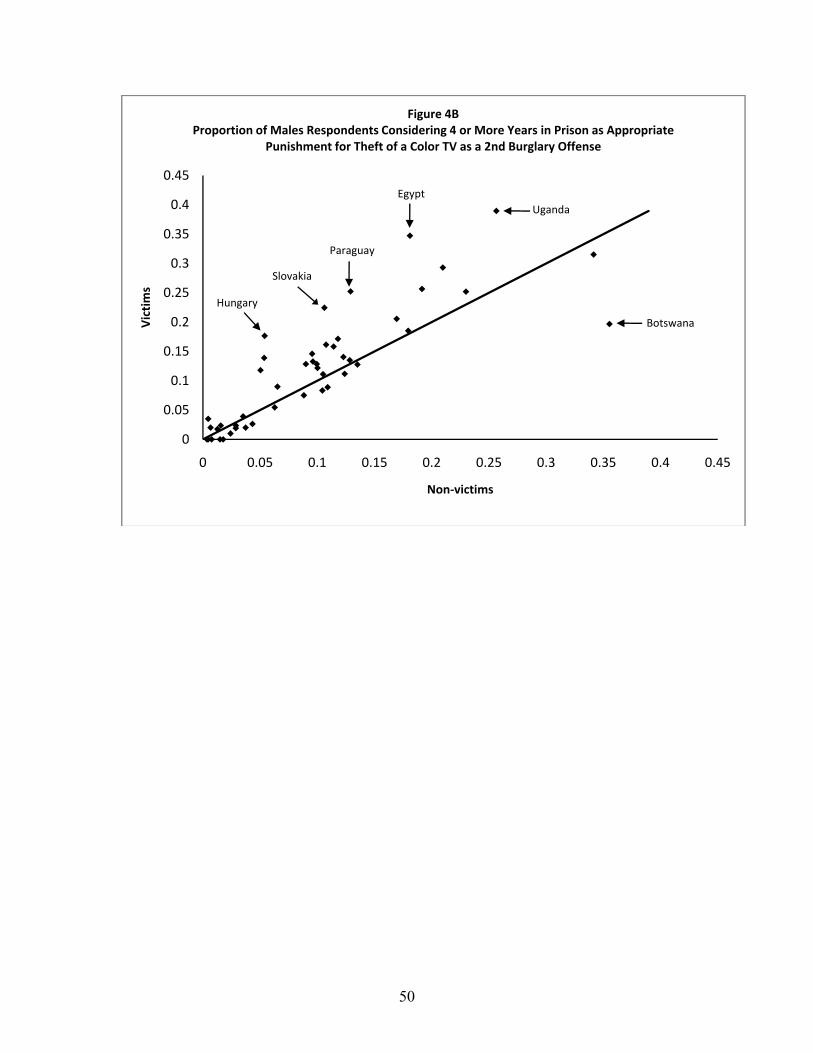
50
0
0.05
0.1
0.15
0.2
0.25
0.3
0.35
0.4
0.45
0 0.05 0.1 0.15 0.2 0.25 0.3 0.35 0.4 0.45
Victims
Non‐victims
Figure 4BProportion of Males Respondents Considering 4 or More Years in Prison as Appropriate
Punishment for Theft of a Color TV as a 2nd Burglary Offense
Botswana
UgandaEgypt
Paraguay
Slovakia
Hungary
51
References Acemoglu, Daron; Johnson, Simon; Robinson, James A. “The Colonial Origins of Comparative Development: An Empirical Investigation.” American Economic Review, 2001, 91: 1369-1401 Alesina, Alberto and Paola Giuliano. “The Power of Family,” NBER Working Paper 13051, April 2007. Bandes S., “Empathy, Narrative and Victim Impact Statements,” The University of Chicago Law Review, 1996, 63: 361-412. Becker, Gary S. “Crime and Punishment: An Economic Approach,” Journal of Political Economy. 1968; 76: 169-217. Bentham, Jeremy. An Introduction to the Principles of Morals and Legislation. 1823. London: W. Pickering. Cota-McKinley, Amy, William Douglas Woody, and Paul A. Bell, “Vengeance: Effects of Gender, Age and Religious Background,” 2001 Aggressive Behavior; 27: 343-50. Easterly, William and Ross Levine, “Africa's Growth Tragedy: Policies and Ethnic Divisions,” 1997; The Quarterly Journal of Economics, Vol. 112, No. 4, pp. 1203-50.i Fehr, Ernst and Gachter, Simon. “Fairness and Retaliation: The Economics of Reciprocity,” 2000. Journal of Economic Perspectives, 14(3) pp.159-81. Fernandez, Raquel and A. Fogli. “Fertility: The Role of Culture and Family Experience,” 2006; Journal of the European Economic Association, Vol. 4 no. 2-3, pp552-61. Finer, Samuel. “The History of Government, vol. I-III,” 1997; Cambridge, U.K.: Cambridge University Press. Fisman, Raymond and Edward Miguel. “Corruption, Norms, and Legal Enforcement: Evidence from Diplomatic Parking Tickets,” 2007. Journal of Political Economy, Vol. 115, no.6 pp.1020-48. Glaeser, Edward L. and Bruce Sacerdote, “Sentencing in Homicide Cases and the Role of Vengeance.” 2003, Journal of Legal Studies. Henrich, Joseph, Robert Boyd, Samuel Bowles, Colin Camerer, Ernst Fehr, Herbert Gintis and Richard McElreath. “In Search of Homo Economicus: Behavioral Experiments in 15 Small-Scale Societies,” 2001; The American Economic Review, Papers and Proceedings of the Hundred Thirteenth Annual Meeting of the American Economic Association, Vol. 91 No. 2 pp. 73-78.
52
Herrmann, Benedikt, Christian Thoni and Simon Gachter, “Antisocial Punishment Across Societies,” 2008; Science, Vol. 319, March, pp. 1362-67. Hoffmann, J. L. “Revenge or Mercy? Some Thoughts about Survivor Opinion Evidence in Death Penalty Cases.” Cornell Law Review, 2003, 88: 530-542. Hofstede, G. Culture’s Consequences: Comparing Values, Behaviors, Institutions and Organizations Across Nations, 2001. Thousand Oaks, CA: Sage. Hofstede G and G. J. Hofstede. Cultures and Organizations. Software of the Mind, 2005. New York: McGraw-Hill. Kim, S.H and R. H. Smith, “Revenge and Conflict Escalation,” 1993, Negotiation Journal; 9: 37-43. La Porta, R., F. Lopez-de-Silanes, A. Shleifer and R. Vishny. “The Quality of Government,” 1999. Journal of Law, Economics and Organization, 15, pp.222-79. Long, Katie, “Community Input at Sentencing: Victim’s Right or Victim’s Revenge?” 1995. Boston University Law Review, January 1995. Miguel, Edward, Sebastian Saiegh and Shanker Satyanath, “National Cultures and Soccer Violence,” NBER Working Paper 13968, March 2008 Mocan, Naci. “"What Determines Corruption? International Evidence From Micro Data". Forthcoming in Economic Inquiry. Nourse, V. F., Conceptualizing Criminal Law Defenses,” Pennsylvania Law Review, May, 2003. Oosterbeek, Hessel, Randolph Sloof and Gijs Van De Kuilen. “ Cultural Differences in Ultimatum Game Experiments: Evidence from a Meta-Analysis,” 2004. Experimental Economics, 7, pp.171-88. Rene, David and John Brierley. Major Legal Systems in the World Today, New York: The Free Press. Roeder, Philip G., “Ethnolinguistic Fractionalization (ELF) Indices, 1961 and 1985,” 2001. February 16. <http//:weber.ucsd.edu\~proeder\elf.htm>. Smith, Benjamin. “Oil Wealth and Regime Survival in the Developing World, 1960-1999,” 2004; American Journal of Political Science, 48 (2), pp.232-46. Stuckless N, and R. Goranson, “The Vengeance Scale: Development of a Measure of Attitudes Towards Revenge,” 1992; Journal of Social Behavior and Personality; 7: 25-42.
53
Wasserstrom, R. “Retribution and the Theory of Punishment,” The Journal of Philosophy, 1978; 75: 601-22. Whitman, James Q, “Symposium: Twenty-Five Years of George P. Fletcher’s Rethinking Criminal Law: Between Self-defense and Vengeance/ Between Social Contract and Monopoly of Violence,” 2004, Tulsa Law Review. Wiesenthal DL, Hennessy D and PM Gibson. “The Driving Vengeance Questionnaire (DVQ): the development of a scale to measure deviant drivers' attitudes.” Violence and Victims, 2000, 15(2):115-36.
Wilson, John. "The Purposes of Retribution." Philosophy, 1983, 58(226) pp. 521-27.
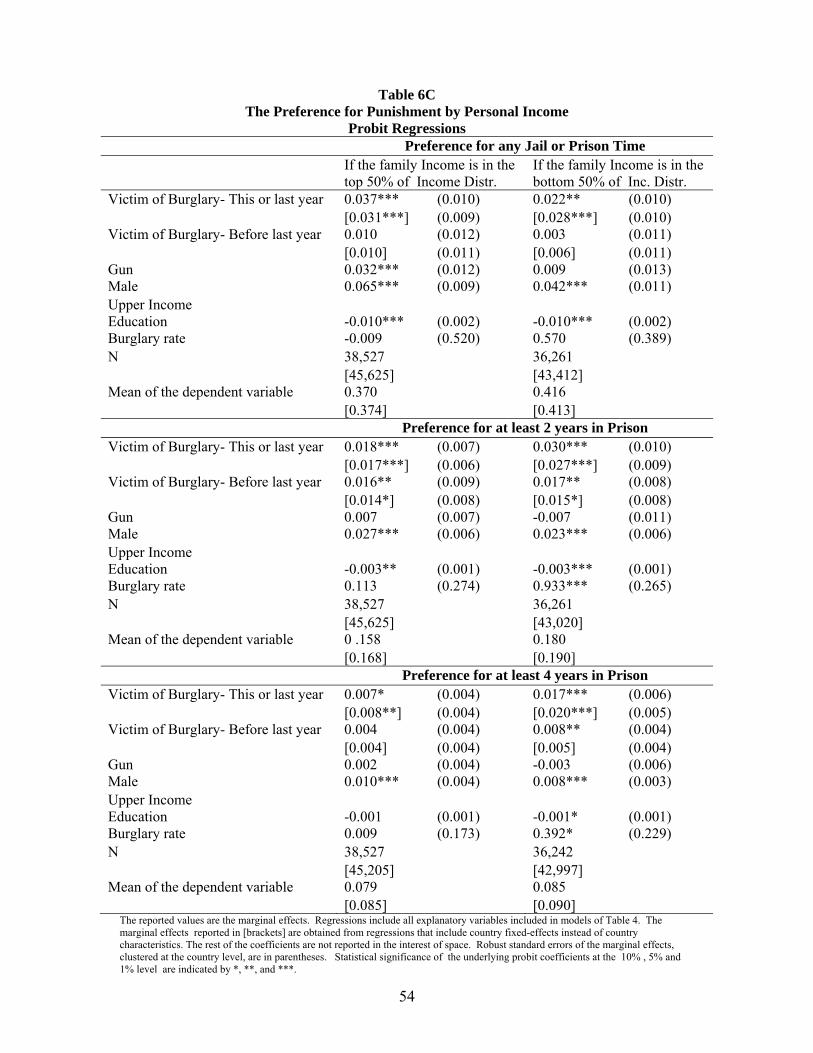
54
Table 6C The Preference for Punishment by Personal Income
Probit Regressions Preference for any Jail or Prison Time
If the family Income is in the top 50% of Income Distr.
If the family Income is in the bottom 50% of Inc. Distr.
Victim of Burglary- This or last year 0.037*** (0.010) 0.022** (0.010) [0.031***] (0.009) [0.028***] (0.010)Victim of Burglary- Before last year 0.010 (0.012) 0.003 (0.011) [0.010] (0.011) [0.006] (0.011)Gun 0.032*** (0.012) 0.009 (0.013)Male 0.065*** (0.009) 0.042*** (0.011)Upper Income Education -0.010*** (0.002) -0.010*** (0.002)Burglary rate -0.009 (0.520) 0.570 (0.389)N 38,527 36,261 [45,625] [43,412] Mean of the dependent variable 0.370 0.416
[0.374] [0.413] Preference for at least 2 years in Prison Victim of Burglary- This or last year 0.018*** (0.007) 0.030*** (0.010) [0.017***] (0.006) [0.027***] (0.009)Victim of Burglary- Before last year 0.016** (0.009) 0.017** (0.008) [0.014*] (0.008) [0.015*] (0.008)Gun 0.007 (0.007) -0.007 (0.011)Male 0.027*** (0.006) 0.023*** (0.006)Upper Income Education -0.003** (0.001) -0.003*** (0.001)Burglary rate 0.113 (0.274) 0.933*** (0.265)N 38,527 36,261 [45,625] [43,020] Mean of the dependent variable 0 .158 0.180
[0.168] [0.190] Preference for at least 4 years in Prison Victim of Burglary- This or last year 0.007* (0.004) 0.017*** (0.006) [0.008**] (0.004) [0.020***] (0.005)Victim of Burglary- Before last year 0.004 (0.004) 0.008** (0.004) [0.004] (0.004) [0.005] (0.004)Gun 0.002 (0.004) -0.003 (0.006)Male 0.010*** (0.004) 0.008*** (0.003)Upper Income Education -0.001 (0.001) -0.001* (0.001)Burglary rate 0.009 (0.173) 0.392* (0.229)N 38,527 36,242 [45,205] [42,997] Mean of the dependent variable 0.079 0.085
[0.085] [0.090] The reported values are the marginal effects. Regressions include all explanatory variables included in models of Table 4. The marginal effects reported in [brackets] are obtained from regressions that include country fixed-effects instead of country characteristics. The rest of the coefficients are not reported in the interest of space. Robust standard errors of the marginal effects, clustered at the country level, are in parentheses. Statistical significance of the underlying probit coefficients at the 10% , 5% and 1% level are indicated by *, **, and ***.
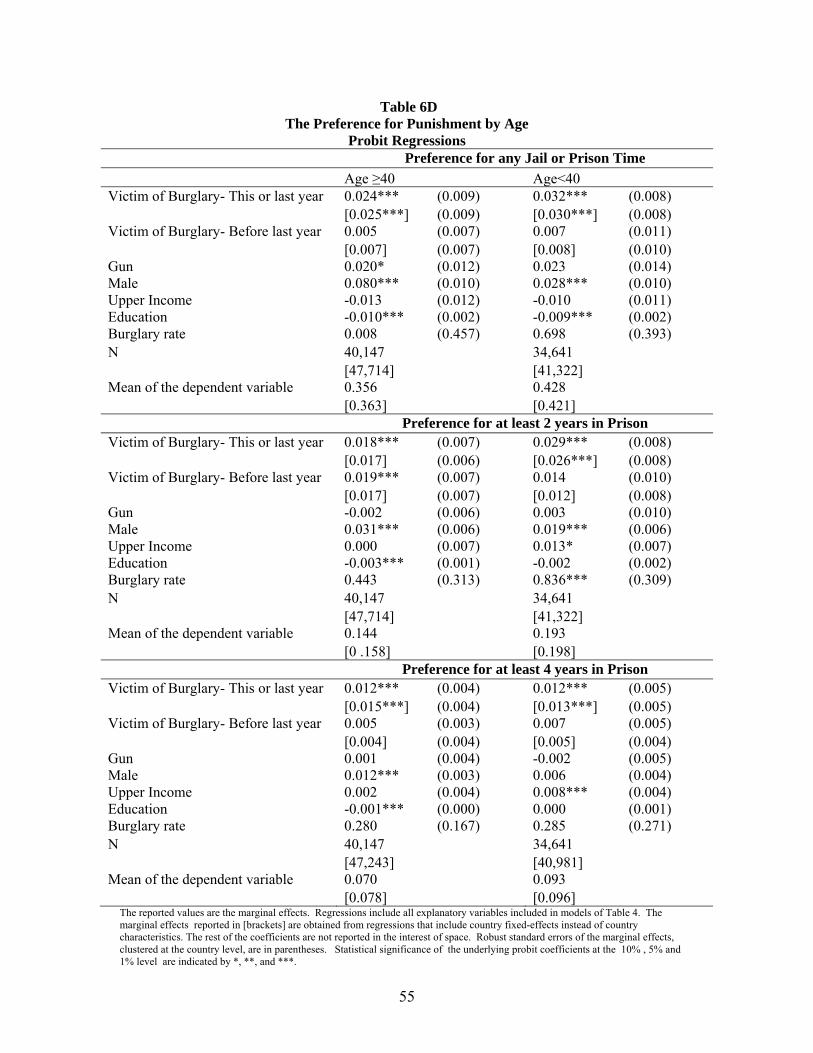
55
Table 6D
The Preference for Punishment by Age Probit Regressions
Preference for any Jail or Prison Time Age ≥40 Age<40 Victim of Burglary- This or last year 0.024*** (0.009) 0.032*** (0.008) [0.025***] (0.009) [0.030***] (0.008)Victim of Burglary- Before last year 0.005 (0.007) 0.007 (0.011) [0.007] (0.007) [0.008] (0.010)Gun 0.020* (0.012) 0.023 (0.014)Male 0.080*** (0.010) 0.028*** (0.010)Upper Income -0.013 (0.012) -0.010 (0.011)Education -0.010*** (0.002) -0.009*** (0.002)Burglary rate 0.008 (0.457) 0.698 (0.393)N 40,147 34,641 [47,714] [41,322] Mean of the dependent variable 0.356 0.428 [0.363] [0.421] Preference for at least 2 years in Prison Victim of Burglary- This or last year 0.018*** (0.007) 0.029*** (0.008) [0.017] (0.006) [0.026***] (0.008)Victim of Burglary- Before last year 0.019*** (0.007) 0.014 (0.010) [0.017] (0.007) [0.012] (0.008)Gun -0.002 (0.006) 0.003 (0.010)Male 0.031*** (0.006) 0.019*** (0.006)Upper Income 0.000 (0.007) 0.013* (0.007)Education -0.003*** (0.001) -0.002 (0.002)Burglary rate 0.443 (0.313) 0.836*** (0.309)N 40,147 34,641 [47,714] [41,322] Mean of the dependent variable 0.144 0.193 [0 .158] [0.198] Preference for at least 4 years in Prison Victim of Burglary- This or last year 0.012*** (0.004) 0.012*** (0.005) [0.015***] (0.004) [0.013***] (0.005)Victim of Burglary- Before last year 0.005 (0.003) 0.007 (0.005) [0.004] (0.004) [0.005] (0.004)Gun 0.001 (0.004) -0.002 (0.005)Male 0.012*** (0.003) 0.006 (0.004)Upper Income 0.002 (0.004) 0.008*** (0.004)Education -0.001*** (0.000) 0.000 (0.001)Burglary rate 0.280 (0.167) 0.285 (0.271)N 40,147 34,641 [47,243] [40,981] Mean of the dependent variable 0.070 0.093 [0.078] [0.096]
The reported values are the marginal effects. Regressions include all explanatory variables included in models of Table 4. The marginal effects reported in [brackets] are obtained from regressions that include country fixed-effects instead of country characteristics. The rest of the coefficients are not reported in the interest of space. Robust standard errors of the marginal effects, clustered at the country level, are in parentheses. Statistical significance of the underlying probit coefficients at the 10% , 5% and 1% level are indicated by *, **, and ***.
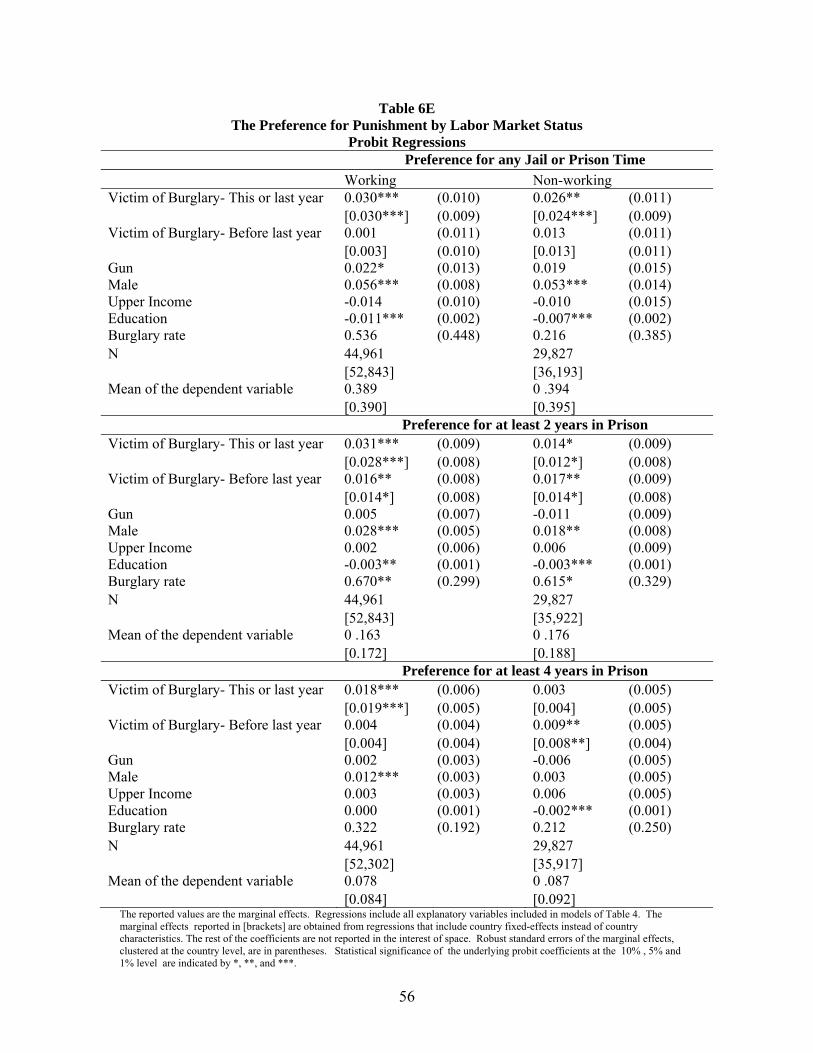
56
Table 6E
The Preference for Punishment by Labor Market Status Probit Regressions
Preference for any Jail or Prison Time Working Non-working Victim of Burglary- This or last year 0.030*** (0.010) 0.026** (0.011) [0.030***] (0.009) [0.024***] (0.009)Victim of Burglary- Before last year 0.001 (0.011) 0.013 (0.011) [0.003] (0.010) [0.013] (0.011)Gun 0.022* (0.013) 0.019 (0.015)Male 0.056*** (0.008) 0.053*** (0.014)Upper Income -0.014 (0.010) -0.010 (0.015)Education -0.011*** (0.002) -0.007*** (0.002)Burglary rate 0.536 (0.448) 0.216 (0.385)N 44,961 29,827 [52,843] [36,193] Mean of the dependent variable 0.389 0 .394
[0.390] [0.395] Preference for at least 2 years in Prison Victim of Burglary- This or last year 0.031*** (0.009) 0.014* (0.009) [0.028***] (0.008) [0.012*] (0.008)Victim of Burglary- Before last year 0.016** (0.008) 0.017** (0.009) [0.014*] (0.008) [0.014*] (0.008)Gun 0.005 (0.007) -0.011 (0.009)Male 0.028*** (0.005) 0.018** (0.008)Upper Income 0.002 (0.006) 0.006 (0.009)Education -0.003** (0.001) -0.003*** (0.001)Burglary rate 0.670** (0.299) 0.615* (0.329)N 44,961 29,827 [52,843] [35,922] Mean of the dependent variable 0 .163 0 .176
[0.172] [0.188] Preference for at least 4 years in Prison Victim of Burglary- This or last year 0.018*** (0.006) 0.003 (0.005) [0.019***] (0.005) [0.004] (0.005)Victim of Burglary- Before last year 0.004 (0.004) 0.009** (0.005) [0.004] (0.004) [0.008**] (0.004)Gun 0.002 (0.003) -0.006 (0.005)Male 0.012*** (0.003) 0.003 (0.005)Upper Income 0.003 (0.003) 0.006 (0.005)Education 0.000 (0.001) -0.002*** (0.001)Burglary rate 0.322 (0.192) 0.212 (0.250)N 44,961 29,827 [52,302] [35,917] Mean of the dependent variable 0.078 0 .087
[0.084] [0.092] The reported values are the marginal effects. Regressions include all explanatory variables included in models of Table 4. The marginal effects reported in [brackets] are obtained from regressions that include country fixed-effects instead of country characteristics. The rest of the coefficients are not reported in the interest of space. Robust standard errors of the marginal effects, clustered at the country level, are in parentheses. Statistical significance of the underlying probit coefficients at the 10% , 5% and 1% level are indicated by *, **, and ***.

57
Table 6F The Preference for Punishment by Local Crime
Probit Regressions Preference for any Jail or Prison Time High Burglary Rate Low Burglary Rate Victim of Burglary- This or last year 0.037*** (0.007) 0.003 (0.014) [0.035***] (0.007) [0.006] (0.015)Victim of Burglary- Before last year 0.007 (0.008) 0.007 (0.012) [0.009] (0.009) [0.008] (0.012)Gun 0.011 (0.011) 0.036*** (0.013)Male 0.058*** (0.009) 0.047*** (0.012)Upper Income -0.019 (0.013) -0.002 (0.008)Education -0.010*** (0.002) -0.010*** (0.002)Burglary rate 0.666 (0.464) 0.957 (1.005)N 47,678 27,110 [59,633] [28,964] Mean of the dependent variable 0.409 0.359
[0.407] [0.369] Preference for at least 2 years in Prison Victim of Burglary- This or last year 0.030*** (0.009) 0.009 (0.007) [0.026***] (0.007) [0.009] (0.008)Victim of Burglary- Before last year 0.016*** (0.006) 0.020** (0.010) [0.014**] (0.007) [0.019**] (0.010)Gun -0.011 (0.007) 0.015** (0.007)Male 0.026*** (0.007) 0.022*** (0.005)Upper Income 0.006 (0.008) 0.002 (0.005)Education -0.004*** (0.001) -0.002* (0.001)Burglary rate 0.438 (0.422) 0.519 (0.749)N 47,678 27,110 [59,633] [28,964] Mean of the dependent variable 0.192 0.126
[0.200] [0.136] Preference for at least 4 years in Prison Victim of Burglary- This or last year 0.016*** (0.006) 0.002 (0.006) [0.016***] (0.005) [0.005] (0.007)Victim of Burglary- Before last year 0.007* (0.004) 0.006 (0.005) [0.005] (0.004) [0.008] (0.006)Gun -0.005 (0.004) 0.006 (0.004)Male 0.009** (0.004) 0.007*** (0.003)Upper Income 0.007* (0.004) 0.002 (0.003)Education -0.002*** (0.001) 0.000 (0.000)Burglary rate 0.179 (0.293) 0.179 (0.595)N 47,678 27,110 [59,633] [28,152] Mean of the dependent variable 0.095 0.057
[0.100] [0.063] The reported values are the marginal effects. Regressions include all explanatory variables included in models of Table 4. The marginal effects reported in [brackets] are obtained from regressions that include country fixed-effects instead of country characteristics. The rest of the coefficients are not reported in the interest of space. Robust standard errors of the marginal effects, clustered at the country level, are in parentheses. Statistical significance of the underlying probit coefficients at the 10% , 5% and 1% level are indicated by *, **, and ***.

58
Table 6G The Preference for Punishment by Country Income
Probit Regressions Preference for any Jail or Prison Time Per-capita GDP>$8,000 Per-capita GDP≤$8,000Victim of Burglary- This or last year 0.021*** (0.008) 0.034*** (0.012) [0.025***] (0.008) [0.030***] (0.010)Victim of Burglary- Before last year 0.004 (0.008) 0.008 (0.018) [0.009] (0.008) [0.004] (0.016)Gun 0.024** (0.011) 0.021 (0.024)Male 0.065*** (0.008) 0.010 (0.024)Upper Income -0.019** (0.009) 0.011 (0.014)Education -0.010*** (0.002) -0.009*** (0.003)Burglary rate -0.251 (0.294) 0.078 (0.559)N 56,986 17,802 [60,337] [28,700]
Mean of the dependent variable 0.335 0.568 [0.337] [0.506]
Preference for at least 2 years in Prison Victim of Burglary- This or last year 0.009 (0.006) 0.058*** (0.014) [0.008] (0.006) [0.044***] (0.011)Victim of Burglary- Before last year 0.008 (0.007) 0.044*** (0.016) [0.010*] (0.006) [0.025**] (0.012)Gun 0.003 (0.004) 0.008 (0.030)Male 0.021*** (0.004) 0.032* (0.018)Upper Income 0.001 (0.006) 0.015 (0.013)Education -0.004*** (0.001) -0.004* (0.002)Burglary rate 0.170 (0.174) 0.204 (0.765)N 56,986 17,802 [60,337] [28,700]
Mean of the dependent variable 0.114 0.341 [0.114] [0.309]
Preference for at least 4 years in Prison Victim of Burglary- This or last year 0.004 (0.003) 0.035*** (0.014) [0.004] (0.003) [0.034***] (0.009)Victim of Burglary- Before last year 0.001 (0.003) 0.026*** (0.011) [0.003] (0.003) [0.013*] (0.008)Gun 0.002 (0.002) -0.004 (0.016)Male 0.008*** (0.002) 0.004 (0.010)Upper Income 0.002 (0.003) 0.014 (0.011)Education -0.001*** (0.000) -0.003*** (0.001)Burglary rate 0.003 (0.102) 0.071 (0.554)N 56,986 17,802 [59,525] [28,700]
Mean of the dependent variable 0.049 0.183 [0.050] [0.164]
The reported values are the marginal effects. Regressions include all explanatory variables included in models of Table 4. The marginal effects reported in [brackets] are obtained from regressions that include country fixed-effects instead of country characteristics. The rest of the coefficients are not reported in the interest of space. Robust standard errors of the marginal effects, clustered at the country level, are in parentheses. Statistical significance of the underlying probit coefficients at the 10% , 5% and 1% level are indicated by *, **, and ***.

59
Table 6H The Preference for Punishment by Country Individualism
Probit Regressions Preference for any Jail or Prison Time Highly- Indiv. Society Collectivist Society Victim of Burglary- This or last year 0.024*** (0.008) 0.031*** (0.011) [0.024***] (0.008) [0.031***] (0.011)Victim of Burglary- Before last year 0.010 (0.011) -0.002 (0.011) [0.008] (0.009) [0.004] (0.010)Gun 0.019 (0.014) 0.042*** (0.015)Male 0.069*** (0.010) 0.037*** (0.012)Upper Income -0.024*** (0.009) -0.004 (0.014)Education -0.013*** (0.003) -0.012*** (0.003)Burglary rate 0.277 (0.194) 0.637 (0.406)N 37,824 36,964 [52,073] [36,964] Mean of the dependent variable 0.368 0.414 [0.376] [0.414] Preference for at least 2 years in Prison Victim of Burglary- This or last year 0.003 (0.006) 0.042*** (0.008) [0.007] (0.006) [0.040] (0.008)Victim of Burglary- Before last year 0.015** (0.007) 0.019** (0.010) [0.011] (0.008) [0.018] (0.009)Gun 0.000 (0.006) 0.016* (0.009)Male 0.020*** (0.006) 0.029*** (0.007)Upper Income -0.006 (0.005) 0.012 (0.009)Education -0.004*** (0.001) -0.004*** (0.001)Burglary rate 0.580*** (0.145) 0.460 (0.403)N 37,824 36,964 [52,073] [36,964] Mean of the dependent variable 0.128 0.208 [0.156] [0.208] Preference for at least 4 years in Prison Victim of Burglary- This or last year 0.004 (0.003) 0.017*** (0.007) [0.011***] (0.004) [0.016***] (0.006)Victim of Burglary- Before last year 0.005* (0.003) 0.008 (0.005) [0.002] (0.004) [0.007] (0.005)Gun 0.002 (0.003) 0.003 (0.007)Male 0.009** (0.004) 0.007** (0.003)Upper Income -0.002 (0.003) 0.010** (0.004)Education -0.002*** (0.000) -0.002*** (0.001)Burglary rate 0.258** (0.110) 0.126 (0.250)N 37,012 36,964 [51,261] [36,964] Mean of the dependent variable 0.061 0.103 [0.076] [0.103]
The reported values are the marginal effects. Regressions include all explanatory variables included in models of Table 4. The marginal effects reported in [brackets] are obtained from regressions that include country fixed-effects instead of country characteristics. The rest of the coefficients are not reported in the interest of space. Robust standard errors of the marginal effects, clustered at the country level, are in parentheses. Statistical significance of the underlying probit coefficients at the 10% , 5% and 1% level are indicated by *, **, and ***.
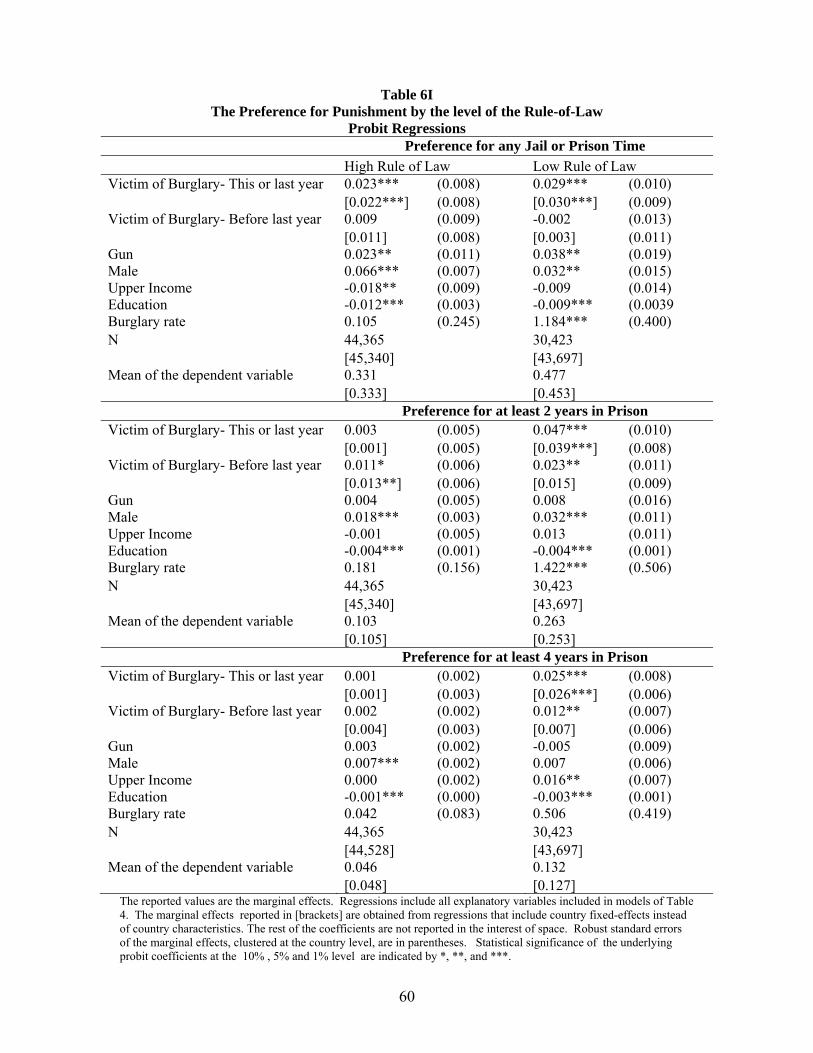
60
Table 6I The Preference for Punishment by the level of the Rule-of-Law
Probit Regressions Preference for any Jail or Prison Time High Rule of Law Low Rule of Law Victim of Burglary- This or last year 0.023*** (0.008) 0.029*** (0.010) [0.022***] (0.008) [0.030***] (0.009)Victim of Burglary- Before last year 0.009 (0.009) -0.002 (0.013) [0.011] (0.008) [0.003] (0.011)Gun 0.023** (0.011) 0.038** (0.019)Male 0.066*** (0.007) 0.032** (0.015)Upper Income -0.018** (0.009) -0.009 (0.014)Education -0.012*** (0.003) -0.009*** (0.0039Burglary rate 0.105 (0.245) 1.184*** (0.400)N 44,365 30,423 [45,340] [43,697] Mean of the dependent variable 0.331 0.477 [0.333] [0.453] Preference for at least 2 years in Prison Victim of Burglary- This or last year 0.003 (0.005) 0.047*** (0.010) [0.001] (0.005) [0.039***] (0.008)Victim of Burglary- Before last year 0.011* (0.006) 0.023** (0.011) [0.013**] (0.006) [0.015] (0.009)Gun 0.004 (0.005) 0.008 (0.016)Male 0.018*** (0.003) 0.032*** (0.011)Upper Income -0.001 (0.005) 0.013 (0.011)Education -0.004*** (0.001) -0.004*** (0.001)Burglary rate 0.181 (0.156) 1.422*** (0.506)N 44,365 30,423 [45,340] [43,697] Mean of the dependent variable 0.103 0.263 [0.105] [0.253] Preference for at least 4 years in Prison Victim of Burglary- This or last year 0.001 (0.002) 0.025*** (0.008) [0.001] (0.003) [0.026***] (0.006)Victim of Burglary- Before last year 0.002 (0.002) 0.012** (0.007) [0.004] (0.003) [0.007] (0.006)Gun 0.003 (0.002) -0.005 (0.009)Male 0.007*** (0.002) 0.007 (0.006)Upper Income 0.000 (0.002) 0.016** (0.007)Education -0.001*** (0.000) -0.003*** (0.001)Burglary rate 0.042 (0.083) 0.506 (0.419)N 44,365 30,423 [44,528] [43,697] Mean of the dependent variable 0.046 0.132 [0.048] [0.127]
The reported values are the marginal effects. Regressions include all explanatory variables included in models of Table 4. The marginal effects reported in [brackets] are obtained from regressions that include country fixed-effects instead of country characteristics. The rest of the coefficients are not reported in the interest of space. Robust standard errors of the marginal effects, clustered at the country level, are in parentheses. Statistical significance of the underlying probit coefficients at the 10% , 5% and 1% level are indicated by *, **, and ***.
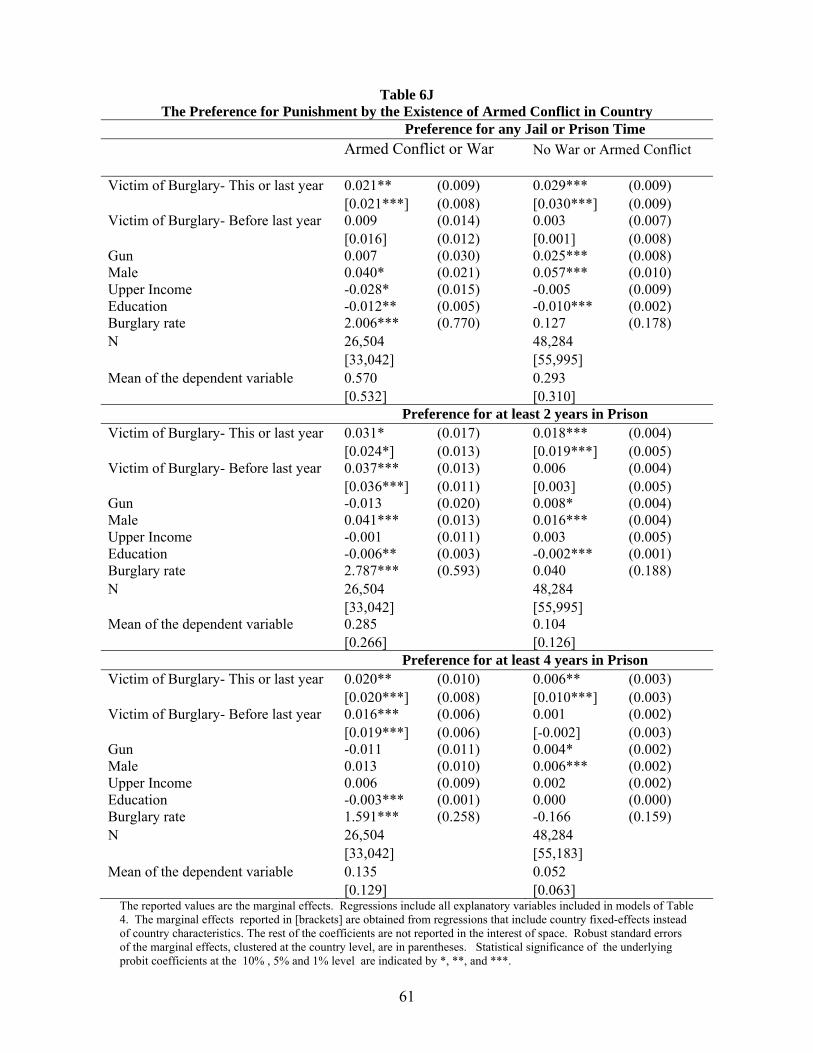
61
Table 6J The Preference for Punishment by the Existence of Armed Conflict in Country
Preference for any Jail or Prison Time
Armed Conflict or War
No War or Armed Conflict
Victim of Burglary- This or last year 0.021** (0.009) 0.029*** (0.009) [0.021***] (0.008) [0.030***] (0.009)Victim of Burglary- Before last year 0.009 (0.014) 0.003 (0.007) [0.016] (0.012) [0.001] (0.008)Gun 0.007 (0.030) 0.025*** (0.008)Male 0.040* (0.021) 0.057*** (0.010)Upper Income -0.028* (0.015) -0.005 (0.009)Education -0.012** (0.005) -0.010*** (0.002)Burglary rate 2.006*** (0.770) 0.127 (0.178)N 26,504 48,284 [33,042] [55,995] Mean of the dependent variable 0.570 0.293 [0.532] [0.310] Preference for at least 2 years in Prison Victim of Burglary- This or last year 0.031* (0.017) 0.018*** (0.004) [0.024*] (0.013) [0.019***] (0.005)Victim of Burglary- Before last year 0.037*** (0.013) 0.006 (0.004) [0.036***] (0.011) [0.003] (0.005)Gun -0.013 (0.020) 0.008* (0.004)Male 0.041*** (0.013) 0.016*** (0.004)Upper Income -0.001 (0.011) 0.003 (0.005)Education -0.006** (0.003) -0.002*** (0.001)Burglary rate 2.787*** (0.593) 0.040 (0.188)N 26,504 48,284 [33,042] [55,995] Mean of the dependent variable 0.285 0.104 [0.266] [0.126] Preference for at least 4 years in Prison Victim of Burglary- This or last year 0.020** (0.010) 0.006** (0.003) [0.020***] (0.008) [0.010***] (0.003)Victim of Burglary- Before last year 0.016*** (0.006) 0.001 (0.002) [0.019***] (0.006) [-0.002] (0.003)Gun -0.011 (0.011) 0.004* (0.002)Male 0.013 (0.010) 0.006*** (0.002)Upper Income 0.006 (0.009) 0.002 (0.002)Education -0.003*** (0.001) 0.000 (0.000)Burglary rate 1.591*** (0.258) -0.166 (0.159)N 26,504 48,284 [33,042] [55,183] Mean of the dependent variable 0.135 0.052 [0.129] [0.063]
The reported values are the marginal effects. Regressions include all explanatory variables included in models of Table 4. The marginal effects reported in [brackets] are obtained from regressions that include country fixed-effects instead of country characteristics. The rest of the coefficients are not reported in the interest of space. Robust standard errors of the marginal effects, clustered at the country level, are in parentheses. Statistical significance of the underlying probit coefficients at the 10% , 5% and 1% level are indicated by *, **, and ***.

62
Table 6K Preference for Punishment by Country Education
Preference for any Jail or Prison Time
Country Education above World Median
Country Education below World Median
Victim of Burglary- This or last year 0.022*** (0.007) 0.038*** (0.013) [0.023***] (0.008) [0.039***] (0.011)Victim of Burglary- Before last year 0.006 (0.008) 0.009 (0.017) [0.003] (0.008) [0.019] (0.015)Gun 0.020** (0.010) 0.048*** (0.018)Male 0.062*** (0.008) 0.017 (0.023)Upper Income -0.011 (0.010) -0.011 (0.017)Education -0.010*** (0.002) -0.011*** (0.003)Burglary rate -0.015 (0.263) -0.609 (0.728)N 56,690 18,098 [66,451] [22,586] Mean of the dependent variable 0.341 0.547 [0.353] [0.508] Preference for at least 2 years in Prison Victim of Burglary- This or last year 0.010* (0.006) 0.055*** (0.012) [0.011*] (0.006) [0.046***] (0.010)Victim of Burglary- Before last year 0.009 (0.007) 0.041*** (0.015) [0.006] (0.007) [0.036***] (0.012)Gun 0.000 (0.005) 0.018 (0.017)Male 0.020*** (0.005) 0.039*** (0.013)Upper Income 0.003 (0.006) 0.009 (0.013)Education -0.004*** (0.001) -0.004** (0.002)Burglary rate 0.225 (0.180) -0.285 (0.741)N 56,690 18,098 [66,451] [22,586] Mean of the dependent variable 0.129 0.290 [0.150] [0.259] Preference for at least 4 years in Prison Victim of Burglary- This or last year 0.005** (0.003) 0.029*** (0.012) [0.009***] (0.003) [0.027***] (0.009)Victim of Burglary- Before last year 0.002 (0.002) 0.017* (0.010) [0.001] (0.003) [0.017**] (0.008)Gun 0.000 (0.002) 0.005 (0.014)Male 0.007*** (0.003) 0.010 (0.007)Upper Income 0.003 (0.003) 0.007 (0.010)Education -0.002*** (0.000) -0.002** (0.001)Burglary rate 0.058 (0.095) -0.168 (0.416)N 56,690 18,098 [65,639] [22,586] Mean of the dependent variable 0.060 0.150 [0.072] [0.132]
The reported values are the marginal effects. Regressions include all explanatory variables included in models of Table 4. The values reported in [brackets] are the obtained from the regressions that include country fixed-effects instead of country characteristics. The rest of the coefficients are not reported in the interest of space. Robust standard errors of the marginal effects, clustered at the country level, are in parentheses. Statistical significance of the underlying probit coefficients at the 10% , 5% and 1% level are indicated by *, **, and ***.
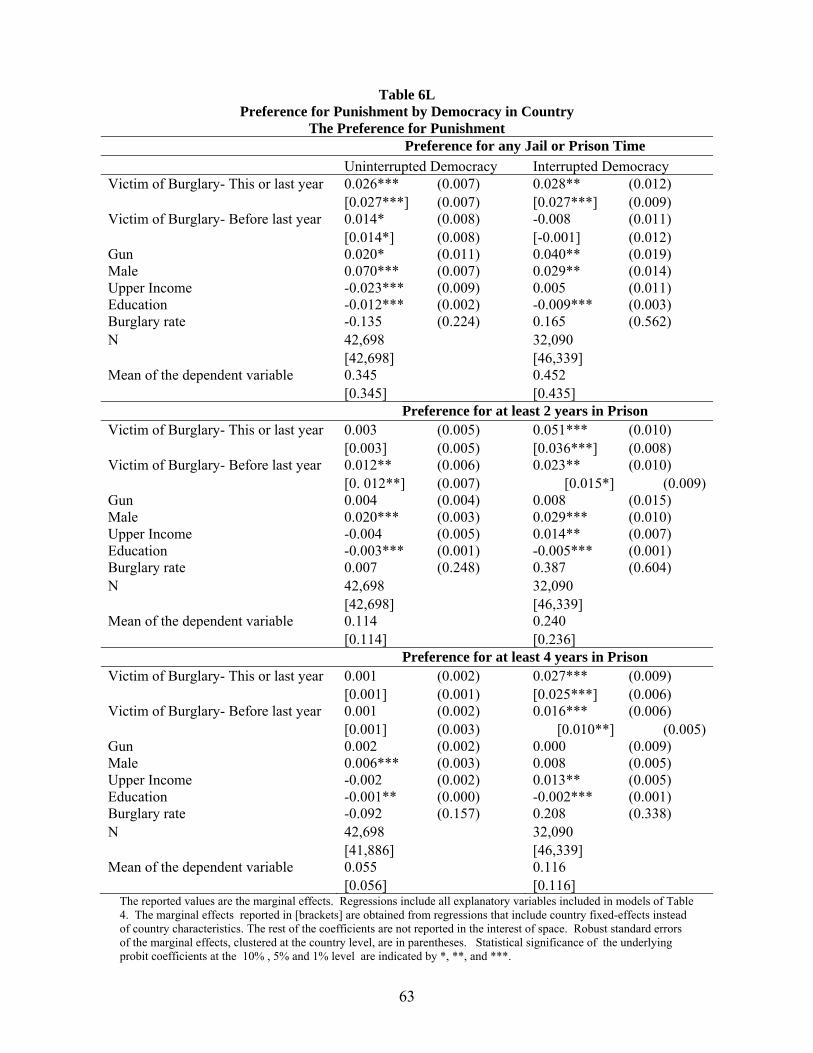
63
Table 6L Preference for Punishment by Democracy in Country
The Preference for Punishment Preference for any Jail or Prison Time Uninterrupted Democracy Interrupted DemocracyVictim of Burglary- This or last year 0.026*** (0.007) 0.028** (0.012) [0.027***] (0.007) [0.027***] (0.009)Victim of Burglary- Before last year 0.014* (0.008) -0.008 (0.011) [0.014*] (0.008) [-0.001] (0.012)Gun 0.020* (0.011) 0.040** (0.019)Male 0.070*** (0.007) 0.029** (0.014)Upper Income -0.023*** (0.009) 0.005 (0.011)Education -0.012*** (0.002) -0.009*** (0.003)Burglary rate -0.135 (0.224) 0.165 (0.562)N 42,698 32,090 [42,698] [46,339] Mean of the dependent variable 0.345 0.452 [0.345] [0.435] Preference for at least 2 years in Prison Victim of Burglary- This or last year 0.003 (0.005) 0.051*** (0.010) [0.003] (0.005) [0.036***] (0.008)Victim of Burglary- Before last year 0.012** (0.006) 0.023** (0.010) [0. 012**] (0.007) [0.015*] (0.009)Gun 0.004 (0.004) 0.008 (0.015)Male 0.020*** (0.003) 0.029*** (0.010)Upper Income -0.004 (0.005) 0.014** (0.007)Education -0.003*** (0.001) -0.005*** (0.001)Burglary rate 0.007 (0.248) 0.387 (0.604)N 42,698 32,090 [42,698] [46,339] Mean of the dependent variable 0.114 0.240 [0.114] [0.236] Preference for at least 4 years in Prison Victim of Burglary- This or last year 0.001 (0.002) 0.027*** (0.009) [0.001] (0.001) [0.025***] (0.006)Victim of Burglary- Before last year 0.001 (0.002) 0.016*** (0.006) [0.001] (0.003) [0.010**] (0.005)Gun 0.002 (0.002) 0.000 (0.009)Male 0.006*** (0.003) 0.008 (0.005)Upper Income -0.002 (0.002) 0.013** (0.005)Education -0.001** (0.000) -0.002*** (0.001)Burglary rate -0.092 (0.157) 0.208 (0.338)N 42,698 32,090 [41,886] [46,339] Mean of the dependent variable 0.055 0.116 [0.056] [0.116]
The reported values are the marginal effects. Regressions include all explanatory variables included in models of Table 4. The marginal effects reported in [brackets] are obtained from regressions that include country fixed-effects instead of country characteristics. The rest of the coefficients are not reported in the interest of space. Robust standard errors of the marginal effects, clustered at the country level, are in parentheses. Statistical significance of the underlying probit coefficients at the 10% , 5% and 1% level are indicated by *, **, and ***.

64
Table 6M Preference for Punishment by Ethno-linguistics Fragmentation
Probit Regressions Preference for any Jail or Prison Time Heterogeneous Society Homogenous SocietyVictim of Burglary- This or last year 0.029*** (0.008) 0.023* (0.012) [0.032***] (0.007) [0.018*] (0.011)Victim of Burglary- Before last year 0.005 (0.011) 0.010 (0.009) [0.010] (0.010) [0.002] (0.010)Gun 0.019 (0.015) 0.037*** (0.011)Male 0.050*** (0.014) 0.056*** (0.012)Upper Income -0.006 (0.017) -0.011 (0.007)Education -0.012*** (0.003) -0.009*** (0.002)Burglary rate 0.766*** (0.310) 0.096 (0.406)N 36,902 37,886 [46,437] [42,600] Mean of the dependent variable 0.482 0.303 [0.460] [0.318] Preference for at least 2 years in Prison Victim of Burglary- This or last year 0.027*** (0.011) 0.018*** (0.006) [0.027***] (0.009) [0.013***] (0.005)Victim of Burglary- Before last year 0.027*** (0.009) 0.005 (0.006) [0.025***] (0.008) [0.001] (0.007)Gun 0.001 (0.009) 0.011*** (0.005)Male 0.032*** (0.009) 0.017*** (0.004)Upper Income 0.015 (0.012) 0.000 (0.005)Education -0.005** (0.002) -0.004*** (0.001)Burglary rate 1.099*** (0.434) 0.396 (0.290)N 36,902 37,886 [46,437] [42,600] Mean of the dependent variable 0.214 0.124 [0.218] [0.133] Preference for at least 4 years in Prison Victim of Burglary- This or last year 0.015** (0.007) 0.008** (0.004) [0.019***] (0.006) [0.009***] (0.004)Victim of Burglary- Before last year 0.009** (0.005) 0.003 (0.004) [0.007] (0.005) [0.003] (0.004)Gun 0.000 (0.006) 0.005 (0.004)Male 0.011* (0.007) 0.006*** (0.002)Upper Income 0.014* (0.008) 0.000 (0.003)Education -0.002*** (0.001) -0.001*** (0.000)Burglary rate 0.421 (0.380) 0.132 (0.120)N 36,090 37,886 [45,625] [42,600] Mean of the dependent variable 0.110 0.056 [0.113] [0.060]
The reported values are the marginal effects. Regressions include all explanatory variables included in models of Table 4. The values reported in [brackets] are the obtained from the regressions that include country fixed-effects instead of country characteristics. The rest of the coefficients are not reported in the interest of space. Robust standard errors of the marginal effects, clustered at the country level, are in parentheses. Statistical significance of the underlying probit coefficients at the 10% , 5% and 1% level are indicated by *, **, and ***.