venezuelan states: a descriptive study based on the
TRANSCRIPT

Page 1/17
The malaria burden of Amerindian groups of threeVenezuelan states: A descriptive study based onprogrammatic dataJuan Carlos Gabaldon-Figueira ( jgabaldon�@unav.es )
Clinica Universidad de Navarra https://orcid.org/0000-0002-2525-0263Carlos Chaccour
ISGlobal: Instituto de Salud Global BarcelonaJorge E Moreno
Instituto de Altos Estudios Dr Arnoldo GabaldonMaria Villegas
Global Development One; Asociación Civil Impacto Social (ASOCIS)Leopoldo Villegas
Global Development One; Asociación Civil Impacto Social (ASOCIS)
Research
Keywords: Malaria, Venezuela, Amerindian groups, Amazonas, Bolivar, Sucre
Posted Date: March 10th, 2021
DOI: https://doi.org/10.21203/rs.3.rs-288810/v1
License: This work is licensed under a Creative Commons Attribution 4.0 International License. ReadFull License

Page 2/17
AbstractBackground: Fifty-three percent of all cases of malaria in the Americas in 2019 came from Venezuela, wherethe epidemic is heavily focused south of the Orinoco river, and where most of the country’s Amerindiangroups live. Despite the disease is known to represent a signi�cant public health problem among thesepopulations, little epidemiological data exists on the subject. This study aims to provide information onmalaria incidence, geospatial clustering, and risk factors associated to Plasmodium falciparum infectionamong these groups.
Methods: This is a descriptive study based on the analysis of published and unpublished
programmatic data collected by Venezuelan health authorities and non-government
organizations between 2014 and 2018. The Annual Parasite Index among indigenous groups (API-i) inmunicipalities of three states: Amazonas, Bolivar and Sucre was calculated and
compared using the Kruskal Wallis test, risk factors for P. falciparum infection were identi�ed
via binomial logistic regression and maps were constructed to identify clusters of malaria
cases among indigenous patients via Moran’s I and Getis-Ord’s hot spot analysis.
Results: 116,097 cases of malaria in Amerindian groups were registered during the study period. Anincreasing trend was observed between 2014 and 2016 but reverted in 2018. Malaria incidence remainshigher than in 2014 and hot spots were identi�ed in the three states, although more importantly south ofBolivar. Most cases (73.3%) were caused by P. vivax, but the Hoti and Yanomami indigenous groupspresented higher odds for infection with P. falciparum.
Conclusion: Malaria cases among Amerindian populations increased between 2014 and 2018 and seem tohave a different geographic distribution as those among the general population. Our �ndings suggest thattailored, cost-effective interventions will be needed to curb the negative impact of malaria transmission inthese groups. Attention to the Hoti and Yanomami should be prioritized.
BackgroundMalaria is a major public health concern in the Americas, where 889,000 cases and 550 deaths wereestimated to have occurred in 2019. Fifty-three percent of these cases, and 73% of all deaths came fromVenezuela, where incidence has increased in over 1,000% in the last two decades, amidst a context ofeconomic crisis and political unrest.[1] The disease disproportionally affects regions south of the OrinocoRiver, where cases are clustered in the Sifontes municipality, of the Bolivar state[2]. There is a signi�cantlylesser burden in the northeast coast of the country.[3] By 2016, the last year with detailed publicepidemiological data, only three states: Bolívar, Amazonas (south of the country) and Sucre (northeast),accounted for 90% of all registered cases[4]. Plasmodium vivax causes 77% of all registered cases, followedby P. falciparum, with 16%, and mixed infections (6.5%). P. malariae is rare and underdiagnosed.[1]

Page 3/17
The total Amerindian population in Venezuela was estimated to surpass 720,000 people in 2011, [5] most ofwhich are concentrated in malaria-endemic regions. These indigenous groups are particularly vulnerable,given a historically poor access to healthcare services and antimalarial medication, as well as the expansionof illegal mining across their territories.[6, 7] Epidemiological studies in other endemic regions of SouthAmerica have demonstrated that malaria transmission in indigenous communities responds toepidemiological factors different to those in the general population.[8] Moreover, the increasingly importantin�uence of illegal mining in said transmission dynamics has not been studied in detail and has beentraditionally limited to a few settlements along the Caura River basin.[7, 9, 10].
This work analyses published, and unpublished epidemiological records collected by Venezuelan healthauthorities and Non-Government Organizations (NGOs), between 2014 and 2018. The aim is to provideinformation on the general burden of malaria among the indigenous people of Amazonas, Bolivar, and Sucrestates, describe differences in regional incidence, spatial clustering, risk factors for infection with P.falciparum, and transmission seasonality.
Materials And MethodsThis is a descriptive study based on the analysis of programmatic data collected by Venezuelan healthauthorities and NGOs in three Venezuelan states. Morbidity data from 2014 until 2017 was obtained frompublicly available sources,[4, 11-13] while data from 2018 was retrieved from raw datasets and reportscollected by local volunteers (Unpublished datasets, Venezuelan Ministry of Health). All data sources are partof a national passive malaria surveillance program. As per national guidelines, only symptomatic patientsseeking care at a public health facility are tested, either with thin and thick blood �lms, or a rapid diagnostictest (RDT). Only new cases are included in registries, and are de�ned by the Venezuelan Health Ministry asany symptomatic infection with a positive test occurring 90 days or more since the completion of atreatment scheme. [14] Nonetheless, parasites are not regularly genotyped, which hampers differentiation oftrue new cases from relapses, given the high prevalence of P. vivax.
Malaria incidence among indigenous groups at different locations was estimated calculating the AnnualParasite Index (API-i) at the municipality level (administrative level 3) and compared using a Kruskal-Wallistest. The indigenous population of municipalities was estimated based on data from the last availablecensus and using a geometric growth method, based on the following formula [15].
Where Pnrepresents the estimated population at any time, n is the time in years between the last availablecensus and the time of estimation, P0the size of the population in the last available census, P0-1the

Page 4/17
population size at the second last available census, RG is the estimated rate of growth and T represents thetime between the last two available censuses.
Incidence trends were plotted �tting a local regression (LOESS) curve with an α smoothing factor of 0.8 intomonthly time series of cases. Incidence among indigenous and non-indigenous inhabitants of each stateand municipality was compared using relative risk (RR), and signi�cance tested using a z- score.
Spatial autocorrelation of cases was determined using the global Moran’s I, with positive I values indicatingclustering. This test fails to identify individual clusters, and it is of limited value when the spatial pattern isnot homogenously distributed. Thus, we also mapped individual clusters of high (hot spots) and low (coldspots) burden, applying the Getis-Ord’s Gi* statistic to individual parishes (administrative level 4), except inAmazonas, where it was applied to municipalities (administrative level 3), due to the lack of adequate parish-level data. Large positive z values and small p values indicate a signi�cant hot spot, while large negative zvalues and small p values suggest a signi�cant cold spot.[16, 17]
The signi�cance of clustering was determined with a z-score and parishes were classi�ed based on it:Con�dence 90% (0.1 >p >0.05), con�dence 95% (0.05 >p >0.01) and con�dence 99% (p<0.01), as done insimilar studies. [17, 18].
The proportion of malaria cases caused by different Plasmodium species was compared using the Chi-square test. Odds ratios in univariate and multivariable models for P. falciparum vs P. vivax infection werecalculated via binomial logistic regression and p values determined via Wald’s test.
Data analysis and processing was performed using Excel 2016 (Microsoft, Richmond, Virginia), SPSS 25(IBM, Armonk, New York) and RStudio V 1.3.1093 (RStudio Team, Boston, Massachusetts). ArcGIS Pro 24(Esri, Redlands, California) was used to construct maps and perform spatial analysis. Signi�cance was set at0.05.
ResultsMalaria incidence among indigenous communities in Amazonas, Bolivar and Sucre
A total of 116,097 new cases of malaria were registered in the 2014-2018 period among Amerindians. Ofthese, 62,267 (53.6%) were male and 53,830 (46.4%), female. Median age was 19 years (IQR: IQR: 9-31 years,additional �le 1).
Studied patients belonged to 41 different ethnic groups. However, only nine accounted for 91% of cases.These are: Pemon (27.3%), Jivi (25%), Piaroa/Wotjuja (16.1%), Yekuana (8.9%), Kurripaco (3.9%), Eñepa(2.9%), Piapoko (2.9%), Yanomami (2.8%) and Baré (1.3%). For a full list, see additional �le 1.
Most cases were registered in Amazonas (56.6%) followed by Bolivar (43.2%) and Sucre (0.25%). The yearwith the highest number of new malaria cases was 2017 with 30,976.
Amazonas state

Page 5/17
Most patients belonged to ethnic groups located north of the state, namely, Jivi (39.8%), Wotjuja (25%) andYekuana (9.1%). The number of new malaria cases in indigenous communities in 2018 (21,530), was 174.2%higher than compared to the 2014 baseline (7,852). An increasing trend in the number of monthly cases wasobserved between January 2016 and January 2018, when cases started to decrease (Figure 1A). Despite this,the relative malaria risk for indigenous people compared to the non-indigenous population fell from 2.44 in2014 (p<0.01), to 0.89 (p<0.01) in 2018 (table 1). Cases in Amazonas were typically higher between Januaryand June, but a clear seasonal pattern was not observed (Figure1B), and no signi�cant differences were seenin the median number of monthly cases during the study period (p=0.57, additional �le 5).
At municipal level, the Atures Municipality accounted for most cases during the �ve-year study period(55,28%). There was a signi�cant difference in the median incidence of municipalities (p<0.01), with thehighest median API-i registered in Manapiare: 249.05 (IQR:151.25-301.64, Figure 2, additional �le 2).
Bolivar state
The Pemon, the most numerous ethnic group in the state, accounted for 63.2% of all cases in Bolivar,followed by the Yekuana (8.7%) and the Eñepa (6.6%). As in Amazonas, malaria cases increased during thestudy period, compared to the 2014 baseline (7,854), but particularly in 2016 (15,676). From this point on,incidence reduced, reaching 8,565 cases in 2018, 9.05% more than in 2014 (Figure 1C). Compared to that inthe rest of the population, malaria risk for indigenous people was consistently higher in Bolivar: RR: 3.39 in2014 (p<0.01), 2.47 in 2015 (p<0.01), 2.80 in 2016 (p<0.01), 1.11 in 2017 (p<0.01) and 1.02 in 2018 (p=0.04,table 1). A seasonal pattern seems more patent in this state, as cases peak between February and April, andstart declining from June onwards (Figure 1C-D). There was a signi�cant difference in the median number ofmonthly cases throughout the �ve-year period (p<0.01).
At municipal level, almost a quarter of all cases originated in the Gran Sabana municipality (24.2%), followedby Angostura (formerly known and noted in maps as Raul Leoni, 23.3%) and Cedeño (20.4%) municipalities.Incidence in the study period was signi�cantly different between municipalities (p=0.012), with the highestmedian API-i registered in El Callao: 575.76 cases per 1,000 indigenous people (IQR: 457.14-1205.88). Thishowever, is probably a result of the extremely small projected indigenous population in the municipality(additional �le 3). Angostura had the highest median API-i of all municipalities with 100 indigenousinhabitants or more (310.84, IQR: 207.81-334.57, Figure 2, additional �le 2).
Sucre state
The Warao ethnic group accounted for 228 cases (78.4%), followed by the Uruak (10%), and the Puinave(7.2%). Although the number of cases remained considerably lower than in Amazonas and Bolivar, itincreased from zero in 2014 and 2015 to 140 in 2017, followed by a 72% reduction in 2018 (39 cases).Annual incidence peaked in 2017 (5.75 cases per 1,000 indigenous people), and then reduced to 1.58 in 2018(Figure 1E, table 1).
At municipal level, Benítez registered the highest API-I of the state (174.52, IQR: 0-174.52), however, thisdifference was not signi�cant (p=0.06) when municipalities with an indigenous population below 100 wereexcluded from the analysis. There is no evident seasonal pattern in Sucre (Figure 1F).

Page 6/17
Table 1: Incidence of malaria among indigenous and non-indigenous groups in Amazonas, Bolivar and Sucrestates, Venezuela, 2014-2018.
Amazonas
Year Cases-i Est. Pop-i API-i Cases non-i Est. Pop non-i API non-i RR
2014 7852 82800 94.83 3512 90344 38.87 *2.44
2015 7164 85082 84.20 11477 92921 123.51 *0.68
2016 7942 87427 90.84 17009 95481 178.14 *0.51
2017 21187 89837 235.84 45113 98015 460.27 *0.51
2018 21530 92313 233.23 26283 100522 261.47 *0.89
Bolivar
2014 7854 57451 136.71 67089 1665910 40.27 *3.39
2015 8387 58404 143.60 98466 1693846 58.13 *2.47
2016 15676 59372 264.03 161943 1721527 94.07 *2.81
2017 9649 60357 159.87 251673 1748949 143.90 *1.11
2018 8565 61357 139.59 242801 1776128 136.70 *1.02
Sucre
2014 0 23256 0.00 922 988415 0.93 0
2015 0 23615 0.00 3208 1003939 3.20 0
2016 112 23978 4.67 20821 1019515 20.42 *0.23
2017 140 24348 5.75 61747 1035140 59.65 *0.10
2018 39 24723 1.58 67992 1050722 64.70 *0.02
Est. Pop: Estimated population. API: Annual parasite index. i: Indigenous people. Non-i: Non-Indigenouspeople (cases per 1,000 people). RR: Risk ratio indigenous/non-indigenous. Z test for signi�cance: * p <0.05
Spatial autocorrelation and clustering
The origin of malaria cases registered in 2014 (2016 for Sucre) and 2018 was mapped to compare changesin geographic clustering. Maps were constructed to the parish level (fourth administrative level) in Bolivarand Sucre, and to the municipality level (third administrative level) in Amazonas, due to the lack of adequateparish-level data in this state.
The Atures municipality accounted for most cases in Amazonas (44.1% in 2014, and 67.5% in 2018). Yet,Moran’s I showed no signi�cant clustering either year. The Getis-Ord analysis, however, revealed a low-signi�cance hot spot (con�dence 90%) in Atures (Figures 3A, and 3B).

Page 7/17
In Bolivar, the Moran’s I was positive and statistically signi�cant in 2014 (I=0.19, p=0.006) and 2018 (I=0.17,p=0.006) indicating stable clustering of cases. This was re�ected in the hot spot analysis: In 2014, twohighly signi�cant (con�dence 99%) hot spots were seen in Aripao (Sucre municipality) and Barceloneta(Angostura municipality). Lower signi�cance ones (con�dence 90%) were seen in Guaniamo (Cedeño), GranSabana and Ikabaru (Gran Sabana municipality, �gure 3C and 3D). New high-signi�cance clusters appearedin the entire Gran Sabana municipality in 2018. The central northern region of the state remained a high-signi�cance cold spot during the entire study period.
The situation in Sucre state was only compared to 2016, due to the absence of cases the two previous years.No signi�cant clusters were identi�ed via Moran’s I analysis. The Getis-Ord’s Gi* revealed highly signi�canthot spots in Union in 2016 and 2018 (Benitez municipality), and Romulo Gallegos (Andrés Eloy Blancomunicipality) in 2018.
The full results of the Getis-Ord’s analysis can be found in additional �le 4.
Proportion of Plasmodium species and risk factors associated to P. falciparum infection
Most infections were caused by P. vivax: 85,124 (73.3%), P. falciparum: 25,201 (21.7%), or both: 5,726 (4.9%).P. malariae was only identi�ed in 46 patients (0.04%), from eight ethnic groups, all of them from Amazonas,and mostly infected in Alto Orinoco (31 cases), and Manapiare (8 cases). The Yanomami accounted for58.7% of all P. malariae cases. While P. vivax was the dominant species in all the states, the proportion of P.falciparum cases in Amazonas and Bolivar (22% and 21.4%, respectively) was more than twice as that inSucre state (8.6%, X2= 35.82 df=2, p<0.01).
The proportion of patients with P. falciparum or mixed infection was also higher in two ethnic groups: theHoti (42.9%) and the Yanomami (41.5.%), compared to the rest of the indigenous population (26.1%,X2=128.30, df=1, p<0.01 and X2=380.83, df=1, p<0.01, respectively).
To evaluate possible reasons behind this difference, the odds ratios (OR) for P. falciparum vs. P. vivaxinfection were calculated considering ethnic group, and other available variables such as occupation, gender,age group, and state of origin of patients, results are summarised in table 2. P. malariae and mixed infectionswere excluded from the analysis.
Table 2: Univariate and multivariable analysis of the odds ratios for P. falciparum infection amongindigenous groups of Amazonas, Bolivar and Sucre states, Venezuela, 2014-2018

Page 8/17
Univariate Multivariable
Occupation Pv Pf OR(Pf/Pv)
CI pvalue
OR(Pf/Pv)
CI pvalue
Mining 7763 2656 1.44 1.35 1.54 <0.01 1.09 1.01 1.18 0.03
Agriculture 2951 886 1.26 1.15 1.39 <0.01 0.82 0.74 0.91 <0.01
Commerce 8371 2873 1.45 1.35 1.55 <0.01
Student 8391 2257 1.13 1.06 1.21 <0.01
Others 7268 1726 1.00
Age group
5-14 23101 5619 1.02 0.97 1.07 0.50 1.08 1.02 1.15 0.01
15-29 28739 8893 1.30 1.23 1.36 <0.01 1.47 1.39 1.56 <0.01
30-64 21127 7565 1.50 1.43 1.58 <0.01 1.75 1.64 1.85 <0.01
65+ 1307 550 1.76 1.58 1.96 <0.01 2.07 1.85 2.32 <0.01
0-4 10424 2489 1.00
Gender
Female 39443 11876 1.03 1.00 1.06 0.03 1.04 1.01 1.08 0.01
Male 45681 13325 1.00
Ethnic group
Pemon 22002 6633 1.19 1.12 1.26 <0.01 1.17 1.09 1.25 <0.01
Jivi 21332 6701 1.24 1.17 1.32 <0.01 1.29 1.22 1.37 <0.01
Yekuana 7804 2328 1.18 1.10 1.26 <0.01 1.21 1.13 1.30 <0.01
Wotjuja 14640 3429 0.93 0.87 0.99 0.02
Kurripaco 3591 812 0.89 0.82 0.98 0.02 0.87 0.79 0.96 <0.01
Eñepa 2335 946 1.60 1.46 1.75 <0.01 1.76 1.59 1.94 <0.01
Piapoko 2500 712 1.13 1.02 1.24 0.02 1.20 1.09 1.33 <0.01
Yanomami 1875 1248 2.63 2.41 2.87 <0.01 3.08 2.81 3.38 <0.01
Hoti 538 389 2.86 2.48 3.29 <0.01 3.33 2.89 3.84 <0.01
Kubeo 25 3 0.47 0.14 1.57 0.22
Warao 325 48 0.58 0.43 0.79 <0.01
Warekena 255 44 0.68 0.49 0.94 0.02 0.67 0.48 0.93 0.02
Akawayo 791 108 0.54 0.44 0.66 <0.01 0.46 0.38 0.57 <0.01
Page 9/17
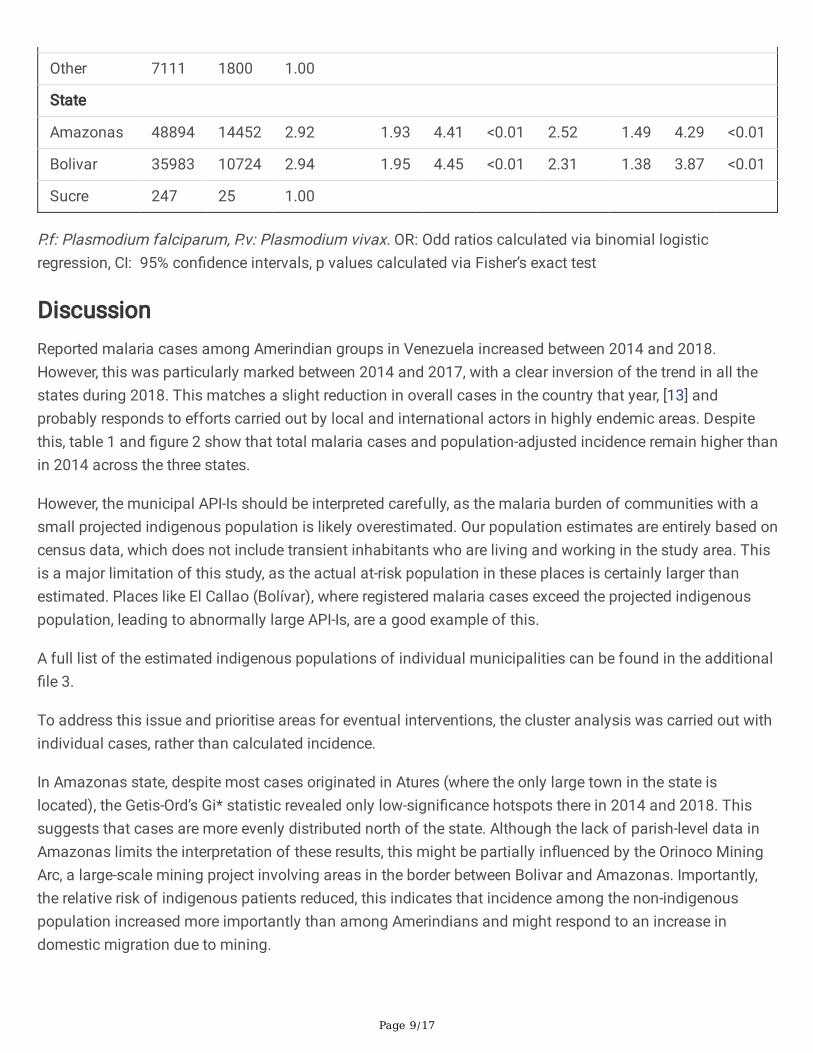
Other 7111 1800 1.00
State
Amazonas 48894 14452 2.92 1.93 4.41 <0.01 2.52 1.49 4.29 <0.01
Bolivar 35983 10724 2.94 1.95 4.45 <0.01 2.31 1.38 3.87 <0.01
Sucre 247 25 1.00
P.f: Plasmodium falciparum, P.v: Plasmodium vivax. OR: Odd ratios calculated via binomial logisticregression, CI: 95% con�dence intervals, p values calculated via Fisher’s exact test
DiscussionReported malaria cases among Amerindian groups in Venezuela increased between 2014 and 2018.However, this was particularly marked between 2014 and 2017, with a clear inversion of the trend in all thestates during 2018. This matches a slight reduction in overall cases in the country that year, [13] andprobably responds to efforts carried out by local and international actors in highly endemic areas. Despitethis, table 1 and �gure 2 show that total malaria cases and population-adjusted incidence remain higher thanin 2014 across the three states.
However, the municipal API-Is should be interpreted carefully, as the malaria burden of communities with asmall projected indigenous population is likely overestimated. Our population estimates are entirely based oncensus data, which does not include transient inhabitants who are living and working in the study area. Thisis a major limitation of this study, as the actual at-risk population in these places is certainly larger thanestimated. Places like El Callao (Bolívar), where registered malaria cases exceed the projected indigenouspopulation, leading to abnormally large API-Is, are a good example of this.
A full list of the estimated indigenous populations of individual municipalities can be found in the additional�le 3.
To address this issue and prioritise areas for eventual interventions, the cluster analysis was carried out withindividual cases, rather than calculated incidence.
In Amazonas state, despite most cases originated in Atures (where the only large town in the state islocated), the Getis-Ord’s Gi* statistic revealed only low-signi�cance hotspots there in 2014 and 2018. Thissuggests that cases are more evenly distributed north of the state. Although the lack of parish-level data inAmazonas limits the interpretation of these results, this might be partially in�uenced by the Orinoco MiningArc, a large-scale mining project involving areas in the border between Bolivar and Amazonas. Importantly,the relative risk of indigenous patients reduced, this indicates that incidence among the non-indigenouspopulation increased more importantly than among Amerindians and might respond to an increase indomestic migration due to mining.
Page 10/17
In Bolivar state, clustering was consistently identi�ed south of the State. This region comprises the historicallocation of the Pemon, the largest single ethnic group identi�ed in this study. Illegal mining by this and othergroups in protected areas of Canaima National Park, mostly located in the Gran Sabana municipality, as wellas in the Upper Caura River basin (Aripao) has been widely reported [19, 20] and likely in�uences the localclustering of malaria among Amerindian communities in this region. The highly signi�cant cold spotsidenti�ed north of the state, respond to the small proportion of indigenous population in the area.
Surprisingly, the Sifontes municipality, recently identi�ed as the most important cluster of malariatransmission in the Americas [2], was not found to be a signi�cant hot spot for Amerindian groups, while thismight re�ect a predominance of mining activity by the Pemon in other areas of the state, as discussedabove, further research is needed to con�rm this �nding and understand the reasons behind it.
If malaria among Amerindian groups indeed presents a different geographic pattern, interventions inlocations apart from Sifontes will be necessary to curb the impact of the epidemic. Hot spots in Sucrematched areas of known high-incidence [13], where indigenous patients have probably bene�ted more frominterventions currently in place, explaining the sharp reduction in cases seen in 2018.
Seasonality was only observed in Bolivar, but this has not been described in the general population. [21]However, these studies date from 2010, and malaria cases in Bolivar are highly in�uenced by the El NiñoSouthern Oscillation (ENSO) phenomenon, [21] which was particularly intense in the 2015-2016 period [22]and might have in�uenced the large peak of cases in the early months of 2016 and 2017. The exposure ofthe indigenous population to infectious bites might also change more markedly during the year due tospeci�c cultural or economic factors. Further studies are needed before making conclusions regarding thesepatterns.
The presence of P. malariae exclusively in patients from Amazonas, and mostly among the Yanomami,matches previous reports that link this species to remote areas of the state. [23] The Hoti and the Yanomamiwere also found to have signi�cantly higher odds for P. falciparum infection. Similar to P. malariae, P.falciparum is known to be more prevalent in the rainforest of Amazonas than in the rest of the country. [24]Previous works suggest that the higher prevalence of P. falciparum and P. malariae in the Alto Orinoco regionmight be explained by a longer life expectancy of local Anopheles darlingi mosquitos. [24] This might in turnre�ect �aws in local vector control strategies, and the lack of targeted measures that adapt to the particularliving conditions of the Yanomami and the Hoti, such as their nomadic habits, and housing materials thatrender IRS and bed nets ineffective.[24] Insecticide treated hammocks have proven to be an usefulalternative in this context.[25]
Although miners presented higher odds for P. falciparum infection too, the difference was very small andmight be more related to their increased exposure to infectious bites, than to a higher P. falciparumprevalence in Venezuelan mines, which has not been described. [26] Furthermore, occupation data was onlyavailable for 45,142 patients (40.9% of the total analysed). Increased exposition to infectious bites isprobably also the reason for higher odds in older age groups.
Conclusion

Page 11/17
Malaria incidence among Amerindian groups has increased since 2014, although the trend has partlyreversed in the last two years. Clustering of malaria cases is particularly clear in Bolivar, where a widerdeployment of cost-effective interventions is needed. Access to antimalarial medication, as well asspeci�cally targeted interventions should be guaranteed to all groups, but prioritized to the Hoti andYanomami, due to their increased risk of P. falciparum infection.
AbbreviationsAPI-i: Annual Parasite index among Amerindian groups (number of cases of malaria reported in Amerindianpatients per 1,000 Amerindian people).
ENSO: El Niño Southern Oscillation.
NGO: Non-government organization.
DeclarationsEthics approval: This project was approved by the independent ethics committee of the Venezuelan NationalBioethics Center (Reference number: CIBI-CENABI-04/2020), and the MSc Research Ethics Committee at theLondon School of Hygiene and Tropical Medicine (Reference number: 21868).
Consent for publication: Not applicable
Availability of data and materials: The datasets are available from the corresponding author on reasonablerequest.
Competing interests: The authors declare no con�ict of interest.
Funding: Ch received salary support from Unitaid through the BOHEMIA grant to ISGlobal. ISGlobalacknowledges support from the Spanish Ministry of Science and Innovation through the “Centro deExcelencia Severo Ochoa 2019-2023” Program (CEX2018-000806-S), and support from the Generalitat deCatalunya through the CERCA Program. The funding sources had no role on the design, analysis or decisionto publish the results of this study. No funding was speci�cally allocated to this project.
Author contributions: Conceptualization: JCG, LV. Writing - original draft: JCG, LV, CCh. Data managementand processing: JCG, JM, MV. Writing - review & editing: all authors contributed, reviewed, and approved thelast draft.
Acknowledgments: The authors would like to thank Dr. David Conway, Dr. Mariapía Bevilacqua, and Dr. EgleeZent for their technical advice.
References1. World Malaria Report. Geneva: World Health Organization, 2020.

Page 12/17
2. Grillet ME, Moreno JE, Hernández JV, Vincenti-González MF, Noya O, Tami A, et al. Malaria in SouthernVenezuela: The Hottest Hotspot in Latin America. PLOS Neglected Tropical Diseases. 2021;15(1).
3. Grillet ME. Factors associated with distribution of Anopheles aquasalis and Anopheles oswaldoi(Diptera: Culicidae) in a malarious area, northeastern Venezuela. Journal of medical entomology. 2000Mar;37(2):231-8. PubMed PMID: 10730493. Epub 2000/03/24. eng.
4. MPPS. Boletín Epidemiológico #52. Caracas, Venezuela: Ministerio del Poder Popular para la Salud,2016.
5. INE. XIV Censo Nacional de Población y Vivienda 2011. Caracas, Venezuela: Instituto Nacional deEstadística; 2014.
�. Grenfell P, Fanello CI, Magris M, Goncalves J, Metzger WG, Vivas-Martínez S, et al. Anaemia and malariain Yanomami communities with differing access to healthcare. Transactions of The Royal Society ofTropical Medicine and Hygiene. 2008;102(7):645-52.
7. Bevilacqua M, Rubio-Palis Y, Medina DA, Cárdenas L. Malaria Control in Amerindian Communities ofVenezuela : Strengthening Ecohealth Practice Throughout Conservation Science and CapabilityApproach. EcoHealth. 2015 Jun;12(2):253-66. PubMed PMID: 25851195. Epub 2015/04/09. eng.
�. Mosnier E, Roux E, Cropet C, Lazrek Y, Moriceau O, Gaillet M, et al. Prevalence of Plasmodium spp. in theAmazonian Border Context (French Guiana–Brazil): Associated Factors and Spatial Distribution. Am JTrop Med Hyg. 2020;102(1):130-41.
9. Bevilacqua M, Medina DA, Cárdenas L, Rubio-Palis Y, Moreno J, Martínez A. Orientaciones parafortalecer el programa de malaria en zonas remotas con población indígena en el Caura, Venezuela.Boletín de Malariología y Salud Ambiental. 2009;49:53-72.
10. Bevilacqua M, Rubio_Palis Y. Acciones necesarias ante la epidemia de malaria en la Guayana indígena.Bol Malariol Salud Ambient. 2018;58(1):2-15.
11. MPPS. Boletín Epidemiológico Semana 53. Caracas, Venezuela: Ministerio del Poder Popular para laSalud, 2014.
12. MPPS. Boletín Epidemiológico Semana 52. Caracas, Venezuela: Ministerio del Poder Popular para laSalud, 2015.
13. Malaria, IPA, surveillance, falciparum, vivax, morbidity, mortality, plasmodium, risk, statistics, health,indicators [Internet]. Regional Malaria Program HDS/CD/Malaria. Pan American Health Organization.2010 [cited 01/06/2020]. Available from:http://ais.paho.org/phip/viz/malaria_surv_indicators_popup.asp.
14. MPPS. Programa Nacional de Eliminación de Malara. Pautas de tratamiento en casos de malaria.Caracas, Venezuela: Ministerio del Poder Popular para la Salud; 2017.
15. CEPAL. Estadísticas e Indicadores Sociales: Comisión Económica para América Latina y el Caribe; 2020[30/05/2020]. Available from: http://interwp.cepal.org/sisgen/Sisgen_MuestraFicha_puntual.asp?indicador=300&id_estudio=1&id_aplicacion=1&idioma=e.
1�. Anselin L. Local Indicators of Spatial Association—LISA. Geographical Analysis. 1995;27(2):93-115.
17. Getis A, Ord JK. The Analysis of Spatial Association by Use of Distance Statistics. GeographicalAnalysis. 1992 1992/07/01;24(3):189-206.

Page 13/17
1�. Tewara MA, Mbah-Fongkimeh PN, Dayimu A, Kang F, Xue F. Small-area spatial statistical analysis ofmalaria clusters and hotspots in Cameroon;2000–2015. BMC Infectious Diseases. 20182018/12/07;18(1):636.
19. Bonet NG. Mining against the State? Gold Mining and Emerging Notions of Territoriality in SoutheasternVenezuela. Bulletin of Latin American Research. 2020;39:305-18.
20. Rendon M, Sandin L, Fernandez C. Illegal Mining in Venezuela: Death and Devastation in the Amazonasand Orinoco Regions. Center for Strategic and International Studies, 2020.
21. Grillet ME, El Souki M, Laguna F, León JR. The periodicity of Plasmodium vivax and Plasmodiumfalciparum in Venezuela. Acta tropica. 2014 Jan;129:52-60. PubMed PMID: 24149288. Epub2013/10/24. eng.
22. Null J. El Niño and La Niña Years and Intensities. Based on Oceanic Niño Index. Golden Gate WeatherServices, 2020.
23. Cáceres G JL. Epidemiología de malaria por Plasmodium malariae en Venezuela, 1999 - 2008. Boletínde Malariología y Salud Ambiental. 2009;49:303-7.
24. Magris M, Rubio-Palis Y, Menares C, Villegas L. Vector bionomics and malaria transmission in the UpperOrinoco River, Southern Venezuela. Memórias do Instituto Oswaldo Cruz. 2007;102:303-12.
25. Magris M, Rubio-Palis Y, Alexander N, Ruiz B, Galván N, Frias D, et al. Community-randomized trial oflambdacyhalothrin-treated hammock nets for malaria control in Yanomami communities in the Amazonregion of Venezuela. Tropical medicine & international health : TM & IH. 2007 Mar;12(3):392-403.PubMed PMID: 17313511. Epub 2007/02/23. eng.
2�. Douine M, Lambert Y, Musset L, Hiwat H, Blume LR, Marchesini P, et al. Malaria in Gold Miners in theGuianas and the Amazon: Current Knowledge and Challenges. Current Tropical Medicine Reports. 20202020/06/01;7(2):37-47.
Figures

Page 14/17
Figure 1
Monthly malaria cases registered in Amerindian groups of Amazonas, Bolivar and Sucre states, Venezuela,2014-2018. Monthly cases registered between 2014 and 2018 in Amazonas (A), Bolívar (C) and Sucre (E),and aggregated cases per month and year in the three states (B, D, and F, respectively). The blue line in thepanels on the left represents the LOESS curve.

Page 15/17
Figure 2
Evolution of malaria incidence in Amerindian groups of Amazonas, Bolivar and Sucre states, Venezuela,2016 and 2018. Annual Parasite Index among indigenous patients (API-i) in Amazonas (A, B), Bolivar (C, D),and Sucre (E, F). Panels on the left represent 2014 data (except Sucre), panels on the right, 2018. Note: Thedesignations employed and the presentation of the material on this map do not imply the expression of anyopinion whatsoever on the part of Research Square concerning the legal status of any country, territory, city

Page 16/17
or area o bbnhjr of its authorities, or concerning the delimitation of its frontiers or boundaries. This map hasbeen provided by the authors.
Figure 3
Evolution of clustering of malaria cases diagnosed among indigenous groups of Amazonas, Bolivar, andSucre states, Venezuela, 2014-2018. Burden hot and cold spots detected in Amazonas (A, B), Bolivar (C, D)and Sucre (E, F). Panels on the left represent 2014 data, panels on the right, 2018. Data of 2016 is not shown,except for Sucre, where no cases were registered in 2014. Each dot represents 10 cases of malaria in

Page 17/17
indigenous people (Amazonas and Bolivar) or 1 case (Sucre). Con�dence: 99% (p < 0.01), 95% (0.05 >p>0.01), 90% (0.1 >p >0.05). Note: The designations employed and the presentation of the material on thismap do not imply the expression of any opinion whatsoever on the part of Research Square concerning thelegal status of any country, territory, city or area o bbnhjr of its authorities, or concerning the delimitation ofits frontiers or boundaries. This map has been provided by the authors.
Supplementary Files
This is a list of supplementary �les associated with this preprint. Click to download.
additional�le1.xlsx
additional�le2.xlsx
additional�le3.xlsx
additional�le4.xlsx
Additional�le5.docx