venezuela energy in figures 2012 - instituto de...
TRANSCRIPT
1
VENEZUELA ENERGY IN FIGURES
THE OIL AND GAS SECTOR
2012

2
3
Contents
THE OIL SECTOR
OIL FIGURES 2012 04
INSTITUTIONAL FRAMEWORK 05
OIL PRICES 14
EXPLORATION AND PRODUCTION 16
REFINING 29
COMMERCIALIZATION 32
FISCAL POLICY AND THE OIL SECTOR 34
GAS SECTOR
GAS FIGURES 2012 39
INSTITUTIONAL FRAMEWORK 40
MAIN ACTORS 42
FISCAL FRAMEWORK 43
EXPLORATION AND PRODUCTION 44
PDVSA: RESERVES, PRODUCTION AND CONSUMPTION 45
PROJECTIONS 2011-2035 – OIL SECTOR 53
PROJECTIONS 2011-2035 – GAS SECTOR 55

4
THE OIL SECTOR
Conventional oil reserves (light and medium): 38.9 billion barrels.Heavy and extra-heavy crude reserves: 258.8 billion barrels.Production: 2.9 million barrels a day on average1. Global refining capacity of Petróleos de Venezuela, SA (PDVSA): 2.8 million barrels per day.Internal consumption: 681 thousand barrels a day2.
OIL FIGURES 2012
RESERVES (BILLIONS OF BARRELS)
PRODUCTION (MILLION BARRELS DAILY)
CONSUMPTION (MILLION BARRELS
DAILY)
WORLD 1668.9 86.2 89.774
NORTH & SOUTH AMERICA 548 22.9 29.573
VENEZUELA
CONVENTIONAL CRUDES
38.926
2.7 - 2.9 681 - 781HEAVY & EXTRA-HEAVY CRUDES
258.809
TOTAL 297.735
SHARE OF CONVENTIONAL RESERVES% OF TOTAL
PRODUCTION% TOTAL
CONSUMPTION
VENEZUELA / NORTH & SOUTH AMERICA 54% 11.8% - 12.7% 2.3% - 2.6%
VENEZUELA / WORLD 18% 3.1% - 3.4% 0.76% - 0.87%
% OF TOTAL RESERVES
VENEZUELA / NORTH & SOUTH AMERICA 32%
VENEZUELA / WORLD 18%
Oil Situation, 2012
Source: Informe de Gestión Anual de PDVSA (2012), OPEC, BP Statistical Review of World Energy 2013 and own calculations.
1 International sources reported a production of 2.7 million barrels per day.2According to the International Energy Agency (IEA) domestic consumption now stands at 781 thousand barrels per day.

5
Constitution of the Bolivarian Republic of Venezuela, (CBRV, 1999) Mineral and hydrocarbon deposits of any nature that exist within national territory, beneath the territorial sea bed, within the exclusive economic zone and on the continental shelf, are property of the Republic, are of public domain, and therefore inalienable and imprescriptible. (Article 12)The governance and management of mines and hydrocarbons is reserved to the Federal Government.(Article 156, paragraph 16)The State reserves for itself all oil activities, for strategic reasons and national interest, through the pertinent organic law (the Organic Law of Hydrocarbons). (Article 302)For reasons of economic and political sovereignty and national strategy, the State shall retain all shares of Petróleos de Venezuela, S.A. (PDVSA). (Article 303)
Hydrocarbons Organic Law (HOL, 2011) Gaceta Oficial 38.443 05/24/2006.This Decree-Law governs liquid hydrocarbons exploration, exploitation, refining, industrial development, freight, storage, commercial and conservation activities. The activities pertaining to gaseous hydrocarbons shall be governed by the Gaseous Hydrocarbons Organic LawThe Venezuelan State ratifies its legal ownership of hydrocarbons reserves. (Article 3)The State reserves to itself primary activities (exploration and exploitation) and commercialization of crudes (Articles 9 & 10). However, these activities could be realized by joint ventures as long as the state owns more than 50 percent of the shares. Operating firms will be in charge of primary activities. (Article 22)This Law establishes the creation through Executive Decree of state-owned firms related to the activities previously listed. They may adopt the legal form judged to be most convenient. (Articles 27to 31) The workers of stated-owned oil corporations, with the exception of the members of their Boards of Directors, shall enjoy employment stability and may only be terminated for the causes expressly stated in the labor legislation (Article32) The ascribed public bureau will promote bidding processes for the selection of operating firms, in order to evaluate different offers. However, for Public Interest or special technical reasons, a direct selection of operating firms could be done through Council of Ministers. (Article 37)With the objective of adding value through the production of hydrocarbon specialties and derivatives, the refined oil industrialization effort concerns the activities of: separation, distillation, purification, conversion, mixing and transformation of crudes. (Article 49)
Conventional oil reserves(light and medium)38.9 billion barrels.
THE INSTITUTIONAL LEGAL FRAMEWORK FOR ACCESS TO OIL AND GAS RESOURCES IN VENEZUELALegislative Body-Statute of the Venezuelan Oil Sector
6
These activities could be realized by: The State, state-only owned firms, joint ventures with public and private capital in any proportion and purely private firms. (Article 50). Private firms involved in these activities should obtain a license from the Ministry of Oil and Mining. (Article 53)Commercialization activities regulated by law include national and international trade of hydrocarbons and derivatives (Article 56). The Executive, through Decree, could reserve for the state any commercialization activity related to hydrocarbons or derivatives. (Articles 57 & 27). Joint ventures will only be allowed to sell hydrocarbons and derivatives to state-owned firms. Commercialization activities of by-products not listed in Decree 1646 could be done by The State, joint ventures with public & private capital or purely private firms. (Article 58)Those derivative products signaled by the Executive, through Resolution of the Ministry of Popular Power for Oil and Mining, will be subject to the regulations of national commerce defined by this Decree-law. (Article 59)Activities of supply, storage, freight, distribution and retail selling for collective national consumption, signaled by the Executive, will be considered a public service. The National Executive, through the Ministry of Oil and Mining, will fix the prices of hydrocarbons derivatives and adopt measures to guarantee the supply and efficiency of the service, and avoid his interruption. Those prices could be fixed in accordance to bands or any other mechanism that would prove adequate for the execution of objectives considered in this Law, taking into account the investments needed for those purposes and their rate of return. (Article 60)
Legal resources needed to create a JointVenture in Venezuela The National Assembly Accord which, establishes the constitution of the Joint Venture and internal guidance that will govern the realization of primary activities. (CBRV, Article 150 & HOL)Foundational DecreeExecutive Resolution that delimits geographically the area for operative firms primary activities. (HOL, Article 24)Joint venture Constitutive Act.Executive Decree that transfers the right to develop primary activities. (HOL, Article 24)Once constituted, a joint venture should be inscribed in the Merchants Registry in accordance to the norms established by the Commerce Code (Gaceta Nº 475 Extraordinaria 12/21/1955 (HOL, Article 33).
Contractual elements that any Joint Venture should fulfill in order to operate (HOL, Article 34) Maximum useful life of 25 years that might be extended to another term, not longer than 15 years.Description of the placement and territorial extension destined to primary activities.In case of culmination, for any motives, the assets of the joint venture should be transferred to the State in accordance to contractual conditions or following this article, which states that the regression would be complete, without taxes or compensation payments.Venezuelan Laws would be the only applicable rules in case of controversy. Those disputes should be solved at Venezuelan courts.
Law to regularize the involvement in primary activities considered in Decree 1.510 (Gaceta Oficial Nº 38419 04/18/2006). The objective of this law is to regularize private participation in the primary activities described at the Hydrocarbons Organic Law, article 9. (Article 1)The public domain of joint ventures through operative and financial control is assured. It establish that private contractors will only be allowed on exploration, exploitation, storage or freight activities or to obtain the proceeds derived from hydrocarbons production, through their participation on joint ventures.
3Ley de Regularización de la Participación en las Actividades Primarias Previstas en el Decreto No. 1.510 con fuerza de Ley Orgánica de Hidrocarburos (G. O. N⁰ 38.419 del 18/04/06).

7
4Ley de Migración a Empresas Mixtas de los Convenios de Asociación
de la Faja Petrolífera del Orinoco, así como los Convenios de Exploración
a Riesgo y Ganancias Compartidas (G.O. N°38.632 del 26/02/07).
Ley sobre los Efectos del Proceso de Migración a Empresas Mixtas
de los Convenios de Asociación de la Faja Petrolífera del Orinoco, así como
de los Convenios de Exploración a Riesgo y Ganancias Compartidas
(G.O. N° 38.785 del 08/10/07).
Law Decree N° 5200 about the transformation of Orinoco Oil Belt Associative Agreements and Risk & Profits Shared Agreements into Joint Ventures (Gaceta Oficial Nº 38617 02/01/2007). The Decree establish the transformation of Orinoco Oil Belt Associative Agreements and Risk & Profits Shared Agreements into Joint Ventures The Corporación Venezolana del Petróleo, S.A. (CVP) or another Petróleos de Venezuela, S.A. (PDVSA)subsidiary will be the public share-holder of at least sixty percent (60 percent) of the Joint Ventures shares. It is competence of the Ministry of Popular Power for Oil and Mining to establish the value of the Joint Ventures, PDVSA´s stock share on them and the financial or economic adjustments that could be needed to begin operations.
Organic Law Of Liquid Fuels Internal Market Re-Ordering (2008) Gaceta Oficial Nº 39.019 09/18/2008). The State reserves to itself intermediate activities related to the supply of liquid fuels and terrestrial or aquatic transportation or general cargo of them. (Articles 1 & 2).
Organic Law that Reserves To The State The Goods And Services Related To Hydrocarbons Primary Activities. Its objective is to reserve to the State (PDVSA or her subsidiary) the goods and services related to primary activities described by the Hydrocarbons Organic Law, for strategic reasons.
8
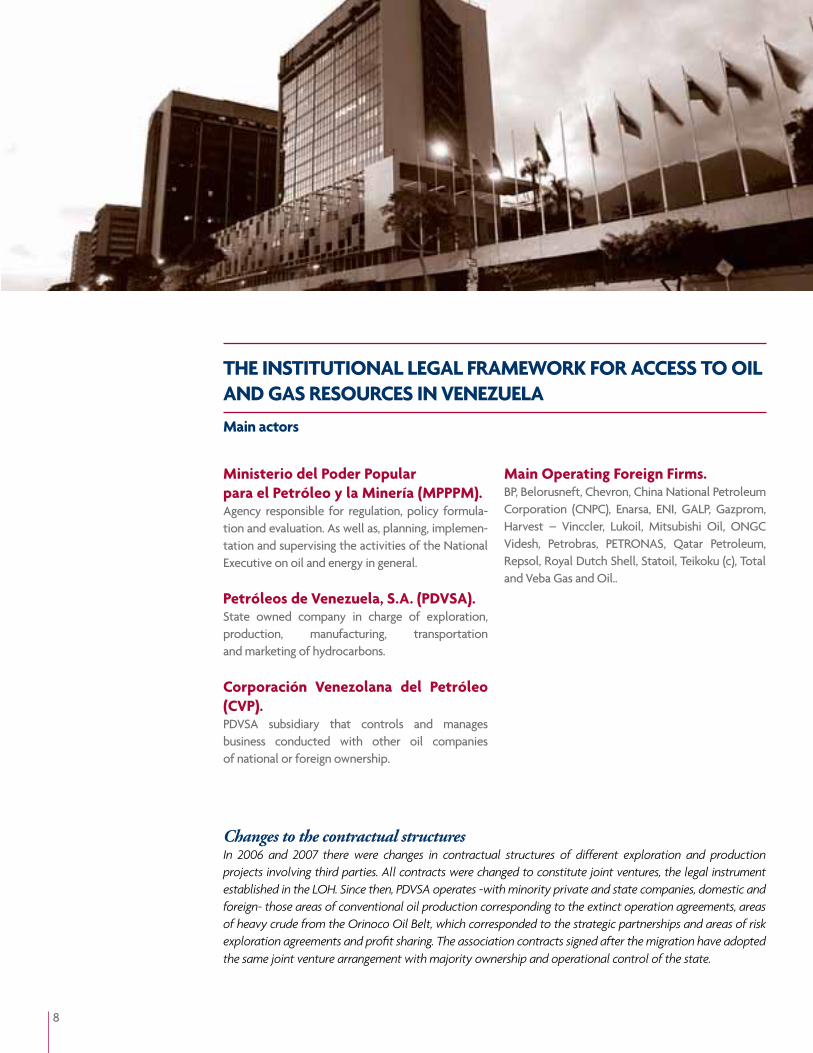
Ministerio del Poder Popular para el Petróleo y la Minería (MPPPM). Agency responsible for regulation, policy formula-tion and evaluation. As well as, planning, implemen-tation and supervising the activities of the National Executive on oil and energy in general.
Petróleos de Venezuela, S.A. (PDVSA). State owned company in charge of exploration, production, manufacturing, transportation and marketing of hydrocarbons.
Corporación Venezolana del Petróleo (CVP). PDVSA subsidiary that controls and manages business conducted with other oil companies of national or foreign ownership.
Main Operating Foreign Firms. BP, Belorusneft, Chevron, China National Petroleum Corporation (CNPC), Enarsa, ENI, GALP, Gazprom, Harvest – Vinccler, Lukoil, Mitsubishi Oil, ONGC Videsh, Petrobras, PETRONAS, Qatar Petroleum, Repsol, Royal Dutch Shell, Statoil, Teikoku (c), Total and Veba Gas and Oil..
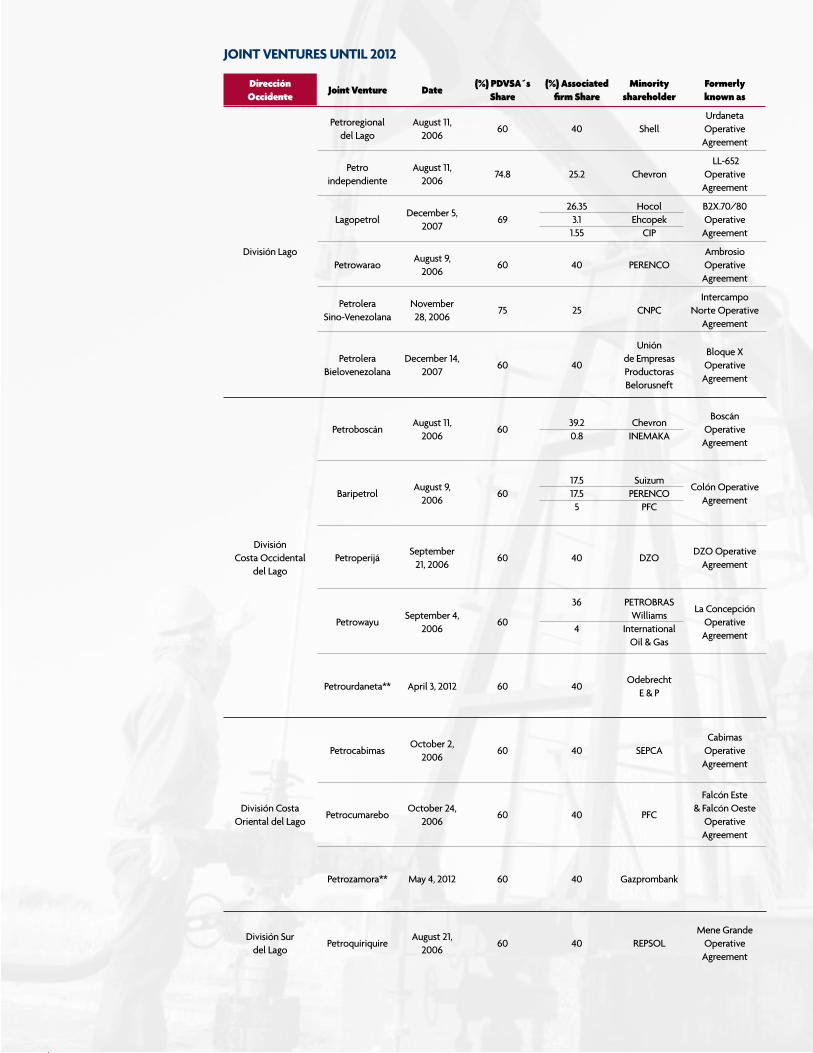
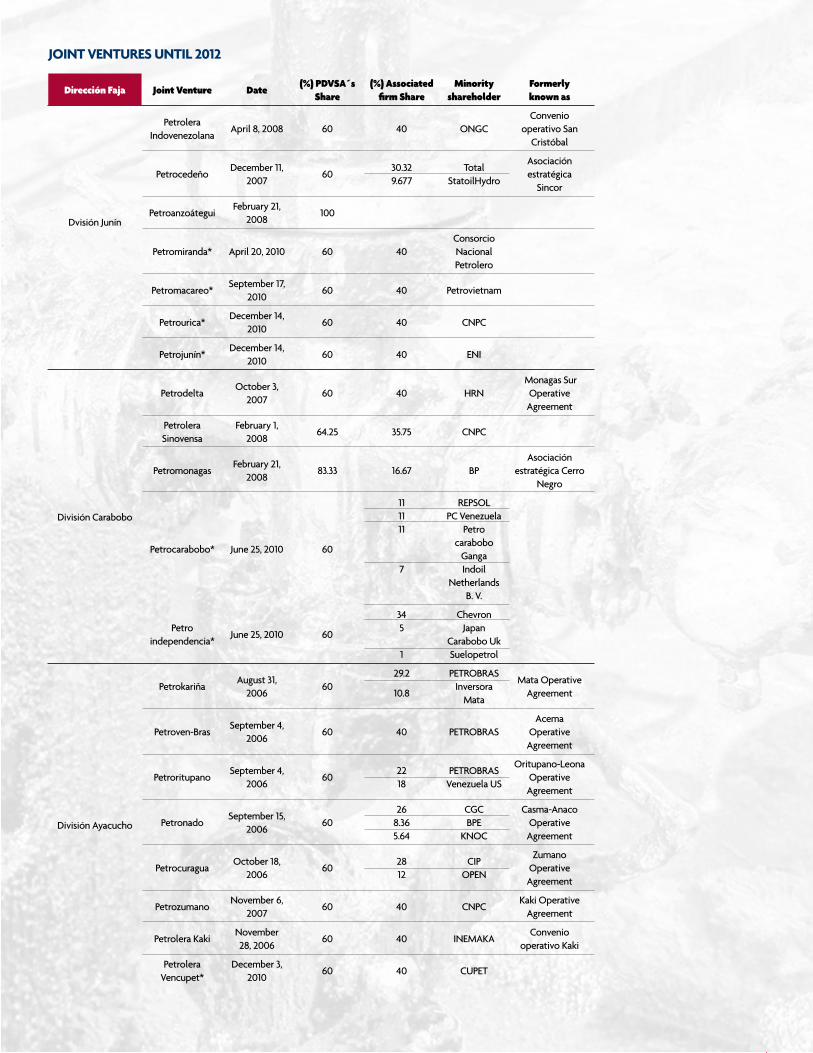
Changes to the contractual structures In 2006 and 2007 there were changes in contractual structures of different exploration and production projects involving third parties. All contracts were changed to constitute joint ventures, the legal instrument established in the LOH. Since then, PDVSA operates -with minority private and state companies, domestic and foreign- those areas of conventional oil production corresponding to the extinct operation agreements, areas of heavy crude from the Orinoco Oil Belt, which corresponded to the strategic partnerships and areas of risk exploration agreements and profit sharing. The association contracts signed after the migration have adopted the same joint venture arrangement with majority ownership and operational control of the state.
THE INSTITUTIONAL LEGAL FRAMEWORK FOR ACCESS TO OIL AND GAS RESOURCES IN VENEZUELA
Main actors

9
Income Tax Law (Gaceta Oficial Nº 38628 02/16/2007) Is a proportional tax rate equivalent to 50 percent (Articles 11 & 53, paragraph b).State-owned firms dedicated to hydrocarbons production or related activities are exempted of income tax over the value generated by previous studies, technical knowledge, data, equations, recordings, movies or other assets of similar nature needed to accomplish contracts of national concern.
Royalty (HOL, articles 44 to 47)This rate (30 percent) applies to conventional oil exploitation. The applicable rate for heavy-weight oil could be lower than 30 percent depending on special characteristics of the project. Particularly, the royalty could be lowered if it is proven that exploitation is not profitable at the usu-al rate. The minimum rate for mature or heavy weight oil fields will be 20 percent. In case of Orinoco´s Belt mixed oils, the minimum rate will be 16 2/3%. The National Executive holds the prerogative to increase royalties back to 30 percent if the project proves to be profitable at that rate (Article 44).The National Executive could demand the royalty to be paid in money or in kind. If not specified, it would be assumed that the medium of payment will be money (Article 45).In case of money payment, the operating firm should pay the price established at field production and market or agreed value (Article 47).
Superficial Tax (HOL, Article 48) Yearly payment of one hundred tax units per each square kilometer of the given and unexploited superficial area.This tax will grow yearly at a two percent (2 percent) rate over the first five years of the project and five percent (5 percent) thereon.
The general taxation applicable to any operating company is determined by the provisions of the Law on Income Tax (In Spanish “LISLR”) and by the royalty and tax regime established in Chapter VI of the LOH. Additionally, according to Article 36 of the LOH, in those instruments that grant the right to perform activities, special advantages for the Republic may be established, such as the increase in royalties, contributions or other considerations provided for in the same law, employment and assignment of new and advanced technologies.
THE INSTITUTIONAL LEGAL FRAMEWORK FOR ACCESS TO OIL AND GAS RESOURCES IN VENEZUELA
Fiscal framework

10
Tax over own consumption (HOL, Article 48) Is equivalent to a rate of 10 percent for each cubic meter of hydrocarbons derivatives produced and consumed as fuel for operational activities. The consumer price of the product should be used for purposes of quantifying the amount owed.
General Consumption Tax (HOL, Article 48) This tax applies to each liter of hydrocarbons derivative product sold in the domestic market, ranging from 30 to 50 percent of the price. The effective rate is set in the annual Budget Law.
Extraction Tax (HOL, Article 48) Payment equivalent to a third of the value of liquid hydrocarbons extracted at the operative area. It should be measured according to article 47 of the HOL. The payment should be made monthly by the operating firm, and if applicable, made at the same moment the royalty is paid under the special advantage condition. By “special advantage condition” the law means the right that the tax payer holds to deduct the amount of royalty from the Extraction Tax total. The tax payer holds the right to deduct any special advantage that might be paid annually from the Extraction Tax total, but only on periods subsequent to the payment of that yearly special advantage. In practice, this tax amounts to an additional royalty of 3.33 percent that PDVSA and Orinoco´s Belt projects should pay. This tax might not apply if the sum of royalty plus taxes and one percentage point of utilities destined to investments were larger than the total value of extracted hydrocarbons that year.
Export Registry Tax (HOL, article 48) This tax applies to 0.1 percent of the exported hydrocarbons value.For this matter, the exporter should report to the Ministry of Popular Power for Oil and Mining the volume, API grade and sulfur content of the shipment.
Special Tax Over Extraordinary Or Exorbitant Oil Conditional tax applied over the gap between international oil market prices and prices estimated by the Annual Budget Law.
Market Prices At the $80 to $100 range, a tax rate of 80 percent will be applied to the difference between $80 and the observed price.At the $100 to $110 range, a tax rate of 90 percent will be applied to the difference between $100 and the observed price, in addition to the contributions described before. Prices over $110, a tax rate of 95 percent will be applied to the difference between $110 and the observed price, in addition to the contributions described before. A tax rate of 20 percent will be applied to the difference between the oil price established in the Annual Budget Law and $80.Royalties, extraction or registry taxes apply up to $80.Taxes collected this way are to be deposited in the National Development Fund (FONDEN).

11
On February 20, 2013 the Parliament approved the Law Reform of Special Contribution, which reduces the tax burden on the oil sector and redirects resources to the budget, that under the current law are intended to National Development Fund (FONDEN). Under the new law, for prices above $80 and less than 100, the law provides the collection of an 80 percent tax rate on the difference between the observed price and $80. For prices equal to or greater than $100 and less than 110, the rate is 90 percent on the difference between the observed price and $100, and adds the rate of 80 percent of the difference between 80 and 100 dollars ($16). For prices at or above $110 the rate applied will be of 95 percent on the difference between the observed price and $110 and is added the rate of 90 percent of the difference between 100 and 110 dollars ($ 9) and the 80 percent of the difference between 80 and 100 dollars ($ 16). The additional aliquot of 20 percent is now applied to the difference between the price provided in the annual budget law and $ 80.
Analysis of the Law of Special Contribution over Extraordinary and Exorbitant Prices in the International Oil Market
20% 80% 90% 95%
Law 2011Between the budget
price and $70Between $70 and $90 Between $90 and $100 Over $100
Reform 2013Between the budget
price and $80Between $80 and $100 Between $100 and $110 Over $110
LAW OF SPECIAL CONTRIBUTION: ALIQUOTS AND OIL PRICES

12
The reduction of government take has its equivalent in increasing the utility of the producers. The utility, defined as net income over costs (including taxes), increased by two percentage points: 15 to 17 percent. Net income increased by $ 1.83 per barrel (from 12.78 to 14.61), again assuming a price of $ 100. With this increase in the operating companies’ profits, the government expects to alleviate the cash flow of Petróleos de Venezuela (PDVSA) and break the lethargy that characterizes current efforts to increase production. While certainly healthy for PDVSA and welcomed by the partner companies, the increase is unlikely to be considered satisfactory, if we take into account the country risk and political uncertainty. It is difficult to see a significant increase in production if this reform is not complemented with other changes in how oil policy is conducted.
GOVERNMENT TAKE IN OIL REVENUE (PERCENTAGES)
Effective Tax Rate (Net Income) = Percentage of net income that accrues to the State
30 40 50 60 70 80 90 100 110 120 130 140 150 160 170 18070
80
2011 LAW
2013 LAW
PRICE US$/BBL
PERC
ENTA
GE 90
100
Source: Authors’ calculations based on the Official Gazette of the Bolivarian Republic of Venezuela No. 40,114 dated February 20, 2013
What impact will this reform have on the state’s share in the oil revenue and the operating com-panies’ profits? How will the distribution of income between the budget and the FONDEN be affected? Taking the current estimated price in the budget (U.S. $ 55) and a cost index based on the price per barrel, we proceed to answer these questions..
Using prices of U.S. $ 100 per barrel, the new law im-plies a reduction of state involvement in the sector’s net income (government take) of 2.4 percentage points: 83.4 to 81 percent. At this price the contribu-tion to the State becomes $ 62.28 per barrel, instead of 64.11 under the old law. Taking 2011 exports (the latest official figure available), reduced participation
means least 1.7 billion dollars a year in contributions to the state (assuming each barrel exported sells for $ 100). The government hopes to offset the reduction in two ways: (1) with the recent devaluation of the bolívar will receive 46.5 percent more in bolivars for each barrel and (2) the increase in profits for manufac-turers is expected to lead to increased production.
30 40 50 60 70 80 90 100 110 120 130 140 150 160 170 1800
5
10
2011 LAW
2013 LAW
PRICE US$/BBL
PERC
ENTA
GE 15
20
25
OPERATING COMPANIES’ NET INCOME (PERCENTAGES)
Source: Authors’ calculations based on the Official Gazette of the Bolivarian Republic of Venezuela No. 40,114 dated February 20, 2013
13
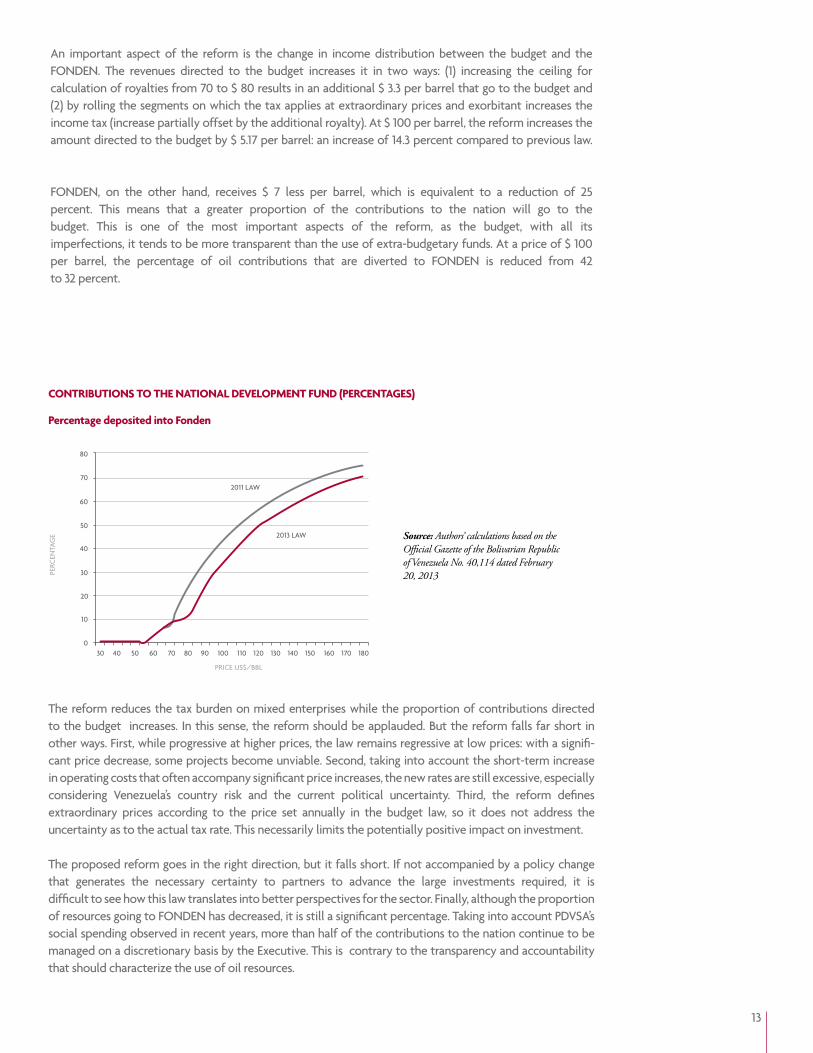
The reform reduces the tax burden on mixed enterprises while the proportion of contributions directed to the budget increases. In this sense, the reform should be applauded. But the reform falls far short in other ways. First, while progressive at higher prices, the law remains regressive at low prices: with a signifi-cant price decrease, some projects become unviable. Second, taking into account the short-term increase in operating costs that often accompany significant price increases, the new rates are still excessive, especially considering Venezuela’s country risk and the current political uncertainty. Third, the reform defines extraordinary prices according to the price set annually in the budget law, so it does not address the uncertainty as to the actual tax rate. This necessarily limits the potentially positive impact on investment.
The proposed reform goes in the right direction, but it falls short. If not accompanied by a policy change that generates the necessary certainty to partners to advance the large investments required, it is difficult to see how this law translates into better perspectives for the sector. Finally, although the proportion of resources going to FONDEN has decreased, it is still a significant percentage. Taking into account PDVSA’s social spending observed in recent years, more than half of the contributions to the nation continue to be managed on a discretionary basis by the Executive. This is contrary to the transparency and accountability that should characterize the use of oil resources.
CONTRIBUTIONS TO THE NATIONAL DEVELOPMENT FUND (PERCENTAGES)
Percentage deposited into Fonden
Source: Authors’ calculations based on the Official Gazette of the Bolivarian Republic of Venezuela No. 40,114 dated February 20, 2013
30 40 50 60 70 80 90 100 110 120 130 140 150 160 170 1800
10
20
2011 LAW
2013 LAW
PRICE US$/BBL
PERC
ENTA
GE
30
40
50
60
70
80
An important aspect of the reform is the change in income distribution between the budget and the FONDEN. The revenues directed to the budget increases it in two ways: (1) increasing the ceiling for calculation of royalties from 70 to $ 80 results in an additional $ 3.3 per barrel that go to the budget and (2) by rolling the segments on which the tax applies at extraordinary prices and exorbitant increases the income tax (increase partially offset by the additional royalty). At $ 100 per barrel, the reform increases the amount directed to the budget by $ 5.17 per barrel: an increase of 14.3 percent compared to previous law.
FONDEN, on the other hand, receives $ 7 less per barrel, which is equivalent to a reduction of 25 percent. This means that a greater proportion of the contributions to the nation will go to the budget. This is one of the most important aspects of the reform, as the budget, with all its imperfections, it tends to be more transparent than the use of extra-budgetary funds. At a price of $ 100 per barrel, the percentage of oil contributions that are diverted to FONDEN is reduced from 42 to 32 percent.

14
Fuente: Ministry of Popular Power for Oil and Mining.Note: Venezuela Oil Basket corresponds to the price of the crude Tía Juana.
OIL PRICES
MONTHLY PRICES OF THE VENEZUELAN OIL BASKET, 1999-2012(DOLLARS PER BARREL, CURRENT DOLLARS)
JAN
-99
AU
G-9
9
MA
R-00
OC
T-00
MAY
-01
DEC
-01
JUL-
02
FEB-
03
SEP-
03
APR
-04
NO
V-04
JUN
-05
JAN
-06
AU
G-0
6
MA
R-07
OC
T-07
MAY
-08
DEC
-08
JUL-
09
FEB-
10
SEP-
10
APR
-11
NO
V-11
JUN
-12
JAN
-13
140
120
100
80
60
40
20
0
15
Year WTI OPEC Basket Price Venezuelan Basket Price
2007 72.24 69.08 64.74
2008 99.90 94.45 86.49
2009 61.82 61.06 57.08
2010 79.52 77.45 71.97
2011 95.12 107.47 101.06
2012* 94.23 109.53 103.42
During 2012, the average price of the Venezuelan oil basket was $ 103.42, still above $ 100 per barrel during the first two quarters ($ 111.99 and $ 103.47 respectively), however, nearing $ 98 for the third and fourth quarter ($ 98.97 and $ 98.32 respectively).
AVERAGE VALUES OF OIL PRICES, 2007-2012
Source: Ministry of Popular Power for Oil and Mining. 2012 * Preliminary figures.

16
WORLD NORTH & SOUTH AMERICA VENEZUELA
CONVENTIONAL CRUDES HEAVY & EXTRA-HEAVY CRUDES
1.800
1.600
1.400
1.200
1.000
800
600
400
200
0
1668.9
548258 39
5258,809 MMB correspond to the reserves of the Orinoco Oil Belt, of which 3,935 are heavy oil reserves and 254,874 MMB are extra heavy crude.
Source: BP Statistical Review of World Energy 2013 and Informe de Gestión Anual.Note 1: The World Total and America´s reserves figures correspond to BP Statistical Review of World Energy 2013.Note 2: PDVSA assumes a recovery factor of 20 percent as a minimum recovery value.
In accordance with official figures, Venezuela’s oil reserves are the largest in America and worldwide. According to PDVSA Management Report 2012, proven oil reserves stood at 297.7 billion barrels in 2012, 123 million barrels higher than 2011 due to the addition of 13 new archaeological discoveries. This represents 54 percent of the oil reserves in the Americas and 18 percent of the world’s reserves.
EXPLORATION AND PRODUCTION
Reserves 2012
OIL RESERVES, 2012(BILLION BARRELS)
OIL RESERVES IN VENEZUELA ARE DISTRIBUTED AS FOLLOWS:
Exploration costs, mainly geophysical expenses, increased by approximately 202 percent from 163 million dollars in 2011 to 492 million in 2012.
According to PDVSA Management Report 2012,
proven oil reserves stood at 297.7 billion barrels in 2012
BASIN RESERVES (MMB)
Maracaibo-Falcón 19.986
Barinas-Apure: 1.191
Oriental 276.1565
Carúpano 402
17
380036003400320030002800260024002200200018001600140012001000800600400200
0
300
250
200
150
100
50
0
1980
1982
1984
1986
1988
1990
1992
1994
1996
1998
2000
2002
2004
2006
2008
2010
2012
RESERVES BILLIONS OF BARRELLS PRODUCTION THOUSANDS BD
PRO
DU
CTI
ON
(TH
OU
SAN
DS
BARR
ELS
DA
ILY
)
RESE
RVES
(BIL
LIO
N O
F BA
RREL
LS)
EXPLORATION AND PRODUCTION
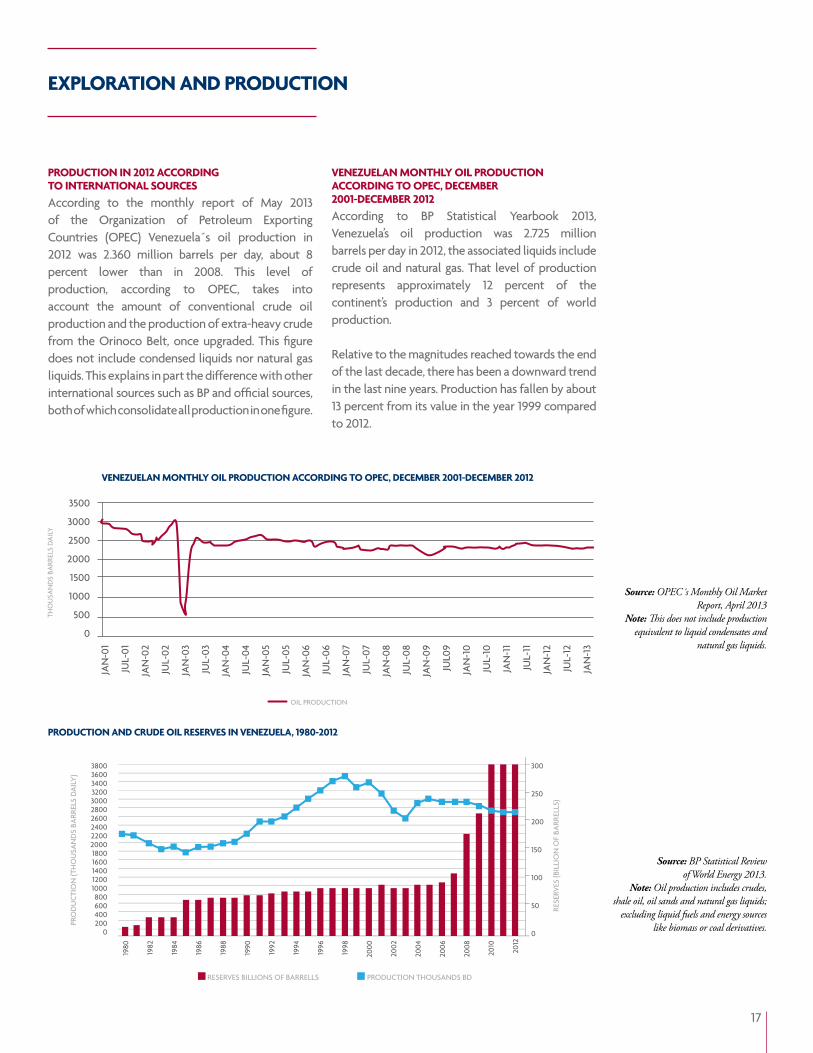
PRODUCTION IN 2012 ACCORDING TO INTERNATIONAL SOURCESAccording to the monthly report of May 2013 of the Organization of Petroleum Exporting Countries (OPEC) Venezuela´s oil production in 2012 was 2.360 million barrels per day, about 8 percent lower than in 2008. This level of production, according to OPEC, takes into account the amount of conventional crude oil production and the production of extra-heavy crude from the Orinoco Belt, once upgraded. This figure does not include condensed liquids nor natural gas liquids. This explains in part the difference with other international sources such as BP and official sources, both of which consolidate all production in one figure.
PRODUCTION AND CRUDE OIL RESERVES IN VENEZUELA, 1980-2012
VENEZUELAN MONTHLY OIL PRODUCTION ACCORDING TO OPEC, DECEMBER2001-DECEMBER 2012According to BP Statistical Yearbook 2013, Venezuela’s oil production was 2.725 million barrels per day in 2012, the associated liquids include crude oil and natural gas. That level of production represents approximately 12 percent of the continent’s production and 3 percent of world production.
Relative to the magnitudes reached towards the end of the last decade, there has been a downward trend in the last nine years. Production has fallen by about 13 percent from its value in the year 1999 compared to 2012.
Source: BP Statistical Review of World Energy 2013.
Note: Oil production includes crudes, shale oil, oil sands and natural gas liquids;
excluding liquid fuels and energy sources like biomass or coal derivatives.
Source: OPEC´s Monthly Oil Market Report, April 2013
Note: This does not include production equivalent to liquid condensates and
natural gas liquids.
VENEZUELAN MONTHLY OIL PRODUCTION ACCORDING TO OPEC, DECEMBER 2001-DECEMBER 2012
JAN
-01
JUL-
01
JAN
-02
JUL-
02
JAN
-03
JUL-
03
JAN
-04
JUL-
04
JAN
-05
JUL-
05
JAN
-06
JUL-
06
JAN
-07
JUL-
07
JAN
-08
JUL-
08
JAN
-09
JUL0
9
JAN
-10
JUL-
10
JAN
-11
JUL-
11
JAN
-12
JUL-
12
JAN
-13
3500
3000
2500
2000
1500
1000
500
0
THO
USA
ND
S BA
RREL
S D
AIL
Y
OIL PRODUCTION

18
14000
12000
10000
8000
6000
4000
2000
0
1998
1999
2000
2001
2002
2003
2004
2005
2006
2007
2008
2009
2010
2011
2012
VENEZUELA
SAUDI ARABIA
IRAN
IRAQ
UNITED ARAB EMIRATES
THO
USA
ND
S BA
RREL
S D
AIL
Y
COMPARED OIL PRODUCTION VENEZUELA – OPEC The chart shows a remarkable difference between the behavior of Venezuelan oil production from the rest of OPEC. The collapse in production observed in Iraq after 2003 was due to the Iraq War.
COMPARATIVE OIL PRODUCTION VENEZUELA - AMERICAWhen comparing the behavior of Venezuela, to other oil producers in the region, there are evident similarities between Venezuela and Mexico, both traditional exporters in the region. In addition, the effect of the discovery of the oil sands in Canada and Brazil’s large deposits can be observed. It also highlights the significant increase in production in the U.S. - due to the shale oil revolution - and in Colombia, following important institutional reforms in its oil sector.
Source: International Energy Agency World Energy Outlook 2012, New Policies Scenar-io and own calculations.
PRODUCTION TAKING 1998 LEVEL AS BASE
COMPARED OIL PRODUCTION VENEZUELA-OPEC
COMPARED OIL PRODUCTION VENEZUELA – AMERICA
160
140
120
100
80
60
40
20
0
1998
1999
2000
2001
2002
2003
2004
2005
2006
200 7
2008
2009
2010
2011
2012
VENEZUELA
SAUDI ARABIA
IRAN
IRAQ
UNITED ARAB EMIRATES
KUWAIT
250
200
150
100
50
0
1998
1999
2000
2001
2002
2003
2004
2005
2006
2007
2008
2009
2010
2011
2012
VENEZUELA
CANADA
BRAZIL
MEXICO
COLOMBIA
UNITED STATES
10000
9000
8000
7000
6000
5000
4000
3000
2000
1000
0
1998 2000 2002 2004 2006 2008 2010 2012
THO
USA
ND
S BA
RREL
S D
AIL
Y
VENEZUELA
CANADA
MEXICO
COLOMBIA
BRAZIL
UNITED STATES
Source: International Energy Agency World Energy Outlook 2012, New Policies Scenar-io and own calculations.

19
PDVSA PRODUCTION, DOMESTIC CONSUMPTION AND CONVENTIONAL OIL RESERVES IN VENEZUELA, 1980-2012
INVESTMENTIn 2012 investments in the oil industry increased by 47 percent relative to 2011, rising from 17.5 billion dollars to 24.6. In 2012 the investments were concentrated in the area of oil exploration and production with an investment of approximately U.S. $ 12.48 billion. There was a decrease in investment in non-oil sectors of 51 percent,
INVESTMENT BY SECTOR IN 2012
Source: PODE until 2008, Informe Operacional y Financiero de Pdvsa (2009), Informe de Gestión PDVSA 2010; Informe
de Gestión PDVSA 2011 and Informe de Gestión PDVSA 2012.
Note 1: Reserve level includes conventional and heavy-weight crudes certified until 2007. They were estimated considering
a 20 percent recovery rate.Note 2: Data includes natural gas
condensates and heavy-weight crudes destined to Orimulsion.
declining from 1.46 billion dollars to 0.715 billion. However, investments in “Other” areas increased by 86 percent, resulting in the percentage share of total investments exceeding the sum of investments in refining, trading and supply, gas and food and consumer goods / non-oil subsidiaries.
PDVSA: PRODUCTION, CONSUMPTION AND OIL RESERVES IN VENEZUELA, 1980-2012According to official figures, the production was 2.91 million barrels per day in 2012, representing a decrease of 2.7 percent from 2011, when production was 2.99 million barrels per day. With respect to consumption, PDVSA reported for 2012 a total of 681 thousand barrels per day.
In 2011, PDVSA’s operating expenses were U.S. $ 14.555 million, an increase of 58 percent over 2012, when they were 23.014 million dollars. This increase relates primarily to the costs of Welfare, Labor and Benefit of workers.
Source: Informe de Gestión PDVSA 2012.
27EXPLORATION AND PRODUCTION
REFINNING, COMMERCIALIZING AND SUPPLY
GAS
FOOD AND MASSIVE CONSUMPTIONPRODUCTS/AFFILIATES UNRELATED TO OIL
OTHERS
51
11
8 3
%
3500
3000
2500
2000
1500
1000
500
0
300
250
200
150
100
50
0
1980
1981
1982
1983
1984
1985
1986
1987
1988
1989
1990
1991
1992
1993
1994
1995
1996
1997
1998
1999
2000
2001
2002
2003
2004
2005
2006
2007
2008
2009
2010
2011
2012
RESERVES MMMB PRODUCTION MBD CONSUMPTION MBD
THO
USA
ND
S BA
RREL
S D
AIL
Y

20
JAN
-01
JUL-
01
JAN
-02
JUL-
02
JAN
-03
JUL-
03
JAN
-04
JUL-
04
JAN
-05
JUL-
05
JAN
-06
JUL-
06
JAN
-07
JUL-
07
JAN
-08
JUL-
08
JAN
-09
JUL-
09
JAN
-10
JUL-
10
JAN
-11
JUL-
11
JAN
-12
JUL-
12
JAN
-13
3500
3000
2500
2000
1500
1000
500
0
1009080706050403020100
THO
USA
ND
SBA
RREL
S D
AIL
Y
OPE
RATI
VE O
IL R
IGS
OIL PRODUCTION OPERATIVE RIGS
OPERATIVE OIL AND GAS RIGS, JANUARY 1995 - APRIL 2013 (UNITS)
OPERATIVE RIGS AND OIL PRODUCTION DECEMBER 2001 – DECEMBER 2012
Source: Baker Hughes International Rig Count.
Source: Baker Hughes International Rig Count and OPEC´s Monthy Report, January 2013
Another indicator that illustrates the approximate size of the investment in exploration and production of hydrocarbons is the number of active rigs. The number of rigs and the amount of production generally move in the same direction, when the number of rigs increases or decreases, production tends to increase or decrease accordingly, albeit more slowly.
Between 2005 and 2008, activation and removal of this equipment was relatively volatile: the number of rigs in operation ranged from 63 to 84. By December 2009 the teams were reduced to 49, however, in the course of 2010 drilling activity recovered closing in December 2010 with 83 rigs in activity, decreasing again during the last quarter of 2011, closing the year with a figure of 69 teams throughout the month of December. Until November 2012 the number of active rigs ranged between 68 and 87, decreasing to 63 in December of that year.
140
120
100
80
60
40
20
0
JAN
-95
JUL-
95
JAN
-96
JUL-
96
JAN
-97
JUL-
97
JAN
-98
JUL-
98
JAN
-99
JUL-
99
JAN
-00
JUL-
00
JAN
-01
JUL-
01
JAN
-02
JUL-
02
JAN
-03
JUL-
03
JAN
-04
JUL-
04
JAN
-05
JUL-
05
JAN
-06
JUL-
06
JAN
-07
JUL-
07
JAN
-08
JUL-
08
JAN
-09
JUL-
09
JAN
-10
JUL-
10
JAN
-11
JUL-
11
JAN
-12
GAS
OIL
TOTAL

21
OIL PRODUCTION CLASSIFIED BY CONTRACT CONDITIONS, VENEZUELA 1990-2012
OIL PRODUCTION CLASSIFIED BY CONTRACT CONDITIONS, VENEZUELA 1990-2012 (PERCENTAGES OF TOTAL PRODUCTION)
Source: (Ministerio de Energía y Petróleo (PODE 2007-2008); (*) Informe sobre la gestión y resultados de Pdvsa, 2009, 2010,
2011 & 2012.Note 1: Since 2006 the conventional
crude operating agreements transformed into Joint Ventures.
Note 2: Since 2007 the heavy weight strategic agreements transformed into
Joint Ventures.Note 3: Production data does not include
Natural Gas Liquids.
Source: Informe de Gestión Anual de PDVSA de 2012.
Note 1: Since 2006 the conventional crude operative agreements transformed into
Joint VenturesNote 2: Since 2007 the heavy weight strategic agreements transformed into
Joint VenturesNote 3: Production data doesn´t
include Natural Gas Liquids
63PDVSA DIRECT MANAGMENT
CONVENTIONAL CRUDES, JOINTVENTURES (FORMER OPERATIVE AGREEMENTS)
HEAVY-WEIGHT CRUDES, JOINTVENTURES (FORMER STRATEGIC AGREEMENTS)
22
%15
PRODUCTION BY TYPE OF SCHEME
According to the 2012 Annual Management Report of PDVSA, total audited production of crude oil in Venezuela was 2.91 million barrels per day.
The daily production of Venezuela, including 124 million barrels of natural gas was 3.034 million barrels a day. Production corresponding to own effort (PDVSA alone) amounted to 1.835 million bpd oil in the following areas of the country:East: 971 thousand barrels per dayWest: 533 thousand barrels per dayBelt: 417 thousand barrels per dayPDVSA Gas: 29 thousand barrels per day
The remaining production corresponds to projects in which PDVSA participates jointly with third parties:Joint ventures conventional oil: 432 thousand barrels per dayJoint ventures of extra heavy oil: 643 thousand barrels per day
According to official figures, the production of projects solely operated by PDVSA reached a record high in 1997, standing at 2.92 million barrels per day. However, from 1992 to 2005 sole production by PDVSA as a percentage of total production tended to decrease and there was a progressive increase in the production of private enterprises in the former operating agreements and strategic partnerships. This trend reversed after 2006 due to contractual changes giving PDVSA greater participation in all projects. However, as of 2008 a decrease can again be observed in the production of PDVSA’s own efforts as a percentage of total production.
3.5
3
2.5
2
1.5
1
0.5
0
1991
1992
1993
1994
1995
1996
1997
1998
1999
2000
2001
2002
2003
2004
2005
2006
2007
2008
2009
2010
2011
2012
HEAVY-WEIGHT CRUDES, JOINTVENTURES (FORMER STRATEGICAGREEMENTS)
CONVENTIONAL CRUDES, JOINTVENTURES (FORMER OPERATIVEAGREEMENTS)
PDVSA DIRECT MANAGMENT
THO
USA
ND
S BA
RREL
S D
AIL
Y

22
Exploration projects and conventional and extra heavy oil production in Venezuela are developed under two schemes: a) PDVSA’s own effort and b) joint ventures between PDVSA and third parties.
EXPLORATION AND PRODUCTION
Projects with third parties
1. Conventional oil projects Since 2006, projects in conventional oil fields are developed by 21 joint ventures which were previously linked to the figure of the operating agreements. These operations are aimed primarily at maintaining production levels because they operate in mature fields with a natural tendency of decline in production.
Joint ventures are formed between the Venezuelan Petroleum Corporation (CVP), a subsidiary of PD-VSA, with a minimum stake of 60 percent, and pri-vate companies (mostly foreign), with a maximum of 40 percent.
2. Heavy crude projects Orinoco Belt (in Spanish Faja Petrolífera del Orinoco FPO):• Location: south of the states Guárico, Anzoátegui and Monagas.• Geographical Area: approximately 55 thousand square kilometers.• Area exploitation: about 12 thousand square kilometers.• Petroleum in site8 : approximately between 914 billion and 1.36 trillion barrels, besides the 37 billion barrels that were had officialized in 2005.• Reserves 2012: 258,809 million barrels • Petroleum heavy: 3,935 million barrels. • Petroleum extra-heavy: 254,874 million barrels.• Average API: 8.6 degrees API.
8 The Orinoco Belt also has a large volume of original gas in place, which is a potential source of supply for future development projects that will eventually need large amounts of gas.9According to the United States Geological Survey Service (USGS) Orinoco Belt’s reserves could be estimated at 380 – 650 billion barrels based on arecovery factor of 45 percent (this rate takes into account technological advances that have not been made yet).

23
PDVSA and BP, Chevron, ConocoPhillips, ExxonMobil, Statoil and Total, started in the late nineties, the exploitation of extra-heavy crude with the establishment of strategic partnerships. These agreements represent an investment of about 17 billion dollars, which allowed to reach an average production in 2006 of 560 thousand barrels per day. Strategic partnerships were developed with the aim of vertically integrating the business of heavy oil from the Orinoco Belt, to include not only mining activities but also upgrading plants to produce synthetic crude with higher API gravity, better traded in international markets. According to this scheme, the participation of PDVSA averaged forty percent and a majority stake was in the hands of private partners.
Reserves certification projects Orinoco Magna Reserve Project (In Spanish Proyecto Orinoco Magna Reserva) is part of the Plan Siembra Petrolera 2005-2030 and is intended to quantify and certify the hydrocarbon reserves in the Orinoco Oil Belt.The FPO has been divided into 30 blocks, nested according to their technical and strategic in four areas: • Boyaca, Junin, Ayacucho and Carabobo (excludes firms assigned area Petrocedeño, SA, Petromonagas, SA, Petrozuata, CA and Oil Sinovensa, SA). From these blocks, 22 will be quantified in a joint effort between the CVP and 28 foreign companies, mainly state.The rest of the blocks will be quantified with PDVSA’s own effort.
3. Exploration projects Since 2007, the exploration activities projects, former exploration, risk and profit sharing agreements, are operating under the new contractual scheme of joint ventures.
EXPLORATION AND PRODUCTION
Source: : Informe de Gestión Anual de PDVSA de 2012.
24
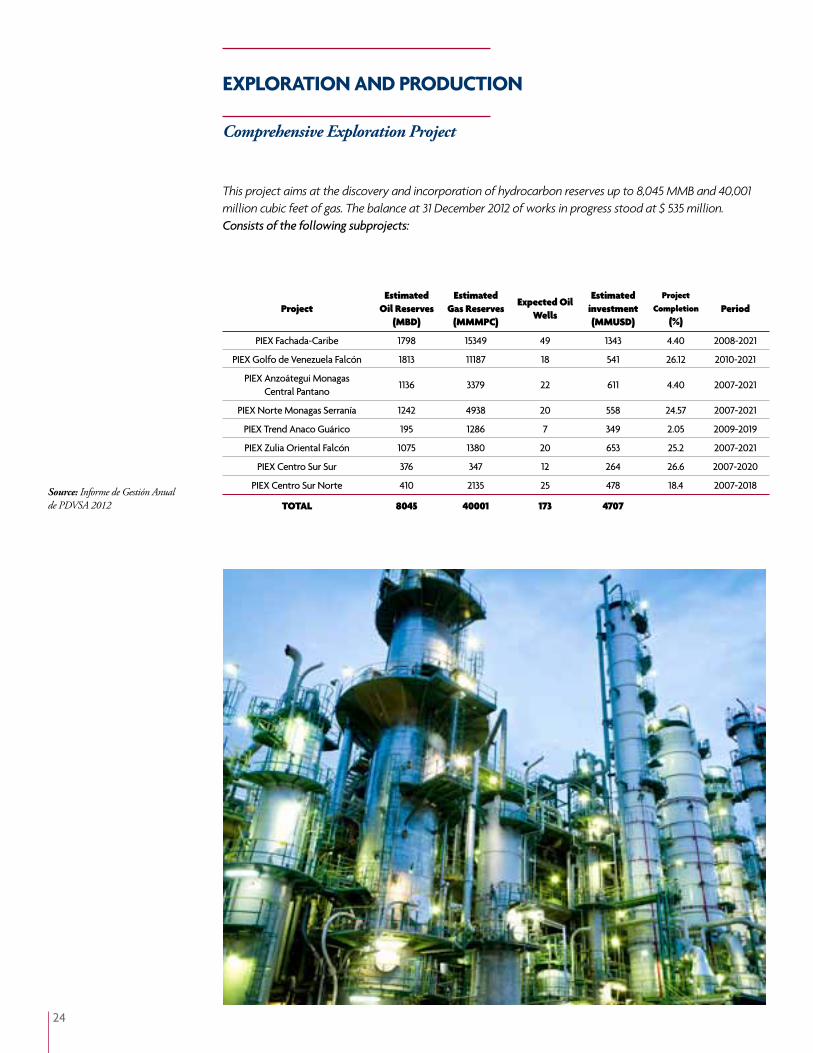
Source: Informe de Gestión Anual de PDVSA 2012
This project aims at the discovery and incorporation of hydrocarbon reserves up to 8,045 MMB and 40,001 million cubic feet of gas. The balance at 31 December 2012 of works in progress stood at $ 535 million.Consists of the following subprojects:
EXPLORATION AND PRODUCTION
Comprehensive Exploration Project
ProjectEstimated
Oil Reserves (MBD)
Estimated Gas Reserves
(MMMPC)
Expected Oil Wells
Estimated investment (MMUSD)
Project Completion
(%)Period
PIEX Fachada-Caribe 1798 15349 49 1343 4.40 2008-2021
PIEX Golfo de Venezuela Falcón 1813 11187 18 541 26.12 2010-2021
PIEX Anzoátegui Monagas Central Pantano
1136 3379 22 611 4.40 2007-2021
PIEX Norte Monagas Serranía 1242 4938 20 558 24.57 2007-2021
PIEX Trend Anaco Guárico 195 1286 7 349 2.05 2009-2019
PIEX Zulia Oriental Falcón 1075 1380 20 653 25.2 2007-2021
PIEX Centro Sur Sur 376 347 12 264 26.6 2007-2020
PIEX Centro Sur Norte 410 2135 25 478 18.4 2007-2018
TOTAL 8045 40001 173 4707

25
Dirección Oriente Joint Venture Date(%) PDVSA´s
Share(%) Associated
firm ShareMinority
shareholderFormerly known as
División Furrial
PetroquiriquireAugust 21,
200660 40 REPSOL
Quiriquire Operative Agreement
BoquerónOctober 11,
200660
26.67
13.33
Boquerón Holdings
PEI
Boquerón Operative Agreement
División Costa Afuera
PetrowaraoAugust 9,
200660 40 PERENCO
Pedernales Operative Agreement
PetrosucreDecember 19,
200774 26 ENI
Golfo de Paria Oeste
(CoroCoro) Exploration and Shared Revenue
Agreement
Petrolera PariaDecember 19,
200760
32
8
SINOPEC
INE Oil & Gas INC
Golfo de Paria Este (Posa) Exploration and Shared Revenue
Agreement
Petrolera GüiriaJanuary 10,
200864,25
19.5
16.25
ENI
INE Oil & Gas INC
Golfo de Paria Central Exploration and Shared Revenue
Agreement
JOINT VENTURES UNTIL 2012
26
Dirección Occidente
Joint Venture Date(%) PDVSA´s
Share(%) Associated
firm ShareMinority
shareholderFormerly known as
División Lago
Petroregional del Lago
August 11, 2006
60 40 ShellUrdaneta Operative Agreement
Petroindependiente
August 11, 2006
74.8 25.2 Chevron LL-652
Operative Agreement
LagopetrolDecember 5,
200769
26.353.1
1.55
HocolEhcopek
CIP
B2X.70/80 Operative Agreement
PetrowaraoAugust 9,
200660 40 PERENCO
Ambrosio Operative Agreement
Petrolera Sino-Venezolana
November 28, 2006
75 25 CNPCIntercampo
Norte Operative Agreement
Petrolera Bielovenezolana
December 14, 2007
60 40
Unión de Empresas Productoras Belorusneft
Bloque X Operative Agreement
División Costa Occidental
del Lago
PetroboscánAugust 11,
200660
39.20.8
ChevronINEMAKA
Boscán Operative Agreement
BaripetrolAugust 9,
200660
17.517.55
SuizumPERENCO
PFC
Colón Operative Agreement
PetroperijáSeptember
21, 200660 40 DZO
DZO Operative Agreement
PetrowayuSeptember 4,
200660
36
4
PETROBRASWilliams
International Oil & Gas
La Concepción Operative Agreement
Petrourdaneta** April 3, 2012 60 40Odebrecht
E & P
División Costa Oriental del Lago
PetrocabimasOctober 2,
200660 40 SEPCA
Cabimas Operative Agreement
PetrocumareboOctober 24,
200660 40 PFC
Falcón Este & Falcón Oeste
Operative Agreement
Petrozamora** May 4, 2012 60 40 Gazprombank
División Sur del Lago
PetroquiriquireAugust 21,
200660 40 REPSOL
Mene Grande Operative Agreement
JOINT VENTURES UNTIL 2012
27
Dirección Faja Joint Venture Date(%) PDVSA´s
Share(%) Associated
firm ShareMinority
shareholderFormerly known as
Dvisión Junín
Petrolera Indovenezolana
April 8, 2008 60 40 ONGCConvenio
operativo San Cristóbal
PetrocedeñoDecember 11,
200760
30.329.677
TotalStatoilHydro
Asociación estratégica
Sincor
PetroanzoáteguiFebruary 21,
2008100
Petromiranda* April 20, 2010 60 40Consorcio Nacional Petrolero
Petromacareo*September 17,
201060 40 Petrovietnam
Petrourica*December 14,
201060 40 CNPC
Petrojunín*December 14,
201060 40 ENI
División Carabobo
PetrodeltaOctober 3,
200760 40 HRN
Monagas Sur Operative Agreement
Petrolera Sinovensa
February 1, 2008
64.25 35.75 CNPC
PetromonagasFebruary 21,
200883.33 16.67 BP
Asociación estratégica Cerro
Negro
Petrocarabobo* June 25, 2010 60
111111
7
REPSOLPC Venezuela
Petrocarabobo
GangaIndoil
Netherlands B. V.
Petroindependencia*
June 25, 2010 60
345
1
Chevron Japan
Carabobo UkSuelopetrol
División Ayacucho
PetrokariñaAugust 31,
200660
29.2
10.8
PETROBRASInversora
Mata
Mata Operative Agreement
Petroven-BrasSeptember 4,
200660 40 PETROBRAS
Acema Operative Agreement
PetroritupanoSeptember 4,
200660
2218
PETROBRASVenezuela US
Oritupano-Leona Operative Agreement
PetronadoSeptember 15,
200660
268.365.64
CGCBPE
KNOC
Casma-Anaco Operative Agreement
PetrocuraguaOctober 18,
200660
2812
CIPOPEN
Zumano Operative Agreement
PetrozumanoNovember 6,
200760 40 CNPC
Kaki Operative Agreement
Petrolera KakiNovember 28, 2006
60 40 INEMAKAConvenio
operativo Kaki
Petrolera Vencupet*
December 3, 2010
60 40 CUPET
JOINT VENTURES UNTIL 2012

28
Fuente: Informe de Gestión Anual de PDVSA 2012.**New Joint Venture mature field.
Dirección Faja (cont.)
Joint Venture Date(%) PDVSA´s
Share(%) Associated
firm ShareMinority
shareholderFormerly known as
División Ayacucho(cont.)
Petrolera Sino-Venezolana
November 28, 2006
75 25 CNPCCaracoles Operative Agreement
Petrolera Bielovenezolana
December 14, 2007
60 40
Unión de Empresas
Productoras Belorusneft
Guara Este Operative Agreement
PetropiarDecember 19,
200770 30 Chevron
Ameriven Operative Agreement
Petrolera Venangocupet**
November 26, 2012
60 40
Comercial Cupet, S. A. y Sonangol
(46) Pesquisa & Producao,
S. A.
División Boyacá PetroguáricoOctober 25,
200670 30 Teikoku
Guárico Oriental Operative Agreement
JOINT VENTURES UNTIL 2012

29
10 Includes only PDVSA’s net share.Source: Informe de Gestión Anual
de PDVSA de 2012.
Venezuela´s global refining capacity (domestic and offshore) at the end of 2012 was 2.822 million barrels per day. Of this, the refineries located in the country have the capacity to process 1.3 millions barrels per day. The rest of the refinery capacity is located in the Caribbean, Europe and the United States, which have a total capacity of 469 thousand barrels per day, 67 and 1.428 million barrels per day, respectively.
REFINING
PDVSA REFINING CAPACITY 2012 (PERCENTAGES OF TOTAL REFINING)
39VENEZUELA
UNITED STATES
CARIBBEAN
EUROPA
46
%
14
1
REFINERÍA REFINING CAPACITY (THOUSAND BD)
LOCATION
DOMESTIC
Centro de Refinación de Paraguaná CRP (Refinerías Amuay y Cardón)
955 Falcón
Puerto La Cruz 187 Anzoátegui
El Palito 140 Carabobo
Bajo Grande 16 Zulia
San Roque 5 Anzoátegui
Total nacional 1,303
Offshore 10 Isla| 335 Curazao
Camilo Cienfuegos 32 Cuba
Jamaica 17 Jamaica
Haina17
República Dominicana
Lake Charles 425 Estados Unidos
Corpus Christi 157 Estados Unidos
Lemont 167 Estados Unidos
Chalmette 92 Estados Unidos
Saint Croix 248 Estados Unidos
Nynashamn 15 Suecia
Gothenburg 5 Suecia
Dundee 4 Escocia
Eastham 5 Inglaterra
Total offshore 1.519
PDVSA’s total refining capacity 2.822

30
REFINING
Refineries outside Venezuela, 2012
Source: Informe Operacional y Financiero PDVSA 2012.
Refineries Location CompanyRefinning Capacity
(MBD)
PDVSA Refinning Capacity (MBD)
Share
Lake Charles United States CITGO 425 425 100%
Corpus Christi United States CITGO 157 157 100%
Lemont United States CITGO 167 167 100%
Chalmette United StatesChalmette Refining(2) 184 92 50%
Saint Croix United States Hovensa(3) 495 248 50%
Camilo Cienfuegos
Cuba CUVENPETROL 65 32 49%
Jamaica Jamaica Petrojam 35 17 49%
Isla Curazao PDVSA 335 335 100%
Haina Dominican RepublicRefidomsa
PDVSA34 17 49%
Dundee Scotland Nynas 9 4 50%
Eastham Inglaterra Nynas 18 5 25%
Nynashamn Sweden Nynas 29 15 50%
Gothenburg Sweden Nynas 11 5 50%

31
Source: Informe de Gestión Anual de PDVSA 2012 y 2011.
* Lake Charles, Corpus Christi & Lemont refineries
**Closed since february 2012***Dundee, Eastham, Nynashamn &
Gothenburg refineries.
Oil volume processed and inputs for processes and mixtures2011 – 2012
International Refining
Processed Oil Volume (includes
process and mixtures inputs) - 2012
(Thousands B/D)
Processed Oil Volume (includes
process and mixtures inputs) - 2011
(Thousands B/D)
Process and Mixtures Inputs. - 2012 (Thousands
B/D)
Process and Mixtures Inputs- 2011
(Thousands B/D)
CITGO Petroleum Corporation*
637 659
Chalmette 133 131
Saint Croix ** 283
Isla 165 164 11 6
Camilo Cienfuegos
55 55
Jamaica 23.8 24.5
Haina 24.6 26.2
Nynas*** 55.7 56.6
Total 1094.1 1399.3 11 6
National RefiningProcessed Oil Volume - 2012
(Thousands B/D)
Processed Oil Volume - 2011
(Thousands B/D)
Process and Mixtures Inputs. - 2012 (Thousands
B/D)
Process and Mixtures Inputs- 2011
(Thousands B/D)
Centro de Refinación Paraguaná
(CRP)638 699 103 78
Refinería Puerto La Cruz
171 169 56 62
Refinería El Palito 127 127 101 91
Total 936 995 260 231

32
COMMERCIALIZATION
According to official figures, exports of oil and refined products of Venezuela reached 2.568 million barrels per day in 2012 to include:Raw: 2.060 million barrels per dayRefined products and natural gas liquids: 508 thousand barrels per day
Sources: Informe Operacional Financiero de PDVSA 2007 & Informe de Gestión Anual de PDVSA 2008, 2009, 2010, 2011 y 2012.
Of the total exports were commercialized by region:North America: 1.002 million barrels per dayCentral America and the Caribbean: 564 thousand barrels per dayAsia: 924 thousand barrels per dayEurope: 156 thousand barrels per daySouth America: 73 thousand barrels per dayAfrica: 21 thousand barrels per dayOther: 13 thousand barrels per day6 grados API.
EXPORTS BY REGION 2006-2012 (THOUSANDS B/D)
According to official figures, exports of oil and refined
products of Venezuelareached 2.568 million barrels
per day in 2012
NORTH AMERICA (ST. CROIX INCLUDED)
CENTRAL AMERICA & THE CARIBBEAN
ASIA
EUROPE
SOUTH AMERICA
AFRICA
OTHERS
0 200 400 600 800 1000 1200 1400 1600 1800
2012 2011 2010 2009 2008 2007 2006

33
Product 2012 2011 2010 2009 2008 2007 2006 2005
Gasoline & nafta 30 46 49 48 69 80 95 87
Destillates 43 64 63 108 104 133 140 162
Residual fuel oil 258 268 215 297 227 160 174 189
Asphalt 5 1 0,3 1 0 10 16 20
Kerosene/Turbo fuels/Jet 57 66 59 59 64 59 58 60
Others 40 33 43 33 61 74 82 60
EXPORTS CLASSIFIED BY PRODUCT 2005-2012 (THOUSANDS B/D)
Source: Informe de Gestión Anual de PDVSA de 2012.
COMMERCIALIZATION
34
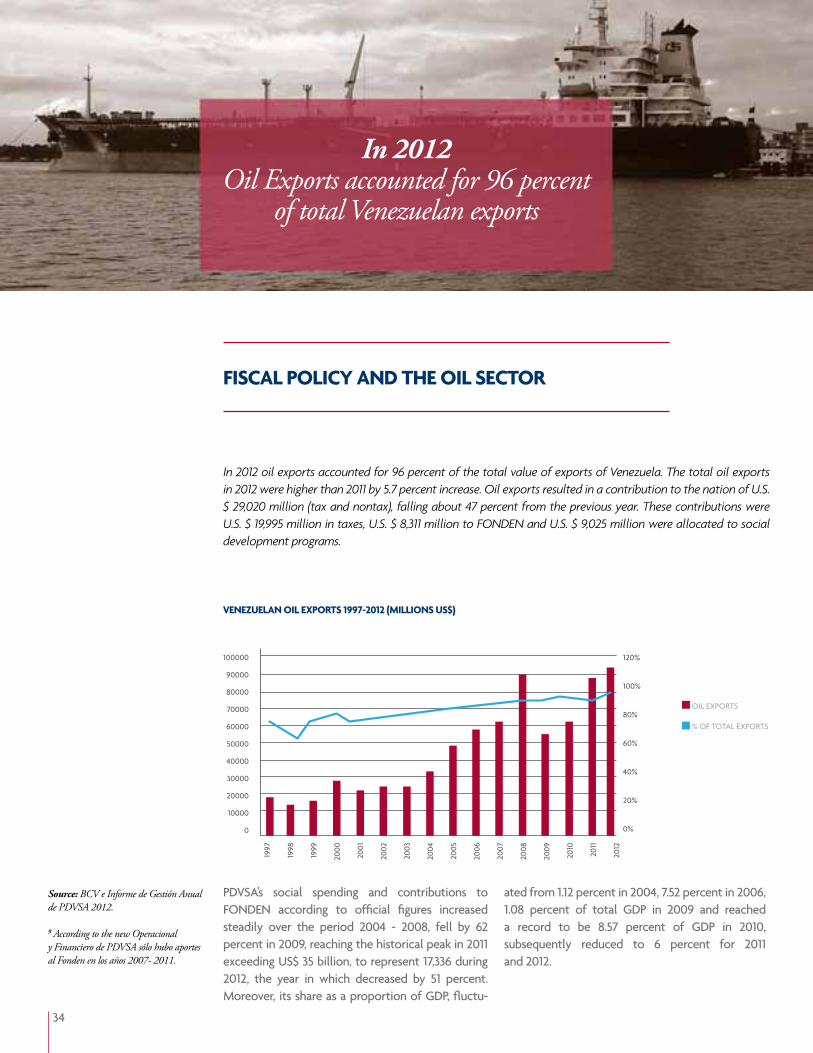
In 2012 oil exports accounted for 96 percent of the total value of exports of Venezuela. The total oil exports in 2012 were higher than 2011 by 5.7 percent increase. Oil exports resulted in a contribution to the nation of U.S. $ 29,020 million (tax and nontax), falling about 47 percent from the previous year. These contributions were U.S. $ 19,995 million in taxes, U.S. $ 8,311 million to FONDEN and U.S. $ 9,025 million were allocated to social development programs.
FISCAL POLICY AND THE OIL SECTOR
PDVSA’s social spending and contributions to FONDEN according to official figures increased steadily over the period 2004 - 2008, fell by 62 percent in 2009, reaching the historical peak in 2011 exceeding US$ 35 billion, to represent 17,336 during 2012, the year in which decreased by 51 percent. Moreover, its share as a proportion of GDP, fluctu-
ated from 1.12 percent in 2004, 7.52 percent in 2006, 1.08 percent of total GDP in 2009 and reached a record to be 8.57 percent of GDP in 2010, subsequently reduced to 6 percent for 2011 and 2012.
Source: BCV e Informe de Gestión Anual de PDVSA 2012. 9 According to the new Operacional y Financiero de PDVSA sólo hubo aportes al Fonden en los años 2007- 2011.
VENEZUELAN OIL EXPORTS 1997-2012 (MILLIONS US$)
In 2012Oil Exports accounted for 96 percent
of total Venezuelan exports
100000
90000
80000
70000
60000
50000
40000
30000
20000
10000
0
120%
100%
80%
60%
40%
20%
0%
1997
1998
1999
2000
2001
2002
2003
2004
2005
2006
2007
2008
2009
2010
2011
2012
OIL EXPORTS
% OF TOTAL EXPORTS
35
40000
35000
30000
25000
20000
15000
10000
5000
02012 2011 2010 2009 2008 2007 2006
FONDEN
SOCIAL DEVELOPMENT PROGRAMS
TAXES
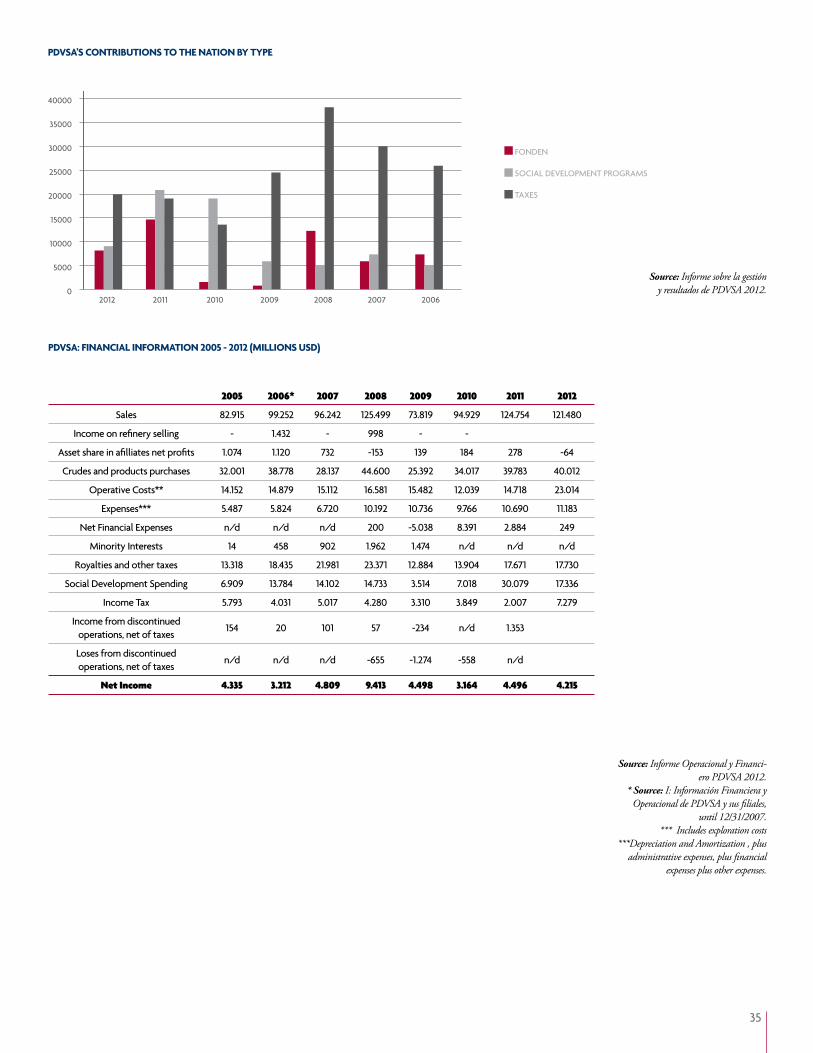
2005 2006* 2007 2008 2009 2010 2011 2012
Sales 82.915 99.252 96.242 125.499 73.819 94.929 124.754 121.480
Income on refinery selling - 1.432 - 998 - -
Asset share in afilliates net profits 1.074 1.120 732 -153 139 184 278 -64
Crudes and products purchases 32.001 38.778 28.137 44.600 25.392 34.017 39.783 40.012
Operative Costs** 14.152 14.879 15.112 16.581 15.482 12.039 14.718 23.014
Expenses*** 5.487 5.824 6.720 10.192 10.736 9.766 10.690 11.183
Net Financial Expenses n/d n/d n/d 200 -5.038 8.391 2.884 249
Minority Interests 14 458 902 1.962 1.474 n/d n/d n/d
Royalties and other taxes 13.318 18.435 21.981 23.371 12.884 13.904 17.671 17.730
Social Development Spending 6.909 13.784 14.102 14.733 3.514 7.018 30.079 17.336
Income Tax 5.793 4.031 5.017 4.280 3.310 3.849 2.007 7.279
Income from discontinued operations, net of taxes
154 20 101 57 -234 n/d 1.353
Loses from discontinued operations, net of taxes
n/d n/d n/d -655 -1.274 -558 n/d
Net Income 4.335 3.212 4.809 9.413 4.498 3.164 4.496 4.215
PDVSA: FINANCIAL INFORMATION 2005 - 2012 (MILLIONS USD)
Source: Informe Operacional y Financi-ero PDVSA 2012.
* Source: I: Información Financiera y Operacional de PDVSA y sus filiales,
until 12/31/2007.*** Includes exploration costs
***Depreciation and Amortization , plus administrative expenses, plus financial
expenses plus other expenses.
Source: Informe sobre la gestión y resultados de PDVSA 2012.
PDVSA’S CONTRIBUTIONS TO THE NATION BY TYPE

36
Investment Plan: Siembra Petrolera PDVSA announced in 2005 the Siembra Petrolera Plan 2005-2012, proposing the use of oil resources to enhance the energy production capacity of Venezuela. According to the plan, oil production by the end of 2012 should have almost doubled reaching 5.837 million barrels a day. That said production declined 11% in that period.In PDVSA´s Annual Report for 2012, a new Siembra Petrolera Plan for 2012 to 2019 was announced.
Goals for the Year 2019• Increase the level of oil production to 6 million barrels per day in 2019, of which 4 millions barrels per day come from the Orinoco Oil Belt.• Increase production of natural gas to a volume of 11,947 million cubic feet, with a significant proportion coming from the gas belt of our territorial waters.• Increase production of Liquid Natural Gas to 255 thousand barrels per day.• Raise the domestic refining capacity to 2.2 thousand barrels per day and to 2.4 thousand barrels per day internatinally, for a total capacity of 4.6 thousand barrels per day.• Achieve a level of exports of crude and products of 5.6 thousand barrels per day.• Develop a systematic and sustainable industrial capacity for goods and services required by the hydrocarbon core activities.• Strengthen the national capacity to transport crude and products.
Amounts and investment scheme PDVSA estimates that implementation of the Plan will require an investment of approximately U.S. $ 256,986 million in the period 2013-2019. Of that amount, PDVSA estimates about it will provide 81 percent; the remaining 19 percent will be contributed by the partners. Of the total investments, 74 percent will be invested in exploration and production, 9 percent will be invested in PDVSA Gas, 10 percent in Refining, 2 percent in Trade and Supply, and the remaining 5 percent in Other Organizations.
Source: Informe de Gestión Anual de PDVSA 2012.
PDVSA´S SOCIAL CONTRIBUTIONS 2007-2012(AS PERCENTAGES OF TOTAL CONTRIBUTIONS TO THE NATION)
40%
35%
30%
25%
20%
15%
10%
5%
0%2006 2007 2008 2009 2010 2011 2012
SOCIAL PROGRAMS
FONDEN
Sales in 2012 were reduced from 124.754 million dollars in 2011 to 121,480 million in 2012 reflecting a decrease of 2.6 percent. In the case of royalties and other taxes there was an increase of 0.035 percent from 17,671 million dollars in 2011 to 17,730 million in 2012. Moreover, the income tax reflected an increase of 263 percent over the same period. The social development spending fell from 30,079 million in 2011 to 17,366 million in 2012.
37
Source: Informe de Gestión de PDVSA 2012.
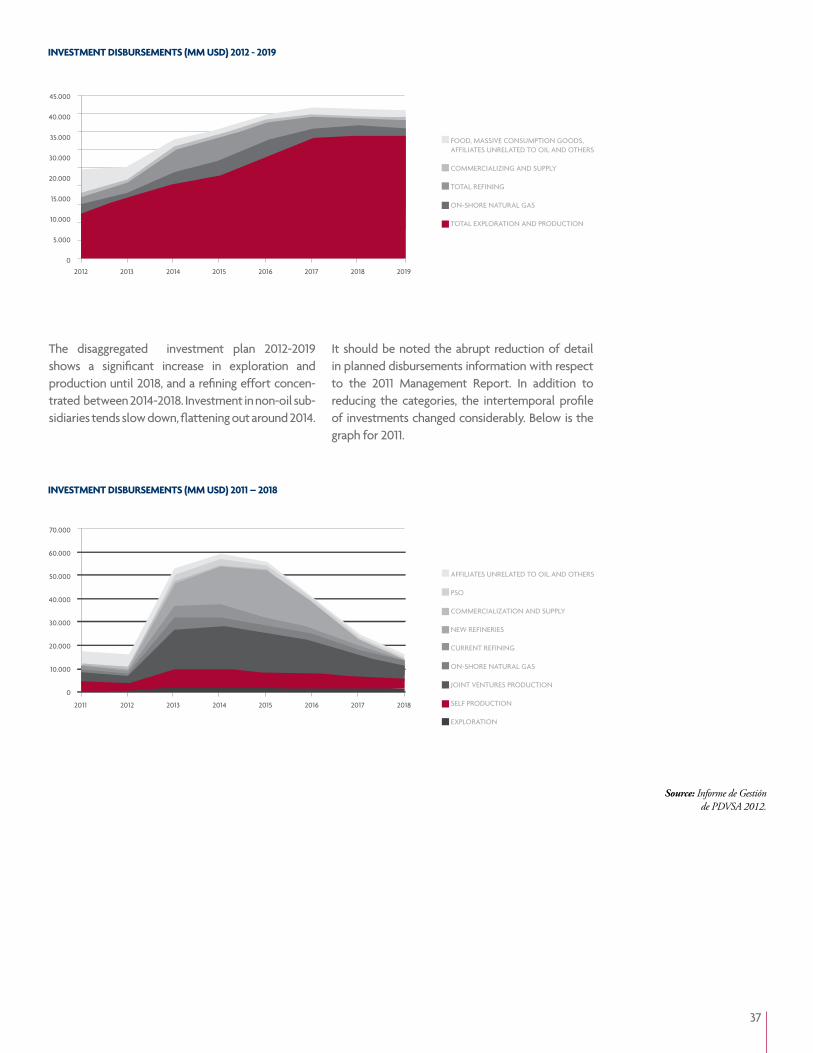
INVESTMENT DISBURSEMENTS (MM USD) 2012 - 2019
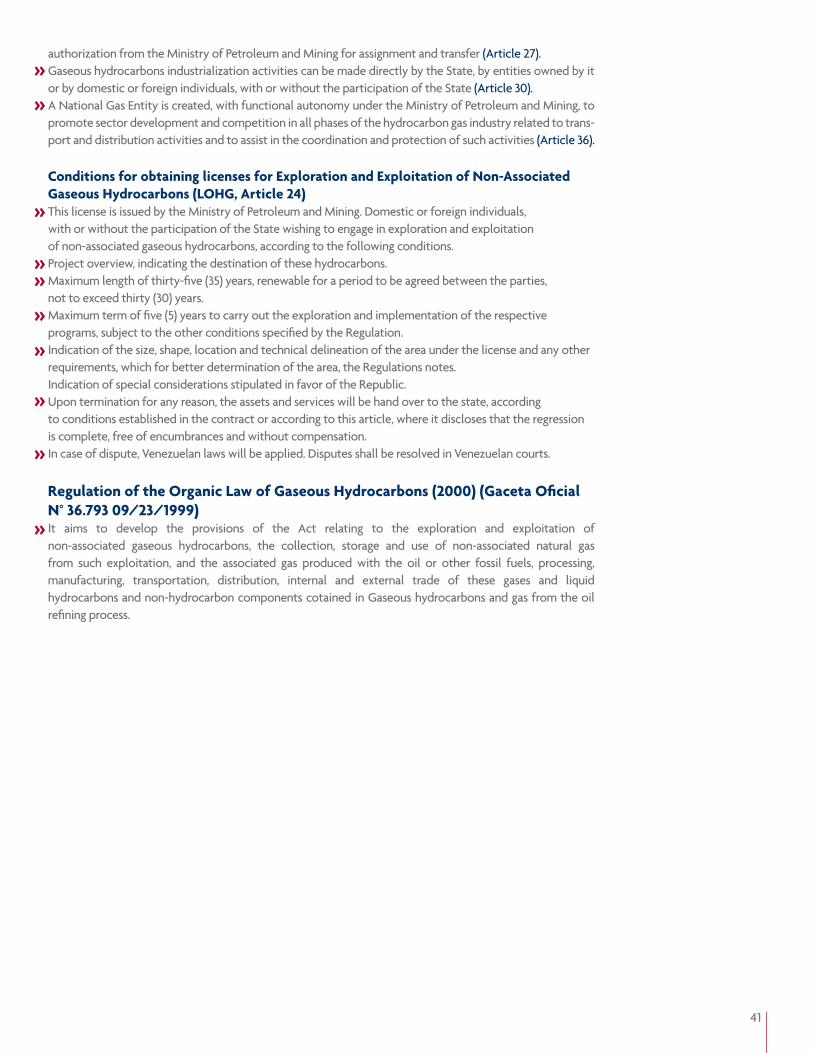
INVESTMENT DISBURSEMENTS (MM USD) 2011 – 2018
The disaggregated investment plan 2012-2019 shows a significant increase in exploration and production until 2018, and a refining effort concen-trated between 2014-2018. Investment in non-oil sub-sidiaries tends slow down, flattening out around 2014.
It should be noted the abrupt reduction of detail in planned disbursements information with respect to the 2011 Management Report. In addition to reducing the categories, the intertemporal profile of investments changed considerably. Below is the graph for 2011.
45.000
40.000
35.000
30.000
20.000
15.000
10.000
5.000
0
2012 2013 2014 2015 2016 2017 2018 2019
FOOD, MASSIVE CONSUMPTION GOODS,AFFILIATES UNRELATED TO OIL AND OTHERS
COMMERCIALIZING AND SUPPLY
TOTAL REFINING
ON-SHORE NATURAL GAS
TOTAL EXPLORATION AND PRODUCTION
70.000
60.000
50.000
40.000
30.000
20.000
10.000
0
2011 2012 2013 2014 2015 2016 2017 2018
AFFILIATES UNRELATED TO OIL AND OTHERS
PSO
COMMERCIALIZATION AND SUPPLY
NEW REFINERIES
CURRENT REFINING
ON-SHORE NATURAL GAS
JOINT VENTURES PRODUCTION
SELF PRODUCTION
EXPLORATION

38

39
GAS SECTOR
Gas Reserves: 196.4 trillion cubic feet, of which 58.42 trillion cubic feet are associated with the Orinoco Oil Belt and 35.95 trillion cubic feet associated with extraheavy crude are present in Eastern and Barinas-Apure basins.Gas production: 7,327 million cubic feet per day, of which 2,871 are reinjected.Rate Reserves / Production: 61 years.Average price of gas in Venezuela 2012: $ 0.53 / MPC.
Offshore exploration and exploitation projects: • Rafael Urdaneta Project (Falcón) • Plataforma Deltana Project• Liquefied Natural Gas Project • Golfo de Paria Oeste y Punta Pescador Project• Blanquilla-Tortuga Project
On shore projects:: • Anaco Gas Project• San Tomé Gas Project• Fractioning Capacity Increase in Jose • Soto Deep Extraction Plant • IV Train in San Joaquín • Pirital I• Handling and Disposal of CO ²• G/J José Francisco Bermúdez (SINORGAS) Northeastern Natural Gas Pipeline • Expansion of the Bajo Grande Ulé Amuay Transport System• Ulé Amuay Center-Eastern Pipe Interconnection Segment • National Gasification
GAS FIGURES 2012

40
Constitution of the Bolivarian Republic of Venezuela, (CBRV, 1999) Mineral and hydrocarbon deposits of any nature that exist within the territory of the nation, beneath the territorial sea bed, within the exclusive economic zone and on the continental shelf, are the property of the Republic, are of public domain, and therefore inalienable and not transferable. (Article 12)The management and governance of hydrocarbons is of the competence of National Public Power. (Article 156, paragraph 16) Gas transportation and distribution are also considered public services under the responsibility of the National Executive (Article 156, paragraph 29)
Gaseous Hydrocarbons Law, (LOHG 1999).Regulates the exploration and exploitation of non-associated gas in the production of oil or other fossil fuels, and the collection, storage and use of associated gas and non-associated gas.It ratified the “legal reserve” of the activity and ownership of gaseous hydrocarbon deposits (Article 1).Exploration activities in search of gaseous hydrocarbon deposits unassociated and exploitation of such deposits, and the collection, storage and use of both non-associated natural gas from such exploitation, and the associated gas produced with the oil or other fossil processing, manufacturing, transportation, distribution, internal and external trade of these gases, are governed by this Act and may be exercised by the state directly or by entities owned or private persons foreign or domestic; with or without the participation of the State (Article 2).Activities directly or indirectly related to the transport and distribution of hydrocarbon gases, intended for collective consumption, constitute a public service (Article 5).The Ministry of Petroleum and Mining is empowered to determine the prices of hydrocarbon gases from the production and processing centers, following principles of equity. Fees will be set by the Ministries of Petroleum and Mining, and the Ministry of Industry and Trade, who shall determine the rates to be applied to final consumers and the services provided under this Act for establishing bases of such fees shall be developed by the National Gas Entity (Article 12).To perform activities (other than exploration and exploitation) related to gaseous hydrocarbons, associ-ated or not associated, produced by other people, you must obtain permission from the Ministry of Petro-leum and Mining, after project definition or specific destination of such hydrocarbons. Will be applied the provisions in Article 24 of this Law, except as indicated in paragraphs 3 and 4. These permits require prior
LEGISLATIVE BODY-STATUTE OF THE VENEZUELAN NATURAL GAS SECTOR
Gas Reserves:58.42 trillion cubic feets associated to the Orinoco
Oil Belt
41
authorization from the Ministry of Petroleum and Mining for assignment and transfer (Article 27).Gaseous hydrocarbons industrialization activities can be made directly by the State, by entities owned by it or by domestic or foreign individuals, with or without the participation of the State (Article 30).A National Gas Entity is created, with functional autonomy under the Ministry of Petroleum and Mining, to promote sector development and competition in all phases of the hydrocarbon gas industry related to trans-port and distribution activities and to assist in the coordination and protection of such activities (Article 36).
Conditions for obtaining licenses for Exploration and Exploitation of Non-Associated Gaseous Hydrocarbons (LOHG, Article 24) This license is issued by the Ministry of Petroleum and Mining. Domestic or foreign individuals, with or without the participation of the State wishing to engage in exploration and exploitation of non-associated gaseous hydrocarbons, according to the following conditions.Project overview, indicating the destination of these hydrocarbons.Maximum length of thirty-five (35) years, renewable for a period to be agreed between the parties, not to exceed thirty (30) years.Maximum term of five (5) years to carry out the exploration and implementation of the respective programs, subject to the other conditions specified by the Regulation.Indication of the size, shape, location and technical delineation of the area under the license and any other requirements, which for better determination of the area, the Regulations notes.Indication of special considerations stipulated in favor of the Republic.Upon termination for any reason, the assets and services will be hand over to the state, according to conditions established in the contract or according to this article, where it discloses that the regression is complete, free of encumbrances and without compensation.In case of dispute, Venezuelan laws will be applied. Disputes shall be resolved in Venezuelan courts.
Regulation of the Organic Law of Gaseous Hydrocarbons (2000) (Gaceta Oficial N° 36.793 09/23/1999) It aims to develop the provisions of the Act relating to the exploration and exploitation of non-associated gaseous hydrocarbons, the collection, storage and use of non-associated natural gas from such exploitation, and the associated gas produced with the oil or other fossil fuels, processing, manufacturing, transportation, distribution, internal and external trade of these gases and liquid hydrocarbons and non-hydrocarbon components cotained in Gaseous hydrocarbons and gas from the oil refining process.

42
Ministerio del Poder Popular para el Petróleo y la Minería (MPPPM). Agency responsible for regulation, policy formulation and evaluation. As well as planning, implementation and supervising the activities of the National Executive on oil and energy in general. This body is also responsible for market study and analysis to define prices.
Ente Nacional del Gas (ENAGAS).It is an agency of the MPPPM that promotes the development and proficiency in all phases of the gaseous hydrocarbon industry and regulates the activities of transmission, distribution and commercialization of gas.
Petróleos de Venezuela, S.A. (PDVSA).State owned company in charge of exploration, production, manufacturing, transportation and marketing of hydrocarbons (including associated gas).
PDVSA Gas.PDVSA subsidiary responsible of gas commercializa-tion nationally and internationally.
PDVSA Gas Comunal.PDVSA subsidiary responsible for domestic gas dis-tribution to communities. Activities include filling gas plants and distribution to homes.
Empresas operadoras privadas.ChevronTexaco, Statoil, Total, Petrobrás,Teikoku Oil, Gazprom, Petropars, Repsol YPF, Eni, Vinccler Oil & Gas, Energía de Portugal (EDP), Petronas, Inelectra, Otepi, Pluspetrol, GALP, Qatar Petroleum, Mitsubishi/Mitsui e Itochu.
MAIN ACTORS

43
Income Tax (Income Tax Act) Stock companies and taxpayers assimilated to them, engaged in activities other than those mentioned in Article 11, will pay tax on all net enrichments, based on the rate provided for in Article 52 and set tax rates in their paragraphs (Article 9).Are excluded from the regime provided by Article 11 and 53 paragraph b (proportional rate of fifty percent), companies engaged in integrated activities or not, of non-associated gas exploration and exploitation, processing, transportation, distribution, storage, marketing and export of gas and its components (Article 11).Tax rate on tax units (UT) (Article 52):To the fraction included up to 2,000.00: 15 percentFor the fraction exceeding 2,000.00 and up to 3,000.00: 22 percent For the fraction exceeding 3,000.00: 34 percent
Royalty (LOHG, Article 34)From the volumes of gaseous hydrocarbons extracted from any reservoir, and not reinjected, the State is entitled to a share of twenty percent (20 percent) as a royalty.Required by the National Executive in cash or kind, if none is specified, it is assumed to be received in cash.In case of receive it in kind, the National Executive may use for transport and storage purposes, the services of the operator, which shall supply to the location as directed by the National Executive, who will pay the price to be agreed for such services.In case of receive it in cash; the operator must pay the price of the corresponding gaseous hydrocarbon volumes, calculated at market value in the field of production.
Exploration and exploitation licenses granted after conversion services agreements in March 2007Social investment: one percent of the value of non-associated gas.Special Consideration for the state: ten percent of the value of non-associated gas.Annual surface income: a tax unit per hectare.
FISCAL FRAMEWORK

44
EXPLORATION AND PRODUCTION
Venezuela is the country with the eighth largest gas reserves. According to the annual report BP Statistical Review of World Energy 2013, our country has approximately 196.4 billion cubic feet of gas, which constitute the second largest reserves in the Americas after the United States whose reserves, according to the report, reaching around 300 trillion cubic feet.The large shale gas reserves have not yet been incorporated into these figures. Also, based on BP figures, Venezuela has 73 percent of the gas reserves of Central and South America and 3 percent of world reserves.
Reserves
RESERVES(TCF)
PRODUCTION(BCFD)
CONSUMPTION(BCFD)
WORLD 6614.1 324.6 319.8
SOUTH AND CENTRAL AMERICA 268.3 17.1 15.9
VENEZUELA 196.4 3.2 3.4
Reserves, production and consumption of Gas, 2012
Source: BP Statistical Review of World Energy, 2013.
The level of gas reserves in Venezuela remained relatively stable since the mid-90s, growing at an average annual rate of nearly 1 percent. From the year 2006 there have been significant additions to an increase of 15 percent over the past six years.
1980 1982 1984 1986 1988 1990 1992 1994 1996 1998 2000 2002 2004 2006 2008 2010
220200180160140120100806040
VENEZUELAN NATURAL GAS PROVED RESERVES 1980-2012(TRILLIONS OF CUBIC FEETS)Source: BP Statistical Review of World
Energy, 2013.

45
PDVSA: RESERVES, PRODUCTION AND CONSUMPTION
According to the Informe de Gestión Anual de PDVSA 2012, certified gas reserves in Venezuela now amount to 196,409 billion cubic feet, about 30 percent of which are associated with the FPO.In 2012, 2,747 million cubic feet of gas were incorporated, 89 percent of which comes from review of existing fields. The remaining 11 percent come from the discovery of new deposits.
Source: Informe de Gestión Anual de PDVSA 2012
Most of Venezuela’s gas reserves are located north and northeast of the country, in the eastern basin and on the shores of the Caribbean and Atlantic continental shelf in an area of over 500 thousand square kilometers.In the chart below you can see the distribution basins of natural gas reserves.
GAS RESERVES DISTRIBUTION CLASSIFIED BY VESSEL 2012
GRAFICO
69.7ORIENTAL
MARACAIBO FALCÓN
CARÚPANO
BARINAS-APURE
7.360.19
%22.27

46
51ANACO
LICENCIAS
QUIRIQUIRE GAS
YPERGAS
GAS GUÁRICO
SAN TOMÉ
SIPORORO
64
3 2
%12
22
VENEZUELAN NATURAL GAS PRODUCTION AND CONSUMPTION, 1970-2012(BILLIONS OF CUBIC FEETS DAILY)
Source: BP Statistical Review of World Energy, 2013
Source: Informe de Gestión PDVSA 2012
12Excluding reinjection.
According to the Informe de Gestión Anual 2012 de PDVSA, in 2012, natural gas production in the country was 7,327 million cubic feet of gas per day, 38.18 percent of which was used for reinjection, leaving a net gas production of 4,456 million cubic feet per day.In 2011, natural gas production in the country was 7,125 million cubic feet of gas per day, 40.47 percent of which was used for reinjection, thus net gas production was 4,241 million cubic feet per day.
Venezuelan gas production represents about 19 percent of production in Central and South America andthe 1 to 2 percent of the world.Between 1970 and 1998 both production and consumption increased steadily. In 1999 gas production suffered a fall, achieved a progressive recovery, to fall again in 2003 and since then both have remained around 3,000 MMCFD12 . By 2012 production was 3,200 MMCFD and 3,400 MMCFD consumption.
In the past three years, the production level has decreased and consumption has exceeded the amounts of gas produced in the country. Venezuela has therefore had to resort to imports.
Production and Consumption
PDVSA´S GAS PRODUCTION
4.0
3.5
3.0
2.5
2.0
1.5
1.0
0.5
0.01972 1975 1978 1981 1984 1987 1990 1993 1996 1999 2002 2005 2008 2011
PRODUCTION CONSUMPTION
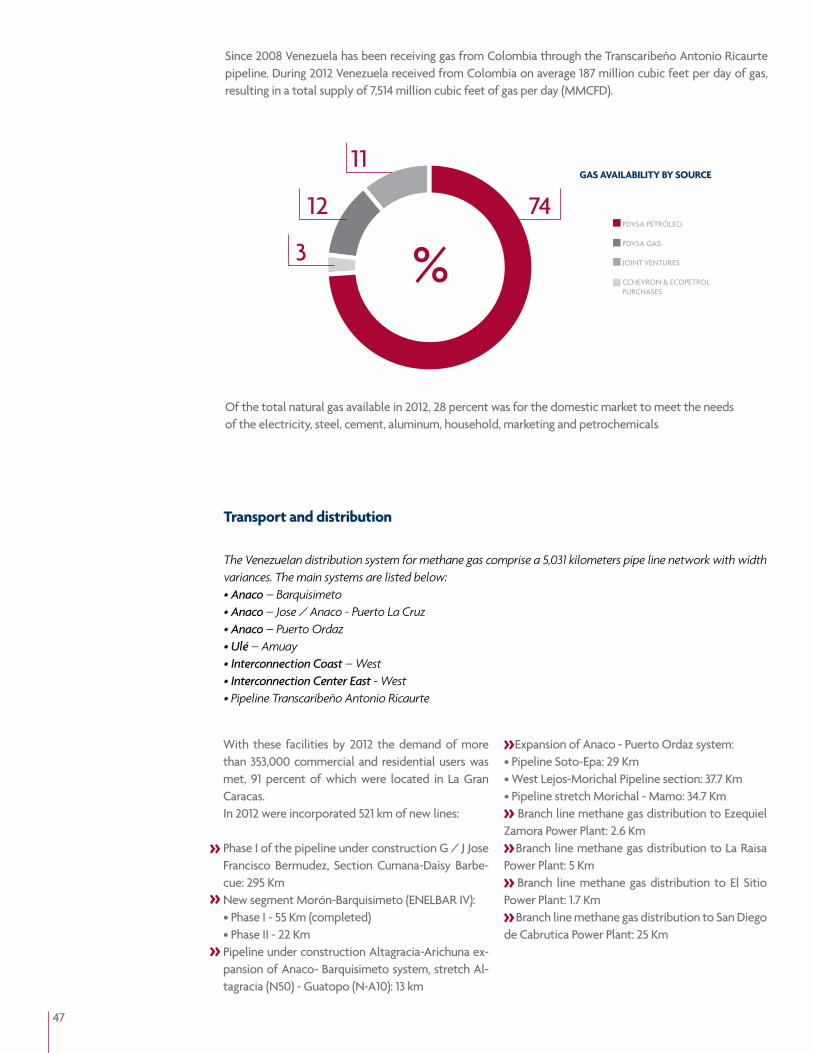
47
Since 2008 Venezuela has been receiving gas from Colombia through the Transcaribeño Antonio Ricaurte pipeline. During 2012 Venezuela received from Colombia on average 187 million cubic feet per day of gas, resulting in a total supply of 7,514 million cubic feet of gas per day (MMCFD).
Of the total natural gas available in 2012, 28 percent was for the domestic market to meet the needs of the electricity, steel, cement, aluminum, household, marketing and petrochemicals
The Venezuelan distribution system for methane gas comprise a 5,031 kilometers pipe line network with width variances. The main systems are listed below:• Anaco – Barquisimeto• Anaco – Jose / Anaco - Puerto La Cruz• Anaco – Puerto Ordaz• Ulé – Amuay• Interconnection Coast – West• Interconnection Center East - West• Pipeline Transcaribeño Antonio Ricaurte
With these facilities by 2012 the demand of more than 353,000 commercial and residential users was met, 91 percent of which were located in La Gran Caracas.In 2012 were incorporated 521 km of new lines:
Phase I of the pipeline under construction G / J Jose Francisco Bermudez, Section Cumana-Daisy Barbe-cue: 295 KmNew segment Morón-Barquisimeto (ENELBAR IV):• Phase I - 55 Km (completed)• Phase II - 22 KmPipeline under construction Altagracia-Arichuna ex-pansion of Anaco- Barquisimeto system, stretch Al-tagracia (N50) - Guatopo (N-A10): 13 km
Transport and distribution
Expansion of Anaco - Puerto Ordaz system:• Pipeline Soto-Epa: 29 Km• West Lejos-Morichal Pipeline section: 37.7 Km• Pipeline stretch Morichal - Mamo: 34.7 Km Branch line methane gas distribution to Ezequiel Zamora Power Plant: 2.6 Km Branch line methane gas distribution to La Raisa Power Plant: 5 Km Branch line methane gas distribution to El Sitio Power Plant: 1.7 Km Branch line methane gas distribution to San Diego de Cabrutica Power Plant: 25 Km
GRAFICO
74PDVSA PETRÓLEO
PDVSA GAS
JOINT VENTURES
CCHEVRON & ECOPETROLPURCHASES
12
11
%3
GAS AVAILABILITY BY SOURCE

48
Source: Informe de Gestión PDVSA 2010 y 2011.
According to PDVSA Gas Communal information, 95 percent of Venezuelan families use liquefied petroleum gas (LPG) as an energy source. In December 2007 PDVSA Gas Communal was created as well as TROPIGAS and Vengas, the two largest distributors, was acquired by the state affiliate.
Venezuela’s gas development is part of the Siembra Petrolera Plan 2012-2018. Two of its main axes are the development of offshore gas to meet the domestic market and the absolute sovereignty over oil and gas resources. According to the Plan, the targets set for 2019 with regards to gas production are 11,947 MMCFD of natural gas and 255 MBD of LNG.
In accordance with PDVSA’s last report, PDVSA Gas Communal has 60 of the 86 LPG filling plants nationwide, supplied a total of 42 national MDB, increasing by 5 percent compared to 2011, of MDB 35.42which correspond to PDVSA Gas Communal and private sector MDB 6.25.
In 2010, 1.305 billion dollars were invested in Mainland Gas Development, 16 percent less than planned in 2009, while in 2011 the actual investment was 1,601 million, 6 percent higher than envisaged in the 2010 plan investment for the development of Gas on the mainland. Beginning 2010 offshore gas development investment weren´t reported.Total disbursements for gas investment in Ground projected for the period 2012-2018 was located at 25,425 million dollars. However, in 2012 there was an adjustment of the Plan, as the investment observed in the Annual Report for 2012 only contemplates PDVSA investment outlays by PDVSA Gas. For 2012 the amount was U.S. $ 2,682 million and its projected total for the period 2013-2018 is 22,048 million dollars, 13 percent lower than proposed in the 2012-2018 Plan.
Domestic Gas
Investment
ONSHORE PROJECTED DISBURSEMENT INVESTMENTS 2011-2018(MILLIONS OF DOLLARS)
6.000
5.000
4.000
3.000
2.000
1.000
02011 2012 2013 2014 2015 2016 2017 2018
INFORME DE GESTIÓN DE PDVSA 2010
INFORME DE GESTIÓN DE PDVSA 2011

49
PDVSA: RESERVES, PRODUCTION Y CONSUMPTION
PDVSA Gas Projects
Project Description Location Current Situation
Rafael Urdaneta
Development of non-associated gas reserves located offshore, with
potential reserves of 23 trillion cubic feet (TCF) of associated gas and 7 billion barrels of liquid hydrocarbons, designed
to produce 1,000 MMCFD.
Northeastern Gulf of Venezuela and Falcón
*
Plataforma Deltana
Exploration and exploitation of offshore associated gas. Measurable reserves of a volume between 6 and 10 BPC. Gas production estimated between 800 and 1,000 MMCFD.
Includes transportation infrastructure to Industrial Complex Gran Mariscal de
Ayacucho.
Delta Amacuro *
Mariscal Sucre
Exploitation of non-associated gas reserves offshore and construction of an LNG plant. Gas Production Phase I: 600 MMCFD the domestic market.
Final production estimated: 18 thousands of condensate B/D, 1,200 MMCFD Reservations: 14.73 Trillion
cubic feet of gas and 74.82 million bar-rels condensate
North of Paria Peninsula, Sucre
*
Blanquilla, Tortuga, Golfo de Paria Oeste Punta Pescador
Exploration and exploitation of non-associated gas reserves under
the Delta Caribe Project.These are areas with complex
hydrocarbon systems but with an estimated gas potential of 11 trillion
cubic feet.
Nueva Esparta y Delta Amacuro
*
Gas Anaco
Includes construction of five operating centers to collect, compress and
transfer a potential production of 2,559 and 34.55 thousands B/D of light crude
Anzoátegui y Monagas 54%
Jose’s Fractionation Capacity Increase
It involves the construction of a new NGL fractionation train of 50 thousands
B/D in Jose´s fractioning plant.Anzoátegui y Monagas
Work in progress at Poliducto
San Joaquín-Jose
San Tomé Gas Project
San Tomé Gas Project involves the construction of surface infrastructure
required to handle a potential maximum set of 550 MMPCND/152
MBHP
Anzoátegui 15%

50
PDVSA: RESERVES, PRODUCTION Y CONSUMPTION
PDVSA Gas Projects
Project Description Location Current Situation
Soto Deep Extraction Plant
The project aims to install a modu-lar deep NGL extraction plant and
Auxiliary Services Module I and II, with capacity to process 200 million cubic feet of gas and produce 15 thousands
B/D of NGL.
Anzoátegui 45%
IV Tren de San Joaquín
The project aims to build process facilities and services of an NGL extraction plant, which helps to
increase processing capacity in Anaco area at 1,000 MMCFD, generating
50 thousands B/D of NGL and 890 MMCFD of residual gas to the gas transport systems of the domestic
market.
Anzoátegui 39%
Pirital I
The project aims to execute the construction and implementation
of a deep extraction plant including ethane recovery, for the extraction of
NGLs, with a 1,000 MMCFD natural gas processing capacity, generating 42
thousands B/D of NGL.
Monagas 8,33%
Management and Disposal of CO ²
Installation of CO ² gas reduction units capable of decreasing this component in processing gas to comply with the new regulations for gas transmission and commercialization under 3568
COVENIN standard that takes effect in 2013.
4%
Interconexión Centro-Occidente (ICO) Tramo Ulé
- Amuay
Gas transport systems infrastructure development to interconnect the
Centro-Oriente (from Anaco –Anzoategui- to Barquisimeto –Lara-) with Occidente (from Ule, -Zulia- to
Amuay –Falcon-). This allows the additional gas transmition of 520
MMSCFD from Oriente to Occidente.
Centro, Oriente, Occidente
88%
Bajo Grande Ulé Amuay Transmission System Expansion
Transport capacity expansion from 220 MMSCFD to 620 MMSCFD, to achieve
the fulfillment of national and international gas delivery
commitments.
Falcón, Zulia 33%

51
PDVSA: RESERVES, PRODUCTION Y CONSUMPTION
PDVSA Gas Projects
Source: Informe de Gestión Anual de PDVSA 2009, 2010, 2011 y 2012.
Source: Informe de Gestión Anual de PDVSA 2012.
Transportation System Expansion Project
Project Description Location Current Situation
Pipeline Nor-Oriental G/J José Francisco Bermúdez
(SINORGAS)
Infrastructure construction to incorporate gas from northeastern
region offshore gas developments in the domestic market.
Anzoátegui, Sucre, Monagas y Nueva
Esparta51%
National Gasification
Methane gas distribution networks development to gasify 23 states.
Includes the installation of 48,900 km network distribution infrastructure to supply gas to 3,260,000 families across
the country.
All over the country 46%
Project Description LocationCurrent Situation
Anaco - PLC (Phase I and II)Construction of the necessary
infrastructure for methane transport, in order to meet future gas demand.
Anzoátegui 96%
Anaco - Puesto Ordaz (Pipeline Epa Soto)
Anzoátegui y Bolívar 91%
Pipeline Tramo West Lejos - Morichal - Mamo
Monagas 95%
Anaco - Barquisimeto Oriente and Occidente 32,25%

52
National and international Gas prices(Dollars by million of BTU)
Venezuelan*(fixed 2011)
World(January 2011)***
Venezuelan*(fixed 2012)
World(January 2012)***
Venezuelan*(fixed 2013)
World (January 2013)***
Anaco LagoHenry Hub
NYC Gate****
Anaco LagoHenry Hub
NYC Gate****
Anaco LagoHenry Hub
NYC Gate****
Dispatch Center at
Anaco0.31 0.62 2.97 5.06 0.33 0.66 2.67 4.85 0.35 0.7 3.3 4.52
Mean 0.47 4.02 0.50 3.76 0.53 3.91
Source: Source: Venezuelan prices: Gaceta Oficial 38.401; World prices: Bloomberg* Domestic Gas *** Prices in December 31st****Mean monthly price in January
All the gas produced in Venezuela is consumed domestically, so it is important to consider domestic prices. According to current regulations, the state sets the prices and tariffs through the Ministry of Popular Power for Energy and Petroleum, with the collaboration of Ministry of Popular Power for Production and Commerce, as recommended by Enagas
In 2006 it was established that for the year 2007, prices should reach approximately Bs. 26.86 per cubic meter. The new goal was set at Bs. 45.42 per cubic meter by 2015.

53
14
12
10
8
6
4
2
0
2011 2015 2020 2025 2030 2035
VENEZUELA
SAUDI ARABIA
IRAN
IRAQ
UNITED ARAB EMIRATESMIL
LON
ES D
E BA
RRIL
ES D
IARI
OS
PROJECTIONS 2011 – 2035 / OIL
The following is a set of projections estimated by the International Energy Agency for the period 2011 - 2035 and the New Policies scenario.
The International Energy Agency projects a significant increase in production beginning in 2020.Below is a visual comparison between Venezuela production prospects and other important producers, regionally and members of OPEC.
By 2015 production in Brazil, Venezuela andMexico will be similar, given a continued increase in production in Brazil and a continued decrease in Mexico. From 2025 Brazilian production will stagnate. In the case of Canada, strong growth
Source: : International Energy Agency World Energy Outlook 2012, New Policies Scenario and authors calculations.
Source: International Energy Agency World Energy Outlook 2012, New Policies Scenario and authors calculations.
EXPECTED PRODUCTION VENEZUELA - THE AMERICAS
EXPECTED PRODUCTION VENEZUELA - OPEC
7
6
5
4
3
2
1
02011 2015 2020 2025 2030 2035
VENEZUELA
MEXICO
BRAZIL
CANADA
MIL
LON
ES D
E BA
RRIL
ES D
IARI
OS
is projected, always with the support of non-conventional crude in the Athabasca Oil Sands, as will be seen in subsequent graphs.

54
Source: International Energy Agency World Energy Outlook 2012,
New Policies Scenario and authors calculations
UNCONVENTIONAL CRUDES EXPECTED PRODUCTION
PROJECTED DEMAND BY REGION
A production increase is forecast for every country, especially in Iraq with a growth rate of 4.59 percent annual average.
To meet these projections, Venezuela should have an annual growth of production equivalent to 1.04 percent.
The annual growth rate of production of unconventional oil in Venezuela will be much higher than the overall growth rate of oil production, reaching the equivalent of 5 percent annual increase. This trend will have an effect such that, for 2035, approximately 50 percent of Venezuelan production will be of this type of oil.
As global oil demand, the IEA estimates a compound annual growth of 0.53 percent, caused mainly by the growth of Asian developing countries (2.12 percent) and Latin America (0.85 percent) compared to lower U.S. (-1.33 percent) and European demand (-0.92 percent).
5
4.5
4
3.5
3
2.5
2
1.5
1
0.5
0
2011 2015 2020 2025 2030 2035
VENEZUELA
CANADA
MIL
LIO
N B
ARR
ELS
DA
ILY
35
30
25
20
15
10
5
02011 2015 2020 2025 2030 2035
USA
EUROPA
ASIA
LATIN AMERICA
MIL
LIO
N B
ARR
ELS
DA
ILY

55
Within the BRIC (Brazil, Russia, China and India) shows much higher growth in China and India relative to the rest of the group.
Source: International Energy Agency World Energy Outlook 2012, New Policies Scenario and authors calculations.
PROJECTED DEMAND BRIC
EXPECTED PRODUCTION VENEZUELA - THE AMERICAS
PROJECTIONS 2011 – 2035 / GASRegarding natural gas production, the International Energy Agency projects a steadily growing trend for Venezuela, with compound annual growth of 4.55 percent, showing a considerable acceleration from 2025 and a slowdown in growth in 2030.
Despite the positive forecasts for Venezuelan production, Brazil stands out for its sharp rise beginning 2015, reaching a compound annual rate of 7.28 percent on a sustained basis throughout the estimated timeframe. In contrast, Argentina has a less favorable performance, with an annual rate of 1.82 percent.
At the continental level, there is a growing trend of 1.13 percent in U.S. crude oil production due to shale gas developments. Meanwhile, Latin America shows higher growth (2.36 percent), but starting from lower levels. Canada, despite starting with production levels similar to those in Latin America, shows a lower growth rate of 0.65 percent compounded annually.
16
14
12
10
8
6
4
2
02011 2015 2020 2025 2030 2035
CHINA
INDIA
BRAZIL
RUSSIA
MIL
LIO
N B
ARR
ELS
DA
ILY
100
90
80
70
60
50
40
30
20
10
02010 2015 2020 2025 2030 2035
VENEZUELA
BRAZIL
ARGENTINA
BILL
ION
S O
F C
UBI
C M
ETER
S

56
Source: : International Energy Agency World Energy Outlook 2012, New Policies Scenario and authors calculations.
CONTINENTAL PROJECTED PRODUCTION
PROJECTED DEMAND
As for the projected demand for natural gas, there is again proportionately greater growth in China (6.60 percent), but with a positive trend in the growth of demand in the U.S. (0.48 percent) and Europe (0.65 percent). Brazil shows a growing trend in the demand (4.33 percent), similar to India’s (4.18 percent). Japan shows moderate growth (0.67 percent).
900
800
700
600
500
400
300
200
100
0
2010 2015 2020 2025 2030 2035
UNITED STATES
EUROPA
JAPAN
CHINA
INDIA
BRAZIL
900
800
700
600
500
400
300
200
100
0
2010 2015 2020 2025 2030 2035
UNITED STATES
LATIN AMERICA
CANADA
57
The International Center on Energy and Environ-ment was created in 2005 to place IESA as the refer-ence, at national and regional levels, in trainingmanagers with leadership skills in the energy sector,being a center of excellence in reflection, generationand dissemination of knowledge in the areas of energy and environment, with national and interna-tional reach.
INTERNATIONAL CENTER ON ENERGY AND ENVI-RONMENT TEAM:
DirectorFrancisco MonaldiPh.D. Political Economy, Stanford. M.A. Economics, YaleAcademic CoordinatorPedro Luis RodríguezMPhil Economics, CambridgeProfessors Richard ObuchiPh.D. (c), Tulane. M.P.P. ChicagoProfesores de Planta y Adjuntos afiliados al CIEAAsdrúbal Baptista - M.A. KentOsmel Manzano - Ph.D. MITJosé Manuel Puente - Ph.D. OxfordRicardo Villasmil - Ph.D. Texas A&MVisitant ProfessorsRamón Espinasa - Ph.D. CambridgeLuisa Palacios - Ph.D. SAIS Johns HopkinsLuis Pacheco - Ph.D. Imperial CollegeLuis Roberto Rodríguez - Ph.D. Oxford ResearchersAmanda Beaujon Marín – Political Science, UCVJean Paul Leidenz - Economics UCAB

58
IESA, Sede Principal en Caracas - VenezuelaTel: (+58 212) 555 4260
RIF:
J-00
0675
473