vending machine characterization study: phase ii presented at regional technical forum
DESCRIPTION
Vending Machine Characterization Study: Phase II Presented at Regional Technical Forum June 2, 2009. Presented by Doug Bruchs The Cadmus Group, Inc. Overview. Review of Phase I Goals of Phase II Methodology Findings Programmatic Recommendations. Phase I: Overview. - PowerPoint PPT PresentationTRANSCRIPT

Vending Machine Characterization Study: Phase II
Presented at Regional Technical Forum
June 2, 2009
Presented by Doug Bruchs
The Cadmus Group, Inc.

Overview
• Review of Phase I
• Goals of Phase II
• Methodology
• Findings
• Programmatic Recommendations

Phase I: Overview
Market Characterization Study• Results presented at August 2007 RTF meeting
Research Questions• Who are the major market actors?• What is the size and age of the vending market?• What are the latest trends in machine design?• What are the current replacement and refurbishment practices?• What energy efficiency opportunities exist?

Phase I: Methodology
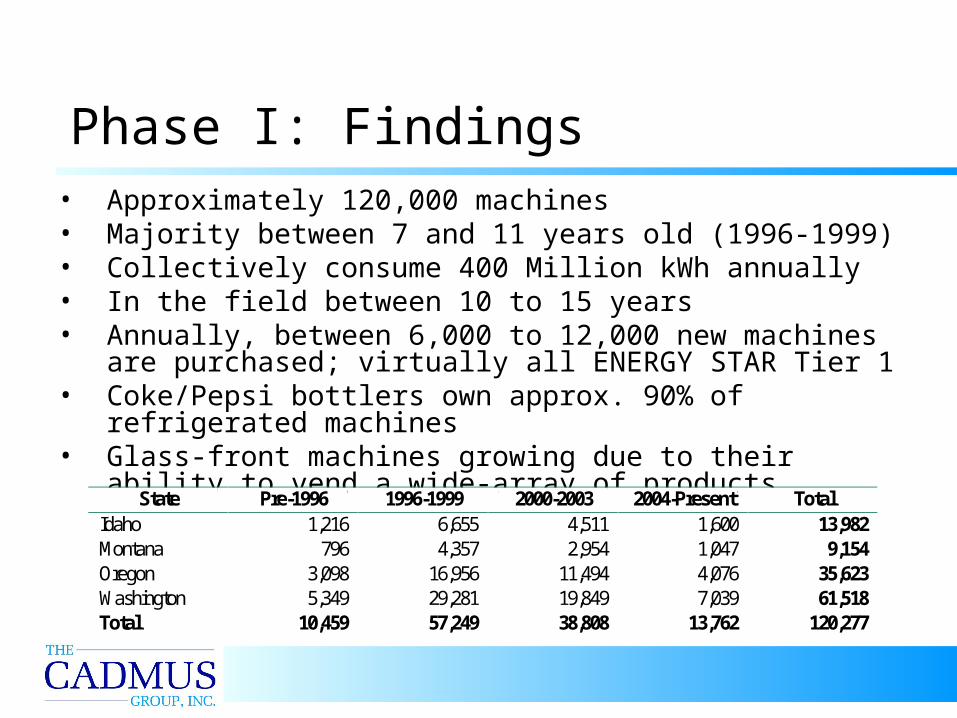
Phase I: Findings• Approximately 120,000 machines• Majority between 7 and 11 years old (1996-1999)• Collectively consume 400 Million kWh annually• In the field between 10 to 15 years • Annually, between 6,000 to 12,000 new machines are
purchased; virtually all ENERGY STAR Tier 1 • Coke/Pepsi bottlers own approx. 90% of refrigerated machines • Glass-front machines growing due to their ability to vend a wide-
array of products
State Pre-1996 1996-1999 2000-2003 2004-Present Total Idaho 1,216 6,655 4,511 1,600 13,982 Montana 796 4,357 2,954 1,047 9,154 Oregon 3,098 16,956 11,494 4,076 35,623 Washington 5,349 29,281 19,849 7,039 61,518 Total 10,459 57,249 38,808 13,762 120,277
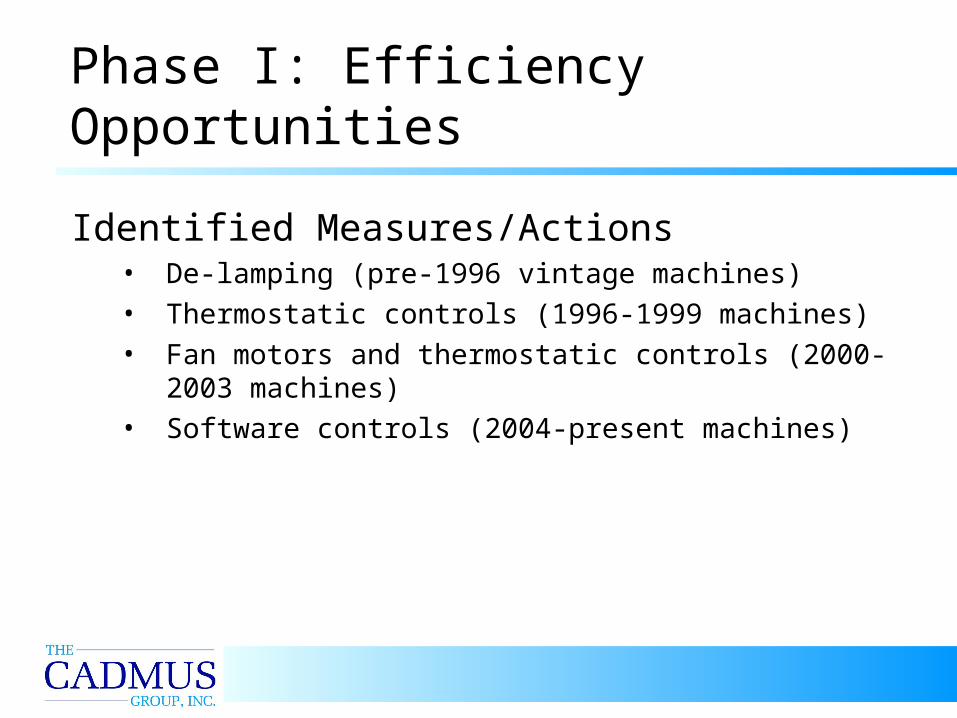
Phase I: Efficiency Opportunities
Identified Measures/Actions• De-lamping (pre-1996 vintage machines)• Thermostatic controls (1996-1999 machines)• Fan motors and thermostatic controls (2000-2003 machines)• Software controls (2004-present machines)

Goals of Phase II
Narrowing of Scope• Focus on measures, not market• Generate programmatic recommendations
Assess the Viability of Identified Opportunities• Refine energy savings potential• Determine implementation costs/methods• Explore industry acceptance

Phase II: Methodology
Technical Research• Interviews with refurbishment centers, machine manufacturers, and
USA Technologies• Leased a common machine and procured, installed, and metered:
• Baseline Conditions• T8 – T12 Lighting Kit Conversion• De-lamping• Thermostatic Control Installation (VM2IQ)
• Concurrent Cadmus EPA Study• 25 new ENERGY STAR machines were metered with and
without software controls activated

Phase II: Methodology
Market Research• Interviews with 20 regional bottlers
• Initial reaction • Percent of eligible fleet likely to participate• Motivations and barriers to participation• Willingness to alter current practices to utilize a program• Ease/difficulty of implementation• Availability and capacity of resources for implementation• Technical ability to implement more advanced options• Impact of various incentive levels
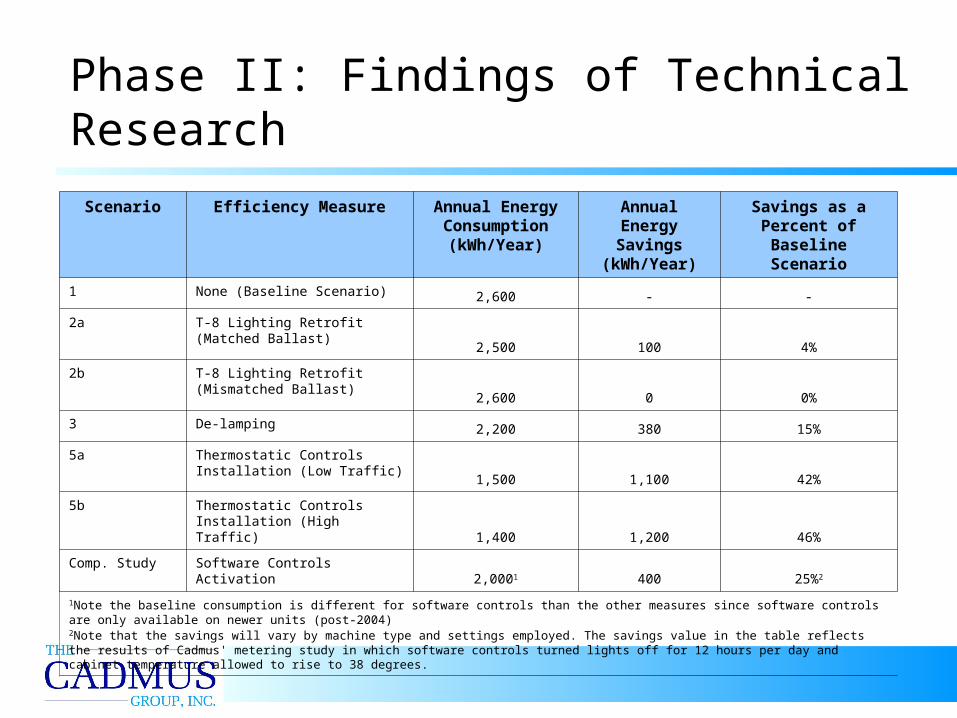
Phase II: Findings of Technical Research
Scenario Efficiency Measure Annual Energy Consumption
(kWh/Year)
Annual Energy Savings (kWh/Year)
Savings as a Percent of Baseline Scenario
1 None (Baseline Scenario) 2,600 - -
2a T-8 Lighting Retrofit (Matched Ballast)
2,500 100 4%
2b T-8 Lighting Retrofit (Mismatched Ballast)
2,600 0 0%
3 De-lamping 2,200 380 15%
5a Thermostatic Controls Installation (Low Traffic)
1,500 1,100 42%
5b Thermostatic Controls Installation (High Traffic)
1,400 1,200 46%
Comp. Study Software Controls Activation 2,0001 400 25%2
1Note the baseline consumption is different for software controls than the other measures since software controls are only available on newer units (post-2004)2Note that the savings will vary by machine type and settings employed. The savings value in the table reflects the results of Cadmus' metering study in which software controls turned lights off for 12 hours per day and cabinet temperature allowed to rise to 38 degrees.
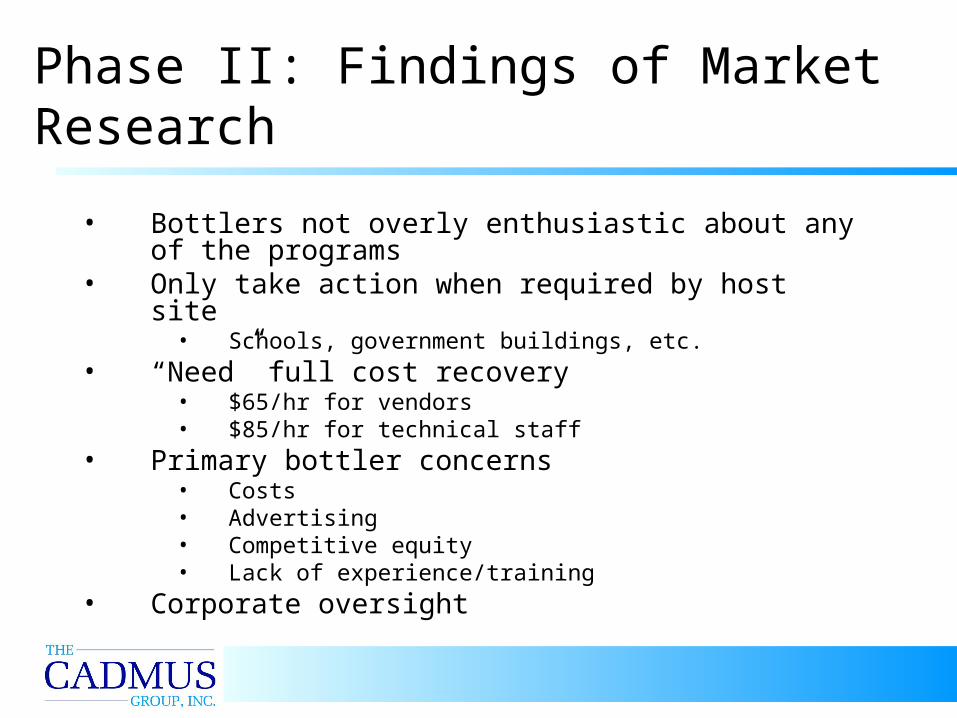
Phase II: Findings of Market Research
• Bottlers not overly enthusiastic about any of the programs• Only take action when required by host site
• Schools, government buildings, etc.• “Need” full cost recovery
• $65/hr for vendors• $85/hr for technical staff
• Primary bottler concerns• Costs• Advertising• Competitive equity• Lack of experience/training
• Corporate oversight
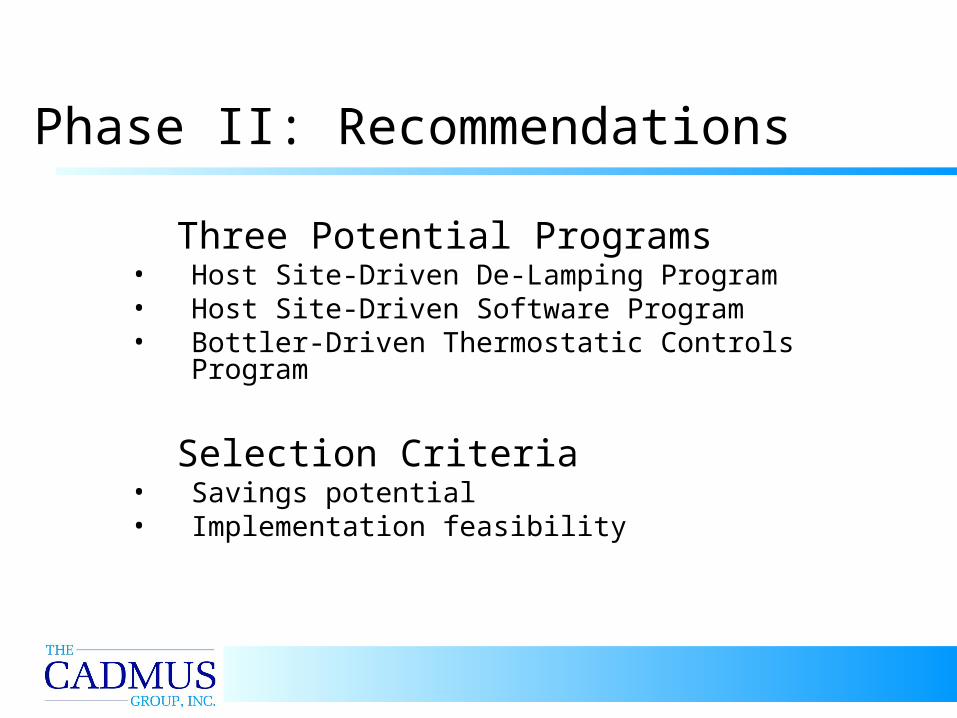
Phase II: Recommendations
Three Potential Programs• Host Site-Driven De-Lamping Program• Host Site-Driven Software Program • Bottler-Driven Thermostatic Controls Program
Selection Criteria• Savings potential• Implementation feasibility

Phase II Recommendation: Host Site-Driven De-Lamping Program
Offer host sites $20/machine to de-lamp all vending machines
• Impacts all vintages• Leverages host site market force• Can be completed during regular visits to site by
vendor• Administratively simple and fair as it applies to
all vintages

Vintage Impacted All
Annual Energy Savings (kWh) 380
Effective Useful Life (Years) 5
Lifetime Energy Savings (kWh) 1,900
Capital Cost (Bottler) $0
Labor Cost (Bottler) $16
Total Cost (Bottler) $16
Proposed Incentive $20
Incentive Dollars/KWh (Lifetime) $0.011
Total Estimated Machines in PNW Eligible to Participate (Phase I)
Estimated Program
Penetration
Potential Machines Impacted
Potential Lifetime Regional Energy Savings (MWh)
Total Program
CostProgram Cost-
Effectiveness ($/MWh)
120,277 15% 18,042 34,279 396,914 $11.58
120,277 30% 36,083 68,558 793,829 $11.58
120,277 50% 60,139 114,263 1,323,048 $11.58
Phase II Recommendation: Host Site-Driven De-Lamping Program
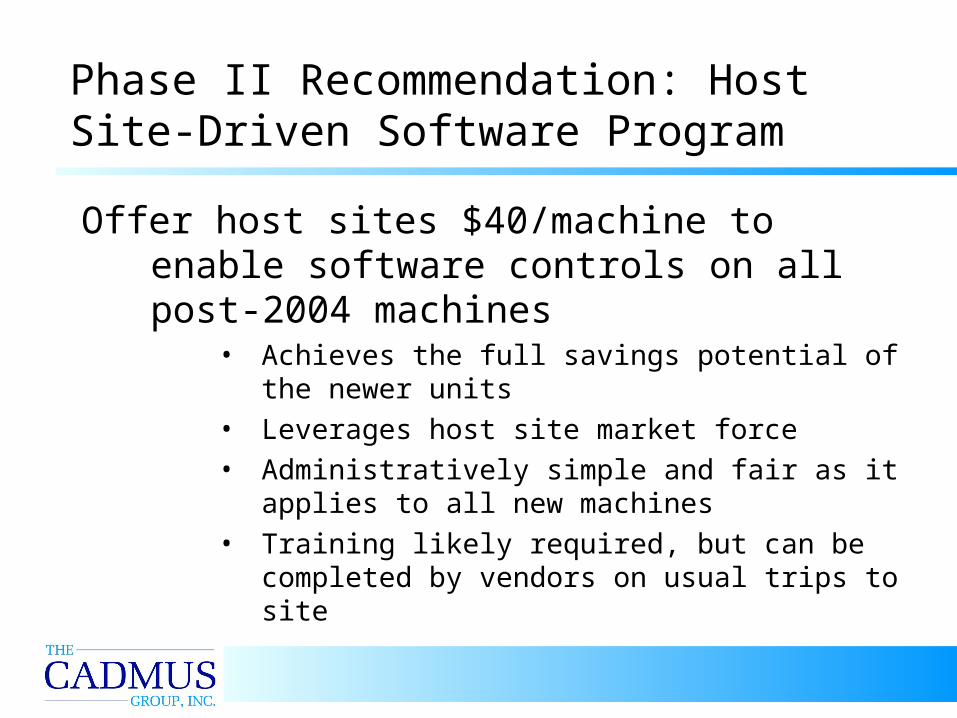
Phase II Recommendation: Host Site-Driven Software Program
Offer host sites $40/machine to enable software controls on all post-2004 machines
• Achieves the full savings potential of the newer units• Leverages host site market force • Administratively simple and fair as it applies to all
new machines• Training likely required, but can be completed by
vendors on usual trips to site

Total Estimated Machines in PNW Eligible to Participate (Phase I)
Estimated Program
Penetration
Potential Machines Impacted
Potential Lifetime Regional Energy Savings (MWh)
Total Program
CostProgram Cost-
Effectiveness ($/MWh)
13,762 10% 1,376 6,055 68,808 $11.36
13,762 20% 2,752 12,110 137,617 $11.36
13,762 30% 4,129 18,165 206,425 $11.36
Vintage Impacted 2004 - present
Annual Energy Savings (kWh) 400
Effective Useful Life (Years) 11
Lifetime Energy Savings (kWh) 4,400
Capital Cost -
Labor Cost1 $120
Total Cost $120
Proposed Incentive $40
Incentive Dollars/KWh (Lifetime) $0.009
1Assumes 10 minutes to activate the controls (based on Cadmus’ experience) as well as 10 minutes a year for the entire effective useful life of the machine for management of the controls.
Phase II Recommendation: Host Site-Driven Software Program

Phase II Recommendation: Bottler-Driven Thermostatic Controls Program
Incent bottlers $150/machine to install thermostatic controls
(most likely VM2IQs) during regular refurbishment cycle • Generated significant savings on test machine (aligned
with the manufacturer’s estimate)• Less cost-effective but applicable to the largest active
vintage (1996–1999)• Invisible to end user and more persistent then external
VendingMisers• Training likely required and must be completed by a
technician• Concerns about machine wear—education likely needed

Total Estimated Machines in PNW Eligible to Participate (Phase I)
Estimated Program
Penetration
Potential Machines Impacted
Potential Lifetime Regional Energy Savings (MWh)
Total Program
CostProgram Cost-
Effectiveness ($/MWh)
96,057 10% 9,606 55,233 1,584,933 $28.70
96,057 15% 14,408 82,849 2,377,399 $28.70
96,057 25% 24,014 138,081 3,962,332 $28.70
Vintage Impacted 1996-2003
Annual Energy Savings (kWh) 1,150
Effective Useful Life (Years) 5
Lifetime Energy Savings (kWh) 5,750
Capital Cost $100
Labor Cost1 $43
Total Cost $143
Proposed Incentive $150
Incentive Dollars/KWh (Lifetime) $0.026
Phase II Recommendation: Bottler-Driven Thermostatic Controls Program

The Cadmus Group(formerly Quantec, LLC)720 SW Washington, Suite 400Portland, OR, 97205503-228-2992
Doug [email protected]