vehicle interior air quality oica tf review
TRANSCRIPT

Vehicle Testing Calculations
Concentration is a function of (Material Properties, Temperature, Soak Time, and Ventilation)
2
The sample is on a thermal desorption tube analyzed by GC-MS to ISO-16000-6 or DNPH Cartridge to ISO -16000-3.
Vehicle Method and Time Study

• Accuracy typically increases with an increase in mass on the samples.
• There are several method changes that we can discuss to increase mass on the
samples without breakthough.
– Higher sample flow rates, 50 mL/min vs. 200 mL/min
– Longer sample times, 15 minutes vs. 30 minutes
– Longer vehicle closed door soak times
• Sample where the rate of change is lower.
Suggestions for Increased Measurement Accuracy
• Sample where the rate of change is lower.
• Understand and consider laboratory test operations including a single 8 hour
shift operation
– Higher temperatures, 23C vs. 25C
• Special note - limit values should reflect method changes.
4

Vehicle Method and Time Study
• Two new vehicles were tested under different but typical conditions
– Focus SE, windows open between tests = “daily use”
– Focus ST, windows closed between tests = “dealership lot”
– From day 4 to day 60
– Korean, ISO, TUV and China Methods
– Test method windows closed soak times
• Korean = 2 hours
• ISO Part 1 = 8 hours• ISO Part 1 = 8 hours
• China = 16 hours
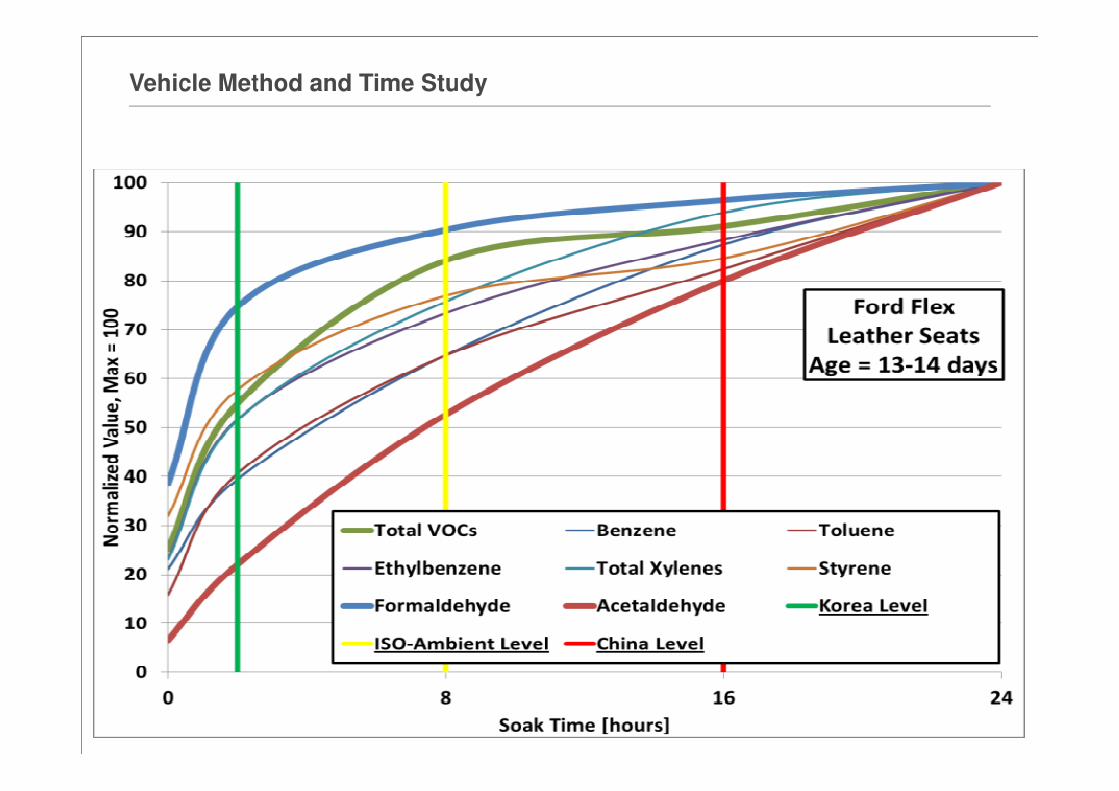
• Next slides are VOC concentration [µg/m3] plots for each compound or group of compounds
– Each plot is normalized to the highest test value
– Note: TVOC is not regulated and drops quickly over time with windows open but this not
true for Formaldehyde and Acetaldehyde. Also keep in mind, China limits for
Formaldehyde and Acetaldehyde are difficult to meet.

Vehicle Method and Time Study
WINDOWS
OPEN
WINDOWS
CLOSED
SE with leather seats ST with leather seats
Ran 20 tests in Ford’s Allen Park Test Laboratory, 2nd and 3rd Floor Soak area

Vehicle Method and Time Study
Windows Closed - 16h Soak
Windows Open - 16h Soak
Windows Open - 2h Soak
Windows Open - 8h Soak

Long Term Vehicle Testing - TUV Test Procedure
5000
6000
7000
8000
9000
Total VOCs
8
0
1000
2000
3000
4000
0 50 100 150 200 250 300
Vehciel Age (Days)

Vehicle Method and Time Study
Windows Closed - 16h Soak
Windows Open - 16h Soak
Windows Open - 2h Soak
Windows Open - 8h Soak

Vehicle Method and Time Study
Windows Closed - 16h SoakWindows Closed - 16h Soak
Windows Open - 16h Soak
Windows Open - 2h Soak
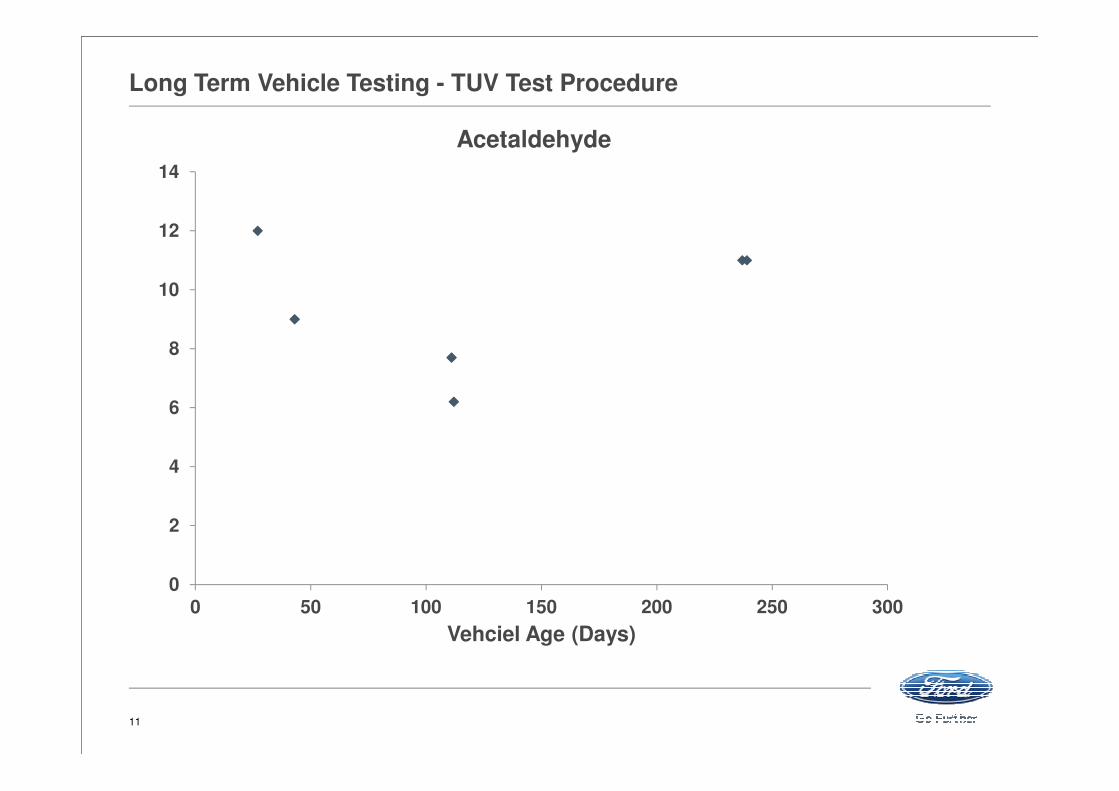
Long Term Vehicle Testing - TUV Test Procedure
8
10
12
14
Acetaldehyde
11
0
2
4
6
0 50 100 150 200 250 300
Vehciel Age (Days)

Global VIAQ Regulations: Method Correlation Factors
Method correlation by testing up to 16 different vehicles consecutively to the China, Korean, and three parts of the ISO test method.
Data shows correlation between the regional methods and the ISO method

Global VIAQ Regulations: Method Correlation Factors
Regulatory Limits Formaldehyde Acetaldehyde Benzene Toluene Ethylbenzene Xylene Styrene Total VOCsRegulatory Limits Formaldehyde Acetaldehyde Benzene Toluene Ethylbenzene Xylene Styrene Total VOCs
Korean Limits 210 50 30 1000 1000 870 220
China Limits 100 50 110 1100 1500 1500 260
Korea vs. China
Regulatory Limits 210% 100% 27% 91% 67% 58% 85%
Average Test Data 88% 38% 70% 58% 68% 67% 81% 51%
The chart and tables shows the percent difference between either the national (Regulatory) limits and the national test methods. Note, for Formaldehyde the test method differences are nearly equivalent (100%) despite great difference in soak time, 2h vs.16h. But the limit values are not the same.

• The full ISO test method, all three parts, should be discussed and adopted by the GRPE working group to achieve global harmonization.
– Any modifications, if necessary, should be presented to ISO TC 146/SC 6/TC22 Joint WG 13 as improvements.
– The next ISO JWG 13 meeting will be held in the week from 21 September to 25 September 2015 in Delft, the Netherlands.
• Vehicle material emissions can be characterized using the ISO ambient mode
– Data shows good correlation between the regional methods and the ISO method’s ambient mode.
– The main issue of harmonize is the ambient mode soak time: 2, 8 or 16 hours.
• Consider laboratory operations including an 8 hour operation with limited test site capacity.
• Consider sampling when the emission rate is more stable.
• Compound limit values should reflect method changes.
Conclusions
• Compound limit values should reflect method changes.
– Improve to test repeatability
• Increase mass on the sample; a function of soak length, sample flow rate, soak temperature
• Include more quality control checks like duplicate samples and include void criteria.
– Standardize test reports with defined data fields and data format
• Vehicles are not always under ambient conditions.
– At elevated temperatures the concentrations will be higher
– When driven vehicle concentrations will rapidly reduce due to ventilation
14

QUESTIONS
15