vegetation survey of namibia - nbri.org.na · vegetation survey of namibia ... any grazing trial...
TRANSCRIPT

1
B.J. STROHBACH∗
Vegetation Survey of Namibia
Abstract
Plant communities form the basic units in all ecological processes, and are thus also to beregarded as basic units of natural resources management (like pasture management).Unfortunately, no concise description of the vegetation is available. The preliminary vegetationmap (Giess 1971), although being reprinted for the 3rd time during 1998, is providing a generaloverview with virtually no baseline information on the vegetation types of the country. Incontrast with the Acocks map of 1956 of the RSA, also no reference relevé data exist. TheRelative Homogenous Farming Areas Map of 1979 has been published by the then Departmentof Agriculture Technical Services, describing the basic suitability of the commercial farmingareas for various farming options. In terms of vegetation, however, it gives only an estimate ofthe grazing capacity - a concept which has been found to be inaccurate and misleading.
For planning purposes, more than just a vegetation map is needed. Baseline information onspecies composition can reveal problems with poisonous plants and/or encroacher species early.A general need for long-term monitoring is also being realised.
A project has been initiated to update the Vegetation Map of Namibia at a scale of 1:1 000 000,as part of the Agro-Ecological Zoning Project. This paper gives an overview of the project.Some preliminary results regarding the vegetation of south-eastern Namibia are also presented.
Zusammenfassung
Pflanzengesellschaften formen die Basis aller ökologischen Prozesse, und werden daher alsGrundeinheiten für Bewirtschaftung (zum Beispiel Weidewirtschaft) gesehen. Leider ist keinevollständige Beschreibung der Vegetation Namibias vorhanden. Obwohl die Giess-Karte (1971)in 1998 zum 3. Mal aufgelegt wurde, ist sie recht unvollständig mit wenig Informationen überdie Vegetationstypen des Landes. Anders als die Acocks-Karte (1956) von Südafrika bestehenauch keine Relevédaten. Die „Relative Homogenous Farming Areas Map” von 1979,produziert von dem damaligen Departement Landbou Tegniese Dienste, beschrieb diegrundsätzlichen Anwendungsmöglichkeiten der derzeitigen kommerziellen Farmereigebiete. InSachen Vegetation gab sie allerdings nur die geschätzte Beweidungskapazität – ein Konzept,das inzwischen als ungenau und irreführend betrachtet wird.
Für Planungszwecke wird mehr als nur eine Vegetationskarte benötigt. Daten über dieArtenzusammenstellung können Informationen über mögliche Problempflanzen wieGiftpflanzen oder Verbuscher aufdecken. Im Allgemeinen besteht auch ein Bedarf fürDauerbeobachtungen.
∗ National Botanical Research Institute, P/Bag 13184 , Windhoek, Namibia
JOURNAL 49Namibia Wissensschaftliche Gesellschaft / Namibia Scientific Society
Windhoek, Namibia 2001ISSN: 1018-7677

B.J. Strohbach94
Ein Projekt wurde unlängst initiiert, die Vegetationskarte Namibias im Maßstab von 1:1 000000 zu erstellen. Dieses Projekt formt Teil des „Agro-Ecological Zoning“ Programmes undwird in diesem Artikel vorgestellt. Einige vorläufige Resultate aus dem weiten Südosten desLandes werden auch vorgestellt.
Introduction
Plants are the primary producers in nature: they capture sunlight energy and convert this basicform of energy – sunlight – into chemical energy in the form of sugars and other more complexcompounds. Animals are dependent on plants for their source of energy (i.e. fodder) (Ryke1978).
Plant communities form the basis of all ecological processes - veld dynamic tendencies aresimilar in one plant community (veld type), thus such a veld type can be used as a managementunit (Daubenmire 1968; Mueller-Dombois & Ellenberg 1974; Tainton 1999). Extrapolation ofany grazing trial result is limited to the plant community in which the trial was conducted, butextrapolation is possible wherever this community is found (even outside the borders of aresearch station).
However, baseline data of the vegetation in Namibia has been missing for most parts of thecountry (Burke & Strohbach 2000). Two studies have been completed during the seventies inthis regard: the demarcation of Relative Homogenous Farming Areas (Department LandbouTegniese Dienste 1979) and the Preliminary Vegetation Map of Namibia (Giess 1971).
Relative Homogenous Farming Areas had been delimited in the 1970's (Department LandbouTegniese Dienste 1979), discussing farming possibilities and constraints of the commercialfarming area. No baseline data on the vegetation have been given, except for an estimation ofthe grazing capacity. This map has been found to be inaccurate for quite some time now, albeitnot proven (Strohbach 1995); whilst the carrying capacity concept has since changed from afixed rate per area to the biomass concept, which is an (annually changing) estimate of theamount of fodder produced during that season’s rainfall (Bester 1988).
The preliminary vegetation map was drawn up in 1971, using basic techniques (Giess 1971;Giess 1998). Although it has been found to be relatively accurate, a number of anomalies havebeen found. The description of the vegetation is very elementary, given little baseline data (ifany) which can be used for further studies. The Veld Types Map of Acocks for example, whichhas first been published in 1956, and has also seen its 3rd revision (Acocks 1975), providesvaluable baseline data. The original field data books are still available, and these sites haverecently been proposed as long-term vegetation monitoring sites in South Africa (Westfall &Greeff 1998). The Acocks- map has been further updated and completed (Low & Rebelo 1996)and is still under revision (D.J. McDonald 1 & G.J. Bredenkamp 2, personal communications).
Since independence, emphasis in agricultural development has shifted towards the communalfarming sector. For the planning and the development of this sector it soon became apparentthat baseline information on the natural resources of the country was needed, especiallyconcerning limitations and possible alternative practices. For this purpose the Agro-EcologicalZoning (AEZ) Programme was initiated (Coetzee 1999a; see also preceding reports). The main
1 Dr D.J. McDonald, Conservation Biology, National Botanical Institute, Private Bag X7, Claremont 7735, SouthAfrica.2 Prof. G.J. Bredenkamp, Department of Botany, University of Pretoria, Pretoria, South Africa.

Vegetation Survey of Namibia 95
aim of the AEZ-programme is to collect baseline data on the soils, climate and vegetation of thecountry, especially concerning their production potential and production constraints.
As part of the AEZ-programme, a number of sub-projects have been initiated, of which thefollowing are of interest:
• The preliminary agro-ecological zonation has been completed in 1996 as part of an FAO /MARD Technical Co-operation Project (TCP/Nam/6611(A) (de Pauw 1996; de Pauw &Coetzee 1998/99; de Pauw et al. 1998/99). In this project a preliminary agro-ecologicalzones map, based on climate (expressed as the length of growing season) and topography,was produced.
• The Soil Survey of Namibia is presently underway with Spanish aid (Coetzee 1999b). Thisproject aims to produce a soil map of Namibia at a 1:1 000 000 scale, with selected areas inthe north at a larger scale.
• The Biomass Estimation Project (du Pisani 1999) aims to estimate the annually producedgrass biomass with the aid of NOAA AVHRR NDVI images. For this process the model ofMonteith3 is used (Ganzin 1997).
• The Vegetation Survey Project (Strohbach & Sheuyange 1999) aims to produce avegetation map of Namibia at a scale of 1:1 000 000. This project is the basis for this paper.
Objectives of the vegetation survey project:
(i) To update and refine the preliminary vegetation map of Namibia (Giess 1971) to ascale of 1:1 000 000.
(ii) To classify and describe the veld types of Namibia.(iii) To establish a database of vegetation and habitat data.(iv) To establish an inventory of species occurring in each veld type, both influencing
grazing capacity (i.e. grasses and shrubs/trees) and other species with potential uses(i.e. timber, medicinal plants, etc.)
(v) To obtain baseline information on the densities of species in the veld, with regards topossible uses (grazing, browsing, harvesting of medicinal plants, etc.) andconservation of rare/endangered species.
(vi) To create a baseline on which veld condition models can be developed and utilised.
3 According to Monteith, biomass production can be calculated as follows:
BP = ei * eb * ec * GR * dt
Where: GR is the Global Radiationdt is the duration for which the biomass is calculatedei is the energy interception efficiency (derived from NOAA AVHRR NDVI images)eb is the fraction of light energy utilisable by plants (0.48)ec is the energy conversion efficiency -
The ec-factor is calculated from the relationship grass cover to woody species cover, as grasses caneffectively convert 80 % of the sunlight energy into chemical energy, whereas shrubs can only convert 40 %
of the sunlight energy .

B.J. Strohbach96
Methods
Vegetation mapping and description normally follows a very distinctive route (Figure 1):
Step 1: Initial Stratification
The purpose of initial stratification is to delimit relatively homogenous mapping units withinthe study area in order to reduce the sampling effort. The general hypothesis is that plants areassociated with a specific habitat, and because of that, certain groups of plants (i.e. plantassociations) can be found in specific habitats.
For the initial stratification, maps reflecting habitat characteristics are normally used. For thepurpose of the Vegetation Map of Namibia, the Agro-Ecological Zones Map of Namibia (dePauw 1996; de Pauw et al. 1998/99) is being used as baseline map. The one addition is that theLand Type class ‘R’ (inselbergs and rocky outcrops) has been subdivided into 54 unitsaccording to geology and to growing period zones. These agro-ecological zones (AEZ’s) havebeen transferred onto standard 1:250 000 topographic sheets, which are then used in the field.
Step 2: Field surveying
Landscape samples and the size of sampling sites:
According to Westfall et al. (1996) the size of a sample plot is to be defined according to thescale of the map. For the envisaged Vegetation Map of Namibia at a scale of 1:1 000 000, thesize of the sample sites would be 2000x2000 m. As this size of plot is impractical to survey,Westfall et al. (1996) suggest to use a thin transect of 2 km in length, or a series of smallersubplots within the main plot. This approach was adopted for the Vegetation Survey project:
InitialStratification
FieldSurveys
DataBasing
Data Processing(Classification)
Synopsis(Description)
FinalMapping
Using:• Aerial
photographs• Satellite
images• Topographic,
geologicaland soil maps
• Land typemaps (like theAEZ map)
FollowingstandardBraun-Blanquetprocedureswithabundanceestimates
TurboVeg • Braun-Blanquettabulations(MegaTab)
• Numericalclassification(PHYTOTAB,TWINSPAN)
• Ordination(CANOCO,DECORANA)
Describing thevegetationaccording to:• Characteristic
species• Structure• Diversity• Vegetation
dynamics (i.e.strong andweakcompetitors)
• Habitat
• Photos
Using:• Aerial
photographs• Satellite
images• Topographic,
geologicaland soil maps
• Land typemaps (like theAEZ map)
• Database
Figure 1: Schematic procedures in vegetation description and mapping.

Vegetation Survey of Namibia 97
depending on the variation within the landscape, a series of three to six, sometimes as much as12 plots, would be grouped together: a “Landscape sample”.
Each plot is 20x50 m in size, or 1000m2. In cases where the topographic unit would not allow a20 m wide plot (e.g. narrow streams and riverbeds, the crests of dunes in the southern Kalahari),a thinner plot of 10 m wide, but 100 m long would be made. The size of 1000 m2 has beenfound to work on a wide range of environments within Namibia and has been adopted by othergroups working with vegetation in Namibia, e.g. the University of Cologne (ACACIA 1998).
Selecting sampling sites:
Landscape samples are selected as randomly as practically possible. Obviously, due to the sizeof the country, accessibility is a prime prerequisite, in order to minimise the travelling time. The20x50 m sub-samples are then selected in such a way to (a) be representative of the differenttopographic units of the landscape and yet (b) be selected at random. Often a predetermineddistance is driven / walked between such plots, e.g. 300 m. In all cases the sample is to besituated well within a homogenous stand.
A minimum of 4 to 6 landscape samples are surveyed per mapping unit.
Information gathered at each sampling site:
A special set of field data sheets was designed for this purpose (Appendix 1):
A GPS reading is taken at the plot, preferably in the northwestern corner. The GPS is set to the“Schwarzeneck” map datum. Additional locality information includes the Region, District, farmor locality name, and a short description of the locality.
Habitat information includes the slope, the terrain type, aspect, stone cover estimation, lithology(parent material), erosion severity, surface sealing/crusting, disturbances, etc. For thisdescription the SOTER methodology (FAO 1993) is being used.
The vegetation information basically consists of a full list of species found on the plot,following the standard Braun-Blanquet procedure (Mueller-Dombois & Ellenberg 1974).Geophytes are normally excluded (except if found in flower - i.e. identifiable). Plants whichcannot be identified in the veld, are collected for later identification in the herbarium. Eachspecimen is accompanied by a standard collection form.
With each species noted, details are taken with regards to its growth form, i.e. whether it is atree, shrub, dwarfshrub, grass or herb, following the definition of Edwards (1983). Theabundance of each species is estimated according to its crown cover, more or less following theDomino Scale (Mueller-Dombois & Ellenberg 1974). The abundance is given as percentagecover. Methods like the Plant Number Scale (Westfall & Panagos 1988) or the Log scale ofMcAuliffe (1990) can also be employed.
A photograph is taken at each plot to document the landscape as well as the structure of thevegetation.
Step 3: Databasing
Most vegetation data processing packages require the original CEP-format (Cornell EcologyProgrammes format). This format is an ASCII file written for FORTRAN applications. Theformat is very specific, meaning that it is very cumbersome to write or even edit. Databasing isnot possible with this format. The database to be used has to be able to both import and export

B.J. Strohbach98
this format, as many datasets are already available in this format. Another prerequisite for sucha database is the ability to include all possible habitat data recorded together with the speciescomposition data.
TurboVeg (Hennekens 1994) was developed by the IBN-DLO at Wageningen, the Netherlands.It is used by the Dutch for databasing the relevés (a relevé is the data recorded at a survey plot)in their Vegetation Map of the Netherlands project (Mucina et al. 1993), and will probably beused in the European Vegetation Survey project (Rodwell et al. 1995). This programme iswidely used in South Africa and has been made available by the University of Pretoria in a co-operative project to describe the savannas of southern Africa south of the Kunene, Okavango,and Zambezi. The database is based on a list of species known to occur in southern Africa,prepared and updated by the National Botanical Institute in Pretoria, RSA (Arnold & de Wet1993).
Data basing can only start once the specimens collected in the veld have been identified.
Step 4: Data processing
The relevés are classified into vegetation communities following the Braun-Blanquet tabulationmethod (Mueller-Dombois & Ellenberg 1974; Whittaker 1978). Various software packages areavailable for this purpose: TWINSPAN (Hill 1979b), MegaTab as part of the TurboVegpackage (Hennekens 1994), and PHYTOTAB (Westfall 1992; Westfall et al. 1997). The outputis a typical phytosociological table, from which the community composition and thecharacterising plant species for each community can be determined.
Further processing by PHYTOTAB gives an indication of the competitive abilities of eachspecies - strong competitors are often encroachers, while weak competitors are often thosespecies which decrease in abundance / numbers or vanish from the community with velddegradation.
The relationship between the various communities, and the communities and the habitat can befurther illustrated with ordination techniques. DECORANA (Hill 1979a) is well known for thispurpose, while CANOCO (ter Braak 1987) is slowly taking over as the standard. CANOCOallows the user to analyse the composition data together with the habitat data in a process of“Canonical Ordination”.
Instability of the older ordination packages, as reported by Oksanen & Minchin (1997), areaddressed by newer versions of CANOCO and other software packages.
For the purpose of this paper, the relevés of the landscape samples were combined andclassified with PHYTOTAB.
Step 5: Synopsis
The Phytosociological Table is rather complicated to read. A Synoptic Table condenses theinformation, listing the species in each community, and their relative affiliation to thatparticular community.
These data are then used to describe the community in terms of the following:
• The characteristic species, i.e. species which only occur in a particular community, andby which the community can be identified.

Vegetation Survey of Namibia 99
• The structure of the community according to the definition of Edwards (1983) - fromopen woodlands to shrubland vegetation.
• The species diversity - i.e. which species occur within that particular community,diversity related statistics like the number of species observed, the estimated number ofspecies and various diversity indices (Palmer 1990; Palmer 1991; Barbour et al. 1987;Gauch 1982).
• The habitat in which the community can be found.
• Species with particular traits - exotics, possible encroachers, possible endemics, rare andendangered plants which were found, etc. can be highlighted.
The text is to be accompanied by photographs (if possible).
Step 6: Final Mapping
The final classification is compared with the original map, and the spatial extent of thecommunities is defined, using various base and thematic maps and remote sensing applications,combined now with processed, sorted veld data. Geological maps often assist in the featuremapping. For example, in the Tsumkwe district many subterranean features like faults in thegeological structure define the habitat and thus the vegetation (Hines 1992).
Maps are often prepared using aerial photographs and/or satellite images. The advantage is thata fairly accurate map of the features can be prepared at (especially with modern-day remotesensing technology) a reasonable price. Interpretation mistakes from previous mapping effortscan be avoided, whilst extensive sampling on the ground can be avoided. A disadvantage is theintrinsic difficulties in interpreting the image features and correlating these to features on theground. Ground truthing exercises must always accompany the interpreting of satellite imagery.
Semi-detailed, small-scale studies of research stations
In addition to the national survey, semi-detailed studies at a 1:50 000 scale are undertaken ofvarious research stations of the Directorate Agricultural Research and Training , as well as otherstudy sites. This is to provide baseline data on these stations, partially also for other projects, forexample the Biomass Estimation project (du Pisani 1999) and partially for long-termmonitoring as part of the Namibian Long-Term Ecological Research Network (Na-LTER 2000).The value of, and the need for, long-term monitoring sites has been proven with data from Volk(1956) (Strohbach 2000a).
The same methodology as above is used, with the exception that landscape samples are oftennot possible.
Progress to date
Fieldwork has started in the 1997 growing season in southeastern Namibia. Although animmense amount of data has been collected, progress has been slow due to limited manpower.Table 1 gives an overview of the area covered.

B.J. Strohbach100
Table 1: Summary of data collected for the vegetation survey project to date (adapted fromStrohbach & Sheuyange 1999):
AEZ Description No ofrelevés
Comments
CPL 12 Hills of the Orange river valley,including the river embankment.Growing Period Zones (GPZ) 9-11.
22 Undersampled for the variationexpected and experienced.
CPL 15 Plains with dunefields on metamorphicrock. GPZ 9.
17 Sampling can be improved, especiallywater courses.
CPL 11 Hill-footslope association onsedimentary rocks. GPZ 10.
16 Harsh environment. Sampling intensitycan be improved.
CPL 14 Table mountains of the Great andSmall Karas mountains. GPZ 9.
44 The Great and Small Karas mountainsdiffer greatly regarding theirvegetation. The Small Karasmountains were not yet sampled dueto drought.
CPL 13 Strongly dissected table lands onsedimentary rocks (eastern GreatKaras mountains). GPZ 9.
21 Sampling can be improved. Theextents to be re-determined, as thisunit seems to overlap with the CPL 4-9to the north and south.
CPL 4-9 Strongly dissected plains onsedimentary rocks. GPZ 9.
87 Highly variable, ranging from stonydissected plains to old floodplains tosand drift plains. Needs to be revised.The northern parts (old Namaland) isundersampled.
R Mountains and inselbergs. Granite andgneiss of the basement complex insouthern Namibia (M54). GPZ 9.
15 Sampling can be improved.
CPL 10 Flat plains with pans and dunes. GPZ9. Mixture of stony plains similar toCPL 4-9, and sand drift to dune fields– southern extend of the Kalaharidesert.
21 Sampling can be improved.
CPL 7 Flat plains with dolerite outcrops andpans. GPZ 9.
56 Two distinct forms:- the dolerite outcrops and associatedfootslopes around Keetmanshoop.- the panveld SW of Koës.Sampling can be improved in thepanveld.
KAL 2-8KAL 2-9
Kalahari sands plateau, stabilised NW-SE dunes with common pans. GPZ 8& 9.Includes major rivers like Auob,Nossob, Olifantsriver
201 Sampling in the rivers can beimproved. No samples north of Aranos– Kalahari Research Station axis.
KAL 2-9 Kalahari sands plateau, stabilised NW-SE dunes with common pans. GPZ 9
124 Detailed sampling on KalahariResearch Station for a vegetation mapof the Station.
KAL 3-4 Kalahari sands plateau, stabilisedsand drift with few pans, GPZ 4.
15 Sampling for Biomass EstimationProject on Sandveld Research Station.
KAL 4 Kalahari sands plateau, stabilisedsand drift with common pans
17 Ohangwena region as part ofdegradation study.
KAL 8 Kalahari sands plateau, ‘Omuramba’-dune association
160 Detailed sampling on Sonop ResearchStation for a vegetation map of theStation.
CPL 9 Flat plains of the Kalkrand. GPZ 9. 41 Sampling is adequate, could beimproved towards the north.
CPL3-7 Central plateau, strongly dissectedinselberg plains. GPZ 7.
17 Sampling for Biomass EstimationProject on Tsumis Agricultural College.
CPL 2 Central plateau, fringe plains around 240 Detailed sampling on the farm

Vegetation Survey of Namibia 101
the Omatako plains Erichsfelde to follow up on Volk’swork.
CPL 2 Central plateau, fringe plains aroundthe Omatako plains
20 Sampling for Biomass EstimationProject on Omatjenne ResearchStation.
ESC 2 &ESC 4, R
Escarpment: high mountains and highplateau on basement complex;Lichtenstein Mountains (M34)
96 Auas-Oanob Conservancy to the SWof Windhoek
KALK 2 Kalkveld around Grootfontein 60 Northern Grootfontein district. Shouldbe improved.
KALK 2 & 3,CPL 16-2, R
Kalkveld around Grootfontein. OtaviMountain range
107 Detailed sampling on UitkomstResearch Station
Total: 1397
The data of the past seasons has been entered into the TurboVeg database, with the currentseason’s work still outstanding (417 relevés). These will be databased as soon as the specimens(about 1200 for this season) have been identified.
Detailed studies on selected farms and research stations
Detailed surveys have been completed on Uitkomst, Sonop and Kalahari Research Stations, aswell as the farm Erichsfelde in the Okahandja district. This farm has attracted extraordinaryattention due to the fact that old relevé data of Prof. O.H. Volk dating from 1956 have beenfound for that farm. These data allow a comparison of the veld over a period of 45 years, thusgiving an insight into degradation trends (see also Strohbach 2000a). This is a prime example ofthe value of such relevé data – long-term observations are extremely rare due to the long-termnature of such studies.
Data processing is ongoing, with the results of Uitkomst Research Station to be published laterthis year (Strohbach 2000b; Strohbach & Sheuyange 2000).
Data from other sources
Due to the slow progress with surveying, an attempt was also made to identify and utilise datafrom as many other sources as possible. The criteria for acceptable data are as follows:
(i) The data should be dated.(ii) The position of the relevés should be indicated (on a map, a position
description, etc.).(iii) A full species list for each sample site (thus a true relevé according to the
Braun-Blanquet procedure) must be present.(iv) Indications of the abundancies and growth forms of the species would be
ideal to have, but not a necessity.
A number of possible data sources have been identified (Table 2).

B.J. Strohbach102
Table 2: Possible sources of additional data for the vegetation survey project (adapted fromStrohbach & Sheuyange 1999):
Author /Surveyor
No ofrelevés
Region Area / Locality Comments
Acocks 1953 12? Karas Southern Namibia As quoted in Westfall & Greeff1998. Data source to be verified.
Volk 1956 70 Otjiozondjupa Erichsfelde Data has been databased andcleaned, with exception ofunresolved specie nicknames.
Robinson1976
472 Erongo Central Namib Collected during an extreme rainyseason. Data available as a table.
le Roux 1980 204 Kunene Etosha NationalPark
Plant data digitised by PretoriaUniversity, habitat data still to beadded. Original survey sheetsavailable.
Jankowitz1983
175 Otjozondjupa Waterberg PlateauPark
Plant data digitised by PretoriaUniversity, habitat data still to beadded. Original survey sheets tobe obtained.
Kellner 1986 147 Khomas Daan Viljoen GameReserve, Claratal,Bergvlug
Data available as a table. Nooriginal survey sheets available.
Fanroth 1991 236 Karas Lüderitz &surroundings
Data available as a table. Nooriginal survey sheets available.
Strohbach(1990-93)
343 Otjozondjupa Eastern Grootfonteindistrict
Data cleaned and entered intodatabase, ready for processing.(Part of the “bush” project).
Hines 1992 224 Otjiozondjupa Old Bushmanland Data still to be obtained/ digitised.Burke 100 Hardap Naukluft Data in CEP format.Hachfeld1996
183 Erongo Central Namib(Ugab to Kuiseb)
The study is continuing. No finaldataset yet available.
Gimborn 1996 45 Hardap Hanaus & Nico Data databased, need to beimported into TurboVeg.
Jakobs 1996 49 Hardap Nico: detail of 1 km2 Data databased, need to beimported into TurboVeg.
Lindenbach1996
57 Hardap Nico: degradationtrends
Data databased, need to beimported into TurboVeg.
Leuchtenberg1997
53 Otjozondjupa Otukarru Data available as a table.
Schedel 1997 39 Hardap / Karas Transect fromHelmeringshausenvia Gibeon toGochas
Data available as a table. Nooriginal survey sheets available.
Strohbach1997
32 Hardap Acacia Park,Rehoboth
Data to be digitised.
Strohbach,Sheuyange &Calitz 1997
17 Otjozondjupa Old Bushmanland Data to be digitised.
ACACIA 1996– 1999(T. Becker)
300+ Kunene Opuwo district ACACIA project still ongoing. Nofinal dataset yet.
ACACIA 1996– 1999(A. Schulte)
168 Kunene Opuwo district ACACIA project still ongoing.Preliminary dataset, to betranslated / encoded. Repetition of56 plots over 3 years.
NOLIDEP(Burke) 1998
27 Kunene,Oshana,Kavango
NOLIDEP baselinesurvey
Data entered into database
Water Affairs 25 Oshana, Oshanas Data to be obtained

Vegetation Survey of Namibia 103
(Clarke 1998) OmusatiStrohbach, duPlessis et al.1998
18 Oshana,Omusati,Kunene
Recognisance survey of Mopane-veld. Awaiting final clean-up.
Burke ? Erongo andKaras
Inselberg data Various inselbergs in western andsouthern Namibia
DWA/EEAN(Strohbach1999)
125 Oshikoto Northern Tsumebdistrict (communalarea)
Data form an EIA for piped watersupply. Data to be cleaned.
Total: 2057 relevés, of which 533 have been databased to various stages of clean-up.
First Results of the nation-wide survey
Initial classification results indicate a strong correlation between the vegetation and the AEZsfor the Dwarf Shrub Savanna of Giess (1971). As the classification is not yet complete, thefollowing description is based on the AEZ-units rather than actual classification units. (Figure2).
As part of the description, the average cover for the various components, with an indication ofthe standard deviation, is given (based on the cover estimate during surveying). The totalnumber of species observed, as well as an estimate of the number of species to be expected inthe veld type, is given. The estimate is based on the Jackknife 4 procedure of Heltshe &Forrester (1983), as quoted in Palmer (1990) (see also Palmer 1991).
Starting from the far south:
CPL12: The Orange River Valley
The valley of the Orange river is formed by sloping erosion plains and moderately steep to steephills and mountains, all part of the Namaqualand belt of metamorphisation and granitisation(Geological Survey 1980). Species composition is varying, with a total of 176 species observedin 19 relevés (mean number of species per relevé: 32). It is estimated that the total number ofspecies can well exceed 206 species, especially considering that part of this unit is the“Pofadder Centre of Endemism” (Jürgens 1991). As a matter of fact, this unit forms the largestpart of the “Eastern Gariep District” of the Nama Karoo according to Jürgens (1991). This unitis also comparable with the “Orange River Broken Veld (32a)” of Acocks (1988) or the“Orange River Nama Karoo” of Low & Rebello (1996).
Typically the vegetation is a short shrubland, with the tree cover at 0.2% (± 0.1%); shrub cover(higher than 1 m) at 0.82 % (± 0.9 %); dwarf shrub cover (below 1 m) at 2.53 % (±1.0 %); grasscover at 1.69% (±2.21%) and herb cover at 2.92% (±0.97%). The total cover is on average 8.2%(±3.5%) and seldom exceeds 20 % (Figure 3).
4 The Jackknife is calculated as follows:
SR = SO + r(n-1)/n
where: SR is the estimated species richnessSO are the number of observed speciesr is the number of species on a particular relevé. In this case the median is used.n is the number of relevés
(Heltshe & Forrester 1983)

B.J. Strohbach104
Orange River Embankment
The embankment of the Orange river supports a distinct own vegetation type, a narrow band ofwhat Giess (1998) described as riverine forest (Figure 4).
The bank itself is made up of loose alluvial deposits, with a mixture of rounded stones andvarious sand textures. The vegetation type is a result of the high amount of water availablealong the bank of the river, with many hydrophytic plants present (e.g. Phragmites australis,Equisetum ramosissimum, Salix mucronata subsp. capensis, Rhus pendulina and Tamarixusneoides). Due to the nearness to water, various weedy plants have also established here, e.g.Nicotiana glauca, Ricinus communis, Solanum nigrum and especially Prosopis velutina . Due toencroachment by the latter species, only few species have been observed (35), whilst about 50species are estimated to occur in this unit. The tree cover reaches 54.1% (±25.2%), with a shrubcover of 5.87 % (±5.9%). This makes it a short closed woodland, occasionally (with enoughunderstory cover) also a short closed thicket. The grass cover of 12.3 % (±6.8 %) is provided bya lawn of Cynodon dactylon , whilst the dwarf shrub cover (0.67 %) and the herb cover (2 %) isnegligible.
Figure 2: The Agro-Ecological Zones of south-eastern Namibia which are described in thetext (after de Pauw et al. 1998/99).

Vegetation Survey of Namibia 105
Figure 3: View across the Orange river valley at Jericho / Stolzenfels. Relevé 80140, 18 April 1997.
Figure 4: Riverine thicket east of Veloorsdrift. Note the dense stands of Prosopis velutina. Relevé 80144,19 April 1997.

B.J. Strohbach106
Figure 5: Sandy plains of the CPL 15 support an open shrubland with relatively high grass cover.Relevé 80193, Aluriesfontein, 24 April 1997.
Figure 6: Barren landscape of the CPL 11 at Ysterputz in the Bondelswarts communal area. In theforeground is part of the dolerite outcrop visible. Relevé 80154, 20 April 1997.

Vegetation Survey of Namibia 107
Figure 7: The lower slopes of the Great Karas Mountain and the surrounding inselbergs form part ofthe Namaqualand belt of metamorphisation and granitisation, as can be seen on this mountain.Relevé 80077, Neu-Noachabeb, 20 February 1997.
Figure 8: The vegetation of especially the eastern plateau’s of the Great Karas Mountains resembleKaroo vegetation. Relevé 83116, Witmond, 31 March 1998.

B.J. Strohbach108
CPL 15: Sandy plains on metamorphic rock
The CPL 15 is fairly flat to slightly undulating without any major rock outcrops or mountains,forming the plateau to the north of the Orange river valley. The soils are coarse sands derivedfrom the rocks of the Namaqualand belt of metamorphisation and granitisation, thus explainingthe frequent but moderate erosion.
The vegetation is again a short open shrubland, with the tree cover at 0.03 % (± 0.1%), shrubcover at 0.53 % (± 0.7 %), dwarf shrub cover at 2.92% (±3.1%), grass cover at 3.37% (±2.6 %)and herb cover at 2.54 % (±2.6 %). The total cover is 9.39 % (±5.0%). As can be seen from thestandard deviations, the cover of the different components varies widely, with only the grasscover more or less always present. This unit is then also dependent on grasses, especially thevarious Stipagrostis species, for its grazing production. The total number of species observed inthis unit is 162, whilst an estimated 186 species should occur here. Per relevé 26 species werefound. (Figure 5).
CPL 11: Hill-footslope associations on Karoo sediments
Similar to the CPL 15, this AEZ occurs directly north of the Orange river valley, but to the westof the CPL 15. These undulating plains are generally steeper than those of the CPL 15, oftenwith dolerite outcrops or shale outcrops. The geology is predominantly shales of the PrinceAlbert formation, combined with dolerite intrusions, both of the Karoo sequence (GeologicalSurvey 1980).
Due to the nature of the soils, this short open shrubland is also more sparse (total cover is 4.71% ± 1.6%). Tree cover is again only 0.03 % (± 0.07 %), shrub cover is 0.31% (± 0.3 %), dwarfshrub cover is 1.52 % (±0.9 %), grass cover 0.60 % (± 0.5 %), whilst herbs attain a cover of2.25 % (± 0.8 %). The relatively high herb cover indicates the ephemeral nature of thevegetation. The low cover is also well reflected in satellite images like the NOAA NDVIimages (Strohbach et al. 1996). (Figure 6).
The observed number of species is 96, with about 18 species per relevé. An estimated 113species should occur in this AEZ.
CPL 14: The Karas Mountains and associated inselbergs
The Great Karas Mountains are table mountains with a base of granites / gneisses of theNamaqualand belt of metamorphisation and granitisation, and various plateaux of sandstone andshales of the Schwarzrand subgroup (Geological Survey 1980). The inselbergs in the plains tothe southwest of the Great Karas Mountain are also of granitic origin, and support a similarvegetation to the slopes of the Great Karas Mountain. Because of this, these two AEZs (CPL14and R) are discussed together. The CPL14 consists of both the Great and the Small KarasMountains; due to limited samples on the Small Karas Mountain it is not included in thisdescription.
The vegetation is a short open shrubland, with the tree cover at 0.32 % (±1.7 %), shrub cover at0.99 % (±2.8 %), dwarf shrub cover at 3.80 % (±4.9 %), grass cover at 5.31 % (±4.8 %) andherb cover at 1.39 % (±1.7 %). As can be seen from the standard deviations, the cover is highlyvariable for the different components. The total cover can reach as much as 30 %, but is on

Vegetation Survey of Namibia 109
average 11.8 % (±7.5 %). (Figure 7). 332 species have been observed, with an average of 27species per relevé. It is estimated that at least 349 species occur in this AEZ.
Of interest are the plateaux of the Great Karas Mountains. These support a vegetation not unlikethat of the Karoo (Acocks 1988), with grasses like Themeda triandra, Digitaria eriantha,Tragus koelerioides and various dwarfshrubs like Pentzia species, Pteronia species etc. Alongthe escarpment Acacia hereroensis and Rhigozum obovatum can be found. These species,especially the grass species, could be the result of higher rainfall due to the relative height of theplateau. (Figure 8).
CPL 13: Table lands of the Karas Mountains
To the east of the Great Karas Mountains is a mountainous highland often referred to as part ofthe Karas Mountain complex. This mountainous highland is however lower than the GreatKaras Mountains, more dissected and of slightly different geological origin, beingpredominantly sandstones and shales of the Fishriver subgroup (Geological Survey 1980). Herethe general slopes are also only moderately steep to steep, with moderate stone and rock cover.
The vegetation is a tall open shrubland, mainly due to the fact that Acacia mellifera subsp.detinens, Euphorbia avasmontana and Grewia tenax are quite prominent here. The tree cover is0.03 % (±0.07 %), shrub cover 4.73 % (±4.3 %), dwarf shrub cover 3.38% (±2.9 %), grasscover 4.91 % (±3.0 %) and herb cover 2.24 % (±1.0 %). The total cover is on average 15.3 % (±4.5 %). 159 species have been observed within these tablelands, the estimated total is 190species. The average number of species per relevé is 22. (Figure 9).
CPL 7 (south-west): Sloping plains with dolerite outcrops
Two distinct forms of the CPL 7 (plains with dolerite outcrops and pans) are found: the Koëspanveld towards the north and east is distinctly different from the shale plains and doleriteoutcrops around Keetmanshoop.
The CPL 7 is bordered in the south by the Löwen river. Going to the northeast, the lower partsare formed by shales and other sediments of the Dwyka formation, followed (aroundKeetmanshoop) by shales of the Prince Albert formation. This sequence is crested by doleriteintrusions, also part of the Karoo sequence, very prominently displayed at the Quiver TreeForest and Giant’s Playground east of Keetmanshoop (Geological Survey 1980). Furthernortheast these dolerite outcrops become covered with sediments; from here onwards thelandscape slopes to the east and north into the Koës panveld.
On the dolerite outcrops a short open woodland is formed by the distinctive Aloe dichotoma(Figure 10). On the plains, however, an open tall shrubland, with a relatively high grass cover,is found (Figure 11). 232 species have been observed for this AEZ; the total number of speciesis estimated to be about 259. On average 28 species are found per relevé; the tree cover is about0.04 % (±0.08 %), shrub cover 2.07 % (± 3.1 %), dwarf shrub cover 2.99 % (± 4.7 %), grasscover 3.81 % (±3.1 %) and herb cover 1.84 % (± 1.3 %). The total cover is on average 10.7 %(±7.0 %).

B.J. Strohbach110
Figure 9: The table lands to the east of the Great Karas Mountains support a tall open shrubland, withEuphorbia avasmontana and Acacia mellifera subsp. detinens very prominent. Relevé 80102, Oas, 23February 1997.
Figure 10: Aloe dichotoma is a very prominent part of the vegetation of the dolerite outcrops in theCPL 7. Relevé 80010, Eisenstein, 12 February 1997.

Vegetation Survey of Namibia 111
Figure 11: The plains support a tall open shrubland with the grass layer dominated by variousStipagrostis species. Relevé 80004, Gellap Ost Research Station, 11 February 1997.
Figure 12: A typical pan with Salsola species in the Koës panveld. Relevé 83021, Middelplaas, 17February 1998.

B.J. Strohbach112
Figure 14: The old floodplains of the Fishriver east of Asab are near vegetation-less; here a stand ofSalsola species and Xerocladia viridiramis in a water course. Relevé 83079 along the C18, 24 March1998.
Figure 13: Typical tall open shrubveld of the Weissrand plateau on the farm Elandslaagte. Relevé83074, 24 March 1998.

Vegetation Survey of Namibia 113
Figure 16: Shallow sand drift (like here on Goedemoed along the D269), low dunes and stony plainsare all part of the CPL11. Relevé 80083, 21 February 1997.
Figure 15: Stony plains at the foot of the Great Karas mountains on Dassiefontein. Relevé 83105, 29March 1998.

B.J. Strohbach114
CPL 7 (northeast): the Koës panveld
The fairly flat panveld displays poor drainage patterns, so many pans have formed. Many soilsalso display waterlogged properties. The vegetation is generally a low open shrubland, butcould also become a tall open shrubland. The tree cover is extremely low with only 0.005 %;shrub cover is 1.16 % (±1.7 %); dwarf shrub cover is 2.11 % (±2.2 %), grass cover is the 3.36% (±4.6 %) and herb cover is 1.78 % (±2.3 %). The total cover is 8.4 % (± 5.0%). 202 specieshave been observed here with an average of 23 species per relevé; the estimated number ofspecies is 225. (Figure 12).
CPL 9: The Weissrand plateau
The “Weissrand” or “Witrand”, meaning “white escarpment”, was formed by recent calcareousdeposits (thus the name “Weissrand”) on top of the Karoo sediments, as base layer to theKalahari sands in the east (Geological Survey 1980). These deposits are recognised as the“Weissrand formation” of the Kalahari Group (SACS 1980) and form an extended plateau tothe east of the main road between Mariental and Keetmanshoop. The plateau is only thinlycovered by sand drift from the nearby dune field, thus having fairly extensive stone and gravelcover. Although the plateau is fairly flat (gently undulating), moderate to severe sheet erosionhas been noted here.
The vegetation is a tall open shrubland, with the shrubs Catophractes alexandri, Boscia foetida,Parkinsonia africana and Rhigozum trichotomum dominating the vegetation. Tree cover is onaverage only 0.02 % (±0.06 %), shrub cover is 2.24 % (±8.0 %), dwarf shrub cover is 1.71 %(±2.8 %), grass cover is 0.97 % (± 1.8 %) and herb cover is 0.91 % (± 1.6 %). The total cover is5.9 % (± 9.6 %). As can be seen from the standard deviations, the cover is highly variable. 131species have been observed here with on average 25 species per relevé. It is estimated that atleast 155 species occur here. (Figure 13).
CPL 4-9: Strongly dissected plains
These various plains stretch from central Namaland in the north up to the Blydverwagt Plateausouth of Ariamsvlei in the south. In between are alluvial plains of the Fishriver (Figure 14),stony plains on various formations of the Karoo and Nama sequences, sand drift plains,sometimes even dunes similar to the Kalahari, as well as gravel plains on the Namaqualand beltof metamorphisation and granitisation (Geological Survey 1980) (Figure 15). The slopes are asvariable, but mostly undulating. Stone cover is mostly relatively low, with slight to moderatesheet erosion being observed.
The vegetation is as variable as the habitat. Tree cover is 0.34 % (±1.4 %), shrub cover 2.3 %(±6.5 %), dwarf shrub cover 3.61 % (±4.3 %), grass cover 3.66 % (±4.8 %) and herb cover1.38% (±1.8 %). On average the total cover is 11.3 % (±11.1 %). The structure varies between atall open shrubland to a low open shrubland, with occasional low open to sparse woodlandsincluded (in riverbeds etc.). 307 species have been observed here with on average 27 speciesper relevé; an estimated 334 species should occur here.
CPL 10: Plains with dunes
Around Aroab the Kalahari dune field starts, partially covering a stony plain (similar to theCPL4-9, on Fishriver subgroup and Dwyka formation sediments) with shallow sand drift to low

Vegetation Survey of Namibia 115
dunes. This unit can be seen as a mixture of the CPL4-9, with some pans, and the southernKalahari. As a matter of fact, Giess (1998) included this area into the southern Kalahari. (Figure16).
Southern Kalahari
In the southern Kalahari, the determining factors are also the soils and topography; these arehowever not adequately reflected in the AEZ-map (compare Leser 1971with de Pauw et al.1998/99). Extensive studies of the vegetation of the southern Kalahari have been done byLeistner (1967). Leistner & Werger (1973) also give a phytosociological account of thevegetation. Although data is available, no comparison has yet been made between these olderresults and the present day situation.
Outlook: the way ahead
As can be seen from the above description, there is an urgent need to complete thephytosociological description of the vegetation. Only a proper classification will describe thecommunities, their composition and their structure in a more consistent way.
The main constraint, however remains the slow collecting of relevé data. The BIOTA project(BIOTA 2000) plans to map a strip of vegetation ca 30 km wide from the Orange river up to theKavango: this will certainly contribute to the existing database. However, more than that isneeded. An ongoing effort is made to try and co-ordinate vegetation related studies in such away that the data can also be used for the vegetation survey project. Good co-operation in thisregard is received from the Botanical Institute of the University of Cologne, with ongoingprojects by students in the Brandberg, the central Namib and the Opuwo district. It is also hopedthat a donor-funded project can be established in the near future to complete the project.
Acknowledgements
Dr Antje Burke and the Botanical Institute of the University of Cologne (Gimborn 1996; Jakobs1996; Schedel 1997) contributed additional data to this study; these are gratefullyacknowledged. Tuhafeni Sheuyange, Renate Kubirske, Eleanor Chivell, Albert (Kallie) Calitzand Henk Dauth helped with fieldwork, whilst the staff of the National Herbarium of Namibia(WIND) assisted with plant identifications. Without this help this study would have beenimpossible. The goodwill and co-operation of all the farmers visited during the past 4 years isalso gratefully acknowledged.
References
ACACIA 1998. Kultur- und Landschaftswandel im ariden Afrika. Entwicklungsprozesse unterökologischen Grenzbedingungen. Ergebnisbericht für die Jahre 1995/2 - 1996 - 1997 -1998/1. Universität zu Köln, Köln.
ACOCKS, J.P. 1975. Veld Types of South Africa. 3rd Edition. Memoir of the Botanical Surveyof South Africa No 57. Botanical Research Institute, Department of Agriculture andWater Supply, Pretoria.
ARNOLD, T.H. & DE WET, B.C. 1993. Plants of southern Africa: names and distribution.Memoirs of the Botanical Survey of South Africa No 62. NBI, Pretoria.

B.J. Strohbach116
BARBOUR, M.G.; BURK, J.H. & PITTS, W.D. 1987. Terrestrial plant ecology. 2nd Edition.Benjamin/Cummings Publishing Co, Menlo Park, California.
BESTER, F.V. 1988. Die bepaling van die grasproduksie van natuurlike veld. Agricola 6:26-30.
BIOTA. 2000. BIOTA Africa: Ein integratives Biodiversitätsforschungsprojekt mit derZielsetzung der Analyse des Wandels der organismischen Vielfalt Afrikas durchUmwelt- und Nutzungswandel sowie der praxisorientierten Entwicklung einesnachhaltigen Biodiversitätsmanagement. BIOTA Südafrika. Universität zu Köln;Zoologisches Forschungsinstitut und Museum Alexander Koenig & UniversitätWürzburg, Köln - Bonn - Würzburg.
BURKE, A. 2000. A desert – savanna ecotone: plant communities of the Naukluft Mountains,Namibia. Journal of Vegetation Science, in press.
BURKE, A. & STROHBACH, B. J. 2000. Vegetation studies in Namibia. Dinteria: In prep.
CLARKE, N. V. 1998. Environmental research report for the Cuvelai drainage basin: Baselinestudy of the ecology of the oshanas. Ecological Research Section, Division WaterEnvironment, Department of Water Affairs, Windhoek.
COETZEE, M.E. 1999a. Agro-Ecological Zoning Programme. Proceedings of the 1999 AnnualResearch Reporting Conference of the Directorate Agriculture Research and Training,Ministry of Agriculture, Water and Rural Development, Swakopmund, September1999.
COETZEE, M.E. 1999b. National Soil Survey of Namibia. Proceedings of the 1999 AnnualResearch Reporting Conference of the Directorate Agriculture Research and Training,Ministry of Agriculture, Water and Rural Development, Swakopmund, September1999.
DAUBENMIRE, R. 1968. Plant Communities: A Textbook of Plant Synecology. Harper &Row, New York.
DE PAUW, E. 1996. Agroecological zones of Namibia. First appoximation. TechnicalCooperation Project TCP/Nam/6611(A) "Initiation of National Agroecological ZoningProcedures". Technical report No 1. FAO, Rome.
DE PAUW, E. & COETZEE, M.E. 1998/99. Production of an Agro-Ecological Zones Map ofNamibia (first approximation). Part I: Condensed Methodology. Agricola 10:27-31.
DE PAUW, E., COETZEE, M.E., CALITZ, A.J., BEUKES, H. & VITS, C. 1998/99.Production of an Agro-Ecological Zones Map of Namibia (first approximation). PartII: Results. Agricola 10:33-43.
DEPARTMENT LANDBOU TEGNIESE DIENSTE. 1979. Die afbakening van redelikehomogene boerderygebiede van die noordelike en sentrale substreke van S.W.A. metdie heersende knelpunte en beoogde ontwikkleingsprogramme vir die verskillendebedryfstakke. Department Landbou Tegniese Dienste, Windhoek.
DU PISANI, A.L. 1999. Estimation of seasonal biomass using NOAA NDVI satellite images.Proceedings of the 1999 Annual Research Reporting Conference of the DirectorateAgriculture Research and Training, Ministry of Agriculture, Water and RuralDevelopment, Swakopmund, September 1999.
EDWARDS, D. 1983. A broad-scale structural classification of vegetation for practicalpurposes. Bothalia 14(3&4):705-712.

Vegetation Survey of Namibia 117
FAO. 1993. Global and national soils and terrain digital databases (SOTER) . Land and WaterDevelopment Division, Food and Agriculture Organisation of the United Nations,Rome.
GANZIN, N. 1997. Rangeland monitoring and management using satellite imagery. Anexample based on NOAA/AVHRR data in Kenya, Report given at a meeting ofNOLIDEP on 20 November 1997 in the Safari Conference Centre, Windhoek.
GAUCH, H. G. 1982. Multivariate analysis in community ecology. Cambridge UniversityPress, Cambridge.
GEOLOGICAL SURVEY, 1980. South West Africa / Namibia: Geological Map 1:1 000 000.Geological Survey of the Republic of South Africa and South West Africa / Namibia,Windhoek.
GIESS, W. 1971. A Preliminary Vegetation Map of South West Africa. Dinteria 4:1-114.
GIESS, W. 1998. A Preliminary Vegetation Map of Namibia. 3rd Revised Edition. Dinteria4:1-112.
GIMBORN, A. 1996. Vegetationsökologische Analyse eines kleinräumigen Transektes von 5km Länge im Namaland (Namibia) . Schriftliche Hausarbeit der Ersten Staatsprüfungfür Lehrämter, Universität zu Köln, Köln.
HENNEKENS, S.M. 1996. TURBO(VEG). Software package for input, processing, andpresentation of phytosociological data. User's guide. IBN-DLO, Wageningen.
HELTSHE, J.F. & FORRESTER, N.E. 1983. Estimating species richness by using theJackknife procedure. Biometrics 39:1-12. (As quoted in Palmer 1990)
HILL, M.O. 1979a. DECORANA - A FORTRAN Program for Detrended CorrespondenceAnalysis and Reciprocal Averaging . Cornell University, Ithaca, New York.
HILL, M.O. 1979b. TWINSPAN - A FORTRAN Program for Arranging Multivariate Data in anOrdered Two-Way Table by Classification of the Individuals and Attributes. CornellUniversity, Ithaca, New York.
HINES, C. J. 1992. An ecological study of the vegetation of eastern Bushmanland (Namibia)and its implications for development. M.Sc. thesis, University of Natal,Pietermaritzburg.
JAKOBS, A. 1996. Vegetationskundliche und ökophysiologische Untersuchungen an einemLandschaftsausschnitt der Nama-Karoo Region (Namibia). Schriftliche Hausarbeit derErsten Staatsprüfung für Lehrämter, Botanisches Institut der Universität Köln, Köln.
JANKOWITZ, W. J. 1983. Die plantekologie van die Waterberg Platopark . Ph.D. thesis,Universiteit van die Oranje Vrystaat, Bloemfontein.
JÜRGENS, N. 1991. A new approach to the Namib Region. I: Phytogeographic subdivision.Vegetatio 97:21-38.
KELLNER, K. 1986. 'n Plantekologiese studie van die Daan Viljoen-wildtuin en geeeltes vandie plase Claratal en Neudam in die Hooglandsavanna, SWA. M.Sc. thesis,Potchefstroom Universiteit vir Christelike Hoër Onderwys, Potchefstroom.
LEISTNER, O. A. 1967. The plant ecology of the southern Kalahari. Botanical Survey of SouthAfrica Memoir No 38. Botanical Research Institute, Department of AgriculturalTechnical Servcies, Pretoria.

B.J. Strohbach118
LEISTNER, O. A. & WERGER, M. J. 1973. Southern Kalahari phytosociology. Vegetatio28(5-6):353-399.
LESER, H. 1971. Landschaftsökologische Studien im Kalaharisandgebiet um Auob und Nossob(östliches Südwestafrika) . Erdwissenschaftliche Forschung No III. Franz SteinerVerlag Gmbh., Wiesbaden.
LEUCHTENBERG, S. 1997. Vegetationsökologische Untersuchungen in der Dornbusch-Savanne auf einer Farm des Holistic Resource Management mit besondererBerücksichtigung der Böden (Namibia). Diplomarbeit im Studienfach Biologie,Universität zu Köln, Köln.
LINDENBACH, A. 1996. Vegetationsökologische Untersuchungen unterschiedlich beweideterFlächen im nördlichen Namaland, Namibia. Diplomarbeit im Studienfach Biologie,Universität zu Köln, Köln.
LOW, A.B. & REBELO, A.T. 1996. Vegetation of South Africa, Lesotho and Swaziland .Department of Environment & Tourism, Pretoria.
MCAULIFFE, J.R. 1990. A rapid survey method for the estimation of density and cover indesert plant communities. Journal of Vegetation Science 1:653-656.
MUCINA, L., RODWELL, J.S., SCHAMINEE, J.H.J. & DIERSCHKE, H. 1993. Europeanvegetation survey: Current state of some national programmes. Journal of VegetationScience 4:429-438.
MUELLER-DOMBOIS, D. & ELLENBERG, H. 1974. Aims and Methods of VegetationEcology. John Wiley & Sons, New York.
Na-LTER, 2000. Namibian Long-Term Ecological Research Network (Na-LTER). Web pageURL: http://www.netwise.drfn.org.na
OKSANEN, J. & MINCHIN, P.R. 1997. Instability of ordination results under changes in inputdata order: explanations and remedies. Journal of Vegetation Science 8:447-454.
PALMER, M.W. 1990. The estimation of species richness by extrapolation. Ecology 71(3):1195-1198.
PALMER, M.W. 1991. Estimating species richness: The second-order Jackknife reconsidered.Ecology 72(4): 1512-1513.
ROBINSON, E. R. 1976. Phytosociology of the Namib Desert Park, South West Africa. M.Sc.thesis, University of Natal, Pietermaritzburg.
RODWELL, J. S., PIGNATTI, S., MUCINA, L. & SCHAMINEE, J.H.J. 1995. EuropeanVegetation Survey: update on progress. Journal of Vegetation Science 6:759-762.
RYKE, P.A.J. 1978. Ekologie Beginsels en Toepassings. Butterworth, Durban.
SACS (SOUTH AFRICAN COMMITTEE FOR STRATGRAPHY) 1980. Stratigraphy ofSouth Africa Part 1: Lithostratigraphy of the Republic of South Africa, South WestAfrica/Namibia, and the Republics of Bophutatswana, Transkei and Venda. Handbookof the geological Survey of South Africa No 8. Dept. of Mineral and Energy Affairs,Pretoria.
SCHEDEL, A. 1997. Vegetationsökologische Transektanalyse im nördlichen Namaland(Namibia). Schriftliche Hausarbeit der Ersten Staatsprüfung für Lehrämter, Universitätzu Köln, Köln.
Vegetation Survey of Namibia 119
STROHBACH, B.J. 1995. Veld types, vegetation, veld condition assessment models andgrazing capacity – land use planning on natural vegetation-based farming systems.Proceedings of the 6th AGRISSON Congress held at Otjiwa Game Ranch, 12 – 14September 1995.
STROHBACH, C.P. 1997. Acacia Park State Forest Management Plan. Report on practicalwork for B.Sc. in Forestry, Department of Forestry, University of Stellenbosch,Stellenbosch
STROHBACH, B. J. 1999. Impact Assessment on the bio-physical environment: Oshivelo -Omutsegwonime - Okankolo Piped Water Supply Project. Environmental EvaluationAssociates of Namibia, Windhoek.
STROHBACH, B.J. 2000a. Vegetation degradation in Namibia. Paper presented at the 75th
Anniversary Congress of the Namibia Scientific Society, Windhoek, 2-3 June 2000.
STROHBACH, B.J. 2000b. The vegetation of Uitkomst Research Station (Namibia). I. PlantCommunities. In prep.
STROHBACH, B.J.; CALITZ, A.J. & COETZEE, M.E. 1996. Erosion Hazard Mapping:Modelling the vegetative cover. Agricola 8:53-59.
STROHBACH, B.J. & SHEUYANGE, T.P. 1999. Vegetation Survey of Namibia. Proceedingsof the 1999 Annual Research Reporting Conference of the Directorate AgricultureResearch and Training, Ministry of Agriculture, Water and Rural Development,Swakopmund, September 1999.
STROHBACH, B.J. & SHEUYANGE, T.P. 2000. The vegetation of Uitkomst Research Station(Namibia). II. Annotated species list. In prep.
TAINTON, N.M. (Ed.). 1999. Veld Management in South Africa (2nd Edition). University ofNatal Press, Pietermaritzburg.
TER BRAAK, C.J.F. 1987. CANOCO - a FORTRAN program for canonical communityordination by [partial] [detrended] [canonical] correspondence analysis, principalcomponents analysis and redundancy analysis (version 2.1) . TNO Institute of AplliedComputer Science, Wageningen.
VOLK, O.H. 1956. Erichsfelde. Unpublished relevé data from the farm Erichsfelde.
WESTFALL, R.H. 1992. Objectivity in stratification, sampling and classification of vegetation.Ph.D. thesis, University of Pretoria, Pretoria.
WESTFALL, R. H. & GREEFF, A. 1998. A national grid of vegetation monitoring sites. SouthAfrican Journal of Science 94:150-151.
WESTFALL, R.H. & PANAGOS, M.D. 1988. The Plant Number Scale - an improved methodof cover estimation using variable-sized belt transects. Bothalia 18(2):289-291.
WESTFALL, R. H.; THERON, G.K. & VAN ROOYEN, N. 1997. Objective classification andanalysis of vegetation data. Plant Ecology 132:137-154.
WESTFALL, R.H.; VAN STADEN, J.M.; PANAGOS, M.D.; BREYTENBACH, P.J. &GREEFF, A. 1996. Scale-related vegetation sampling . Agricultural Research Council,Pretoria.
WHITTAKER, R.H., Ed. 1978. Classification of plant communities. Dr W. Junk Publishers,The Hague.
B.J. Strohbach120
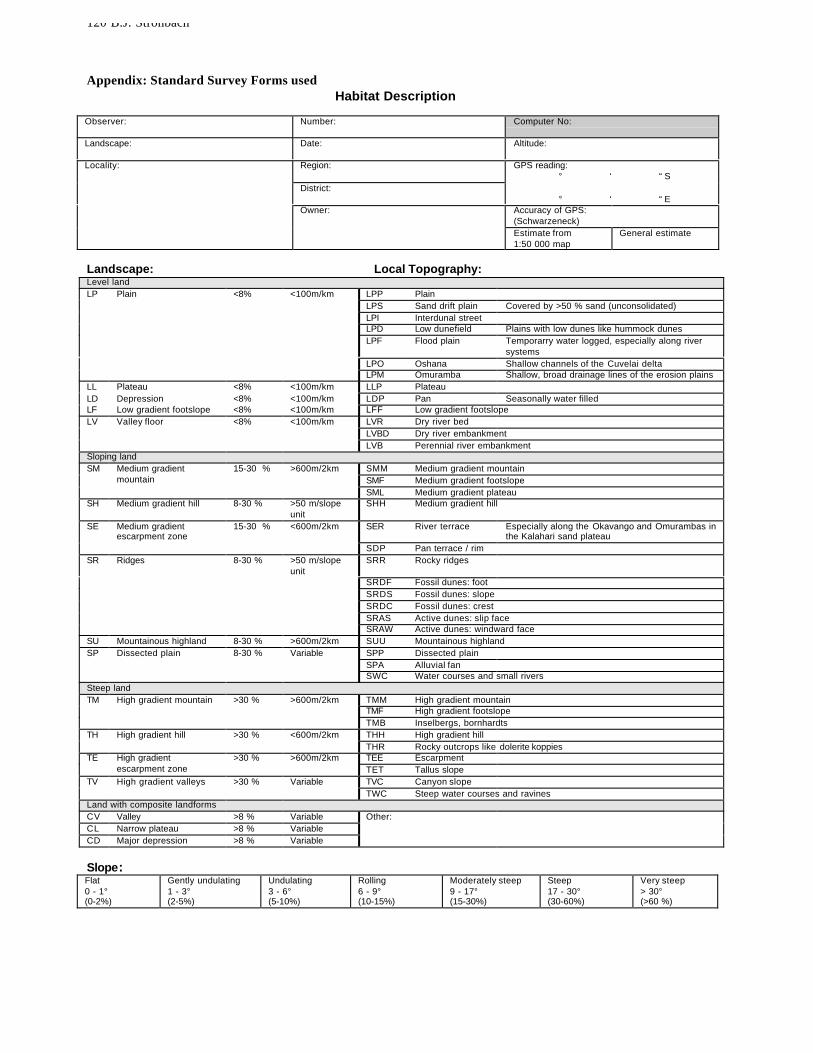
Appendix: Standard Survey Forms usedHabitat Description
Observer: Number: Computer No:
Landscape: Date: Altitude:
Locality: Region: GPS reading: ° ‘ “ S
District: ° ‘ “ E
Owner: Accuracy of GPS:(Schwarzeneck)Estimate from1:50 000 map
General estimate
Landscape: Local Topography:Level landLP Plain <8% <100m/km LPP Plain
LPS Sand drift plain Covered by >50 % sand (unconsolidated)LPI Interdunal streetLPD Low dunefield Plains with low dunes like hummock dunesLPF Flood plain Temporarry water logged, especially along river
systemsLPO Oshana Shallow channels of the Cuvelai deltaLPM Omuramba Shallow, broad drainage lines of the erosion plains
LL Plateau <8% <100m/km LLP PlateauLD Depression <8% <100m/km LDP Pan Seasonally water filledLF Low gradient footslope <8% <100m/km LFF Low gradient footslopeLV Valley floor <8% <100m/km LVR Dry river bed
LVBD Dry river embankmentLVB Perennial river embankment
Sloping landSM 15-30 % >600m/2km SMM Medium gradient mountainMedium gradient
mountain SMF Medium gradient footslopeSML Medium gradient plateau
SH Medium gradient hill 8-30 % >50 m/slopeunit
SHH Medium gradient hill
SE 15-30 % <600m/2km SER River terrace Especially along the Okavango and Omurambas inthe Kalahari sand plateau
Medium gradientescarpment zone
SDP Pan terrace / rimSR Ridges 8-30 % >50 m/slope
unitSRR Rocky ridges
SRDF Fossil dunes: footSRDS Fossil dunes: slopeSRDC Fossil dunes: crestSRAS Active dunes: slip faceSRAW Active dunes: windward face
SU Mountainous highland 8-30 % >600m/2km SUU Mountainous highlandSP Dissected plain 8-30 % Variable SPP Dissected plain
SPA Alluvial fanSWC Water courses and small rivers
Steep landTM >30 % >600m/2km TMM High gradient mountainHigh gradient mountain
TMF High gradient footslopeTMB Inselbergs, bornhardts
TH High gradient hill >30 % <600m/2km THH High gradient hillTHR Rocky outcrops like dolerite koppies
TE >30 % >600m/2km TEE EscarpmentHigh gradientescarpment zone TET Tallus slope
TV High gradient valleys >30 % Variable TVC Canyon slopeTWC Steep water courses and ravines
Land with composite landformsCV Valley >8 % Variable Other:CL Narrow plateau >8 % VariableCD Major depression >8 % Variable
Slope:Flat0 - 1°(0-2%)
Gently undulating1 - 3°(2-5%)
Undulating3 - 6°(5-10%)
Rolling6 - 9°(10-15%)
Moderately steep9 - 17°(15-30%)
Steep17 - 30°(30-60%)
Very steep> 30°(>60 %)

Vegetation Survey of Namibia 121
Stratigraphy (Geology):
AEZ:
Growing Period Zone:
Soil Type:
Stoniness: Cover & Size: Aspect:
None Gravel 0.2-2 cm Pebbles 2-6 cm Medium 6-20 cm Large 20-60 cm Rock >60 cm0-2 %2-5 %5-15 %15-40 %40-80 %>80 %
Lithology:Acidic igneous rock IA1 Granite Clastic sediments SC1 Conglomerate,
BrecciaIA2 Grano-diorite SC2 Sandstone,
greywacke, arkoseIA3 Quartz-doprite SC3 Siltstone, mudstone,
claystoneIA4 Rhyolite SC4 Shale
Intermediate igneous rock II1 Andesite, trachyte,phonolite
Organic sediments SO1 Limestone and othercarbonate rocks
II2 Diorite-syenite SO2 Marl and othermixtures
Basic igneous rock IB1 Gabbro SO3 Coals, bitumen andrelated rocks
IB2 Basalt Evaporites SE1 Anhydrite, gypsumIB3 Dolerite SE2 Halite
Ultrabasic igneous rock IU1 Peridotite Unconsolidated material UF FluvialIU2 Pyroxenite UL LacustrineIU3 Ilmenite, magnetite,
ironstone, serpentineUMUC
MarineColluvial
Acidic metamorphic rock MA1 Quartzite UE EolianMA2 Gneiss, magmatite UG Glacial
Basic metamorphic rock MB1 Slate, phylite (pelticrocks)
UPUO
PyroclasticOrganic
MB2 Schist UCa CalcreteMB3 Gneiss rich in ferro-
magnesian mineralsOther:
MB4 Metamorphic limestone(marble)
Erosion:none Wind erosion Wind
depositionShifting sand Sheet
erosionRill erosion Gully erosion Deposition by
waterslightmoderatesevereextreme
Surface Crusting:None Weak
(soft or slightly hard, <0.5cm thick)
Moderate(soft or slightly hard, >0.5cm thick, or hard <0.5 cm)
Strong(hard crust >0.5 cm)
Clay bubbles (Schaumböden)present
Rooting Depth:Very shallow Shallow Moderately deep Deep Very deep< 30 cm 30 – 50 cm 50 – 100 cm 100 – 150 cm > 150 cm
Disturbances:None Herbicides Selective
clearingMechanicalclearing
Fire Bushencroachment
Severeovergrazing
Deforestation
Other:
Notes: Photos:
N
S
EW
NW
SW SE
NE

B.J. Strohbach122
Vegetation Data
Observer: Number: Computer No:
Landscape: Date: Altitude:
Locality: Region: GPS reading: ° ‘ “ S
District: ° ‘ “ E
Owner: Accuracy of GPS:(Schwarzeneck)Estimate from1:50 000 map
General estimate
Vegetation structure:
Total Trees Shrubs >1m Trees andshrubs
Shrubs <1m Grasses Herbs
Average height
Total cover
Vegetation structure:
Th: High tree >20m Tt: Tall tree 10 – 20m Ts: Small tree 5 –1 0m Tl: Low tree 2- 5mSh: High shrub 2 –5 m St: Tall shrub 1 – 2m Ss: Small shrub 0.5 – 1 m Sl: Low shrub <50cm
Species composition:
Coll. Species Abundance by growth formNo T1 T2 T3 S1 S2 Hl
Th Tt Ts Tl Sh St Ss Sl G H
Total cover:

Vegetation Survey of Namibia 123
Coll. Species Abundance by growth formNo T1 T2 T3 S1 S2 Hl
Th Tt Ts Tl Sh St Ss Sl G H
Total cover: