vegetation management takes to the air - power line ... · vegetation management takes to the air...
TRANSCRIPT
VegetationManagement Takes to the AirBC Hydro pilots the use of LIDAR and PLS-CADD to identifyvegetation encroaching on transmission lines.
By Bryan Hooper, British Columbia Hydro
urrently, BC Hydro (Vancouver, British Columbia,Canada) vegetation management field personnelwork from the ground or from helicopters whendetermining what vegetation violates clearancerequirements and needs to be removed. This involves
a lot of estimating, as the field crews need to predict wherethe conductor would be under maximum operating tem-perature or wind condi-tions. It also requires ei-ther estimation or fieldmeasurement of trees todetermine if they wouldencroach required clear-ance zones if the trees fell.
With a generating ca-pacity of 11,500 MW, BCHydro has 18,000 cir-cuit kilometers of trans-mission lines that rangefrom 69 kV to 500 kV.This government utilityis constantly looking forinnovative and low-costmethods to maintainits network. Of course,proper vegetation man-agement is key to keep-ing its network up andoperating.
BC Hydro decided toaddress the guessworkinherent in vegetationmanagement by com-bining two technologiesnow in use in its engi-neering department. Thefirst of these involvedusing LiDAR (Light De-tection and Ranging) to
quickly survey the transmission line, including the vegeta-tion canopy in the vicinity of the line. The second involvedusing a computer program to accurately model conductorposition and movement, and to identify the vegetation thatencroached on defined conductor clearance values.
BC Hydro has been using Power Line Systems’(www.powline.com) suite of applications, including PLS-
CADD, for transmission-line design andline-rating studies since 1995. BC Hydrohas used FE sag-tension analysis for trans-mission-line rating studies since it becamea feature of PLS-CADD in 2001. The FEmodeling results in a more accurate predic-tion of wire behavior in the presence oflarge span-length variations and steep ter-rain. Furthermore, the more accurate
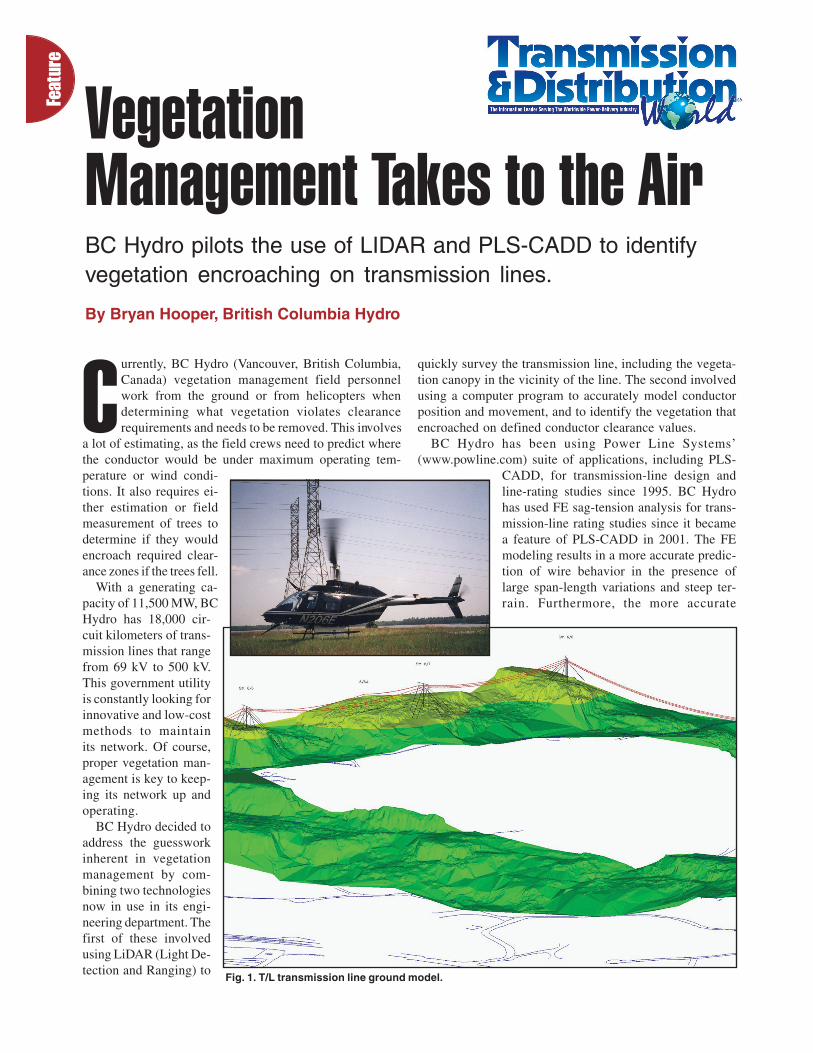
Fig. 1. T/L transmission line ground model.
C

analysis generally results in fewer required changes to anuprated line. It also allows the designer to considersituations like unequal ice and clearance improvementtechniques such as cutting out conductor or shifting slackbetween spans.
BC Hydro currently is using LiDAR survey as a cost-effective method for capturing spatial data on 69-kV trans-mission lines for the purpose of populating its enterpriseGIS system.
The utility recently completed a pilot project using thisapproach to determine vegetation clearance violationson a 230-kV uprating project. The pilot not only deliveredon the reduction of guesswork, but also revealed severalother advantages encouraging the use of the LiDAR/PLS-CADD combination as part of an on-going right-of-wayvegetation management program.
The ProjectThe project was a 230-kV transmission-line uprating on a
65-km (40-mile) line serving the Greater Vancouver area.The line was originally constructed in 1945 and initiallydesigned for 50°C (122°F) operation, but electric systemrequirements now call for the circuit to be uprated to a hotoperating temperature of 90°C (194°F).
In the first phase of the project, Rudy Rugge and JamesPeters of BC Hydro’s engineering group modeled the line inPLS-CADD. Ground structure positions and conductor ten-sion data were derived for the model using LiDAR survey.Ground clearance checks were run with the conductor at thenew required operating temperature, and where additionalground clearance was necessary, the utility employed linemodifications such as raising or adding structures. Also, insome areas where increased ground clearance was neces-sary, small lengths of conductor were removed and insula-tors re-clipped. The finite element (FE) analysis capabilityof PLS-CADD made this possible.
As this transmission line runs through a watershed that
supplies the GreaterVancouver area, BC Hy-dro historically hadbeen extremely frugal incarrying out its vegeta-tion maintenance pro-gram, by only removingvegetation perceived topose a hazard to the safereliable operation of thecircuit. Thus, theuprating of the line hadto include vegetationclearance analysis in itsscope since the utilitycould not operate theline at the increasedampacity until it had re-moved all vegetationidentified as a hazard atthe new hot tempera-
ture. Therefore, BC Hydro began a pilot project that mergedvegetation points captured by LiDAR survey to the trans-mission-line model and then calculated, plotted and re-ported vegetation-clearance violations to the newly upratedconductor positions from within PLS-CADD.
MethodologyFor those unfamiliar with LiDAR, the survey is carried
out by a helicopter, equipped with sophisticated equip-ment, flying over the subject area. The equipment consistsof a precise navigation system and a scanning laser. Thelaser transmits light pulses (about 10,000 Hz) and measuresreflection times. Distances to objects are calculated andthen combined with the precise positional data from thenavigation system. This provides the LiDAR survey pointswith their coordinate values accurate to ±0.25m absoluteand ±0.15m relative. The LiDAR supplier, in this case TerraRemote Sensing Inc. (www.terraremote.com), classifies thesurvey points into several categories such as ground, struc-ture, conductor and vegetation in a post flight process. Thesurvey points are provided for client use as ASCII files.
In late 2002, BC Hydro approached Power Line Systemswith a request to develop new PLS-CADD features exclu-sively for conductor to vegetation clearance analysis with aview using LiDAR supplied vegetation points. PLS-CADDalready had the ability to establish conductor positionsunder a variety of wind and temperature conditions. It alsoalready had the ability to perform clearance analyses to anassortment of categories of survey points each with uniqueconductor clearance requirements. In discussion with PowerLine Systems and BC Hydro’s vegetation professionals, thecompanies agreed that PLS-CADD could be used as aneffective vegetation management tool with the addition of:
● A method to identify vegetation grow-in violations.These are vegetation points that violated designer prescribedhorizontal and vertical clearance to conductor values.
● A method to identify trees that would come within a
Fig. 2. Ground model with LiDAR vegetation points merged.

designer prescribed clearance value if the tree were to fall.● A means to present the above results in a manner that
would be easy for field crews to use.BC Hydro was able to detect vegetation grow-in viola-
tions in PLS-CADD, as previously noted, be-cause the program already had the ability toassign a required horizontal and vertical clear-ance for each type of survey point (road,ground and vegetation). Typically the veg-etation clearances would be comprised of therequired electrical clearance, an allowance forvegetation growth and an additional safetymargin. In Figure 3, the values of H and Vrepresent the safe clearances values specified.Vegetation points that encroached this zonewere identified as grow-in violations.
Identifying falling trees that could comewithin a safe operating distance of the con-ductors is a bit more difficult and required theutility to make some conservative assump-tions. BC Hydro wanted to consider a treefalling, rotating about the base of its trunk atthe ground line and swinging through an arc with a radiusequal to the tree height. The utility also wanted to includean option to address the fact that trees often pivot about aroot ball rather than pivoting about the base of their trunks.
BC Hydro decided on the strategy that assumed everyvegetation point represented the top of a tree. The height ofthis tree is calculated by PLS-CADD as the distance be-tween the vegetation point and the ground surface directlybeneath it. The designer defines the optional root ball ra-dius at the time of the analysis as a percentage of the treeheight. The tree is assumed to sweep out an arc centeredabout the base of the tree (or optionally, the root ball) with aradius equal to the tree height plus a designer-suppliedclearance requirement. If the assumed treetop, when swept
towards the conductor positioned at any of the specifiedtemperature and wind conditions, comes within the speci-fied clearance distance of the conductor, it is identified as afalling tree violation (Figure 4).
To provide an effective way to present theresults so they would be useful to the fieldcrews, BC Hydro decided to use the tradi-tional PLS-CADD plan and profile sheets.This was the best way to graphically presentthe information, as it was a format that pro-vided everything necessary to locate andidentify the vegetation to be removed. Thevegetation points deemed as grow-in or fall-ing tree violations are indicated on both theplan and profile portion of the plan and pro-file sheet with different symbols and colors.This enables the field crews to distinguishbetween grow-in and falling tree violations.In addition to the drawings, a report that listseach vegetation clearance violation, its posi-tion and geometric details can be producedand either printed and exported to a spread-
sheet or database file for further manipulation.The utility had assumed it could simply merge the LiDAR
vegetation data to its PLS-CADD line model and run thevegetation clearance analyses. While this worked on smallsections, BC Hydro found that for longer lengths of line, thevolume of LiDAR vegetation data overwhelmed the com-puters memory and resulted in prohibitive run times. Thiswas particularly problematic when the analysis includedthe falling tree-analysis option.
Working with its LiDAR supplier, Terra Remote Sensing,and the survey and photogrammetry department of BC Hy-dro, the utility developed methods for reducing the datavolume to a size manageable in PLS-CADD, while stillkeeping the points that accurately represented the critical
Fig. 4. Falling tree clearance requirements.Fig. 3. Vegetation grow-in clearance requirements.
For thoseunfamiliar with
LiDAR, the surveyis carried out by a
helicopter,equipped withsophisticated
equipment, flyingover the subject
area.
position of the vegetation canopy. These included re-moving all vegetation points that are within a meterof the ground.
Another successful strategy involved the selective thin-ning of data by eliminating all but the highest vegetationpoint within a square-meter area. Be-tween these methods, performance im-provements Power Line Systems madeand the upgrading of BC Hydro’scomputer’s RAM, the utility now hadthe ability to run vegetation clearanceanalyses in a manageable time.
Identifying VegetationManagement Work
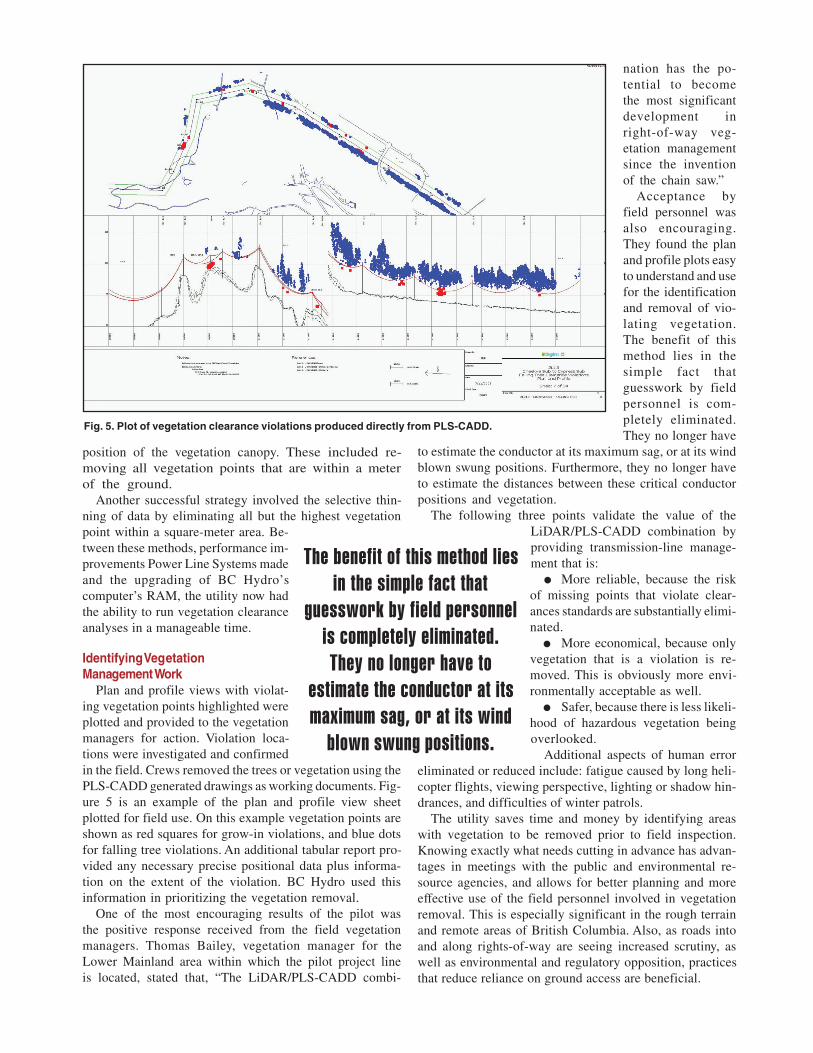
Plan and profile views with violat-ing vegetation points highlighted wereplotted and provided to the vegetationmanagers for action. Violation loca-tions were investigated and confirmedin the field. Crews removed the trees or vegetation using thePLS-CADD generated drawings as working documents. Fig-ure 5 is an example of the plan and profile view sheetplotted for field use. On this example vegetation points areshown as red squares for grow-in violations, and blue dotsfor falling tree violations. An additional tabular report pro-vided any necessary precise positional data plus informa-tion on the extent of the violation. BC Hydro used thisinformation in prioritizing the vegetation removal.
One of the most encouraging results of the pilot wasthe positive response received from the field vegetationmanagers. Thomas Bailey, vegetation manager for theLower Mainland area within which the pilot project lineis located, stated that, “The LiDAR/PLS-CADD combi-
nation has the po-tential to becomethe most significantdevelopment inright-of-way veg-etation managementsince the inventionof the chain saw.”
Acceptance byfield personnel wasalso encouraging.They found the planand profile plots easyto understand and usefor the identificationand removal of vio-lating vegetation.The benefit of thismethod lies in thesimple fact thatguesswork by fieldpersonnel is com-pletely eliminated.They no longer have
to estimate the conductor at its maximum sag, or at its windblown swung positions. Furthermore, they no longer haveto estimate the distances between these critical conductorpositions and vegetation.
The following three points validate the value of theLiDAR/PLS-CADD combination byproviding transmission-line manage-ment that is:
● More reliable, because the riskof missing points that violate clear-ances standards are substantially elimi-nated.
● More economical, because onlyvegetation that is a violation is re-moved. This is obviously more envi-ronmentally acceptable as well.
● Safer, because there is less likeli-hood of hazardous vegetation beingoverlooked.
Additional aspects of human erroreliminated or reduced include: fatigue caused by long heli-copter flights, viewing perspective, lighting or shadow hin-drances, and difficulties of winter patrols.
The utility saves time and money by identifying areaswith vegetation to be removed prior to field inspection.Knowing exactly what needs cutting in advance has advan-tages in meetings with the public and environmental re-source agencies, and allows for better planning and moreeffective use of the field personnel involved in vegetationremoval. This is especially significant in the rough terrainand remote areas of British Columbia. Also, as roads intoand along rights-of-way are seeing increased scrutiny, aswell as environmental and regulatory opposition, practicesthat reduce reliance on ground access are beneficial.
Fig. 5. Plot of vegetation clearance violations produced directly from PLS-CADD.
The benefit of this method liesin the simple fact that
guesswork by field personnelis completely eliminated.They no longer have to
estimate the conductor at itsmaximum sag, or at its wind
blown swung positions.

Technologies Yield SuccessBC Hydro considers its pilot project to be a success. It
worked to address the issues of LiDAR survey data volumeand now has it at a manageable level. The next generationof LiDAR laser scanners and their increased pulse rates(40,000 Hz) and “multi-return” process will further increasethe accuracy and confidence of the survey data.
BC Hydro is now undertaking a similar project on the twomajor 500-kV supply lines to Vancouver Island. Last winterthe utility experienced an outage as a result of unequal iceloading bringing the conductor into contact with trees onthe right-of-way. LiDAR survey vegetation points analyzedwith PLS-CADD FE will identify trees and vegetation thatviolate flashover clearances under this unbalanced conduc-tor load condition. These can then be identified and re-moved eliminating this kind of event as a potential operat-ing concern.
With a library of transmission lines already modeled inPLS-CADD, it is easy to imagine an annual vegetationmaintenance program that uses LiDAR survey vegetationdata. Depending on the growth rates of the predominate
species, cycles for LiDAR survey could be optimally estab-lished. These might vary from three years up to possibly 10years in harsh growing environments. A growth allowancealigned with this cycle could be applied to the PLS-CADDvegetation clearance analysis. This has the potential toreduce inspection costs in the scale of hundreds of thou-sands of dollars per year in just the Vancouver Lower Main-land area alone. This would not eliminate the need forannual inspections, but it could greatly reduce them. Thissavings combined with greater reliability and increasedpublic safety make the LiDAR/PLS-CADD combo a poten-tial winner for vegetation management for some utilities. ◗
Bryan Hooper is the transmission project manager with BCHydro, where he has worked for 30 years in transmissionengineering and maintenance positions. BC Hydro is currentlyin the process of separating the transmission planning, opera-tion and maintenance functions to a separate government CrownCorp., British Columbia Transmission Corp. (BCTC). Hooperwill then work within the asset program management group ofBCTC.
Reprinted with permission from the September 2003 issue of Transmission & Distribution World.® (www.tdworld.com)Copyright 2003, PRIMEDIA Business Magazines & Media Inc. All rights reserved.
TD-67-CW
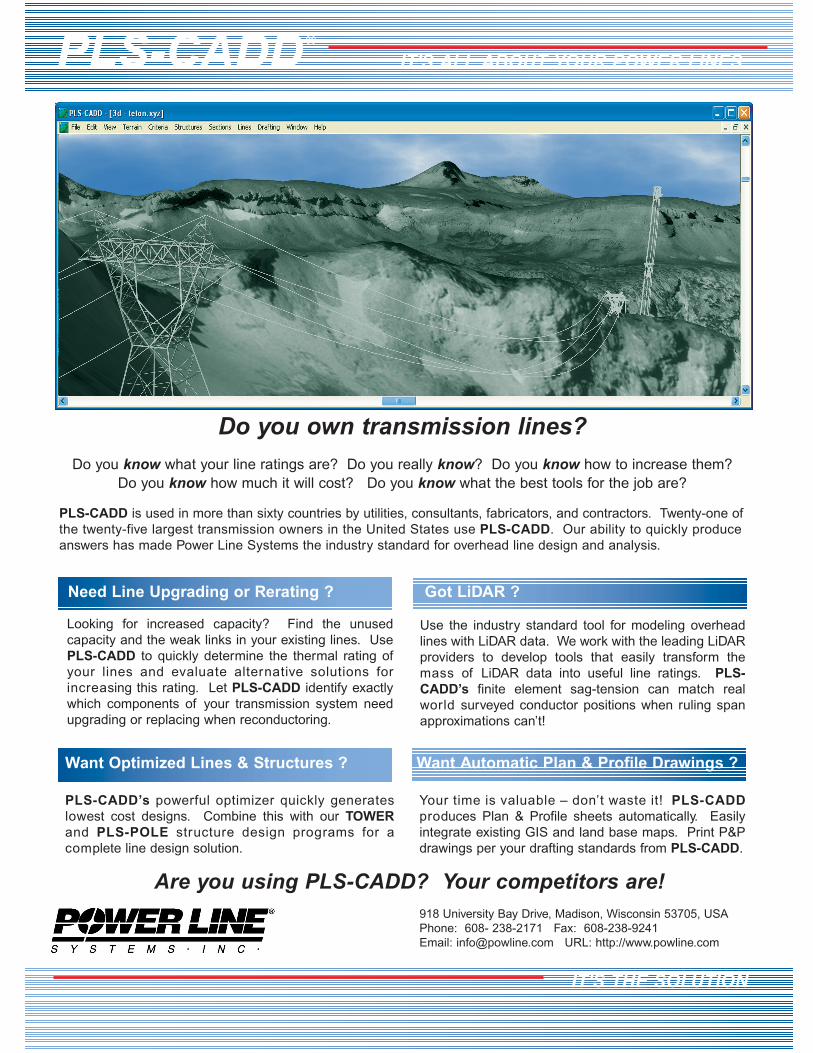
Do you own transmission lines?
Do you know what your line ratings are? Do you really know? Do you know how to increase them? Do you know how much it will cost? Do you know what the best tools for the job are?
PLS-CADD is used in more than sixty countries by utilities, consultants, fabricators, and contractors. Twenty-one ofthe twenty-five largest transmission owners in the United States use PLS-CADD. Our ability to quickly produceanswers has made Power Line Systems the industry standard for overhead line design and analysis.
Looking for increased capacity? Find the unusedcapacity and the weak links in your existing lines. UsePLS-CADD to quickly determine the thermal rating ofyour lines and evaluate alternative solutions forincreasing this rating. Let PLS-CADD identify exactlywhich components of your transmission system needupgrading or replacing when reconductoring.
Use the industry standard tool for modeling overheadlines with LiDAR data. We work with the leading LiDARproviders to develop tools that easily transform themass of LiDAR data into useful line ratings. PLS-CADD’s finite element sag-tension can match realworld surveyed conductor positions when ruling spanapproximations can’t!
PLS-CADD’s powerful optimizer quickly generateslowest cost designs. Combine this with our TOWERand PLS-POLE structure design programs for acomplete line design solution.
Your time is valuable – don’t waste it! PLS-CADDproduces Plan & Profile sheets automatically. Easilyintegrate existing GIS and land base maps. Print P&Pdrawings per your drafting standards from PLS-CADD.
918 University Bay Drive, Madison, Wisconsin 53705, USAPhone: 608- 238-2171 Fax: 608-238-9241Email: [email protected] URL: http://www.powline.com
Are you using PLS-CADD? Your competitors are!
Need Line Upgrading or Rerating ? Got LiDAR ?
Want Optimized Lines & Structures ? Want Automatic Plan & Profile Drawings ?
PLS-CADD IT'S ALL ABOUT YOUR POWER LINES
IT'S THE SOLUTION
®