vegetation and climates of the last 45,000 ifeetfs in the ... · pdf filesheep range and...
TRANSCRIPT

Vegetation and Climates of the Last 45,000 Ifeetfs in the Vicinity of the Nevada lest Site, South-Central Nevada
U.S. G EO.LQG tC A L SURVEY P H 0 F E,$ S I O'N A L P ATPE
Qn with the, .£ Department ®f Energy

Vegetation and Climates of the Last 45,000 Years in the Vicinity of the Nevada Test Site, South-Central NevadaBy W. GEOFFREY SPAULDING
U.S. GEOLOGICAL SURVEY PROFESSIONAL PAPER 1329
Prepared in cooperation with the U.S. Department of Energy
UNITED STATES GOVERNMENT PRINTING OFFICE, WASHINGTON: 1985

UNITED STATES DEPARTMENT OF THE INTERIOR
Donald Paul Hodel, Secretary
U.S. GEOLOGICAL SURVEY
Dallas L. Peck, Director
Library of Congress Cataloging in Publication DataSpaulding, W. Geoffrey.Vegetation and climates of the last 45,000 years in the vicinity of the Nevada test site, south-central Nevada.(Geological Survey professional paper ; 1329)"Prepared in cooperation with the U.S. Department of Energy."Bibliography: p.Supt. of Docs. No.: I 19.16:13291. Nevada Climate. 2. Paleoclimatology Nevada. 3. Vegetation and climate Nevada. 4.
Paleobotany Nevada. I. Title. II. Title: Nevada Test Site, south-central Nevada. III. United states. Dept. of Energy. IV.
Series. QC984.N3S63 1985 551.69793'3 84-600117
For sale by the Branch of Distribution U.S. Geological Survey 604 South Pickett Street Alexandria, VA 22304

CONTENTS
Page Abstract ........................................ 1Introduction ........... .... .... ............ 1
Objectives of study . . ........... ............ 2Location of the study area ...................... 2Regional climate ... .......... .............. 2Plant communities ..... ......... .......... 4Acknowledgments... .... .......... ^ ........ 6
Packrat-midden analysis .... .................... 6Methods ... .......... ............... ..... 7
Sampling ....... ........................ 7Analysis.... ...................... ..... 8
Modern analogs ..... .... ........... ..... 10Climatic reconstruction ......................... 15Radiocarbon dating........ .............. .... 16
The fossil record in selected areas ................... 20Periphery of Amargosa Desert ................... 20Specter Range .... .......................... 22Eleana Range ... ..................... ..... 22Early records from the Nevada Test Site ........... 23Sheep Range and Eureka Valley .................. 23Tule Springs ..... ............... ........... 23Grand Canyon .......................... .... 24
Late Quaternary vegetation and climate ............... 27Middle Wisconsin environments .................. 27
Page
Late Quaternary vegetation and climate Continued Middle Wisconsin environments Continued
45,000 to 35,000 years before present.....35,000 to 23,000 years before present
Late Wisconsin environments .... . . .....Vegetation .... ... . ... ... ...
. ..... 27
....... 30. ... .33..... 33
Climatic regime ....... .... ......... . . 36The transition period.... ... . . ........ 40
Major vegetation changes ....... ......... 40Climates of the transition period . . ........ 42
The last 8,000 years ...... .... . . . ......... 44Middle Holocene climatic variations . . .... ... 44Late Holocene fluctuations ..... ... . ..... 45
Assessing paleoenvironmental reconstructions .......... 46Accuracy of representation and general analogs . . ... 46
Elevational displacement ...... . ... ...... 46Negative evidence ......... ... .... ..... 47
Radiocarbon dating. . ... . . . .... ... ... 47Future climatic change... .... ..... . ..... .... 47
Atmospheric carbon dioxide ... ... . . .... 48The next ice age ....... . . . . ....... 48
Summary and conclusions ... .... . . ... ..... 49References cited ... ... ... ... .......... ... 52Supplemental data . . . . . .... . . ... ..... . . 57
ILLUSTRATIONS
FIGURE 1. Map showing location of study area, the Nevada Test Site and vicinity, and locationsof figures 2, 12, and 13, and other selected sites ...................... .......................... 3
2. Map showing location of Nevada Test Site and figures 4, 6, 7, and 8 . . ................................... 43. Photographs showing the Eleana Range-2 packrat midden: A, General view of external face of the midden;
B, Closeup view of sampling column ......................................................... 74. Map showing Eleana Range fossil locality ..... ................ ................................... 85. Graphs of diversity as a function of the size of samples from the Specter Range-2 packrat midden .............. 10
6-8. Maps showing:6. Specter Range and Point of Rocks fossil localities .............. ............................... 117. Owl Canyon fossil locality .................. . .............................. ............ 138. Last Chance Range fossil locality.......................... ................................ 14
9-11. Stratigraphic sketches of:9. Sample columns from the Eleana Range-3 packrat midden ....... ................................ 2010. Sample column from the Eleana Range-2 packrat midden ........................... ............ 2111. Sample column from the Specter Range-2 packrat midden ....................................... 21
12. Map showing location of packrat-midden sites in the southeastern Sheep Range ............................. 2413. Map showing location of packrat-midden sites in the western Sheep Range. ................... ............ 2514. Diagram showing age and elevational distribution of late Quaternary
packrat-midden samples from the northern Mojave Desert ....................................... 2615. Sketches of the Eleana Range fossil locality: A, Physiography of the Eleana Range-1 and -2 sites;
B, Modern vegetation at the Eleana Range-1 and -2 sites .... ................................... 2816. Sketches of reconstructions of the Wisconsin vegetation of the Eleana Range fossil locality: A, Full-glacial
(Wisconsin maximum) limber-pine woodland; B, Juniper-steppe shrub vegetation during the middle Wisconsin (about 45,000 years ago)............................................. 29
ill

IV CONTENTS
Page FIGURES 17-20. Diagrams showing:
17. Relative frequencies of selected plant taxa in macrofossil assemblages from the Eleana Range-3 midden. . 3118. Relative frequencies of selected plant taxa in macrofossil assemblages from the Specter Range-2 midden. . 3219. Distribution of juniper-shrub macrofossil assemblages of middle Wisconsin age
compared to the modern extent of similar associations in the Sheep Range ...................... 3420. Abundance of selected plant taxa in macrofossil assemblages from the Eleana Range-2 (ER-2) midden ... 35
21. Graph showing changes in similarity between Wisconsin and modern flora of the Eleana Range locality. . ..... 3622. Diagram showing current elevational range and Wisconsin fossil records of selected trees and shrubs . ... ..... 3823. Graphs showing tree-ring chronologies from two limber-pine specimens from the
Eleana Range-2 (ER-2) midden........ ........................................... ..... 4124. Diagram showing a time series of packrat-midden samples from the Eureka View locality,
northern Eureka Valley, Inyo County, California...................................... ..... 4325. Graphs showing inferred past changes in global-ice volume and modeled future trends ............. ..... 49
TABLESPage
TABLE 1. Principal plant-community types and examples of representative plant associations on rock slopes ........... 52. Dry weight and percentage composition of different size fractions of packrat-midden samples after
dissolution and washing ................................................................ 93. Comparison of key plant taxa in modern packrat-midden debris with plants in the vegetation within
30 meters of the midden site............................................................. 124. Temperature and precipitation data from six stations in Nevada...................................... 155. Estimated range of values for mean annual temperature and precipitation at four key fossil localities
in the Nevada Test Site and vicinity ...................................................... 166. Packrat-midden sites, samples, and radiocarbon dates ............................................. 187. Paleoclimatic reconstructions for the full glacial period of the American southwest ....................... 378. Estimates of minimum displacement of Utah juniper and limber pine and resultant calculations of the
full-glacial decline in summer temperatures for southern Nevada ................................ 399. Range of minimum temperature values at 39 sites presently supporting creosote bush, and estimates
of the decline in late Wisconsin winter temperatures .......................................... 3910. Summary of estimates of late Quaternary climate for the Nevada Test Site and vicinity ................... 50
TABLES 11-15. Modern packrat middens:11. Plants in a recent midden from the Owl Canyon 3 site and plants growing in three habitats
within 30 meters ............................................................... 5912. Plants in a recent midden from the Last Chance Range site and those growing within 30 meters ...... 6013. Plants in a recent midden from the Specter Range 2 site and those growing within 30 meters ......... 6114. Plants in a recent midden from the Eleana Range 3 site and those growing within 30 meters ......... 6215. Plants in recent midden debris from the Connley Hills 1 and 2 sites, and growing within
30 meters of each locality ......................................................... 6316-25. Ancient packrat middens:
16. Plants from the Owl Canyon (OC) locality................................................. 6417. Plants from the Point of Rocks (PR) 1 site ................................................ 6618. Plants from the Point of Rocks (PR) 2 and 3 sites ........................................... 6819. Plants from the Last Chance Range (LCR) 1 site ........................................... 7020. Plants from the Specter Range (Spc) 2 site ................................................ 7221. Plants from the Specter Range (Spc) 3 site ................................................ 7422. Plants from the Specter Range (Spc) 1 site ................................................ 7623. Plants from the Eleana Range (ER) 2 site ................................................. 7824. Plants from the Eleana Range (ER) 3 site ................................................. 8025. Plants from the Eureka View (EV) fossil locality ........................................... 82

CONVERSION FACTORS V
CONVERSION FACTORS
Metric units in this report may be converted to inch-pound units by using the following conversion factors:
Multiply By To obtain
centimeter (cm) 0.3937 inch (in.)gram(g) 0.03527 ounce, avoirdupois (oz)kilogram (kg) 2.205 pound (Ib)kilometer (km) 0.6214 mile (mi)kilopascal (kPa) 10 millibar (mbar)meter (m) 3.281 foot (ft)millimeter (mm) 0.03937 inch (in.)millimeter per year (mm/a) 0.03937 inch per year (in/yr)square kilometer (km2 ) 0.3861 square mile (mi2 )cubic meter (m3 ) 35.31 cubic foot (ft3 )degree Celsius (°C) °F = 9/5°C + 32 degree Fahrenheit (°F)

VI SYMBOLS
SYMBOLS AND DEFINITIONS LIST
Amberat crystalized (dehydrated) packrat urineAT arboreal taxon (taxa)14C radiocarbon, carbon-14; unstable isotope of normal
carbon-12A relative change in a given parameter (for example,
ATa, change in mean annual temperature)Extralocal a species not present in the vicinity of the site of
its fossil occurrenceExtralimital a species not known to presently occur on a moun
tain mass where it is recorded as a fossilEquable a temperature regime characterized by a limited
seasonal range of temperaturesFull glacial a widely-used synonym for the Wisconsin
maximumIS Sorensen's similarity coefficient or indexN number of identified taxaNISP number of identified specimensNIS number of taxa of trees, shrubs, and succulentsP precipitation (Pa, average annual precipitation;
Ps , average summer precipitation; Pw , average winter precipitation)
Percent P percent change from present average value of precipitation
Mesic relatively moist (mesophytic, characteristic of relatively moist habitats)
Pluvial increased rainfall exceeding present annual values by at least 50 percent
Paleonidology the study of ancient packrat middensa standard deviationT average value of temperature ( Ta, average annual
temperature; Ts , average summer temperature; Tw , average winter temperature)
Percent T percent change from present average value of temperature
Thermophile a species characteristic of sere (hot) habitats (thermophilous, with an affinity for sere habitats)
Wisconsin the period of greatest development of continental maximum ice sheets in the Northern Hemisphere, about
18,000 years agoXeric relatively dry (xerophytic, characteristic of rela
tively dry habitats)B.P. radiocarbon years before present (1950). An age
expressed in radiocarbon years before present is a statistical estimate of the remnant carbon-14 in a given sample and not directly equivalent to a sidereal or calendar year age

VEGETATION AND CLIMATES OF THE LAST 45,000 YEARS IN THE VICINITY OF THE NEVADA TEST SITE, SOUTH-CENTRAL NEVADA
By W. GEOFFREY SPAULDING
ABSTRACT
Major changes in the climate of the Nevada Test Site have occurred during the last 45,000 years. Understanding this climate variability is important in assessing the region's suitability for permanent nuclear-waste repositories. Future climatic changes probably will occur within the time the waste materials are hazardous. The nature and magnitude of previous fluctuations indicate the nature of future climatic change that may impact on a nuclear waste repository. Reconstructions of past vegetation are used to infer climatic conditions during the past 45,000 years. Plant macrofossils from ancient packrat (Neotoma spp.) middens provide the data for these analyses. Middens can be older than 50,000 years, and they are common in the region. Each contains abundant mummified plant fossils, representing the plant species growing within about 30 meters of the site. Radiocarbon-dated midden samples provide detailed records of climate-induced vegetation change.
During the Wisconsin glacial age, from at least 45,000 years ago to about 10,000 years ago, juniper (Juniperus osteosperma) woodland was widespread below elevations of 1,800 meters in the desert lowlands. Steppe shrubs were common, as were shrubs typical of the drier phases of current woodland. Late Wisconsin subalpine conifer woodland, typified by limber pine (Pinus flexilis), occurred at elevations above about 1,800 meters. Plants that are sensitive to frigid temperatures, and those restricted to moist habitats, are missing or are very rare in the glacial-age macro- fossil record.
Development of desert vegetation in the lowlands of the Nevada Test Site and vicinity had begun by about 15,000 years ago. Timing of the vegetation change from woodland to desertscrub was transgressive. At higher elevation desert sites, woodland did not disappear until after about 8,000 years ago. The earliest records of desert vegetation in the vicinity of the Nevada Test Site appear to antedate those from the Sonoran Desert by at least 4,000 years.
Climatic conditions at about 45,000 years ago at the Nevada Test Site were similar to those of northern Nevada at present. Average annual temperature was at least 2° Celsius less than that of current average annual temperature. Summers were drier and colder, and winter precipitation may have exceeded current quantities by 20 percent. By about 30,000 years ago, annual temperature may have been 3° to 6° Celsius less than present values. The trend toward maximum glacial conditions appears to have been reversed briefly several times. By about 18,000 years ago, the relative decrease in annual temperature is inferred to have been 6° to 7° Celsius. Average summer temperatures were 7° to 8° Celsius cooler than those of the present, and winter pre cipitation exceeded present quantities by as much as 70 percent. There was a relative decrease in summer rainfall, and average
annual precipitation probably did not exceed 40 percent of current quantities. Postglacial warming began as early as 16,000 years ago, and average annual temperatures probably approached present values by about 10,000 years ago. Differences exist between these paleoclimatic reconstructions and those that indicate a "pluvial" rainfall regime during the late Wisconsin. Temperatures appear to have been lower and rainfall less than the values proposed in models of an equable glaciopluvial.
Increased atmospheric carbon dioxide within the next 500 years probably will result in a 2° to 3° Celsius increase in annual temperature and intensified rainfall in the Nevada Test Site region. Analogs with previous glacial-interglacial cycles indicate that this "superinterglacial" may be no more than a relatively brief reversal in the protracted trend toward the next ice age. Current models indicate that, within the next 10,000 years, climatic conditions may be similar to those of the last glacial age.
INTRODUCTION
A fundamental challenge presented by the use of nucle ar energy is the safe, long-term disposal of both high- level and transuranic radioactive wastes. Proper storage of these materials, by-products of both commercial enter prises and nuclear weapons manufacture, requires isola tion from the biosphere for a period exceeding their hazardous duration. Estimates of this duration range from 1,000 to 100,000 years (Winograd, 1981, p. 1458; Bredehoeft and others, 1978; Interagency Review Group, 1978). Such lengths of time encompass global climatic changes greater than those that have occurred in record ed history. To assure prolonged integrity of any nuclear- waste repository, long-term environmental stability of that site needs to be considered, and impact of future climatic change needs to be anticipated.
Major global climatic changes occur at regular fre quencies of about 10,000 to 100,000 years (Mitchell, J.M., 1976; Shackleton and Opdyke, 1973; Berggren and others, 1980). Changes from glacial to interglacial intervals, and back again, are quasi-periodic. These chang es are caused by variations in net global solar-energy input, a consequence of the precession of Earth's orbit and the obliquity and eccentricity of its axial position (Imbrie and Imbrie, 1980, p. 943-944; Sergin, 1980, p.

VEGETATION AND CLIMATES OF THE LAST 45,000 YEARS, NEVADA TEST SITE
1480). Based on these findings, computer-simulated cli matic models have been devised that indicate a signifi cant probability that a new ice age will begin within the next 10,000 years (Imbrie and Imbrie, 1980, p. 949-951). The present Holocene Epoch is the last in a long series of relatively brief (7,000 to 20,000 years) interglaciations punctuating much longer (70,000 to 90,000 years) glacia- tions (Wright, 1972, p. 279-281; Broecker and Van Donk, 1970, fig. 2; Berggren and others, 1980, fig. 11). Hence, a permanent repository for nuclear waste must withstand the effects of a major climatic change that may occur well within the hazardous duration of these materials.
OBJECTIVES OF STUDY
A site in or near the Nevada Test Site in south-central Nevada (fig. 1) is being evaluated as a permanent reposi tory for both transuranic-contaminated and high-level radioactive wastes. The objective of this study is to characterize long-term climatic variability inherent to this area. Specifically, paleoenvironmental and paleo- climatic reconstructions spanning the last 45,000 years are offered to facilitate calculations of potential varia tions in water-table levels and ground-water recharge (Winograd, 1981, p. 1461; Winograd and Doty, 1980, p. 76-85). Radiocarbon-dated plant macrofossil assembl ages from ancient packrat (Neotoma spp.) middens in the Nevada Test Site and vicinity provide data for these paleoclimatic reconstructions. The uniformitarian as sumption is made that climates of the last 45,000 years approximate the climates that will occur in the next 100,000 years.
LOCATION OF THE STUDY AREA
The Nevada Test Site lies within the Basin and Range Province of western North America (Fenneman, 1931), on the southeastern margin of the physiographic Great Basin (Synder and others, 1964; Morrison, 1965) (fig. 1). With respect to flora, the site is located on the boundary of the Mojave Desert to the south and the Great Basin Desert to the north (Cronquist and others, 1972, figs. 55 and 56). Topography consists of desert valleys with rela tively high floors (exceeding 700 m) surrounded by moun tains with maximum elevations usually less than 2,100 m. Highlands of Tertiary volcanic rocks occupy much of the northern one-half of the site; while, in the south, uplands of Paleozoic carbonate rocks surround alluviated valleys. Two internally drained valleys, Yucca Flat and Frenchman Flat, are near the western boundary of the test site (fig. 2); playa elevation of Yucca Flat is 1,195 m, and playa elevation of Frenchman Flat is 939 m. Like
most valleys in southern Nevada, neither shows evi dence of having contained "pluvial" lakes of Wisconsin age (Mifflin and Wheat, 1979, p. 15).
Some ground-water flow through the Nevada Test Site originates in volcanic highlands to the north, Pahute Mesa, Timber Mountain, and Yucca Mountain. The remainder enters the site from the east as underflow within the regional lower carbonate aquifer (Winograd and Thordarson, 1975, pi. 1; Winograd and Doty, 1980, fig. 1). Flow directions beneath the eastern part of the site are south and west from the highlands to springs at Ash Meadows in the Amargosa Desert. Ash Meadows is the site of an extensive network of springs; evidence exists for somewhat greater spring activity during the Wisconsin glacial age. Fossil tufa deposits occur as high as 40 m above present ground-water level in this area (Winograd and Doty, 1980, p. 48).
REGIONAL CLIMATE
South-central Nevada is arid to semiarid; dry air mass es dominate upper air flow about 70 percent of the year. Continental polar (cool and dry) and continental tropical (warm and dry) masses are the most common. Moist maritime air (both tropical and polar) occurs with a frequency of only about 28 percent. Outbreaks of very cold and dry arctic air occur during the winter; however, these account for less than 5 percent of the air-mass type dominance through the year (Houghton and others, 1975). The study area is typified by an arid to semiarid climate, and, because evidence exists for increased effective mois ture during late Quaternary time, climatic phenomena that cause precipitation in this area are of particular interest. The Nevada Test Site receives moisture as a consequence of two basic storm types: (1) Those result ing from winter cyclonic activity; and (2) those caused by intense summer convection.
During the cold season (late autumn through early spring), southward migration of the subtropical high- pressure zone brings mid-latitude depressions to the southwestern United States. Winter precipitation results from either frontal-cyclonic (Pacific-type storms) or non- frontal cyclonic circulation (Great Basin lows) (Houghton and others, 1975, p. 14; Bell, 1979, p. 376). In both instances, the Sierra Nevada to the west (fig. 1) is a major barrier to moist air moving inland from the Pacific. Pacific-type storms are caused by fronts trailing south ward from eastward moving low-pressure cells. These lows are imbedded in prevailing westerlies; their normal track is inland from the Pacific Northwest into Canada, north of the study area (Bryson and Hare, 1974, fig. 26). However, a semipermanent low-pressure trough some times develops over the western United States and diverts

118° 117°
INTRODUCTION
116° 115° 114°
37° -^
36°
X^1j\!V
; '%/'i s -^-i<?
~i
tP
nA
%
V%
-
1 1 \V' -/1
X ,, -_. . , Boundary of / 1 Horse Th.ef Nevgda Test Figure 2
\ Hills ^- "^>. \ ^ \s~f
, ^
Eureka View
X\,
Eureka Valley \^
FuneralMountains
.^^^^~~~"lnyo Mountains
Panamint Range -~^*
¥
*
\
-v
|
\ r
\
7t
*NN\^
^\^
\
\ /^~^
V /^
^ !^J
r^^
X ^
x^ i
\--" i r\ )
i \\ r /-\ /1 /v \ \ / / / I '\ i^-' i / L Cy <
^ v/ ||_ UTAH -^ ARIZONA
Basin Canyon ^Sheep Range ^'Basin Wash / /
Figure 13 * /Sawmill CanyonNF~I; *C*** ?j ^^ Hidden Forest
L3L ^^ Figure 12
Ash Meadows \ B|ue am *nd K\ K / Rosd r -7X i\ XSpring Range \ Lower \\ G
^ ~ X Grand CanyonXl^^s// ^ year/es Lake \N V-J_/\J
EXPLANATION
6 SPRING
\ \
\ (oX^ ' s^VCjr, \^^\^ 1
V^>X J< PACKRAT-MIDDEN SITE ^»\ O5
SOUTHERN BOUNDARY OFTHE GREAT BASIN (After Cronquist and others, 1972)
voA N Ifi
^i N i1 \ 1
Base data from Defense Mapping Agency Operational Navigation Chart G-18
0 ID 20 30 40 50 MILES
0 10 20 30 40 50 KILOMETERS
FIGURE 1. Location of study area, the Nevada Test Site and vicinity, and locations of figures 2, 12, and 13, and other selected sites.
Pacific-type storms far enough south to affect the study area (Sellers and Hill, 1974, p. 16). Southern Nevada usually is south of the low-pressure center, and maritime air contributing to resultant precipitation comes from the southwest. These winds skirt the southern edge of the Sierra Nevada that lies to the west of the study area (fig. 1), although the Transverse and Peninsular Ranges south of the Sierra Nevada create a substantial rain- shadow. Maximum rain and snowfall from this type of disturbance usually occurs in western and northern Nevada (Houghton and others, 1975, p. 15).
In contrast to Pacific-type storms, Great Basin lows are non-frontal cyclonic disturbances; they are the chief source of winter precipitation in central and eastern Nevada. This type of "cut-off low" develops near the extremity of a front moving inland from the Pacific and is caused by strong thermal contrast between cold air behind the front and warmer air ahead of the disturbance
(Houghton and others, 1975, p. 16; Bell, 1979, p. 377). Great Basin lows may remain stationary over Nevada for a few days, but eventually move eastward under the influence of prevailing westerlies. Moisture-bearing winds are drawn into the area from the northwest. Although they occur less often than Pacific-type storms, Great Basin lows are important sources of winter precipitation, because the low is centered over the region and may remain for several days. Great Basin lows are most common from April to June; Pacific-type storms are more frequent between October and April (Houghton and others, 1975).
When the subtropical high-pressure belt shifts north ward during the summer, the study area is removed from the effect of mid-latitude depressions. Summer precipita tion is rarely the product of large-scale frontal activity; instead, it occurs as localized thunderstorms that are caused by intense vertical air currents over heated terrain.

VEGETATION AND CLIMATES OF THE LAST 45,000 YEARS, NEVADA TEST SITE
116°00'
Figure 6 », Specter Range
and Point of I Rocks SitesO
30'
B'5' Base from Army Map Service
Maps NJ11-8, NJ11-9,NJ 11-11, NJ 11-12
0 5 KILOMETERS
CONTOUR INTERVAL 1000 FEET DATUM IS SEA LEVEL
FIGURE 2. Location of Nevada Test Sile and figures 4,6,7, and 8 (see fig. I for the relative position of this map). Dots and numbers refer to packrat-midden sites discussed by Wells and Jorgensen (1964).
Such convection commonly is combined with orographic uplift and covergence over mountains to produce moisture- laden thunderheads (Bell, 1979, p. 381; Sellers and Hill,
1974, p. 10). At the Nevada Test Site, about 25 percent of the annual precipitation falls during the summer (June through early September, Beatley, 1976, p. 21), a small proportion compared to values greater than 50 percent for summer rainfall in the Sonoran and Chihuahuan Deserts to the southeast (Bryson and Lowry, 1955; Hales, 1974). In these southern deserts, the summer rainfall usually lasts from mid-July through early September, and results from maritime air carried inland from the Gulf of Mexico (Hales, 1974, p. 331; Bryson and Lowry, 1955, p. 339). This high-level (above 70 kPa) flow is circulation on the western edge of the subtropical anticy clone commonly called the Bermuda High. However, southern Nevada is beyond the western limit of these northwest winds (Mitchell, V.L., 1976, fig. 3; Hales, 1974, p. 334). Analyses indicate a negligible contribution of moisture from the Gulf of Mexico during the summer in western Arizona, adjacent Nevada, and California. Instead, surface low pressure that develops over heated desert terrain generates advective flow of maritime air northward from the Gulf of California and the Pacific Ocean (Hales, 1974, p. 341; Huning, 1978, p. 79). In the late summer (mid-July through mid-September), most of the precipitable water aloft in the Mojave Desert appears to originate from low-level northern flow, rather than from upper-level southeasterlies originating over the Gulf of Mexico.
Tropical storms of August through October produce a different kind of warm-season precipitation event. These low-pressure disturbances originate in the south and account for at least 25 percent of annual rainfall in the southern California deserts (Court, 1974, p. 212). Resul tant precipitation patterns differ from those produced by summer thunderstorms; tropical storms are intense cyclonic disturbances (such as hurricane Kathleen of 1976) that affect large areas. However, the majority of rain from these storms is restricted to area south of latitude 36° north (Huning, 1978, p. 83).
PLANT COMMUNITIES
Adequate reconstruction of paleoenvironments of the Nevada Test Site is in part dependent on understanding the taxonomy, ecology, and biogeography of the plant species currently in the area. Many of these were also part of the Wisconsin-age vegetation, and changes in their distribution and associations provide important clues to the climatic history of the region. Diverse topography, geology, and local climates of the Nevada Test Site combine to create a complex mosaic of plant associations. Vegetation ranges from sparse desertscrub (in the sense of Brown and others, 1979) in the lowest valleys to well-developed woodland on highlands at ele-

INTRODUCTION
vations above 2,000 m. Only shear cliffs and playa floors are devoid of plants. Even seemingly barren Paleozoic carbonate hills of the Amargosa Desert support diverse communities of widely spaced shrubs and succulents of short stature.
The botanical nomenclature used in this report follows Beatley (1976) in most instances, with exceptions after Munz (1974), Cronquist and others (1972), and Holmgren and Reveal (1966). Vegetation analyses focus on plant communities of rocky slopes near fossil packrat-midden sites. These are areas of relatively heterogeneous vege tation, where rough topography presents a variety of microhabitats for different plant species. Vegetation of such areas is not well-known because plant ecologists usually prefer study sites of uniform topography sup porting homogeneous vegetation for their purposes (Langford and Buell, 1968, p. 97; Mueller-Dombois and Ellenberg, 1974, p. 46-48). So, although principal plant-
community types recognized in this study (table 1) have direct analogs in Beatley's (1976, p. 27-72) treatment of the vegetation of the Nevada Test Site, some representa tive plant associations do not. Plants, such as matchweed (Gutierrezia microcephala) and Mohave pepperweed (Lepidium fremontii), are common dominants on rocky slopes. In contrast, some plant species that typify as sociations on alluvial fans, such as blackbrush (Coleogyne ramosissima) and desert-thorn (Menodora spinescens), are less abundant on rocky slopes. Vegetation classifica tion presented in table 1 also differs from Beatley's (1976, p. 27-72), in that "transition desert" is not recog nized as a plant-community type. Plant associations included in the "transition desert" by Beatley (1976, p. 41-52), such as those dominated by Coleogyne, Larrea- Grayia-Lycium, and Lycium-Grayia, are considered in table 1 to be representatives of Mojave desertscrub (Brown and others, 1979, p. 10).
TABLE 1. Principal plant-community types and examples of representative plant associations on rock slopes
[Classification system follows that of Brown and others (1979)]
Representative Plant Associations Distribution and Common Associates
Great Basin Conifer Woodland
Pinus monophylla-Quercus gambelii-Juniper-us osteosperma
Pinus monophylla-Artemisia tridentata-Juniperus osteosperma
Volcanic highlands in the northern test site; generally at eleva tions above 1,950 meters (such as the eastern Pahute Mesa, Timber Mountain). Associates include Artemisia tridentata, Symphoricarpos longiflorus, Purshia tridentata, and Lupinus argenteus.
Highlands at elevations above 1,770 meters; restricted to xeric habitats at elevations above 2,100 meters. Common asso ciates include Artemisia nova, Cowania mexicana, Haplo- pappus nanus, Brickellia microphylla.
Great Basin Desertscrub
Atriplex ccmescens-mixed scrub
Atriplex confertifolia-mixed scrub
The flanks of hills and rocky mesas, usually of volcanic sub strate; at elevations from about 1,500 to 2,000 meters. Common associates are usually Great Basin desertscrub species such as Chrysothamnus nauseosus, C. viscidiflorus, Ephedra viridis, Tetradymia canescens, Artemisia nova.
On limestone and dolomite slopes; at elevations from about 850 to 1,700 meters. Common associates are usually Mojave Desert shrubs such as Amphipappus fremontii, Ephedra torreyana, Larrea divaricata, Gutierrezia microcephala.
Mojave Desertscrub
Lepidium /Vemontu-mixed scrub
Gutierrezia microcephala-mixed scrub
Ambrosia dumosa-Larrea divaricata
On the talus slopes and ridges of calcareous mountains; at elevations from about 1,050 to 1,700 meters. Associates in clude a diverse complement of upper elevation Mojave desertscrub species such as Coleogyne ramosissima, Ephedra torreyana, Buddleja utahensis, and Lycium andersonii.
Talus slopes, cliff bases, and ridges; generally at elevations below 1,400 meters on calcareous substrates. Common asso ciates include Larrea divaricata, Ambrosia dumosa, Ephedra spp., Amphipappus fremontii, Lycium pallidum.
On talus slopes, ridges, and mesas; generally at elevations below 1,200 meters. Normally occurring with lower-elevation Mojave Desert species such as Peucephyllum schottii, Eucnide urens, Gutierrezia microcephala, Echinocactus poly- cephalus. Atriplex confertifolia is common at some sites.

6 VEGETATION AND CLIMATES OF THE LAST 45,000 YEARS, NEVADA TEST SITE
Plant associations classified as Great Basin conifer woodland are distinguished by dominance of single-needle piny on pine (Pinus monophylla) and Utah juniper (Juniperus osteosperma). In south-central Nevada, these pygmy conifer communities are restricted to elevations above 1,800 m. Dominant plant taxa in Great Basin desertscrub communities are those with northern floris- tic affinities, such as shadscale (Atriplex confertifolia) (Billings, 1949). These desertscrub associations usually occur below woodland, but above Mojave Desert vegeta tion. The plant species typical of lower elevation Mojave desertscrub vegetation, like creosote bush (Larrea divaricata) and white bursage (Ambrosia dumosa), have their center of distribution south of the Nevada Test Site. Exceptions include plant associations dominated by species endemic to the northern Mojave Desert, such as Shockley's boxthorn (Lycium shockleyi) and Bailey's greasewood (Sarcobatus vermiculatus var. baileyi). Many Mojave desertscrub species are at the northern limits of their distribution in the vicinity of the Nevada Test Site, and most are restricted to elevations below 1,800 m.
ACKNOWLEDGMENTS
Research for this study was done at the College of Forest Resources, University of Washington, and at the Civil Effects Testing Operations laboratory, Mercury, Nevada from 1979 to 1981. The counsel and assistance of Hans Claassen, Gary Dixon, Estella Leopold, Gene Rush, Fiorenzo Ugolini, Bill Wilson, and Ike Winograd are gratefully acknowledged. Deborah Naslund and Karen Haffnieter provided invaluable assistance in the field and laboratory. Radiocarbon dating was done by Steve Robinson at the U.S. Geological Survey, Menlo Park, facility and by Chris Radnell and Austin Long at the Laboratory of Isotope Geochemistry, University of Arizona, Tucson, Arizona. Sketches of the ice-age vegeta tion of the Eleana Range were done by Fred Paillet. Others who have aided in this research include Tom Ackerman, Ken Cole, Gene Doty, Phil Medica, Auda Morrow, Lonnie Pippin, Vera Markgraf, Peter Mehringer, Susan Spaulding, Bob Thompson, and Tom Van Devender.
PACKRAT-MIDDEN ANALYSIS
Comprehensive paleoenvironmental reconstruction depends on a reliable source of fossils. In temperate regions, our knowledge of late Quaternary climates is based primarily on organic remains preserved in lakes and bogs. However, sedimentary basins in arid regions usually do not provide well-preserved fossil remains, and other sources of information are required. In the early 1960's, a new paleoecological tool was introduced, analy sis of packrat middens or paleonidology (Wells and
Jorgensen, 1964; Wells, 1976; Spaulding, 1977, p. 3), and its use has provided novel insights into the late Quaterna ry environments of western North America. Paleonidology is the reconstruction of past vegetation from plant remains preserved in middens deposited in rock cavities by crice- tid rodents of the genus Neotoma (packrats, woodrats, trade-rats, or go-atters).
All species of Neotoma share an acquisitive behavioral trait and construct houses or dens from plant debris collected nearby (Finley, 1958; Wells, 1976). Functional ly specific areas within a packrat den include nest chambers, food caches, and trash middens (Van Devender, 1973, p. 7-9). Plant debris from trash middens are the focus of this study. Middens contain primarily fecal pel lets and plant remains in the form of shredded fibers, twigs, seeds, leaves, and flowers. Currently active mid dens are loose debris piles, while ancient middens are usually masses solidified by dehydrated urine. Middens often serve as urination points, and cementation is caused by saturation with urine which, upon drying, encases the refuse in a cohesive, crystalline mass. Crystallized packrat urine, called amberat, is hygroscopic and rehydrates during infrequent periods of high humidity. Capillary action draws rehydrated amberat to any fresh break on an indurated midden, where it then will dry and re- crystallize. Within a few months, new breaks on ancient middens are sealed by a shiny layer of recently active amberat. Such surfaces are sticky whenever it is humid; in time, they incorporate dust and debris to become lusterless rinds that are no longer subject to rehydration. Hence, indurated packrat middens are self-sealing, with typically convoluted rinds that vary in thickness from a few millimeters to several centimeters (see figs. 3 and 4 for views of the Eleana Range-2 midden).
Although the properties of amberat augment longevi ty of indurated middens, mummification is the prime means of preservation. Middens must be sheltered from rain in a cave or beneath a rock overhang to be preserved. Decomposition is rare in well-sheltered middens. Mid dens from exposed sites are degraded and of a "punky" consistency, with most of the amberat leached out by repeated wetting. Extensive termite damage is common in such samples. However, given adequate shelter, plant fossils from middens remain well preserved. Some are more than 50,000 years old and are among the oldest fossils preserved by mummification.
In most instances, 80 to 95 percent of the mass of an indurated packrat midden is soluble urine and particles less than 0.85 mm in size (table 2). Most of the remaining 5 to 20 percent is composed of fecal pellets and plant debris. Identifiable plant remains normally comprise much less than 10 percent of the mass of an indurated midden, although they commonly number into the thousands per kilogram of unprocessed midden.

PACKRAT-MIDDEN ANALYSIS
FIGURE 3. The Eleana Range-2 packrat midden: A. General view of the external face of the midden; the rod at the top left of the midden is graduated in inches; B. Closeup view of the sampling column after removal of the weathering rind; nails are at 10-centimeter intervals; see figure 4 for the location of the Eleana Range-2 midden site.
METHODS
Paleonidology is a new scientific discipline with few established guidelines and few standardized methods. The first time series of macrofossil assemblages from single localities only were described in 1980 and 1981 (Spaulding, 1980; Betancourt and Van Devender, 1981; Mead and Phillips, 1981). Therefore, a secondary objec tive of this study is to develop techniques that increase the resolution of inferences drawn from midden analysis and to test some assumptions of the discipline.
SAMPLING
Packrat middens occur in a great variety of sizes, shapes, and situations within a rock cavity. Guidelines for site and sample selection were devised to minimize the chances of collecting contaminated samples (those containing plant fossils of more than one radiocarbon age). Deposits in vertical fissures were not collected, because different-age debris falling from above may be incorporated into a midden. Middens displaying jum bled stratigraphy were rejected, including most of those that were not well-consolidated. Using these criteria, about one-half the indurated middens located were collected, and about two-thirds of those were chosen for detailed analysis.
Most indurated Neotoma middens are less than 0.5 m3 in volume and provide samples from only a narrow span of radiocarbon time. However, larger deposits do exist; the volume of some exceed 4 m3 . A series of macrofossil assemblages from such a large deposit may span more than 10,000 years and is more useful for paleoclimatic reconstruction than one or two samples from many isolat ed sites. Hence, priority was given to locating and collect ing those rare, large middens.
A midden judged suitable for analysis is first sketched and photographed. A vertical section of weathering rind is then removed; the exposed stratigraphy is sketched, and the position of samples to be taken is noted. A variety of chisels, wedges, and pry-bars are used to remove discrete blocks from the indurated mass. Ancient middens characteristically contain many minor laminae; major stratigraphic boundaries ususally are marked by interbedded weathering rinds. Midden sampling is facili tated by their tendency to split along the bedding planes defined by laminae. After removal, samples are placed in plastic bags. These bags are then wrapped tightly with masking tape (to avoid fracturing during transport) and labelled.
VEGETATION AND CLIMATES OF THE LAST 45,000 YEARS, NEVADA TEST SITE
37°
07 30"
Base from US. Geological Survey Tippipah Spring, Rainier Mesa, Ammonia Tanks, and Buckboard Mesa 7 1/z minute quadrangles
0 1 MILE
0 1 KILOMETER
CONTOUR INTERVAL 100 FEET DATUM IS SEA LEVEL
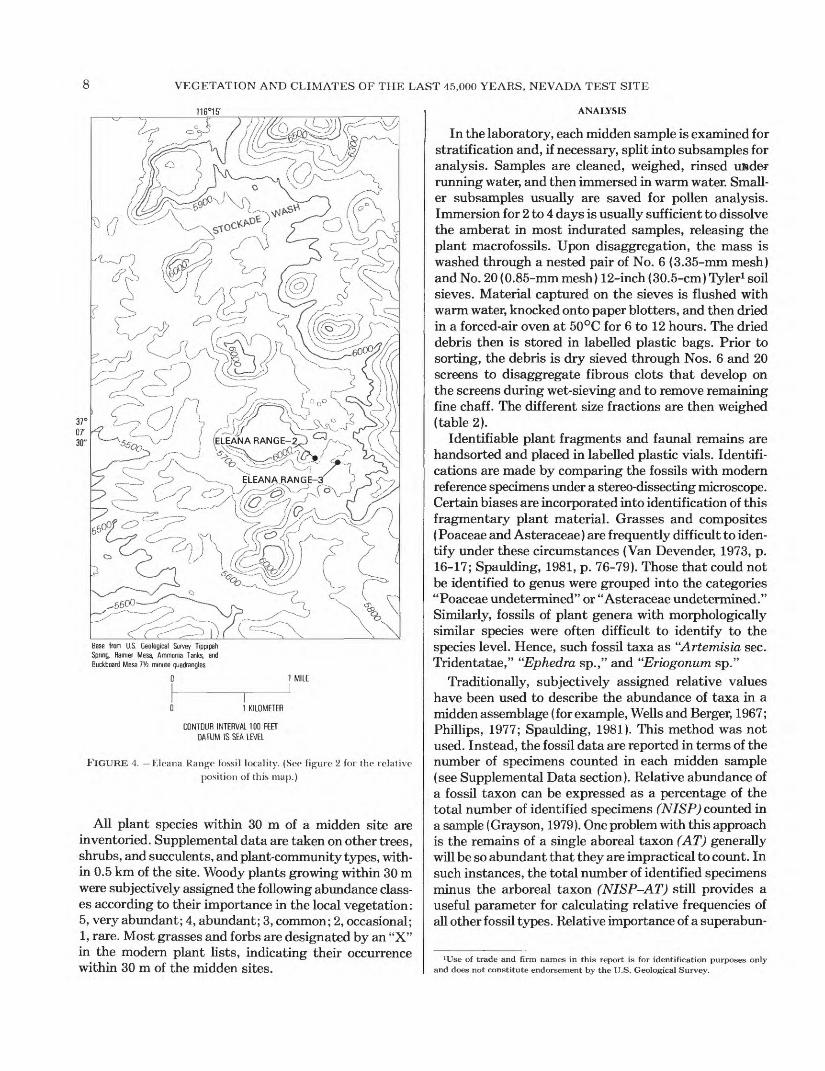
FIGURE 4. Eleana Range fossil locality. (Sec figure 2 for the relative
position of this map.)
All plant species within 30 m of a midden site are inventoried. Supplemental data are taken on other trees, shrubs, and succulents, and plant-community types, with in 0.5 km of the site. Woody plants growing within 30 m were subjectively assigned the following abundance class es according to their importance in the local vegetation: 5, very abundant; 4, abundant; 3, common; 2, occasional; 1, rare. Most grasses and forbs are designated by an "X" in the modern plant lists, indicating their occurrence within 30 m of the midden sites.
ANALYSIS
In the laboratory, each midden sample is examined for stratification and, if necessary, split into subsamples for analysis. Samples are cleaned, weighed, rinsed ufcder running water, and then immersed in warm water. Small er subsamples usually are saved for pollen analysis. Immersion for 2 to 4 days is usually sufficient to dissolve the amberat in most indurated samples, releasing the plant macrofossils. Upon disaggregation, the mass is washed through a nested pair of No. 6 (3.35-mm mesh) and No. 20 (0.85-mm mesh) 12-inch (30.5-cm) Tyler1 soil sieves. Material captured on the sieves is flushed with warm water, knocked onto paper blotters, and then dried in a forced-air oven at 50°C for 6 to 12 hours. The dried debris then is stored in labelled plastic bags. Prior to sorting, the debris is dry sieved through Nos. 6 and 20 screens to disaggregate fibrous clots that develop on the screens during wet-sieving and to remove remaining fine chaff. The different size fractions are then weighed (table 2).
Identifiable plant fragments and faunal remains are handsorted and placed in labelled plastic vials. Identifi cations are made by comparing the fossils with modern reference specimens under a stereo-dissecting microscope. Certain biases are incorporated into identification of this fragmentary plant material. Grasses and composites (Poaceae and Asteraceae) are frequently difficult to iden tify under these circumstances (Van Devender, 1973, p. 16-17; Spaulding, 1981, p. 76-79). Those that could not be identified to genus were grouped into the categories "Poaceae undetermined" or "Asteraceae undetermined." Similarly, fossils of plant genera with morphologically similar species were often difficult to identify to the species level. Hence, such fossil taxa as "Artemisia sec. Tridentatae," "Ephedra sp.," and "Eriogonum sp."
Traditionally, subjectively assigned relative values have been used to describe the abundance of taxa in a midden assemblage (for example, Wells and Berger, 1967; Phillips, 1977; Spaulding, 1981). This method was not used. Instead, the fossil data are reported in terms of the number of specimens counted in each midden sample (see Supplemental Data section). Relative abundance of a fossil taxon can be expressed as a percentage of the total number of identified specimens (NISP) counted in a sample (Grayson, 1979). One problem with this approach is the remains of a single aboreal taxon (AT) generally will be so abundant that they are impractical to count. In such instances, the total number of identified specimens minus the arboreal taxon (NISP-AT) still provides a useful parameter for calculating relative frequencies of all other fossil types. Relative importance of a superabun-
JUse of trade and firm names in this report is for identification purposes only and does not constitute endorsement by the U.S. Geological Survey.

PACKRAT-MIDDEN ANALYSIS 9
TABLE 2. Dry weight and percentage composition of different size fractions of packrat-midden samples after dissolution and washing [Wtw, sum of weight of the 3.35-millimeter and 3.35 0.85-millimeter fractions; Wti, initial weight of sample; ER, Eleana Range; Spc, Specter Range; PR, Point of Rocks;
OC. Owl Canyon; LCR Last Chance Range]
Site and sample
no.
ER-2(1)ER-2(2)ER-2(3)ER-214)ER-2(5)ER-2(6)ER-2(7)ER-2(9)ER-2(10)
ER-2(11)ER-3(2)ER-3(3)ER-3(4)ER-3(6)ER-3(7)ER-3(8)2ER-3(8)3ER-3(9)ER-3(10)
Spc-l(l)Spc-l(2)
Spc-2(2)iSpc-2(2>2Spc-2(3)Spc-2(6)Spc-2(8)Spc-2(10)Spc-2(llhSpc-2(ll) 2Spc-2(12)
Spc-3 A( 1 )Spc-3A(2)Spc-3B
PR-l(l)PR-K3)PR-2(2)PR-2(3)PR-3
OC-2(1)OC-2(3)OC-3U)OC-3(2)
LCR-K2)LCR-K3)
Initial weight (grams)
437501460778903
1,545798
1,1551,826
937937667
1,4981,4301,3271,2702,522
615689
635524
374994991758513206289933934
1,171808567
880629699
1,000712
345588755730
382462
Weight of recovered material (grams) for the indicated size fractions (millimeters) below
3.35
18.632.153.235.237.892.264.158.558.4
18.774.954.1
165.177.0
120.589.0
221.546.227.2
110.0161.0
29.8104.038.814.434.5
6.655.071.022.0
21.926.711.2
26.241.523.670.9
9.3
15.036.2
6.920.0
8.917.6
3.35--0.85
25.526.122.536.728.8
108.345.854.6
112.1
48.832.743.071.549.271.058.2
112.136.035.6
47.048.0
28.060.057.416.626.312.932.013.047.1
53.951.630.9
30.127.322.640.150.1
22.937.217.518.1
12.028.0
1 ,0.85
4.26.15.78.84.4
22.711.015.141.3
14.717.321.238.520.327.030.675.720.216.6
10.09.0
7.111.015.417.212.25.24.0
13.013.9
10.613.8
7.5
12.112.49.2
17.721.4
10.612.5
4.27.1
3.612.7
Wtw
44.158.275.771.966.6
200.5109.9113.1170.5
67.5107.697.1
236.6126.2191.5147.2333.6
82.262.8
157.0209.0
57.8164.096.261.060.819.587.0
151.069.1
75.878.342.1
56.368.846.2
111.059.4
37.973.424.438.1
20.945.6
Wtw 7^ xlOO Wti(percent!
10.111.616.59.27.4
13.013.89.89.3
7.211.514.615.88.8
14.411.613.213.4
9.1
24.739.9
15.516.5
9.78.0
11.99.5
30.116.27.4
6.59.77.4
6.410.96.6
11.18.3
11.012.5
3.25.2
5.59.9
'Dry sieve only.
dant fossil type can be expressed as a concentration value. Preliminary analyses indicate that a useful parame ter is the ratio of the weight of the fossils of a superabun dant species to the weight of the sorted midden sample (all identifiable macrofossils and fecal pellets removed).
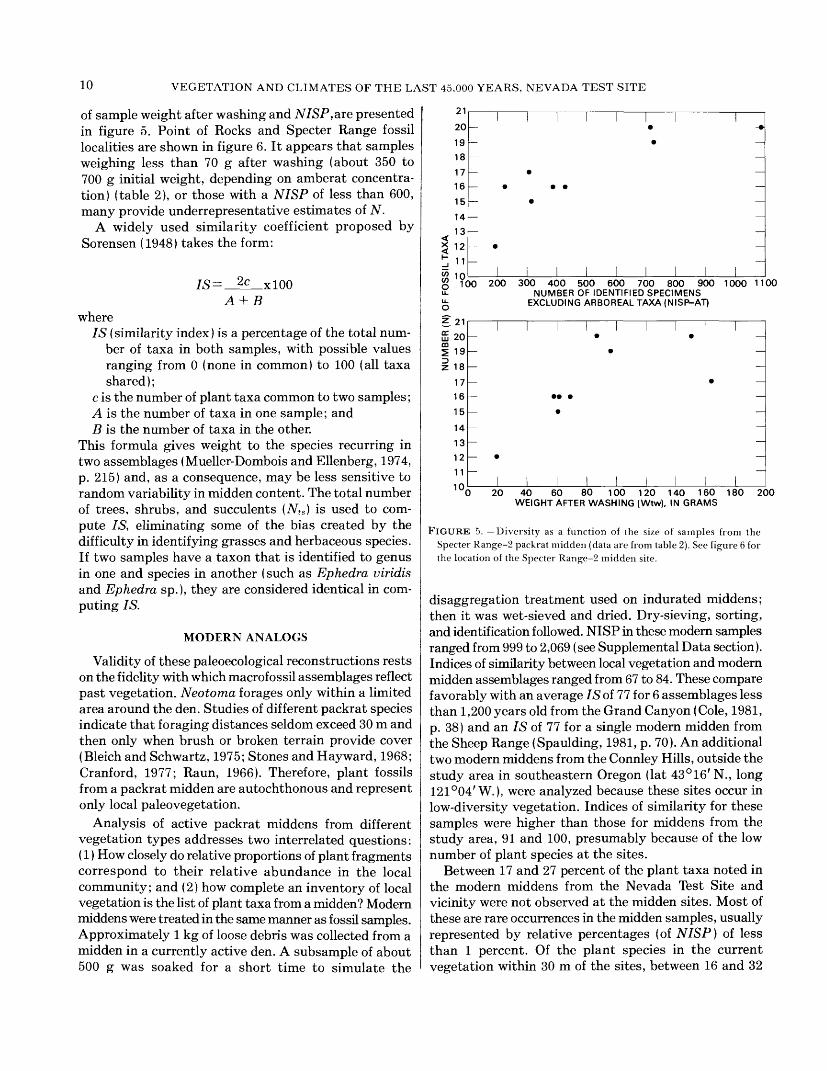
In this study, NISP counted in single assemblages ranges from 192 to 2,674. A minimum number of 1,000 identified specimens was counted whenever possible. Variations in the number of identified plant taxa (N) in samples from the Specter Range-2 midden, as functions
10 VEGETATION AND CLIMATES OF THE LAST 45,000 YEARS, NEVADA TEST SITE
of sample weight after washing and NISP, are presented in figure 5. Point of Rocks and Specter Range fossil localities are shown in figure 6. It appears that samples weighing less than 70 g after washing (about 350 to 700 g initial weight, depending on amberat concentra tion) (table 2), or those with a NISP of less than 600, many provide underrepresentative estimates of N.
A widely used similarity coefficient proposed by Sorensen (1948) takes the form:
A + B where
IS ( similarity index ) is a percentage of the total num ber of taxa in both samples, with possible values ranging from 0 (none in common) to 100 (all taxa shared);
c is the number of plant taxa common to two samples;A is the number of taxa in one sample; andB is the number of taxa in the other.
This formula gives weight to the species recurring in two assemblages (Mueller-Dombois and Ellenberg, 1974, p. 215) and, as a consequence, may be less sensitive to random variability in midden content. The total number of trees, shrubs, and succulents (Nts ) is used to com pute IS, eliminating some of the bias created by the difficulty in identifying grasses and herbaceous species. If two samples have a taxon that is identified to genus in one and species in another (such as Ephedra viridis and Ephedra sp.), they are considered identical in com puting IS.
MODERN ANALOGS
Validity of these paleoecological reconstructions rests on the fidelity with which macrof ossil assemblages reflect past vegetation. Neotoma forages only within a limited area around the den. Studies of different packrat species indicate that foraging distances seldom exceed 30 m and then only when brush or broken terrain provide cover (Bleich and Schwartz, 1975; Stones and Hayward, 1968; Cranford, 1977; Raun, 1966). Therefore, plant fossils from a packrat midden are autochthonous and represent only local paleovegetation.
Analysis of active packrat middens from different vegetation types addresses two interrelated questions: ( 1 ) How closely do relative proportions of plant fragments correspond to their relative abundance in the local community; and (2) how complete an inventory of local vegetation is the list of plant taxa from a midden? Modern middens were treated in the same manner as fossil samples. Approximately 1 kg of loose debris was collected from a midden in a currently active den. A subsample of about 500 g was soaked for a short time to simulate the
21,
20-
19 -
18
17
16
I 5
14
3 13 ~$12-
d 11 -05 1Q __
8 ?ooli_
LL. O
H 21
£ 20
119
118
1716
15
14
13
12II
200 300 400 500 600 700 800 900 1000 1100NUMBER OF IDENTIFIED SPECIMENS
EXCLUDING ARBOREAL TAXA (NISP-AT)
1020 40 60 80 100 120 140 160 180 200
WEIGHT AFTER WASHING (Wtw), IN GRAMS
FIGURE 5. Diversity as a function of the size of samples from the Specter Range-2 packrat midden (data are from table 2). See figure 6 for the location of the Specter Range-2 midden site.
disaggregation treatment used on indurated middens; then it was wet-sieved and dried. Dry-sieving, sorting, and identification followed. NISP in these modern samples ranged from 999 to 2,069 (see Supplemental Data section). Indices of similarity between local vegetation and modern midden assemblages ranged from 67 to 84. These compare favorably with an average IS of 77 for 6 assemblages less than 1,200 years old from the Grand Canyon (Cole, 1981, p. 38) and an IS of 77 for a single modern midden from the Sheep Range (Spaulding, 1981, p. 70). An additional two modern middens from the Connley Hills, outside the study area in southeastern Oregon (lat 43° 16' N., long 121°04' W.), were analyzed because these sites occur in low-diversity vegetation. Indices of similarity for these samples were higher than those for middens from the study area, 91 and 100, presumably because of the low number of plant species at the sites.
Between 17 and 27 percent of the plant taxa noted in the modern middens from the Nevada Test Site and vicinity were not observed at the midden sites. Most of these are rare occurrences in the midden samples, usually represented by relative percentages (of NISP) of less than 1 percent. Of the plant species in the current vegetation within 30 m of the sites, between 16 and 32

PACKRAT-MIDDEN ANALYSIS
07'30"
11
Base from U S. Geological Survey Specter Range 15 minute quadrangle
5 MILES
0 1
CONTOUR INTERVAL 200 FEET DATUM IS SEA LEVEL
FIGURE 6. Specter Range and Point of Rocks fossil localities (see figure 2 for the location of this map).
percent (excluding the Connley Hills samples) were not found in the modern midden debris. Again, most of these species are rare at the site today; none are common or abundant.
An array of the common species in the modern plant associations and active packrat middens is presented in table 3. The Owl Canyon-3 (fig. 7), Last Chance Range- 1 (fig. 8), and Specter Range-2 (fig. 6) sites support Mojave desertscrub vegetation. The Eleana Range-3 (fig. 4)
and Connley Hills-1 sites are at transitions from Great Basin desertscrub to woodland; Connley Hills-2 is in an open juniper woodland. As mentioned previously, local vegetation of the Connley Hills sites is of low diversity ( JVfS = 5). Modern middens at this locality provide a con trast with those from sites supporting relatively diverse vegetation in southern Nevada (Ms = 14 to 19).
Differences occur between observed abundance of plant species in modern vegetation and their frequency in

12 VEGETATION AND CLIMATES OF THE LAST 45,000 YEARS, NEVADA TEST SITE
TABLE 3. Comparison of key plant taxa in modern packrat-midden debris with plants in the vegetationwithin 30 meters of the midden site
[See tables 11-15 in Supplemental Data section for a complete list of the plant species involved at each site; %, percent; NISP. number of identified specimens]
Current vegetation (relative abundance)
Site
Owl Canyon-3
Last ChanceRange- 1
Specter Range-2
Eleana Range-3
Connley Hills- 1
Abundant (4-5)
Ambrosiadumosa
Gutierreziamicrocephala
Ambrosiadumosa
Larreadivaricata
Atriplexcanescens
Artemisiatridentata
Chrysothamnusnauseosus
Common (3)
Eucnideurens
Peucephyllumschottii
Pleurocoronispluriseta
Atriplexconfertifolia
Bromus rubens
Buddlejautahensis
Eucnide urens
Atriplexconfertifolia
Ephedratorreyana
Eriogonumheermannii
Gutierreziamicrocephala
Prunusfasciculata
Scopulophilarixfordii
Stipa arida
Artemisiatridentata
Stipa sp.
Ephedra viridis
Poaceae undet.
Occasional (2)
Echinocactuspolycephalus
Gutierreziamicrocephala
Nicotianatrigonophylla
Stipa arida
Brickelliawatsonii
Buddlejautahensis
Artemisia nova
Haplopappusnanus
Pinusmonophylla
Symphoricar-pos longiflorus
Juniperusosteosperma
Bromustectorum
Abundant ( >20 percent)
Larreadivaricata(37%)
Gutierreziamicrocephala(22%)
Larreadivaricata(46%)
Atriplexconfertifolia(42%)
Ephedratorreyana(21%)
Atriplexcanescens(39%)
Poaceae undet.(56%)
Juniperusoccidentals(27%)
Recent midden (percent of NISP)
Common 5<20 percent)
Linanthus sp.(8%)
Eucnide urens(6%)
Atriplexconfertifolia(12%)
Ambrosiadumosa (8%)
Eucnide urens(5%)
Scopulophilarixfordii(12%)
Prunusfasciculata(8%)
Poaceae undet.(18%)
Cowaniamexicana(15%)
Pinusmonophylla(8%)
Juniperusosteosperma(7%)
Chysothamnussp. (9%)
Occasional (2s 5 percent)
Cryptantha sp.(4%)
Peucephyllumschottii(3%)
Ambrosiadumosa (3%)
Aristidasp. (2%)
Mortoniautahensis(4%)
Ephedra sp.(3%)
Buddlejautahensis (3%)
Brickelliadesertorum(2%)
Buddlejautahensis(2%)
Poaceae undet.(2%)
Oryzopsishymenoides(3%)
Artemisia sec.Tridentatae
Chrysothamnusnauseosus (2%)
Bromustectorum (2%)

PACKRAT-MIDDEN ANALYSIS 13
TABLE 3. Comparison of key plant taxa in modern packrat-midden debris with plants in the vegetationwithin 30 meters of the midden site Continued
|See tables 11-15 in Supplemental Data section for a complete list of the plant species involved at each site; %, percent; NISP, number of identified specimens)
Current vegetation(relative abundance)
Site Abundant (4-5) Common (3)
Connley Hills-2 Crysothamnus Artemisianauseosus tridentata
Bromustectorum
Juniperusoccidentalis
AbundantOccasional (2) ( 20 percent)
Poaceae undet. Juniperusoccidentalis(58%)
Recent midden(percent of NISP)
Common5<20 percent)
Chrysothamnusnauseosus(13%)
Poaceae undet.(9%)
Artemisiatridentata(8%)
Sysimbrium sp.(5%)
Occasional(2^5 percent)
Chenopodiumcf. botrys (3%)
Chrysothamnussp.
116°12'30"
Amargosa Flat Th minute quadrangle
1MILE
1 KILOMETERCONTOUR INTERVAL 200 FEET
DATUM IS SEA LEVEL
FIGURE 7. Owl Canyon fossil locality. See (fig. 2 for the location of this map; position of the Owl Canyon-1 site is approximate.)
midden assemblage (table 3). Those species rated as common or abundant in modern vegetation (relative abundance values of 3 to 5) are not always common or abundant (relative frequencies > 5 percent) in modern
midden assemblages. Some shrubby Asteraceae appear underrepresented; however, there are exceptions, such as the abundance of Gutierrezia microcephala in the Owl Canyon-3 assemblage (table 3). Larrea divaricata appears over-represented in the Owl Canyon-3 midden, as does Juniperus in both modern assemblages from the Connley Hills. However, Larrea appears proportionately repre sented in the Last Chance Range-1 assemblages, as does Juniperus in the Eleana Range-3 sample. The Connley Hills-1 midden is of particular interest. The nearest junipers are at the woodland border, about 28 m from the rock shelter containing the midden, and there are none in the Chrysothamnus-dorrimated association nearer the site. Nevertheless, juniper twigs and seeds comprise 27 percent of identified plant debris from the midden.
These data indicate that, in general, cacti are not disproportionately abundant in the packrat middens sampled. Pricklypear (Opuntia erinacea) occurs in the vicinity of Eleana Range-3, and barrel cactus (Echino- cactus polycephalus) grows close to the Owl Canyon-3, Specter Range-2, and Last Chance Range-1 sites. Neither species is well-represented in those respective middens. Nor is the beavertail pricklypear (Opuntia basiliaris) (armed with many small spines) well-represented in the Owl Canyon-3 or Last Chance Range-1 assemblages.
Limber pine (Pinus flexilis) macrofossils occur as contaminants in recent midden debris from the Eleana Range-3 site. These three needle-fragments probably came from the large Pleistocene midden less than 2 m away, pieces of which litter the floor of the rock shelter. As both Cole (1981, p. 58-60) and Phillips (1977, p. 36) note, older material may contaminate a younger midden. However, recognizable contaminants of Wisconsin age (such as juniper twigs) were not found in recent midden debris from the Owl Canyon-3, Last Chance Range-1, or Specter Range-2 sites, even though each of these shelters also contains an ancient midden.
In summary, it appears the important plant species in

14 VEGETATION AND CLIMATES OF THE LAST 45,000 YEARS, NEVADA TEST SITE
36°1 7'30'
36°15'Base from U.S Geological Survey High Peak Th minute quadrangle
1MILE
1 KILOMETER
CONTOUR INTERVAL 200 FEETWITH SUPPLEMENTARY
100-FOOT CONTOURS (DASHED)DATUM IS SEA LEVEL
FIGURE 8. Last Chance Range fossil locality. (See fig. 2 for the location of this map.)
the vegetation are not always important constituents of modern packrat debris piles. However, the inverse of this observation is not necessarily true. The abundant taxa in the middens are usually common consituents of the
surrounding vegetation. Variations in proportionality appear to include bias both for and against individual plant species. Invariably there seem to be several species present in the modern vegetation that are not observed

PACKRAT-MIDDEN ANALYSIS 15
TABLE 4. Temperature and precipitation data from six stations in Nevada[Data from U.S. Weather Bureau, 1965, and Environmental Data Service, 1961-78. Abbreviations for vegetation types are: Gds, Great Basin desertscrub; Mds, Mojave
desertscrub; wd. pinyon-juniper woodland, m, meter; mm, millimeter; °C, degrees Celsius]
Station ( vegetation ) ...
North latitude; west longitude . Elevation (m) . . . . Parameter . . ...
1931-60 1961-78.
Station (vegetation) . . .
North latitude; west longitude Elevation (m) Temperature and precipitation .
parameter ... ... ....
1931-60. . . ..........1961-78 . ........
Beatty(Mds)37°00'; 116°43'
1,082 Average Average
temperature precipi- (°C) tation
(mm)Jan
uary July Annual
5.2 26.3 15.0 134.6 116 116 19 117
Austin (wd)39°30'; 117°05'
2,014 Average Average
temperature precipi- (°C) tation
(mm)
Jan
uary July Annual . -1.3 21.1 8.6 302.3. -.8 21.4 8.6 364.9
117 117 114
Winnemucca (Gds)40°54'; 117°48'
1,311 Average Average
temperature precipi- (°C) tation
(mm)
Jan
uary July Annual -2.1 21.7 8.8 -1.2 22.3 9.4
117
Eureka (wd)
215.1 205.4 117
39°31'; 115°58'
1,994 Average Average
temperature precipi- (°C) tation
(mm)
Jan
uary July Annual
-2.1 21.0 8.0 J 14 114 U4
348.6 i 14
Elko(Gds)40°50'; 115°47'
1,547 Average Average
temperature precipi- (°C) tation
(mm)
Jan
uary July Annual -4.9 20.8 7.4 -3.9 21.2 7.9
Ely (wd/Gds
248.4 254.4
)39°17'; 114°51 r
1,906 Average Average
temperature precipi- (°C) tation
(mm)
Jan
uary July Annual -5.6 19.7 6.8 -4.9 19.7 6.8
221.0 244.7
'Number of years of record (1961-78) if less than 18.
in the midden debris, and several species in the midden that are not found within the arbitrary 30-m foraging radius. The practical upper limit of Sorensen's (1948) similarity indices between middens and contemporary vegetation appears to be about 85 percent where plant communities are reasonably diverse (more than 15 woody species within a 30-m radius).
CLIMATIC RECONSTRUCTION
Inferences of past climate are made from plant fossils and are based on the premise that there have been no significant changes in environmental requirements of these species during the last 50,000 years. There is abundant evidence for stability in the morphology of the species used as climatic indicators; however, the hypo thesis that genotypes are stable over such time periods is untestable. This study presents quantitative climatic reconstructions based on changes in plant-species distri bution and comparisons between estimated climate considered necessary to support a given fossil-plant association and climate that currently exists at that site. Two sources of modern climatic data are used. The first source is data collected by Beatley (1974, 1976) for the express purpose of delimiting climatic variables respon sible for present vegetation distribution in the Nevada Test Site. The second source is U.S. Weather Bureau
records of precipitation and temperature for six selected stations in Nevada (table 4). Four stations (Beatty, Eureka, Ely, and Austin) are in upland settings rather than near valley bottoms; the environment at these sites is more comparable to that of upland fossil sites. The two data sets are not directly comparable because the instrument stations used by Beatley (1974, p. 250) were at plant level (30 cm), and of different design than those of the U.S. Weather Bureau (at 1.5-m height). Temperature values presented by Beatley (1974, p. 250) are obtained from maximum-minimum thermometers; mean values are derived by averaging extreme temperatures recorded during the 2-week interval between readings.
The first step in these reconstructions is to estimate present climate of the fossil site. Data provided by Beatley (1974, table 1) are used to extrapolate estimated ranges of temperature and precipitation at fossil localities. One uncertainty is that most midden sites are on steep slopes, where orientation to the sun and relative elevation are important determinants of local climate. In contrast, Beatley's stations are on gentle slopes where orientation and relative altitude are less important, but where the effect of nocturnal cold-air drainage may be more pro nounced. Such factors were considered when the current climatic parameters for critical fossil localities were estimated (table 5). The second step is to estimate the climate represented by a given fossil-plant assemblage, a

16 VEGETATION AND CLIMATES OF THE LAST 45,000 YEARS, NEVADA TEST SITE
TABLE 5. Estimated range of values for mean annual temperature and precipitation at four key fossil localities in theNevada Test Site and vicinity
(Habitat abbreviations are: Af, alluvial fan; MR. mesa top or ridge top; TL. talus slopes and ledges; W, dry wash. Abbreviations for plant species are: Amdu, Ambrosia dumosa; Arno, Artemisia nova: Artr. Artemisia tridentata; Atca. Atriplex canescens; Atco. Atriplex confertifolia; Gumi, Gutierrezia microcephala; Hysa. Hymenoclea salsola; Juos, Juniperus usteosperma; Ladi, Larrea divaricata; Lypa, Lycium pallidum: Pimo. Pinus monophylla: Prfa. Prunus fasciculata; m, meter: mm. milli meter: °C, degrees Celsius]
Habitats Vegetation
Estimated values for
Analogous climatic stations' fossil locality
Eleva- Orientation Site) si tion (from grid Primary
(m) north 1
Eleana Range 1,805-2 and -3
Specter 1,190Range-2
Point of 900Rocks-1
Owl Canyon 795-2 and -3
180°- TL205°
15°- TL25°
147°- TL230°
180°- TL230°
Site Secondary Tertiary Primary Secondary Tertiary No.
MR Af Atca Juos- Arno- 61Pimo Artr 62
65
MR Gumi- Atco 2Prfa 3
43031
Af W Lypa- Ladi Hysa 1Gumi 2
2038
W Amdu Gumi- 1-Ladi Amdu 7
89
Mean Eleva- Vege- precipi tation tation tation
(m) type (mm)
1,756 Arno 206.01,750 Artr 205.51,676 Atca 183.6
1,088 Ladi 169.41,038 do. 176.31,055 do. 148.1
943 Atca 126.0940 Atco 131.1
1,027 Ladi 140.71,088 do. 169.4
994 do. 136.4949 Lypa 121.9
1,027 Ladi 140.7963 do. 124.0938 do. 120.1989 do. 132.3
Mean temper
ature(°Cl
12.411.910.9
14.516.714.713.513.5
15.214.514.713.7
15.214.516.214.2
Mean Mean precipi- temper- Remarks tation ature (mm) ( U C)
215- 11- Fossil locality225 12 less than 1
kilometerfrom sites61 and 62.
170- 13- Fossil locality190 14 less than 1
kilometerfrom site 3.
110- 13.5- Fossil locality120 14.5 in the bottom
of a canyon.
105- 16.5-115 17.5
'From Beatley (1974, table 1).
process with even more uncertainties. In this analog approach, dominant plant species in macrofossil assem blages are assumed to characterize the local paleocom- munity. If, for example, a midden contains abundant juniper and sagebrush with other Great Basin Desert shrubs, then temperature and precipitation values are estimated that coincide with sites at the lower limit of woodland in a relatively dry part of the State, where juniper grows with such shrubs today. In contrast, if a macrofossil assemblage contains abundant juniper and pinyon pine associated with woodland shrubs, then extrapolated climatic values are derived from sites that support such vegetation today, well above the lower limit of woodland. The range of present values at the fossil site are then subtracted from estimated values for past climate to derive changes in mean annual temperature ( AT) and precipitation. Precipitation change is expressed as a percent change from present values (percent P). Values of ^47"and percent P should be comparable, whether derived from Beatley's data base or U.S. Weather Bureau records, provided that separate sets of calculations consistently use one or the other. This approach rep resents only the first approximation to interpret an extensive fossil record.
RADIOCARBON DATING
Questions concerning the dating of packrat middens are as critical as those addressing the representative nature of the plant macrofossil assemblage. It is assumed that macrofossils from a midden sample are contempor aneous within the standard deviation ( la) of that sample's radiocarbon ( 14C) age. The mixing of different-age macro- fossils would lead to erroneous species associations, compromising paleoenvironmental reconstructions de rived from them.
If the assumption of contemporaneity holds true, satisfactory dates could be obtained from any fraction of a packrat midden. Materials used for radiocarbon dat ing packrat middens range from whole samples of leafy strata and uriniferous residue (Wells and Jorgensen, 1964, p. 1172; Wells, 1977, p. 239) to Neotoma fecal pellets and fragments of single plant species (Van Deven- der, 1977a, p. 237). Because mixing of different-age mate rial is a possibility, a monospecific date is a more reliable estimate of the age of occurrence of that species (Van Devender, 1973, p. 31-33; Phillips, 1977, p. 21-22; Cole, 1981, p. 32). Multiple radiocarbon dates, using

PACKRAT-MIDDEN ANALYSIS 17
different materials, should be used to verify the age of critical samples.
An assessment of 21 multiple-dating tests on packrat middens used in various studies (Spaulding, 1981, table 6) shows that 17 of the 58 radiocarbon dates were not within the expected age range at 10. Some of these tests were performed because contamination was suspected; excluding these tests leaves 11 dates that represent unanticipated discordancies. Caution is needed in evalu ating a macrofossil assemblage controlled by a single radiocarbon date.
A total of 71 samples were dated using carbon-14 tech niques (table 6). Nineteen of the 46 macrofossil assemb lages collected in the vicinity of the Nevada Test Site were dated at least twice. In addition, this study was designed to intensively sample large middens from a few sites to gain chronologic continuity at individual locali- ties.t Twelve middens from 7 localities were analyzed (table 6). Contrasts between samples thus could be used to identify anomalous assemblages that then were redated to verify their age.
The Eleana Range-3 packrat midden is of particular interest because of its great age and large size. It was subject to intensive radiocarbon analysis in an attempt to verify the ages of some of the oldest dated assemblages from the Southwest. Multiple dates are particularly im portant on samples with finite dates older than 30,000 years, when the quantity of radiocarbon remaining in a sample is extremely small. Materials dated were curl-leaf mountain mahogany (Cercocarpus ledifolius) and Utah juniper (Juniperus osteosperma) wood, limber-pine (Pinus flexilis) seed coats, Neotoma fecal pellets, unidentified twigs, and undifferentiated organic debris (a mix of sticks, fecal pellets, and plant fiber) (table 6). Other than the wood and seeds, monospecific samples could not be dated. Fragments of a single plant taxon rarely were abundant enough to provide the minimum 10 g desired to date a sample older than 30,000 years.
Most of the units from the Eleana Range-3 midden appear to be contaminated. Multiple-dating tests were done on eight assemblages after the first series of radio carbon ages failed to demonstrate normal superposition (fig. 9). Only one of the assemblages yields paired dates that are concordant at 10, ER-3(7)2 (table 6). Multiple ages on samples ER-3(3) and 3(8)s overlap at 20. The range of dates from the midden is from 14,200 to 49,900 B.P. (radiocarbon years before the present) (table 6). Anomalously young ages occur at the bottom of two of the three sample columns (fig. 9). Dates on large pieces of wood were as much as 15,000 years older than on associated midden material; such contamination of younger strata with older debris may occur more often in large rock shelters and caves, where fossil material may be readily available. Packrats apparently may incorporate
older sticks that were foraged from other parts of the shelter into a midden. Thus, large pieces of wood may be undesirable as dating material, because of their attrac tiveness as materials for packrat-den construction.
Some of the galleries behind and between ledges of in durated midden contain different-age organic debris. A tunnel-like cavity between samples ER-3(13) and 3(14) that extends to the back wall of the shelter (fig. 9) was filled with loose reddish-brown dirt and seeds. Limber- pine seed shells from this fill were dated at 14,200 B.P. (table 6). This indicates that at least part of the midden was occupied during the late Wisconsin as well as during the middle Wisconsin.
Van Devender (1973, p. 17-18) first noted that packrat middens do not necessarily contain normally superim posed layers and that a packrat may deposit debris beneath a ledge formed by an older indurated midden. Based on the radiocarbon analyses of the Eleana Range-3 midden, it seems appropriate to extend this observation to note that some, but by no means all, middens may be so reworked by packrats throughout the millenia that they are undesirable for detailed paleoenvironmental reconstruction, no matter what their age. Only three assem blages from this midden had paired dates that were concordant at 20 ( table 6); only these assemblages will be used for paleoenvironmental reconstruction. These samples ER-3(3), 3(7)2, and 3(8)s, may possess enough temporal integrity to warrant detailed discussion.
Dating results on the Eleana Range-2 midden (site ER-2; 10,600 to 17,100 B.P.) are more encouraging. The first series of dates from the midden revealed that nor mal superposition appears to be the rule rather than the exception (table 6.) However, the lowermost unit yields anamalously young dates (fig. 10). This stratum also is friable and contains more insect fragments than the units above. The abundant mouse and pika (Ochotona sp.) feces suggest reworking by burrowing animals sub sequent to initial deposition. Paired radiocarbon dates of 14,310 (on Neotoma feces) and 10,800 B.P. (on undifferen tiated plant debris) (table 6) from sample ER-2( 11) indi cate that a mixing of older and younger material has occurred.
Radiocarbon analyses of samples from the Specter Range-2 midden (site Spc-2; 18,700 to 32,000 B.P.) also indicate normal superposition of layers, with the excep tion again of the bottom stratum. Dates on sample Spc-2( 12) are considerably younger than those from overyling strata (fig. 11; table 6). Unlike the dates on the lowest sample from the Eleana Range-2 midden, paired dates from sample Spc-2(12) are coeval at 10, yielding no evidence of mixing of different-age debris. This may be because the Specter Range-2 midden is suspended about 1 m above the floor of the rock shelter, perhaps precluding

18 VEGETATION AND CLIMATES OF THE LAST 45,000 YEARS, NEVADA TEST SITE
TABLE 6. Packrat-midden sites, samples, and radiocarbon dates[Artr, Artemisia sec. Tridentatae; Cele, Cercocarpus ledifolius; fp, Neotoma fecal pellets; Juos, Juniperus osteosperma; Iv, leaves; Mout, Mortonia utahensis; Pifl, Pinus
flexilis; sd, seeds; tg, twigs: uod. undifferentiated organic debris; upd, unidentified plant debris; wd. wood; Yusc. Yucca schidigera; In, 1 standard deviation]
Site
Eleana Range (ER) 2(lat37°07l8"N.,long 1 16 ° 14 '03 "W.,elevation 1,810 m).
Eleana Range (ER) 3(lat 37°07'15"N., long 1 16 ° 13 '49 "W.,elevation 1,800 m).
Eleana Range (ER) 3(cont.)
Specter Range ( Spc ) 1(lat36°38'31"N.,
Unit
I
I
II
II
II
III
IVIVIVIV
IVIVIVVV
II II
IIII
IIIIIIIIIIIIIVVVV
VI
VIVI
VIVI
VIIIIXIX
__
SampleNo.
ER-2(1)ER-2(2)ER-2(3)ER-2(4)ER-2(4)ER-2(5)ER-2(6)ER-2(6)ER-2(7)ER-2(7)/
2(8)ER-2(9)ER-2(10)ER-2(10)ER-2(11)ER-2(11)
ER-3(2)
ER-3(2) ER-3(3)ER-3(3)ER-3(4)ER-3(4)ER-3(6)ER-3(7)i
ER-3(7)2ER-3(7) 2
3ER-3(p)
ER-3(8)2ER-3(8)3ER-3(8)3ER-3(9)
ER-3(9)ER-3(10)
ER-3(10)ER-3(10)ER-3(12)ER-3(13)ER-3(13)4ER-3(u)
5ER-3(14)
Spc-l(l)Spc- 1(2)
Radiocarbon date (±1(7)
10,620±12011,700±8513,180±6514,090±32015,300±13014,260±11014,500±11014,830±8014,760±10015,380±100
15,890±12017,100±13017,100±9010,800±9014,310±110
49 800 + 3 ' 100 4y ' 8UU 2,300
42,500±1,300 37,400±1,00039,400±76037,950±45042,800±1,00040,600±85049,900+1,900
1,50044,500±1,1QO46,100+1-200
1,60038,600±1,10044,100±1,30039,800±1,20037,600±35034,800±550
36,290±33047,100 + 2,600
-2,00032,500±80035,450±65045,400±1,50022,940±15029,120±17Q40,500±1,00014,200=^100
300±40100 + 200
100
LaboratoryNo.i
USGS-876USGS-914USGS-884A-2927USGS-875USGS-874USGS-885USGS-886USGS-887USGS-888
USGS-889USGS-890USGS-1069USGS-892USGS-893
USGS-971
USGS-1260 USGS-915USGS-991USGS-972USGS-1261USGS-973USGS-916
USGS-974USGS-975
USGS-687USGS-917USGS-918USGS-976USGS-1264
USGS-1061USGS-919
USGS-993USGS-1265USGS-920USGS-992USGS-1062USGS-977USGS-1266
UW-635UW-630
Material dated
Juos tg & sdArtr tgfpPifl IvPifl wdPifl wdPifl IvfpfpCele wd
fpfpPifl Ivupdfp
uod
fp&tg upduodfptguodCele wd
fpuod
updCele wdCele wdfpuod
fpJuos wd
fpuodCele wdfpupduodPifl sd
updYusc Iv
Weighted average2
14,720±70
17,100±70
38,670±610
45,110=^870
37,800±340
__
long 116 ° 05'00 "W., elevation 1,040 m).

PACKRAT-MIDDEN ANALYSIS 19
TABLE 6. Packrat-midden sites, samples, and radiocarbon dates Continued
Site
Specter Range ( Spc ) 2(lat36°40'l6"N.,long 116° 12 '33 "W.,elevation 1,190 m).
Specter Range ( Spc ) 3(lat36°40'35"N.,long 1 16 ° 12 '28 "W.,elevation 1,100 m).
Point of Rocks (PR) 1(lat36°34'l3"N.,long 116°04'45"W.,elevation 900 m).
Point of Rocks (PR) 2(lat36°33'48"N.,long 116°04'55"W.,elevation 930 m).
Point of Rocks (PR) 3(lat36°34'lO"N.,longll6°05'10"W.,elevation 910 m).
Owl Canyon (OC) 1<5(lat36°24'N.,long 116° 14' W.,elevation ca. 790 m).
Owl Canyon (OC) 2(lat36°24'27"N.,long 116° 14 '23 "W.,elevation 800 m).
Owl Canyon (OC) 3(lat36°24'18"N.,long 116° 14 '29 "W.,elevation 790 m).
Last Chance Range ( LCR) 1(lat36°17'25"N.,long 116°07'40"W.,elevation 960 m).
Unit
I
I
I
I
II
II
II
III
III
III
III
III
IVIV
Sample No.
Spc-2(2)iSpc-2(2hSpc-2(2)2Spc-2(2)2Spc-2(3)Spc-2(3)Spc-2(6)Spc-2(8)Spc-2(8)Spc-2(10)Spc-^dlhSpc-2(ll)2Spc-2(12)Spc-2(12)Spc-3 A( 1 )Spc-3A(2)Spc-3 A( 2)Spc-3B
PR-Kl )PR-K1 )PR-K3)
PR-2(2)PR-2(3)
PR-3
OC-1
OC-2(1)OC-2(2)
OC-3(1)OC-3(2)
LCR-K2)LCR-l(S)
Radiocarbon date (±!CT)
18,760±11018,710±1502l,400±120019,080±37023,330±15023,250±10025,900±26027,900±30029,810±28029,140±31032,260±2,80032, 100± 1,40025,280±22025,060±19020,200±1,80010,660±25013,090±32028,460±2,200
9,880±1909,780±230
11,680±650
9,560±2209,260±180
14,810±400
13,150±500
10,260±52010,070±220
32,870±1,370>28,700
9,280±21011,760±90
Laboratory No.'
USGS-1063USGS-994UW-637UW-638USGS-998USGS-1064USGS-995USGS-997USGS-1065USGS-1066UW-639UW-640USGS-996USGS-1067A-2398A-2399A-2400A-2401
A-2395A-2396A-2397
A-2393A-2394
A-2927
1-4237
A-2402A-2403
A-2412A-2413
A-2414A-2415
Material dated
uodJuos tg & sdPimo IvJuos tg & sdJuos tguodJuos tg & uodJuos tg & sduoduodJuos tg & sdJuos tg & sdJuos tguodJuos tg & sdfpJuos tgJuos tg
fpupdupd
updupd
tg
Juos tg
fpfp
Juos tg & sdJuos tg & sd
Mout IvJuos tg & sd
Weighted average2
18,740±90
19,280±350
23,270±80
25,150±140
9,840±150
iUSGS, U.S. Geological Survey Radiocarbon Laboratory; A, University of Arizona, Laboratory of Isotope Geochemistry; UW, University of Washington, Department of Chemistry Radiocarbon Laboratory; I, Teledyne Isotopes.
2Average of paired dates from one sample, weighted toward the radiocarbon date with the smaller a (the more precise date) (Long and Rippeteau, 1974, p. 208). 3Prospect sample removed prior to detailed stratigraphic analysis. 4Sample from loose float on floor of shelter. 5Loose fill in cavity between two indurated midden units. 6Midden located and collected by P.J. Mehringer, Jr. (Mehringer and Warren, 1976). The site could not be relocated.
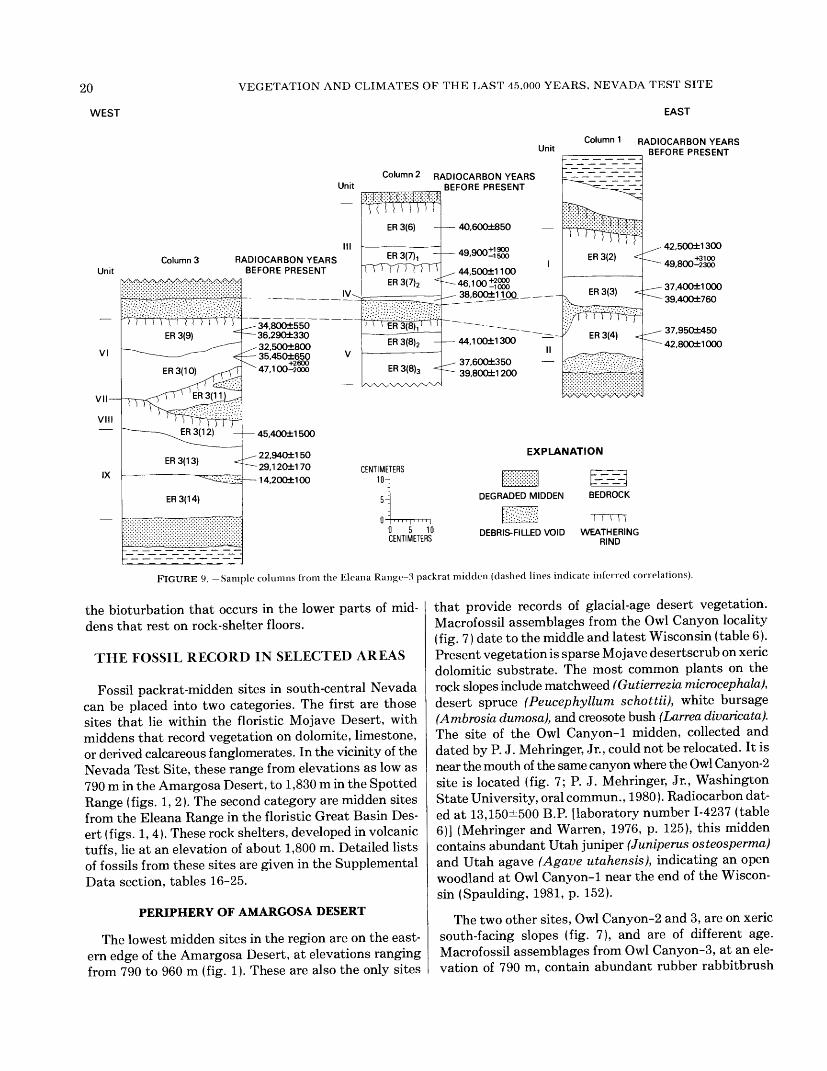
20
WEST
VEGETATION AND CLIMATES OF THE LAST 45,000 YEARS, NEVADA TEST SITE
EAST
Unit
UnitColumn 2 RADIOCARBON YEARS
BEFORE PRESENT
Unit
VI
VII
VIII
IX
III Columns RADIOCARBON YEARS
BEFORE PRESENT
m^mmm^<^mMy& iv^
n' i'j \ i u i i> M MER 3(9) ^
- --^ER3(10)^^fT
^£^&-^TfW'^pi^
- _____ CD O/1 O\
ER3(13) ^-
ER3(14)
_______
^34,800±550 36,290±330 ^ 32,500±800 35,450±650 v
^47,100-2000
TTIU SM ICD O/C\
ER 3(7),
TTTTTTTTTTER 3(7)2 -=
' ^ \ ERSiS),'^
ER 3(8)2 -
ER 3(8)3 -=
4qqno+190°
^^44,500±1100 . A.R 1 nr> +2000 ^ 4b,lCXJ_1000^38,600±1100 _ "
44,100±1300
^ 37,600±350 ~ 39,800±1 200
45,400±1 500
^- 22,940±1 50 EX
~ 29,1 20±1 70 CENTIMETERS ^..... ............ ) 14,200±100 10-
BT
0 5 10 CENTIMETERS
DEGRADED M
DEBRIS-FILLEC
Column 1 RADIOCARBON YEARS BEFORE PRESENT
ER 3(2)
ER 3(3)
42,500±1300
49,800-2300
37,400±1000 39,400±760
37,950±450 42,800±1000
EXPLANATION
RIND
FIGURE 9. Sample columns from the Eleana Range-3 packrat midden (dashed lines indicate inferred correlations).
the bioturbation that occurs in the lower parts of mid dens that rest on rock-shelter floors.
THE FOSSIL RECORD IN SELECTED AREAS
Fossil packrat-midden sites in south-central Nevada can be placed into two categories. The first are those sites that lie within the floristic Mojave Desert, with middens that record vegetation on dolomite, limestone, or derived calcareous f anglomerates. In the vicinity of the Nevada Test Site, these range from elevations as low as 790 m in the Amargosa Desert, to 1,830 m in the Spotted Range (figs. 1, 2). The second category are midden sites from the Eleana Range in the floristic Great Basin Des ert (figs. 1,4). These rock shelters, developed in volcanic tuffs, lie at an elevation of about 1,800 m. Detailed lists of fossils from these sites are given in the Supplemental Data section, tables 16-25.
PERIPHERY OF AMARGOSA DESERT
The lowest midden sites in the region are on the east ern edge of the Amargosa Desert, at elevations ranging from 790 to 960 m (fig. 1). These are also the only sites
that provide records of glacial-age desert vegetation. Macrofossil assemblages from the Owl Canyon locality (fig. 7) date to the middle and latest Wisconsin (table 6). Present vegetation is sparse Mojave desertscrub on xeric dolomitic substrate. The most common plants on the rock slopes include matchweed (Gutierrezia microcephala), desert spruce (Peucephyllum schottii), white bursage (Ambrosia dumosa), and creosote bush (Larrea divaricata). The site of the Owl Canyon-1 midden, collected and dated by P. J. Mehringer, Jr., could not be relocated. It is near the mouth of the same canyon where the Owl Canyon-2 site is located (fig. 7; P. J. Mehringer, Jr., Washington State University, oral commun., 1980). Radiocarbon dat ed at 13,150±500 B.P. [laboratory number 1-4237 (table 6)] (Mehringer and Warren, 1976, p. 125), this midden contains abundant Utah juniper (Juniperus osteosperma) and Utah agave (Agave utahensis), indicating an open woodland at Owl Canyon-1 near the end of the Wiscon sin (Spaulding, 1981, p. 152).
The two other sites, Owl Canyon-2 and 3, are on xeric south-facing slopes (fig. 7), and are of different age. Macrofossil assemblages from Owl Canyon-3, at an ele vation of 790 m, contain abundant rubber rabbitbrush

PACKRAT-MIDDEN ANALYSIS 21
WEST
Unit
IV
EAST
RADIOCARBON YEARS BEFORE PRESENT
ER2(1)
ER 2(2)
ER 2(4)
ER2(7)
ER2(8)
10,620±120
14,090±320
14,260±110
14,500±110
14,830±80
14,760±100
15,380±100
15,890±120
17,100±90
17,100±130
10,800±90
14,310±110
CENTIMETERS 20 |
10
EXPLANATION
DEGRADED MIDDEN BEDROCK
0 10 20 CENTIMETERS
DEBRIS-FILLED VOID WEATHERING RIND
FIGURE 10. Sample column from the Eleana Range-2 packrat midden.
( Chrysothamnus nauseosus) and Utah juniper, and com mon Utah agave, and they date to the middle Wisconsin (about 33,000 B.P. and >29,000 B.P.) (table 6). Both rubber rabbitbrush and Utah agave are characteristic of higher elevation deserts. Agave is not known below ele vations of about 1,200 m (Beatley, 1976, p. 269). The abundance of shrubs and succulents in the Owl Canyon-3 assemblages may indicate desertscrub vegetation with occasional junipers, rather than a juniper woodland.
Two samples from the Owl Canyon-2 midden are radio carbon-dated at 10,070 and 10,260 B.P. (table 6). They contain abundant Utah agave, but lack appreciable quan-
EASTRADIOCARBON YEARS
BEFORE PRESENT
Unit
19,080±370
21,400±1200
25,900±260
27,900±300
29,810±280
29,140±310
IV
WESTRADIOCARBON YEARS
BEFORE PRESENT
Unit
18,710±150
18,760±150
23,250±100 23,330±150
32,260±2800
32,100±1400
25,060±190
25,280±220
CENTIMETERS 15-
10-
5-
0
EXPLANATION
DEGRADED MIDDEN
0 5 10 15 CENTIMETERS
WEATHERING RIND
DEBRIS-FILLED VOID
FIGURE 11. Sample column from the Specter Range-2 packrat midden.
tities of rabbitbrush and contain no juniper (see Supple mental Data section). Desertscrub vegetation apparently was well-developed at this site by the close of the Wisconsin. However, none of the xerophytic species that character ize the present local vegetation are recorded. Instead, the terminal-Wisconsin plant community appears to have been dominated by shrubs and succulents that common ly occur at higher elevations (above 1,200 m) today.
Late Wisconsin and early Holocene desert vegetation also is documented by packrat middens at the Point of Rocks locality. At an elevation of 910 m, the Point of Rocks-3 site is about 5 m above a talus slope head on the southwest-facing flank of a ridge (fig. 6). A sparse desertscrub community dominated by white bursage (Ambrosia dumosa), creosote bush, and chaff-bush (Amphipappus fremontii) occurs at the site today. The Point of Rocks-3 midden is dated at 14,810±400 B.P. (table 6) and con tains abundant snowberry (Symphoricarpos longiflorus), an extralocal shrub, and common shadscale (Atriplex confertifolia)(see Supplemental Data section). It lacks

22 VEGETATION AND CLIMATES OF THE LAST 45,000 YEARS, NEVADA TEST SITE
the remains of juniper and, as such, it is the oldest reported macrofossil record of desertscrub vegetation from the American southwest.
The Point of Rocks-1 site, at an elevation of 900 m, is about 30 m from the floor of the large wash issuing into the Amargosa Desert from Point of Rocks Pass (fig. 6). A radiocarbon date of 11,680 B.P. on sample PR-1(3) (table 6) is associated with a macrofossil assem blage containing abundant cactus spines (Opuntia sp.) and the common twigs and flowers of scalebroom (Lepidospartum latisquamum)and matchweed. Like the Owl Canyon-2 and Point of Rocks-3 assemblages, sam ple PR-1( 3) contains no arboreal species and is one of the first reported records of glacial-age desertscrub. Today, scalebroom is restricted to washes at elevations aboveI,525 m (Beatley, 1976, p. 143). Its presence in this assemblage may indicate that some plant species in sample PR-1(3) were collected in the wash about 20 m away. Alternatively, conditions might have been such that this riparian species occurred on rocky slopes that are now too xeric to support it. Such a phenomenon has been noted in the midden record from the Sonoran Desert where some perennials, presently restricted to washes, occurred on hillsides during the late Wisconsin (Van Devender, 1973, p. 59.). The younger PR-l(l) sample, dated at 9,840 B.P. (table 6), is dominated by desert bitterbush (Purshia glandulosa), another extralocal species. Like the Owl Canyon-2 and 3 assemblages, those from Point of Rocks-1 document mesophytic desertscrub vegetation, dominated by species no longer near the site; with the exception of Owl Canyon-3, they contain no tree species.
Point of Rocks-2 site, at an elevation of 930 m, over looks the alluvial fan that slopes westward to the Amargosa Desert, not far southwest of the Point of Rocks-1 site (fig. 6). At 9,260 and 9,560 B.P. the two desertscrub assemblages from Point of Rocks-2 are the youngest from the Amargosa Desert (table 6). Not coincidentally they contain more of the plant species that presently occur at the site, such as creosote bush and chaff-bush, than do the older midden samples from Point of Rocks-1 or Owl Canyon.
The highest elevation midden site on the periphery of the Amargosa Desert is in the western Last Chance Range at an elevation of 960 m (figs. 2,8). The LCR-1(3) assemblage is dated at 11,760 B.P. (table 6), less than 100 radiocarbon years older than the PR-1( 3) assemblage. Nevertheless, in contrast to sample PR-1(3), LCR 1(3) contains abundant juniper, indicating that betweenII,600 and 11,800 B.P., the lower limit of woodland in this area was not far above an elevation of 900 m. The LCR-1( 2) assemblage at 9,280 B.P., is of comparable age to the PR-2 samples (table 6). Like the Point of Rocks-2 assemblages, LCR-1( 2) contains many of the plants that
grow at the site today, although three of the four most abundant taxa are extralocal. Juniper was still present at this site at about 9,300 B.P., while it apparently was absent from the Point of Rocks and Owl Canyon locali ties well before this time.
SPECTER RANGE
Packrat middens from the northern Specter Range yield a different chronology of vegetation change. Macro- fossil assemblages from the Specter Range-2 site, on the north side of a ridge at an elevation of 1,190 m (fig. 6), span more than 13,000 years, from about 32,000 to 18,700 B.P. (table 6). Mojave Desert vegetation at the site today contrasts with midden samples that indicate a middle Wisconsin juniper or juniper-shadscale woodland, and a pinyon pine (Pinus monophylla)-juniper woodland during the Wisconsin maximum.
The Specter Range-3 site, downslope and north of Specter Range-2 site, is less than 50 m from the head of an alluvial fan that extends into Rock Valley (fig. 8). The ages of sample Spc-3A(l) at 20,200 B.P. and sample Spc-3B at 28,500 B.P. are approximately contemporane ous with some of the Specter Range-2 samples (table 6). Like the Spc-2 record, these Spc-3 assemblages docu ment a juniper woodland lacking pinyon pine, but con tain greater proportions of shrubs, such as winterfat (Ceratoides lanata), sagebrush, and shadscale.
Preliminary onsite inspection of the Specter Range-1 midden, from the cliff bordering a large wash on the western edge of Mercury Valley (fig. 8), indicated it was younger than 3,000 B.P. However it was collected and analyzed because a marked dichotomy was noted between plant fragments visible in the midden and the surround ing vegetation. The top layer has a radiocarbon date of 300±40 B.P., whereas the bottom unit is subrecent
(100^?QQ (table 6). The older sample is dominated by fourwing saltbush (Atriplex canescens), whereas the younger sample contains abundant creosote bush.
ELEANA RANGE
The Eleana Range is a southerly extension of the Belted Range and Pahute Mesa (fig. 2). Two adjacent sites on south-facing slopes, Eleana Range-2 and -3 (fig. 4), contain large indurated middens. Today, these sites are at the boundary between Great Basin desertscrub, occupying the talus slopes and valleys, and pinyon pine- juniper woodland, occurring on the mesa tops and north- facing slopes. The Eleana Range-2 midden records past vegetation from Wisconsin maximum to latest Wiscon sin time. Samples from Units II through IV, from 13,200 to 17,100 B.P. (fig.10), provide evidence for a limber-pine (Pinus flexilis) woodland with Great Basin Desert and

THE FOSSIL RECORD IN SELECTED AREAS 23
woodland shrubs as important understory species. The youngest samples are from Unit I. Dated at 11,700 and 10,600 B.P. (table 6), they indicate a shift to a woodland dominated by jumper, pinyon pine, and pricklypear (Opuntia erinacea) species present in the modern wood land nearby.
As mentioned previously, radiocarbon analyses indi cate that many assemblages from the complex Eleana Range-3 midden may be contaminated. Three samples that have statistically similar paired radiocarbon dates, and thus may contain valid species associations are: (1) Sample ER-3(8)s at 37,800 B.P.; (2) sample ER-3(3) at 38,700 B.P.; and (3) sample ER-3(7)2at45,100 B.P. [ages expressed are weighted averages of two 14C dates on each sample (Long and Rippeteau, 1974)](table 6). These assem blages reflect an open jumper woodland that differed from both late Wisconsin plant communities recorded by the Eleana Range-2 midden and the present vegetation. Extralocals, such as curl-leaf mountain mahogany ( Cercocarpus ledifolius ), were present, and species impor tant in the current woodland nearby were absent, such as Gambel oak (Quercus gambelli) and pinyon pine.
EARLY RECORDS FROM THE NEVADA TEST SITE
Wells and Jorgensen (1964) were the first to report on the significance of ancient packrat middens. Their initial studies were conducted in the vicinity of the Nevada Test Site (fig. 2) where some indurated packrat middens were found to contain abundant juniper. The presence of this tree fossil at sites supporting only desert vegetation today led Wells' colleagues to suspect that the middens were of considerable antiquity (Wells, 1976, p. 224). Of this early series, the lowest elevation sites are from the Ranger Mountains and lie between elevations of 1,100 and 1,130 m (fig. 2). The Ranger Mountains-1 midden, dated at 16,800±300 B.P., contains a depauperate macro- fossil assemblage,while samples from the Ranger Moun tains-2 midden, dated variously from 10,100±160 to 28,900±1,200 B.P., contain abundant shadscale and common pricklypear (Wells and Berger, 1967, table 1). Mercury Ridge-3 (at 1,250 m) is the only other midden of Wisconsin age, dated at 12,700±200 B.P. The re maining middens from Mercury Ridge, as well as those from Aysees Peak and the Spotted Range, are all of early Holocene age. All contain juniper, and the Spotted Range-2 midden also contains common pinyon pine (Pinus monophylla), although there is a discrepancy in the radiocarbon dates for this midden (reported as >40,000 and 9,550±90 B.P.) (Wells and Jorgensen, 1964, table 1; Wells and Berger, 1967, table 1). These middens document the persistence of juniper at high desert sites for more than 3,000 years after its extirpation from lower altitude sites in the Amargosa Desert (Spaulding, 1983).
SHEEP RANGE AND EUREKA VALLEY
Only four mountain ranges in the Mojave Desert have considerable relief above 2,200 m, the approximate lower limit of montane vegetation in this region. From west to east, these ranges are the Inyo Mountains and Panamint Range of California and the Spring and Sheep Ranges of Nevada (fig. 1). Late Quaternary vegetation of the Sheep Range, 60 km east-southeast of the Nevada Test Site, has been the subject of a recent packrat-midden study (Spaulding, 1981). This record consists of 52 macrofossil assemblages from 30 sites that span 900 m of topograph ic relief. Sheep Range midden sites extend the fossil record from limestone and dolomite substrates to 2,400 m. Such rocks generally are lacking above an elevation of 1,600 m in the Nevada Test Site. Current vegetation of the Sheep Range is like that of the Nevada Test Site, given similar topography and parent rocks; the packrat- midden record is also similar. Below approximately 1,800-m elevation, Wisconsin age packrat middens from the south eastern Sheep Range (fig. 12) and the western Sheep Range (fig. 13) yield records of juniper-shrub vegetation analogous to records from sites such as Specter Range-2. Late Wisconsin middens from above 1,800-m elevation in the Sheep Range yield assemblages dominated by subalpine conifers (Pinus flexilis and Pinus longaeva) (Spaulding, 1981, fig. 27).
Midden data from the Sheep Range are synthesized in the regional fossil record of the northern Mojave Desert (fig. 14) with middens from the Nevada Test Site and vicinity. Two isolated records from the Blue Diamond area in the southern Spring Range (Spaulding, 1981, p. 153-157) and middens from the Eureka Valley in California, 140 km west-northwest of the Nevada Test Site (fig. 1) (Spaulding, 1980), also are included in figure 14. Packrat middens from the Eureka Valley are the only comprehen sive Holocene time series from the northern Mojave Desert (see Supplemental Data section, table 25) and supplement the midden record from the periphery of the Amargosa Desert. Middens from the Amargosa Desert document the presence of late Wisconsin and early Holo cene desert vegetation that differed from current desert- scrub. Eureka Valley middens show transformation of this anomalous desertscrub to an essentially modern- vegetation type.
TULE SPRINGS
Pollen-stratigraphic and geologic investigations at Tule Springs, in the Las Vegas Valley about 80 km southeast of the Nevada Test Site (fig. 1), provided some of the first detailed information on the late Quaternery environments of the Mojave Desert (Martin and Mehringer, 1965; Mehringer, 1967; Haynes, 1967). Although some conclu sions reached during this earlier work require revision

24
36°30'
VEGETATION AND CLIMATES OF THE LAST 45,000 YEARS, NEVADA TEST SITE
16' 15'
< f .SOUTH CREST-1\
36°27' -
1MILE
0 1 KILOMETER CONTOUR INTERVAL 400 FEET
DATUM IS SEA LEVEL
EXPLANATION
PACKRAT-MIDDEN SITE
FIGURE 12. Location of packrat-midden sites in the southeastern Sheep Range.
(Spaulding and others, 1983), palynological evidence for the expansion of woodland and Great Basin Desert plants during the Wisconsin corroborates evidence provided by packrat middens from nearby mountains. Important paleo- ecological inferences from Tule Springs came from pollen spectra of spring mound sediments of latest Wisconsin age. Relatively high frequencies of Juraperas and Artemisia pollen, coupled with juniper wood in the sediments, indi cates an open juniper woodland with Great Basis Desert
species on the floor of the Las Vegas Valley (Mehringer, 1967, p. 184-185).
GRAND CANYON
Wisconsin-age environments of the Grand Canyon have been the subject of several investigations. Packrat mid dens from the lower Grand Canyon of Arizona, 215 km east-southeast of the Nevada Test Site (fig. 1), provide
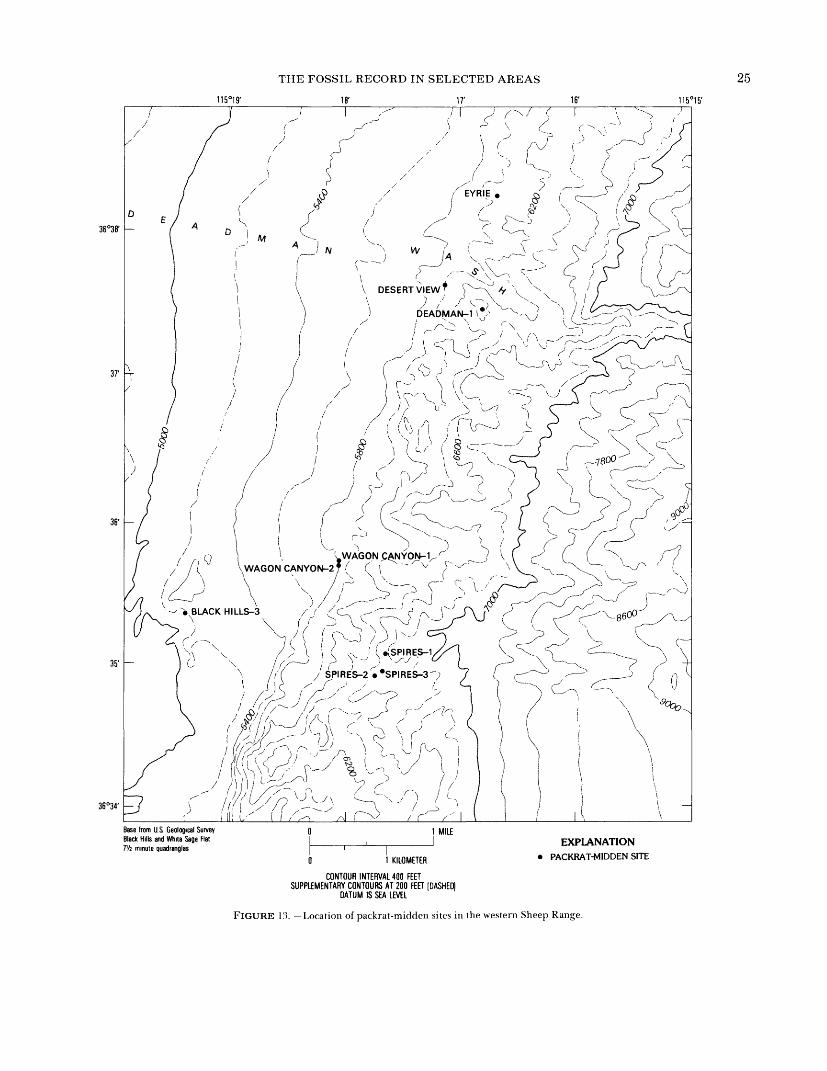
THE FOSSIL RECORD IN SELECTED AREAS
18' 17'
25
36°3B'
WAGON CANYON-2 J ( (
\ I v
Base from U.S Geological Survey Black Hills and Whita Sage Flat Th minute quadrangles
1 KILOMETER
CONTOUR INTERVAL 400 FEETSUPPLEMENTARY CONTOURS AT 200 FEET (DASHED)
DATUM IS SEA LEVEL
EXPLANATIONPACKRAT-MIDDEN SITE
FIGURE 13. Location of packrat-midden sites in the western Sheep Range.

26 VEGETATION AND CLIMATES OF THE LAST 45,000 YEARS, NEVADA TEST SITE
Subalpine Conifer Woodland
28 26 24 22<
20
£19LU
LLJ-I 0S 18LL.017CO
2lfi
ELEVATION, IN HUNDR-. NJ CO -^ Ol
10
9
8
75
I I I I I V I i I ] I I I I | | I I I I I I I I I I I
Subalpine Conifer Woodland uc i J HF-3A
< t > 0,,9/n HF-3C Sp-3 HF-3B \ SP ( 1 Dm Sp-2(2) + V Sp-1®
SC-1(3) SC-1(4), ~_/ . \ ~*~*\^* /V\ i/£"
Ey-5(2) \ / ' ' Ey JV-2 X "*;/-?- -W- 7 J5' 1 DV ° ° /
' ~~~5f*D vvu z Ev ' ^ £ Ji £^£ i ' §) ^^ i - -^^CT^fi) /
ER-3 FM-1^ ^FM-2 ER. 2 ' ,' X\ ^BW/7 Ph-3 __ __ / v &!)/ /
BH-3 / I BC-2B UTU BC-2A / \ ^. / WW-4C(iy Ll_ ^*= Ph-1(3) ^BC., HTH ^ Ph- 1 ( 1 ) V^
^W-16 . / WW-4Q2) \W-4D Ph-^ WW^ / EV-4(2) ^'^EV-I
WW'1A WW-4A ^V-5A VEV-5B ^ EV^d) ^ ^g EV-3
Pygmy Conifer Woodland / "*M-1 EV-4(3) EV-2C
Spc-2(2), M o ^"l/ ^ Spc-2(11) Spc-2(3) , 2 M'V */ M-2
^»~«*« ~®-® 1 / Desertscrub
-^ . / ,R'2^\ s/ \ ' / Spc-1
/X LCR-1(3) LCR-1(2)
^/PR-3 * {
oc-3(i)^ X OC:1^ X PRji
OC-21 1 1 1 1 A 1 1 1 1 1 I 1 1 1 1 1 1 1 1 1 1 I 1 1 ! 1
0 45 40 35 30 25 212019181716151413121110 9 8 7 6 5 4 3 2 1
RADIOCARBON AGE, IN THOUSANDS OF YEARS BEFORE PRESENT
Fir- Pine ~ Forest
< Pygmy Conifer
Woodland
_
-
Desertscrub
:No Scale
CURRENT VEGETATION
EXPLANATION
INFERRED POSITION OF MAJOR VEGETATION ZONE BOUNDARIES
SAMPLES FROM VOLCANIC SUBSTRATE (THEELEANA RANGE LOCALITY)
SAMPLES DOMINATED BY SUBALPINE CONIFERS
SAMPLES CONTAINING MONTANE CONIFERS
SAMPLES CONTAINING ABUNDANT UTAH JUNIPER
ASSEMBLAGES WITH BOTH ABUNDANT JUNIPER AND PINYON PINE
SAMPLES WITH ABUNDANT JUNIPER AND COM MON LIMBER PINE
ANOMALOUS DESERTSCRUB ASSEMBLAGES
DESERTSCRUB VEGETATION ANALOGOUS TOTHAT AT THE SITE TODAY
± 1(7 OF THAT SAMPLE'S RADIOCARBON DATE
Abbreviations for the fossil localities from the vicin ity of the Nevada Test Site and Amargosa Desert are: A, Aysees Peak; ER, Eleana Range; F, Funeral Mountains; LCR, Last Chance Range; M, Mer cury Ridge; OC, Owl Canyon; PR, Point of Rocks; R, Ranger Mountains; S, Spotted Range; Spc, Specter Range (fig. 1). Abbreviations for sites from the Sheep Range are: BC, Basin Canyon; BH, Black Hills; BW, Basin Wash; CT, Canyon Two; Dm, Deadman; DV, Desert View; Ey, Eyrie; Fm, Flaherty Mesa; HF, Hidden Forest Ph, Pent house; SC, South Crest Sm, Sawmill Canyon; Sp, Spires; WC, Wagon Canyon; WW, Willow Wash (figs. 12, 13). The BDR (Blue Diamond Road) sites lie in the southeastern Spring Range, and the HTH (Horse Thief Hills) and EV(Eureka View) sites are in the northern Eureka Valley (fig. 1). Data are from this report. Wells and Berger (1967), and Spaulding (1980, 1981)
FIGURE 14. Age and elevational distribution of late Quaternary packrat-midden samples from the northern Mojave Desert. Dashed lines indicate the approximate elevation of major vegetation zone boundaries on xeric slopes. Note changes in scale. The column to the right presents the current vegetation zonation.
an elaborate record from limestone slopes between eleva tions of 440 and 675 m (Phillips, 1977). Although current vegetation at most sites is desertscrub, late Wisconsin macrofossil assemblages document a juniper woodland with a diverse complement of desert species (such as Atriplex confertifolia, Agave utahensis, Ephedra sp., Echinocactus polycephalus) and some woodland associ
ates (such as Symphoricarpos sp., Opuntia whipplei)( Phillips, 1977; Mead and Phillips, 1981). Many species common in the late Wisconsin woodland of the lower Grand Canyon, such as blackbrush ( Coleogyne ramosissima), single-leaf ash (Fraxinus anomcda), and brittlebrush (Encelia farinosa), are rare or missing in similar-age middens from the Nevada Tbst Site and Sheep Range, partly because of the

LATE QUATERNARY VEGETATION AND CLIMATE 27
higher elevations of these Nevada sites. It also is proba ble that the precipitation regime of the Grand Canyon region was different from areas to the west and north. Assemblages in late Wisconsin packrat middens from farther east in the central Grand Canyon (Cole, 1981) are even more different from the Nevada fossil record, although these records are from the same altitudinal range.
The timing of latest Wisconsin vegetation change in the Lower Grand Canyon was distinctly different from that recorded by packrat middens from the Nevada Test Site and vicinity. Grand Canyon sites as low as 560-m elevation supported juniper woodland well into the Holocene (until about 8,500 B.P.) (Phillips, 1977, p. 85; Van Devender, 1977b; Cole 1982). In contrast, mid dens from the Amargosa Desert as high as 930-m eleva tion show that woodland gave way to desert vegetation by at least 14,800 B.P. at some localities (fig. 14)(Spaulding, 1983).
LATE QUATERNARY VEGETATION AND CLIMATE
The Wisconsin macrofossil record from the northern Mojave Desert spans 1,600 m of topographic relief, from Owl Canyon in the Amargosa Desert (800 m) to the Hidden Forest (2,400 m) in the Sheep Range (Spaulding, 1981, p. 144). The record provides a data base sufficient for estimates of paleoclimate that can be compared with estimates from other regions. Major environmental changes, such as that which occurred at the end of the Wisconsin, are evident in the composite packrat-midden record (fig. 14), but lower magnitude fluctuations can be better studied in time series from single midden sites. Plant community change usually takes place in the context of a single vegetation type; variations occurred in the composition of woodland during the Wisconsin, and changes occurred in desertscrub vegetation during the Holocene. Time series macrofossil assemblages at different sites, cou pled with the use of relative frequencies of macrofossils, help discern these more subtle changes.
The Climate: Long-Range Investigation Mapping and Prediction (CLIMAP) project members' (1976, fig. 1) reconstruction of full glacial (18,000 B.P.) surface conditions of North America shows the Southwest as a region of sparse vegetation with a high surface albedo. However, woodland was widespread in this region, with a resultant albedo that was lower than today's. The cause of this discrepancy is the assumption that lowered temperatures during the late Wisconsin led to reduced competency of the atmosphere and, therefore, to less precipitation and sparse vegetation. However, this was not the case. Lowered temperatures and increased winter precipitation during the full glacial led to decreased evapotranspiration, greater
effective moisture, and increased vegetation cover in the arid West. The initial paleobotanical evidence for this difference (Martin and Mehringer, 1965; Mehringer, 1967; Wells and Berger, 1967) was not well depicted by CLIMAP (1976).
MIDDLE WISCONSIN ENVIRONMENTS
The middle Wisconsin has been correlated with oxygen- isotope stage 3 in the deep-sea core record (Dreimanis and Raukas, 1975, p. 109-110 and 116), with bracketing dates of about 62,000 and 23,000 B.P. (Prell and Hayes, 1976, fig. 3; Ruddiman and Mclntyre, 1981, fig. 2). Variations in the oxygen 16/oxygen 18 ( 160/180) ratios in the tests of benthic foraminifera in deep-sea cores provide an index of global ice volume (Shackleton and Opdyke, 1973) and indicate that interstadial conditions prevailed during this period. This was a time of generally lower continental ice sheet volume and warmer global temperatures, between the early and late Wisconsin stades [isotope stage 4 for the early Wisconsin and stage 2 for the late Wisconsin (Dreimanis and Raukas, 1975)].
Packrat-midden samples cannot be placed in a well- defined stratigraphic framework; each must be associated with a radiocarbon age. Because the practical upper limit of most radiocarbon-dating laboratories is about 30,000 B.P., only the last 7,000 years of the middle Wisconsin lie within the dating range of most studies. The relatively large number of finite dates from Nevada Test Site that range from 30,000 to 45,000 B.P. are the result of radiocarbon assays performed at the high-precision facility of the U.S. Geological Survey at Menlo Park, California (Robinson, 1979).
45,000 TO 35,000 YEARS BEFORE PRESENT
Four finite-age macrofossil assemblages from the northern Mojave Desert are older than 35,000 B.P. (fig. 14). The three from the Eleana Range-3 midden provide the oldest time series from a single site in the Southwest. The ER-3( 7 >2 assemblage is associated with two radiocarbon dates with a weighted average of 45,000±900 B.P. (Long and Rippeteau, 1974) (table 6). It indicates vegetation broadly similar to today's: An open woodland of Utah juniper and mountain mahogany ( Cerocarpus ledifolius), with well-developed stands of sagebrush (figs. 15, 16). Limber pine, the dominant tree during the succeeding full glacial, is absent from the ER-3(7)2 sample, as are many of the plants present today (such as Pinus monophyUa, Quercusgambelii, Rhus trilobata, andAtriplex canescens).
Based on the ER-3(7>2 macrofossil assemblage, precipitation at about 45,000 B.P. is inferred to have been no higher than the present values of roughly 185 to 205 rnm/yr1 (table 5). Affinity of the fossil flora to present northern steppe and dry woodland suggests that a smaller

28 VEGETATION AND CLIMATES OF THE LAST 45,000 YEARS, NEVADA TEST SITE
FIGURE 15. -Eleana Range fossil locality: A. Physiography of the Eleana Range-l and 2 sites: B. Modern vegetation at the Eleana Range-l and 2 sites. Sketches by Frederick Paillet, U.S. Geological Survey, 1981. (See fig. 4 for location of sites.)

LATE QUATERNARY VEGETATION AND CLIMATE 29
FIGURE lh. Reconstructions of the Wisconsin vegetation of the Eleana Range: A. Full-glacial (Wisconsin maximum) limber-pine woodland; B. juniper-steppe shrub vegetation during the middle Wisconsin (about 45,000 years ago). Sketches bv Frederick Paillet, U.S. Geological Survey, 1981.
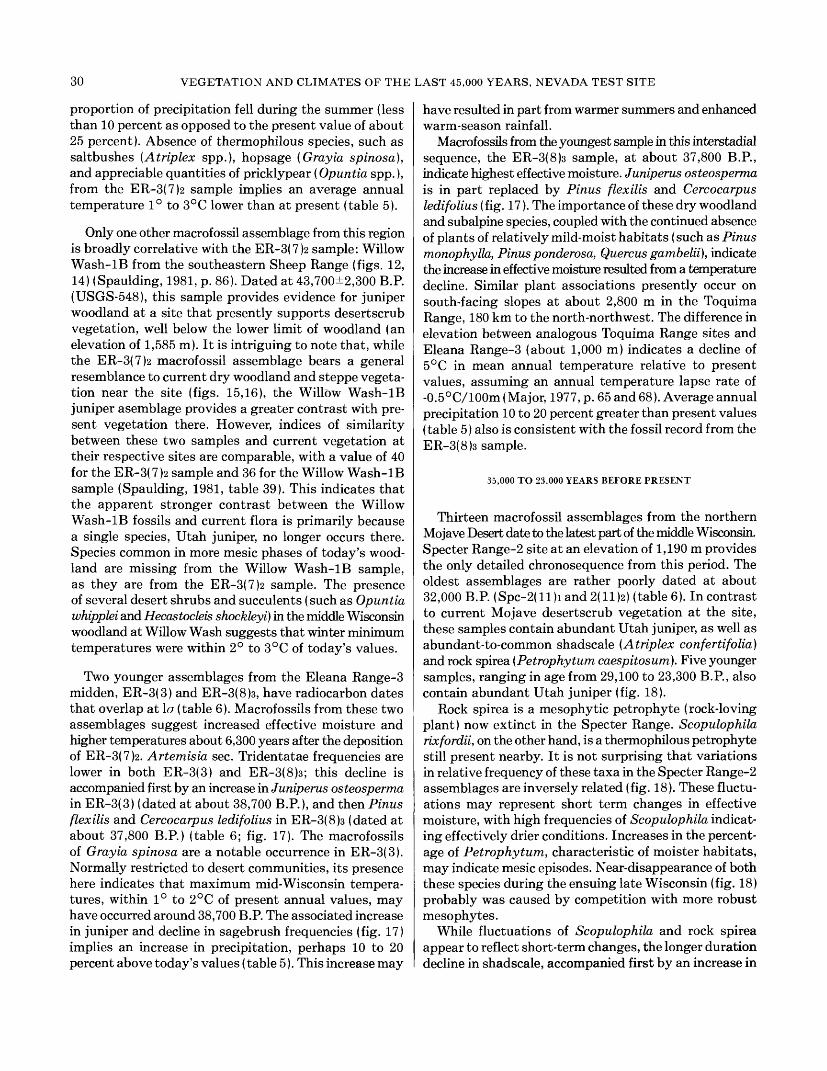
30 VEGETATION AND CLIMATES OF THE LAST 45,000 YEARS, NEVADA TEST SITE
proportion of precipitation fell during the summer (less than 10 percent as opposed to the present value of about 25 percent). Absence of thermophilous species, such as saltbushes (Atriplex spp.), hopsage (Grayia spinosa), and appreciable quantities of pricklypear ( Opuntia spp.), from the ER-3(7)2 sample implies an average annual temperature 1° to 3°C lower than at present (table 5).
Only one other macrofossil assemblage from this region is broadly correlative with the ER-3(7>2 sample: Willow Wash-IB from the southeastern Sheep Range (figs. 12, 14) (Spaulding, 1981, p. 86). Dated at 43,700±2,300 B.P. (USGS-548), this sample provides evidence for juniper woodland at a site that presently supports desertscrub vegetation, well below the lower limit of woodland (an elevation of 1,585 m). It is intriguing to note that, while the ER-3(7)2 macrof ossil assemblage bears a general resemblance to current dry woodland and steppe vegeta tion near the site (figs. 15,16), the Willow Wash-IB juniper asemblage provides a greater contrast with pre sent vegetation there. However, indices of similarity between these two samples and current vegetation at their respective sites are comparable, with a value of 40 for the ER-3(7)2 sample and 36 for the Willow Wash-IB sample (Spaulding, 1981, table 39). This indicates that the apparent stronger contrast between the Willow Wash-IB fossils and current flora is primarily because a single species, Utah juniper, no longer occurs there. Species common in more mesic phases of today's wood land are missing from the Willow Wash-IB sample, as they are from the ER-3(7>2 sample. The presence of several desert shrubs and succulents (such as Opuntia whipplei and Hecastocleis shockleyi) in the middle Wisconsin woodland at Willow Wash suggests that winter minimum temperatures were within 2° to 3°C of today's values.
Two younger assemblages from the Eleana Range-3 midden, ER-3(3) and ER-3(8)s, have radiocarbon dates that overlap at \o (table 6). Macrofossils from these two assemblages suggest increased effective moisture and higher temperatures about 6,300 years after the deposition of ER-3(7)2. Artemisia sec. Tridentatae frequencies are lower in both ER-3(3) and ER-3(8)s; this decline is accompanied first by an increase in Junipems osteosperma in ER-3(3) (dated at about 38,700 B.R), and then Pinus flexilis and Cercocarpus ledifolius in ER-3(8)s (dated at about 37,800 B.P.) (table 6; fig. 17). The macrofossils of Grayia spinosa are a notable occurrence in ER-3(3). Normally restricted to desert communities, its presence here indicates that maximum mid-Wisconsin tempera tures, within 1° to 2°C of present annual values, may have occurred around 38,700 B.P. The associated increase in juniper and decline in sagebrush frequencies (fig. 17) implies an increase in precipitation, perhaps 10 to 20 percent above today's values (table 5). This increase may
have resulted in part from warmer summers and enhanced warm-season rainfall.
Macrofossils from the youngest sample in this interstadial sequence, the ER-3(8)s sample, at about 37,800 B.P., indicate highest effective moisture. Junipems osteosperma is in part replaced by Pinus flexilis and Cercocarpus ledifolius ( fig. 17). The importance of these dry woodland and subalpine species, coupled with the continued absence of plants of relatively mild-moist habitats (such as Pinus monophylla, Pinus ponderosa, Quercus gambelii), indicate the increase in effective moisture resulted from a temperature decline. Similar plant associations presently occur on south-facing slopes at about 2,800 m in the Toquima Range, 180 km to the north-northwest. The difference in elevation between analogous Toquima Range sites and Eleana Range-3 (about 1,000 m) indicates a decline of 5°C in mean annual temperature relative to present values, assuming an annual temperature lapse rate of -0.5°C/100m (Major, 1977, p. 65 and 68). Average annual precipitation 10 to 20 percent greater than present values (table 5) also is consistent with the fossil record from the ER-3( 8)3 sample.
35,000 TO 23,000 YEARS BEFORE PRESENT
Thirteen macrofossil assemblages from the northern Mojave Desert date to the latest part of the middle Wisconsin. Specter Range-2 site at an elevation of 1,190 m provides the only detailed chronosequence from this period. The oldest assemblages are rather poorly dated at about 32,000 B.P. (Spc-2(ll)i and 2(11)2) (table 6). In contrast to current Mojave desertscrub vegetation at the site, these samples contain abundant Utah juniper, as well as abundant-to-common shadscale (Atriplex confertifolia) and rock spirea (Petrophytum caespitosum). Five younger samples, ranging in age from 29,100 to 23,300 B.P., also contain abundant Utah juniper (fig. 18).
Rock spirea is a mesophytic petrophyte (rock-loving plant) now extinct in the Specter Range. Scopulophila rixfordii, on the other hand, is a thermophilous petrophyte still present nearby. It is not surprising that variations in relative frequency of these taxa in the Specter Range-2 assemblages are inversely related (fig. 18). These fluctu ations may represent short term changes in effective moisture, with high frequencies of Scopulophila indicat ing effectively drier conditions. Increases in the percent age of Petrophytum, characteristic of moister habitats, may indicate mesic episodes. Near-disappearance of both these species during the ensuing late Wisconsin (fig. 18) probably was caused by competition with more robust mesophytes.
While fluctuations of Scopulophila and rock spirea appear to reflect short-term changes, the longer duration decline in shadscale, accompanied first by an increase in
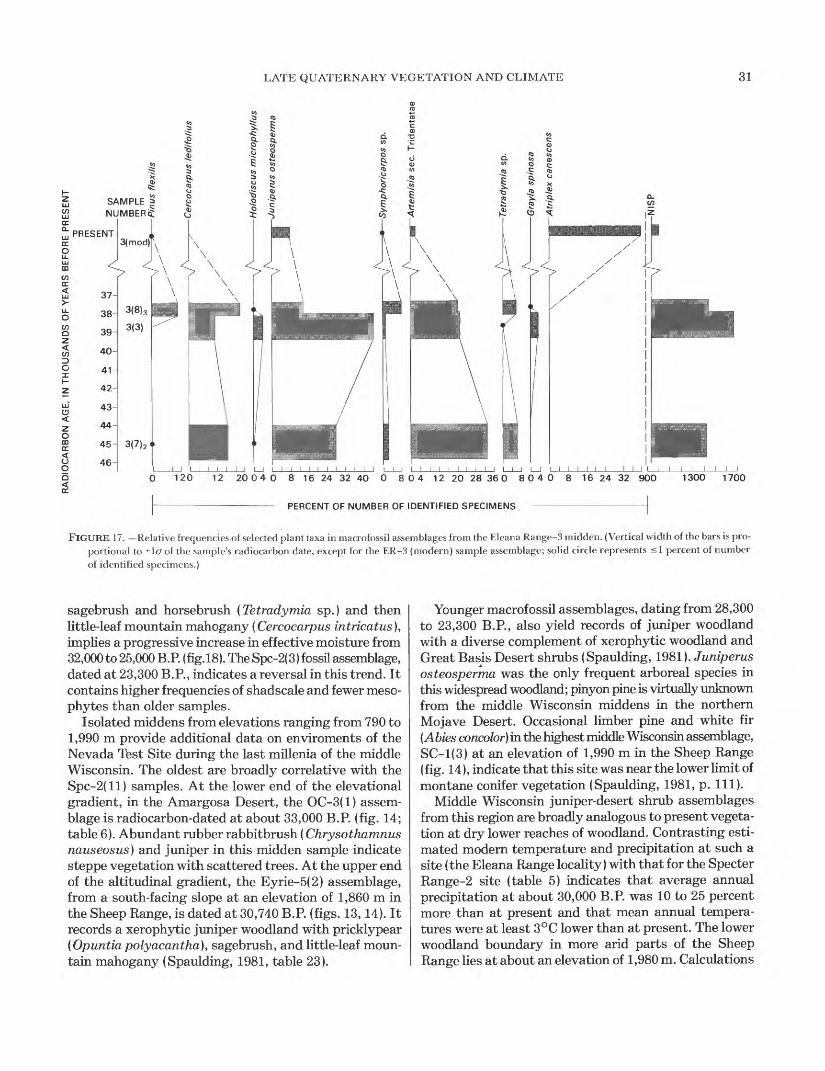
LATE QUATERNARY VEGETATION AND CLIMATE 31
SAMPLE | NUMBERS
PRESENT-
<
37-
38-
39-
40-
42-
43
44-
45-
46-
3(mod)
> *
3(8)3
3(3)
3(7) 2 «
I \ \
^ \ \
]
\ i *120 12 20 0 4 0 8 16 24 32 40 0 804 12 20 28 36 0 8040 8 16 24 32 900
PERCENT OF NUMBER OF IDENTIFIED SPECIMENS
1300 1700
FIGURE 17. Relative frequencies of selected plant taxa in macrofossil assemblages from the Eleana Range-3 midden. (Vertical width of the bars is pro portional to ±\O of the sample's radiocarbon date, except for the ER-3 (modern) sample assemblage; solid circle represents <1 percent of number of identified specimens.)
sagebrush and horsebrush (Tetradymia sp.) and then little-leaf mountain mahogany ( Cercocarpus intricatus), implies a progressive increase in effective moisture from 32,000 to 25,000 B.R (fig.18). The Spc-2(3) fossil assemblage, dated at 23,300 B.R, indicates a reversal in this trend. It contains higher frequencies of shadscale and fewer meso- phytes than older samples.
Isolated middens from elevations ranging from 790 to 1,990 m provide additional data on enviroments of the Nevada Test Site during the last millenia of the middle Wisconsin. The oldest are broadly correlative with the Spc-2(ll) samples. At the lower end of the elevational gradient, in the Amargosa Desert, the OC-3(1) assem blage is radiocarbon-dated at about 33,000 B.R (fig. 14; table 6). Abundant rubber rabbitbrush ( Chrysothamnus nauseosus) and juniper in this midden sample indicate steppe vegetation with scattered trees. At the upper end of the altitudinal gradient, the Eyrie-5(2) assemblage, from a south-facing slope at an elevation of 1,860 m in the Sheep Range, is dated at 30,740 B.R (figs. 13,14). It records a xerophytic juniper woodland with pricklypear (Opuntiapolyacantha), sagebrush, and little-leaf moun tain mahogany (Spaulding, 1981, table 23).
Younger macrofossil assemblages, dating from 28,300 to 23,300 B.P., also yield records of juniper woodland with a diverse complement of xerophytic woodland and Great Basis Desert shrubs (Spaulding, 1981). Juniperus osteosperma was the only frequent arboreal species in this widespread woodland; pinyon pine is virtually unknown from the middle Wisconsin middens in the northern Mojave Desert. Occasional limber pine and white fir (Abies concolor) in the highest middle Wisconsin assemblage, SC-1(3) at an elevation of 1,990 m in the Sheep Range (fig. 14), indicate that this site was near the lower limit of montane conifer vegetation (Spaulding, 1981, p. 111).
Middle Wisconsin juniper-desert shrub assemblages from this region are broadly analogous to present vegeta tion at dry lower reaches of woodland. Contrasting esti mated modern temperature and precipitation at such a site (the Eleana Range locality) with that for the Specter Range-2 site (table 5) indicates that average annual precipitation at about 30,000 B.R was 10 to 25 percent more than at present and that mean annual tempera tures were at least 3°C lower than at present. The lower woodland boundary in more arid parts of the Sheep Range lies at about an elevation of 1,980 m. Calculations
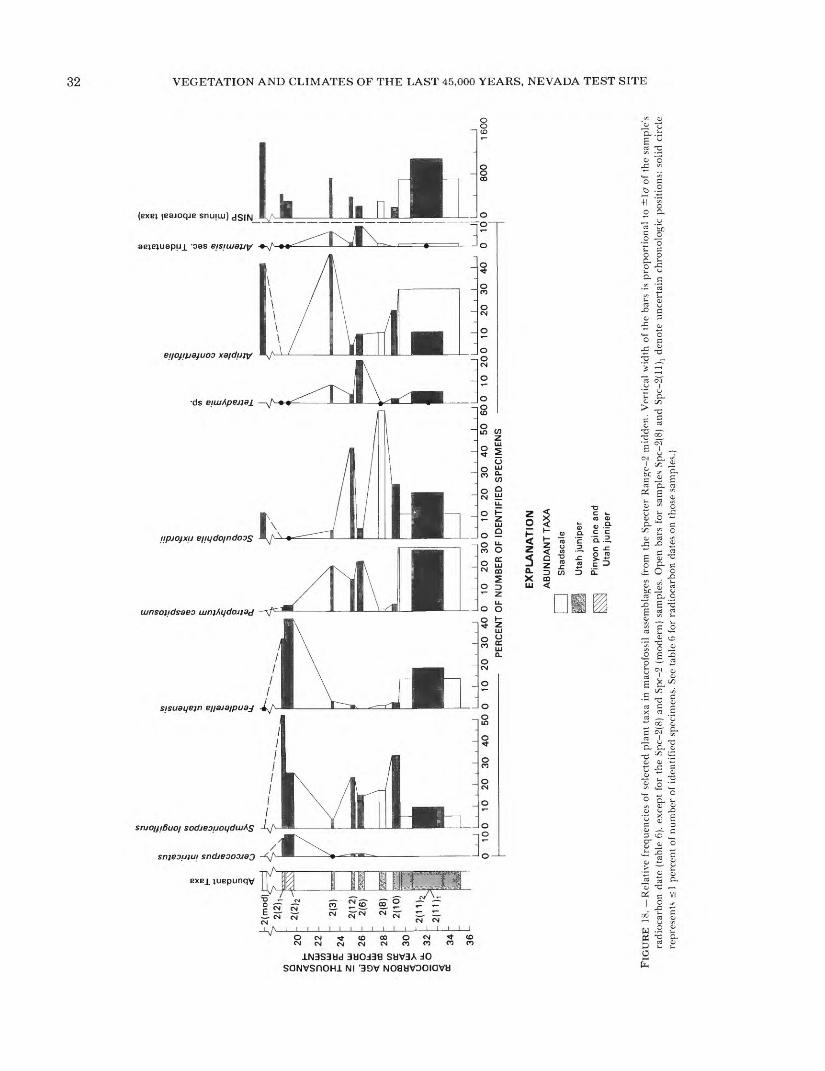
CO to
w
o 7
20
< £
W Z
-j L
U 22
o
wU
Q
J
H E
L 24
Z
LU
«
U.
< s
r. w
DC L
U 3
0
P32
< ^
34
r^fi
" 2(
2)1v
r
- 'K
lz
- 2(
12)
- 2(
6)
- 2(
8)
2(10
)
-2(1
1)r
- _
T\\
\
SB
SS
$$
i'$
.,... ..
?]
i^.)
; - ?
i I
l"}tl
0 100
10
20
30
40
50
0
10
20
30
40
0
10
20
300
10
20
30
40
50
60
0
10
20
0
10
20
30
40
0 1
00
PE
RC
EN
T O
F N
UM
BE
R O
F ID
EN
TIF
IED
SP
EC
IME
NS
80
01
60
0
EX
PL
AN
AT
ION
AB
UN
DA
NT
TA
XA
[__
I S
hads
cale
Uta
h ju
nip
er
KV\\J
P
inyo
n pi
ne a
nd
'^^
Uta
h ju
nip
er
FIG
UR
E 1
8.
Rel
ativ
e fr
eque
ncie
s of
sel
ecte
d pl
ant
taxa
in
mac
rofo
ssil
ass
embl
ages
fro
m t
he S
pect
er R
ange
-2 m
idde
n. V
erti
cal
wid
th o
f th
e ba
rs i
s pr
opor
tion
al t
o ±
la o
f th
e sa
mpl
e's
radi
ocar
bon
date
(ta
ble
6),
exce
pt f
or t
he S
pc-2
(8)
and
Spc
-2 (
mod
ern)
sam
ples
. O
pen
bars
for
sam
ples
Spc
-2(8
) an
d S
pc-2
(ll)
, de
note
unc
erta
in c
hron
olog
ic p
osit
ions
; so
lid
circ
le
repr
esen
ts <
1 pe
rcen
t of
num
ber
of i
dent
ifie
d sp
ecim
ens.
See
tab
le 6
for
rad
ioca
rbon
dat
es o
n th
ose
sam
ples
.)

LATE QUATERNARY VEGETATION AND CLIMATE 33
based on an elevational depression of juniper of 790 m (to the Specter Range-2 site at 1,190 m) and a lapse rate of 0.5°C/100 m yield a ATa value of -4.0°C. However, cal culations based on an elevational depression of 1,190 m to the Owl Canyon locality (790 m) yield a ATa of -6.0°C.
The altitudinal zonation of vegetation in the northern Mojave Desert during the Wisconsin glacial age was unlike zonation that occurs under the present climatic regime. Utah juniper ranged from elevations less than 800 m to at least 2,000 m; xerophytic woodland and steppe shrubs were common associates over much of its 1,200 m altitudinal distribution. Arboreal species that often occur with Utah juniper at present (such as pinyon pine and ponderosa pine at higher elevations) are rarely recorded or completely missing from the fossil record. Trees most commonly associated with juniper in fossil assemblages from the higher altitude Sheep Range sites (Spaulding, 1981) are xerophytic subalpine conifers, bristlecone pine (Pinus longaeva) and limber pine (Pinus flexilis). Present extent of such plant associations in the Sheep Range is compared in figure 19 with their docu mented distribution in the Nevada Test Site area during the middle Wisconsin; the comparison illustrates an appar ent paradox. An increase in effective moisture sufficient to permit Juniperus osteosperma to grow at xeric low- altitude sites like Owl Canyon should have allowed other arboreal species to become successfully established at least at elevations above 1,500 m, assuming that gradi ents of effective moisture were the same then as now. However, xerophytic juniper woodland occurred on moist as well as dry sites to an elevation of at least 1,750 m (figs. 14,19); perhaps lapse rates of precipitation during the Wisconsin were different from present rates.
LATE WISCONSIN ENVIRONMENTS
The late Wisconsin stade of North America, the last period of major continental ice-sheet expansion, is corre lated with oxygen-isotope stage 2 in deep-sea cores, coeval with the late Weichselian and Devensian stades of Eurasia (Bowen, 1978; Flint, 1971). Radiocarbon analyses of sub surface sediments from Searles Lake, California, 160 km southwest of the Nevada Test Site, provide the best independent dates for the duration of this period in the Mojave Desert. The Parting Mud unit of Searles Lake encompasses the entire late Wisconsin; an average of seven radiocarbon dates on disseminated carbon from the bottom 50 cm of the unit is 23,300 ±1,175 B.P. (Stuiver and Smith, 1979, p. 74). Applying a correction factor of -900 radiocarbon years to this age to compensate for low radiocarbon per carbon ratios in high-bicarbonate waters (Peng and others, 1978, p. 327) yields a date of 22,600±1,175 B.P. for initiation of late Wisconsin conditions at Searles Lake. The corrected average of seven radiocarbon dates
from the top of the Parting Mud (Stuiver and Smith, 1979, p. 73), marking the end of late Wisconsin conditions, is 9,600±165 B.P.
VEGETATION
A date of about 22,600 B.P. for the beginning of late Wisconsin environmental conditions in the Mojave Des ert is in accord with packrat-midden evidence from the Nevada Test Site. Although a gradual trend toward more mesophytic vegetation at Specter Range-2 began as early as 26,000 B.P. (fig.18), major biotic turnover from a juniper-shadscale to pinyon-juniper woodland did not occur until after about 23,300 B.P. (sample Spc-2( 3)) (table 6). Indeed, the Spc-2(3) assemblage indicates a reversal to conditions drier than those recorded by sam ple Spc-2(6) dated at about 25,000 B.P, and sample Spc-2(12), dated at about 26,000 B.P. (fig. 18).
The 4,000-year hiatus between sample Spc-2(3) and the late Wisconsin age Spc-2(2) assemblages (figs. 14, 18) provides only a maximum age of 23,300 B.P. for the beginning of the late Wisconsin. No middens from the Nevada Test Site yield additional samples dating to this period except Specter Range-3A. This rather poorly dat ed assemblage (20,200±1,800 B.P.) (table 6) yields no evidence for a major vegetation change. Samples from the South Crest midden in the Sheep Range, a xeric site at an elevation of 1,990 m (fig. 12) document a transition from juniper to subalpine-conifer woodland prior to 21,700±500 B.P. (fig. 14) (Spaulding, 1981, p. Ill, fig. 27). This change, from a xerophytic juniper woodland to one apparently dominated by bristlecone pine (Pinus longaeva) and limber pine (Pinus flexilis), marks the initiation of a stadial climatic regime. Hence, packrat middens provide bracketing radiocarbon dates of 23,300 and 21,700 B.P. for the beginning of late Wisconsin climatic conditions in the vicinity of the Nevada Test Site.
The Wisconsin maximum, or full glacial, is dated at about 18,000 B.P. (CLIMAP, 1976), although local glacial maxi ma varied by several thousand years (Gates, 1976, p. 1138; Bowen, 1978). In the Sheep Range, there were two periods when subalpine vegetation occurred below 2,000 m; either (or both) could represent the full glacial. The first, recorded by packrat middens from the South Crest and Eyrie localities in the Sheep Range, ended by 19,000 B.P. The second, with midden evidence from the Eyrie and Deadman localities in the Sheep Range, occurred between 18,600 and 16,800 B.P. (fig. 14) (Spaulding, 1981, fig. 27). The magnitude of the latter event appears to have been great; at the Eyrie and Deadman sites, there were changes from xerophytic vegetation charac terized by Utah juniper and pricklypear cacti ( Opuntia polyacantha and Opuntiaphaeacantha) to subalpine veg etation dominated by limber and bristlecone pine (Spaulding, 1981, tables 23 and 24) (fig. 14).

34
300CM
2500
2000
1500
VEGETATION AND CLIMATES OF THE LAST 45,000 YEARS, NEVADA TEST SITE
14). They may conflict with evidence for extensive, xero- phytic juniper woodland at higher elevations in the region. A mesophytic pinyon-juniper association at the Specter Range-2 site (an elevation of 1,190 m) contrasts with late Wisconsin-age plant fossil assemblages commonly lack ing pinyon pine from elevations 1,500 to 1,970 m in the Sheep Range (fig. 14). The cause of this anomaly is not readily apparent.
The Eleana Range-2 packrat midden spans most of the last one-half of the late Wisconsin from 17,100 to 10,600 B.R Samples older than 13,000 B.R document a limber-pine woodland that contrasts with both older middle Wisconsin records from the Eleana Range-3 site and present desertscrub and sparse woodland at the locality (figs. 15,16). Changes in macrofossil frequencies toward the end of the limber-pine phase at Eleana Range-2 appear to reflect late-glacial climatic change. A trend toward effectively drier conditions is indicated by the decline of silvery-lupine (Lupinus cf. argenteus) and fern- bush ( Chamaebatiaria millefolium), two extralocal shrubs, accompanied by increasing relative frequencies of the xerophytic shrub, dwarf-goldenweed (Haplopappus nanus) (fig. 20). Decreasing relative percentages of plants typical of current Great Basin steppe (Artemisia sec. Tridentatae, Tktradymiasp., Chrysothamnus spp.) accom pany these changes. This trend may have started as early as 16,000 B.R and appears to have been well underway by 13,000 B.R Variations in percentages of mountain mahogany ( Cercocarpus ledifolius) may represent rever sals, when available moisture was somewhat higher (fig. 20). These data are in general accord with the record from Searles Lake (fig. 1), indicating a change at about 16,200'B.R (corrected date) from a lake at its maximum expansion to one undergoing dessication, with some reversals (Smith, 1979, p. 111).
The trend of increasingly xerophytic vegetation at Eleana Range-2 culminated in a profound change between 13,200 and 11,700 B.R Limber pine-shrub woodland gave way to a community apparently dominated by Utah juniper, pinyon pine, and pricklypear (Opuntia polyacantha) (fig. 20). This transformation from a plant association with subalpine and steppe affinities to one resembling modern woodland in nearby mesic habitats signals the end of Wisconsin vegetation conditions at this site. Indices of similarity (fig. 21) show that latest Wisconsin ER-2(1) and 2(2) assemblages have many more species in common with current vegetation than do the middle Wisconsin samples from the nearby Eleana Range-3 site. Presumably this reflects a fundamental alteration of the regional climate. Climate during the
Specter Range-2 midden samples recording a meso- terminal Wisconsin, although somewhat more mesic than phytic pinyon-juniper woodland between 19,300 and 18,700 the present, was quite unlike the climate of either the B.R (fig. 18) do not appear to correspond to either period middle Wisconsin interstadial or most of the late Wiscon- of lowered subalpine vegetation in the Sheep Range (fig. sin stadial.
1000
MESIC XERIC MESIC XERIC
500^
FIGURE 19. Distribution of middle Wisconsin juniper-shrub macro- fossil assemblages compared to the modern extent of similar associa tions in the Sheep Range. Abbreviations for the fossil sites are: BH, Black Hills; Ey, Eyrie; OC, Owl Canyon; SC, South Crest; Spc, Specter Range; WC, Wagon Canyon; WW, Willow Wash. Abbreviations for the modern plant-community types are: SC, subalpine-conifer wood land; F-P, white fir-pondei-osa pine (Abies concolor-Pinus ponderosa) forest; EC, evergreen sclerophyll chaparral; P-J, pinyon-juniper woodland; DS, desertscrub. Stippled pattern shows distribution of similar assemblages during the middle Wisconsin and present day.

PR
ES
EN
T
o
c uj
O
ER 3
(m)
- E
R2
(1)
ER
2(2
)
- ER
2(3
) E
R2(
4)
ER
2(5)
= E
R2(
6)
ER
2(7)
- E
R2(
9)
- E
R2
(10
O
M S3 H I-H O
CO
NC
EN
TR
AT
ION
, IN
GR
AM
S P
ER
K
ILO
GR
AM
PE
RC
EN
T O
F N
UM
BE
R O
F S
PE
CIM
EN
SN
UM
BE
R O
F
MA
CR
OF
OS
SIL
S
FIG
UR
E 2
0. -
Abundan
ce o
f se
lect
er p
lant
tax
a in
mac
rofo
ssil
ass
embl
ages
fro
m t
he E
lean
a R
ange
-2 (
ER
-2)
mid
den.
A m
oder
n sa
mpl
e fr
om t
he n
earb
y E
lean
a R
ange
-3 (
ER
-3)
site
is
pres
ente
d at
the
top
for
com
pari
son.
Con
cent
rati
on v
alue
s fo
r th
e tr
ee s
peci
es a
re g
ram
s of
fos
sils
of
a gi
ven
taxo
n pe
r ki
logr
am o
f so
rted
mat
rix.
Abu
ndan
ce v
alue
s of
the
rem
ains
of
shr
ub a
nd s
uccu
lent
spe
cies
are
pre
sent
ed a
s pe
rcen
tage
s of
NIS
P-A
T (
Num
ber
of i
dent
ifie
d sp
ecim
ens
excl
udin
g ar
bore
al t
axa)
. S
olid
cir
cle
repr
esen
ts <
1 pe
rcen
t of
num
ber
of i
dent
ifie
d sp
ecim
ens.
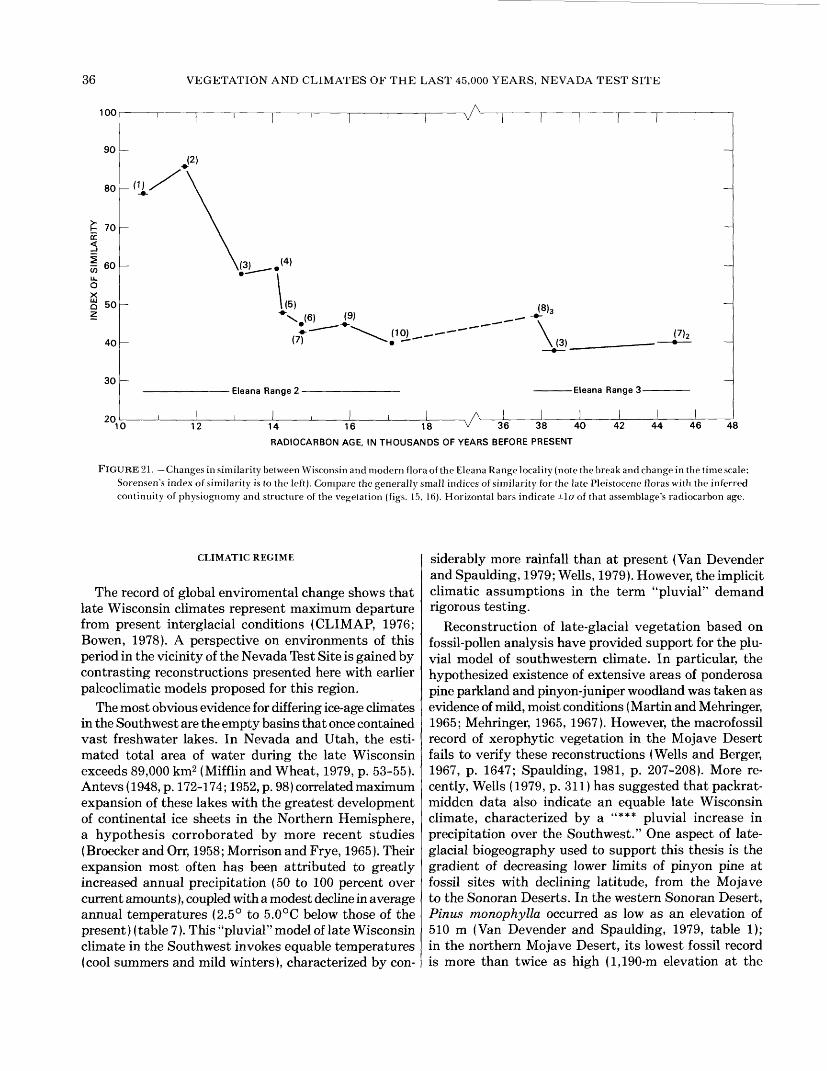
36 VEGETATION AND CLIMATES OF THE LAST 45,000 YEARS, NEVADA TEST SITE
100
(8) 3
Eleana Range 3-
2010 12 14 16 18 V 36 38 40
RADIOCARBON AGE, IN THOUSANDS OF YEARS BEFORE PRESENT
42 44 46 48
FIGURE 21. Changes in similarity between Wisconsin and modern flora of the Eleana Range locality (note the break and change in the time scale; Sorensen's index of similarity is to the left). Compare the generally small indices of similarity for the late Pleistocene floras with the inferred continuity of physiognomy and structure of the vegetation (figs. 15, 16). Horizontal bars indicate ±l<7of that assemblage's radiocarbon age.
CLIMATIC REGIME
The record of global enviromental change shows that late Wisconsin climates represent maximum departure from present interglacial conditions (CLIMAP, 1976; Bowen, 1978). A perspective on environments of this period in the vicinity of the Nevada Test Site is gained by contrasting reconstructions presented here with earlier paleoclimatic models proposed for this region.
The most obvious evidence for differing ice-age climates in the Southwest are the empty basins that once contained vast freshwater lakes. In Nevada and Utah, the esti mated total area of water during the late Wisconsin exceeds 89,000 km2 (Mifflin and Wheat, 1979, p. 53-55). Antevs (1948, p. 172-174; 1952, p. 98) correlated maximum expansion of these lakes with the greatest development of continental ice sheets in the Northern Hemisphere, a hypothesis corroborated by more recent studies (Broecker and Orr, 1958; Morrison and Frye, 1965). Their expansion most often has been attributed to greatly increased annual precipitation (50 to 100 percent over current amounts), coupled with a modest decline in average annual temperatures (2.5° to 5.0°C below those of the present) (table 7). This "pluvial" model of late Wisconsin climate in the Southwest invokes equable temperatures (cool summers and mild winters), characterized by con
siderably more rainfall than at present (Van Devender and Spaulding, 1979; Wells, 1979). However, the implicit climatic assumptions in the term "pluvial" demand rigorous testing.
Reconstruction of late-glacial vegetation based on fossil-pollen analysis have provided support for the plu vial model of southwestern climate. In particular, the hypothesized existence of extensive areas of ponderosa pine parkland and pinyon-juniper woodland was taken as evidence of mild, moist conditions (Martin and Mehringer, 1965; Mehringer, 1965, 1967). However, the macrofossil record of xerophytic vegetation in the Mojave Desert fails to verify these reconstructions (Wells and Berger, 1967, p. 1647; Spaulding, 1981, p. 207-208). More re cently, Wells (1979, p. 311) has suggested that packrat- midden data also indicate an equable late Wisconsin climate, characterized by a "*** pluvial increase in precipitation over the Southwest." One aspect of late- glacial biogeography used to support this thesis is the gradient of decreasing lower limits of pinyon pine at fossil sites with declining latitude, from the Mojave to the Sonoran Deserts. In the western Sonoran Desert, Pinus monophylla occurred as low as an elevation of 510 m (Van Devender and Spaulding, 1979, table 1); in the northern Mojave Desert, its lowest fossil record is more than twice as high (1,190-m elevation at the

LATE QUATERNARY VEGETATION AND CLIMATE 37
TABLE 7. Paleoclimatic reconstructions for the full-glacial period of the American Southwest\ATa , changes in °C (degrees Celsius) in annual temperature; ATS changes in °C in summer temperature; ATW , changes in °C in winter temperature; AP, change in annual
precipitation in cm IcentimetersI; P, AP/modern P; %E (evaporation), /IB/modern E]
Author
Antevs (1952)
Antevs (1954)
Bachhuber and McClellan ( 1977 )
Brakenridge (1978)
Broecker and Orr (1958)
Galloway (1970)
Leopold (1951)
Mifflin and Wheat (1979)
Reeves (1966)
Snyder and Langbein (1962)
Van Devender ( 1973 )
'Minimum estimate.2State-wide average.
Data base
Hydrologic budgets
Relict snowlines
Foraminiferdistributions
Relict cirques andcryogenic deposits
Hydrologic budgets
?Solifluctiondeposits
Hydrologic budgetsand snowlinechanges
Hydrologic budgets
Hydrologic budgets
Hydrologic budgets
Packrat middens
Location
Lake Lahontan, Nevada
North-central New Mexico
Lake Estancia, New Mexico
Montana to Arizona(lat 45°40'N to 33°20'N)
Lake Lahontan, Nevada
Sacramento Mountains,New Mexico
Lake Estancia, New Mexico
Nevada, state-wide
Llano Estacado, west Texas
Lake Spring, Nevada
Western Arizona
ATQ ATS ATU,
-2. 5 to -3.0
-5.6 -9.7
1-7.0
-5.0
-10.5 -10.0
-6.6 -9.0 -2.8
-2.8
-5.0 -8.0 3-5.0 4_ 7 .2
_3.0to -3.9
AP
+ 8 to+ 16
+ 23
0
+21-4.6
+ 18 to+ 25
+ 8.4 to+ 24
+ 39
+ 20
+ 12. 3 to+ 22.0
%P
50 to100
0
80
50 to70
268
89
67
%E
-31
-39 to^6
-10
-27
-30
Extrapolated by Morrison (1965); Schumm (1965); and Mifflin and Wheat (1979).4 Extrapolated by Schumm (1965) and Bnjckenridge (1978).
Specter Range-2 site)2 , and it was uncommon below 1,550 m (Spaulding, 1976, p. 160) (fig. 14). Spaulding and others (1983) decline to accept Wells' (1979, p. 324) hypothesis that this vegetation gradient represented "*** pluvially increased summer rain***"; instead, they propose that it was caused by the near-absence of summer rain north of about lat 36°N. A second argument advanced by Wells (1979, p. 320) to support the model of an "equable glaciopluvial" is that: "In the Mojave Desert province, the upper part of the Pleistocene woodland zone was similar to the more mesic phases of the existing pinyon-juniper woodland*** (Wells and Berger, 1967)." The only macrofossil record of mesic pinyon-juniper woodland north of lat 35°N. reported by Wells and Berger (1967, table 1) is of apparent early-Holocene age (9,450±90 B.P.) and is largely irrelevant to the discus sion of late Wisconsin climates. Based on an analysis of over 30 Wisconsin-age assemblages, Spaulding (1981, p. 184) notes that pinyon and other mesophytic woodland plants are actually rare or missing from glacial-age wood land vegetation in the northern Mojave.
The paleoecological record from the Nevada Test Site and vicinity reveals a late Wisconsin vegetation dominated by plant species adapted to relatively cold, dry environments.
2Recent (October 1983) discovery of pinyon pine (Pinus monophylla) in a midden from the Stripped Hills, about 10 km west of the Specter Range-2 site, establishes a lower elevational record of 1,090 m for this species in the northern Mojave Desert.
There is no evidence for the presence of frost-sensitive desert plants, such as creosote bush, desert spruce, or white bursage, even at lowest elevation sites. Also, at higher elevations, there are few glacial-age fossils of plants characteristic of moist, temperate environments, such as ponderosa pine, Gambel oak, or Rocky Mountain juniper (Juniperus scopulorum). Instead, there was a zone of xerophytic pygmy-conifer woodland dominated by Utah juniper and, on rare occasion, single-needle pinyon pine and juniper together, from the lowest elevation sites up to elevations of between 1,800 and 2,000 m. A zone of subalpine conifer woodland characterized by limber pine on volcanic rocks, and limber pine and bristlecone pine together on calcareous substrate, occurred above an elevation of about 2,000 m (fig. 14) (Spaulding, 1981). Great Basin Desert and steppe shrubs, such as sage brush, horsebrush ( Tetradymia sp.), and rabbittbrushes ( Chrysothamnus spp.) were widespread in both types of woodland. There is no evidence for the distinct zone of mesophytic montane conifers (dominated by Pinus, ponderosa, Abies concolor, and Juniperus scopulorum} that currently separates pygmy conifer from subalpine woodland (fig. 14). These macrofossil data indicate a climate quite unlike that stipulated by pluvial models.
Lower limits of woodland plant species were depressed during the Wisconsin, although the amount of elevational displacement varied among different taxa (fig. 22). Minimum- displacement estimates for the two conifers most common

38 VEGETATION AND CLIMATES OF THE LAST 45,000 YEARS, NEVADA TEST SITE
MINIMUMDISPLACEMENT
(METERS)
1070
FOSSIL OCCURRENCES ( ) AND PRESENT RANGE ( )
> «j> {§) > ) Pinus flexilis
580 > P. longaeva
P. ponderosa
-720 ® ) Abies coneolor
-770 Pinus monophylla
-1200 Juniperus osteosperma
-1150 /7//>es cf. velutinum
-670
-690
) Symphoricarpos cf. longiflorus
Fallugia paradoxa
320 <§ Atriplex confertifolia
LU LU c rr\ 1 3
D U. Z O
L J.J
500 1000
CURRENT ELEVATIONAL RANGE
1500 2000
ELEVATION, IN METERS
EXPLANATION
WISCONSIN FOSSIL RECORDS OF SELECTED TREES AND SHRUBS
2500 3000
® TWO OR MORE FOSSILRECORDS AT A GIVEN ELEVATION
FIGURE 22. Current elevational range and Wisconsin fossil records of selected trees and shrubs; estimates of minimum displacement are to the left and (except for Atriplex confertifolia) are the elevation of a species' lowest fossil record subtracted from the elevation of its present lowest occurrence. All sites are north of lat 36°20' N. and south lat 37° N., west of long 115° W. and east of long 117°W., on calcareous substrate only.
in the late Wisconsin vegetation of southern Nevada, limber pine and Utah juniper, are among the greatest estimates; both occurred more than 1,000 m below their current lower limits. If it is assumed that the lower limit of these two species is determined by evapotranspirational stress caused by high summer temperatures, lapse-rate calculations can be used to derive estimates of full-glacial summer temperature declines (ATS }. Studies by Major (1977 p. 65) of present-day temperature regimes in arid and semi-arid mountains of California indicate summer lapse rates of -0.6 to -0.75°C/100 m. Applying these rates to displacement values for juniper and limber pine yields minimum estimates of ATS of about -6° to -9°C
(table 8). The range of overlap of values for the two species is from about -7° to -8°C.
Relative decline of full-glacial winter temperatures ( ATW ) is a critical parameter in these reconstructions. A modest ATW of, say, -3.0°C would indicate an equable temperature regime with a low annual range of variation and a modest estimate of mean annual temperature decline. However, the marked lack of thermophilous plant species in even lowest elevation middens provides a strong argument against a conservative estimate of ATW . An example is creosote bush, which, according to Beatley (1974, table 1), is excluded from sites with mean minimum temperatures lower than -1.4°C, and sites with extreme minimum

LATE QUATERNARY VEGETATION AND CLIMATE 39
TABLE 8. Estimates of minimum displacement of Utah juniper and limber pine and resultant calculations of the full-glacial decline in summer temperatures for southern Nevada
[Lowest elevation fossil record for Juniperus osteosperma is from Mehringer (1967); lowest record for Pinus flexilis is from Spaulding (19811. V Ts , relative decline in full-glacial summer temperatures; °C. degrees Celsius; m, meter]
SpeciesLowest fossil site;
elevationPresent
lower limitMinimum
displacement
Juniperus osteosperma
Pinus flexilis
Tule Springs, Las Vegas 1,900 m 1,200 m Valley; 700 m
Willow Wash-4, Sheep Range; 2,650 m 1,065 m 1,585 m
Lapse rate calculations of A Ts
Lapse rate1 (°C/100m)
-0.60- .70- .75- .60- .70- .75
Minimum displacement
1,200 m1,200 m1,200 m1,065 m1,065 m1,065 m
ATS
-7.2°C-8.4°C-9.0°C-6.4°C-7.5°C-8.0°C
iValues from Major (1977).
TABLE 9. Range of minimum temperature values at 39 sites presently supporting creosote bush (Larrea divaricata), and estimates of the minimum decline in late Wisconsin winter temperatures necessary to exclude that species from all sites
\ATia, postulated minimum relative decline in full-glacial winter temperature; °C, degrees Celsius; data are fromBeatley (1974, table 1|]
Mean Minimum Temperatures
Lowest value (A) -1.4°C(site34)
Highest value (B) 4.5°C (site 5)
ATW (A-B) -5.9°C
Mean of Extreme Minimum Temperatures
Lowest value (A) -16.8°C (site 34)
Highest value (B) -10.8°C (site 15)
ATW (A-B) -6.0°C
temperatures below -16.8°C (table 9). Because a ATW of less than -6.0°C would leave some low-elevation sites in the region with mean minima above -1.4°C (as measured by Beatley's method) and not exclude Larrea divaricata from the study area, full-glacial decline in winter temperatures must have exceeded that value (table 9).
Shadscale (Atriplex confertifolia] was widespread in the late Wisconsin juniper woodlands of southern Nevada. It occurred at higher elevations than it does today, probably in response to the absence of potential competitors that appear to determine its present upper limits (Spaulding, 1981, p. 205). There is little fossil evidence for desertscrub species that occur at intermediate elevations above shadscale today, and the glacial-age juniper woodland seems to have been less diverse than present vegetation at the fossil sites (Spaulding, 1981, p. 194-199). This apparent decrease in floristic diversity is attributed to winter temperatures lower than those indicated by models of equable late-glacial climates. Expansion of shadscale, today typical of the most frigid desert habitats in the vicinity of the Nevada Test Site (Beatley, 1974, 1975), provides strong qualitative support for a relatively large decline in late Wisconsin winter temperatures and a fairly arid precipitation regime.
Averaging these minimum estimates of ATS and ATW yields a minimum value of about -7°C for the decline of mean annual temperature (ATa ) during the late Wisconsin. Subtracting this estimate of ATa from the current mean annual temperature at the lowest elevation fossil locality, Owl Canyon at 795 m, yields a range of temperature values (10° to 11°C) characteristic of the lower reaches of modern woodland in the region (table 5). This is in agreement with glacial-age macrofossil assemblages from low-elevation sites dominated by dry-woodland and cold- desert plants.
Reconstruction of the late Wisconsin precipitation regime of the Nevada Test Site and vicinity begins with estimates of seasonally. The late-glacial flora indicates a pronounced absence of summer rain. The abundance of Great Basin Desert taxa and scarcity of plants that today appear to require at least some summer moisture (such as Quercus spp., Coleogyne ramosissima) indicates the contribution of warm-season rainfall was less than 10 percent of the annual total. This is not unexpected because, during a glacial climatic regime, lowered temperatures would tend to suppress development of subtropical high-pressure systems presently responsible for winds that bring summer rains to the monsoonal Southwest (Van Devender and

40 VEGETATION AND CLIMATES OF THE LAST 45,000 YEARS, NEVADA TEST SITE
Wiseman, 1977) and impede development of surface low- pressure systems that draw maritime air northward from the Gulf of California (Huning, 1978, p. 80).
The late Wisconsin flora of the northern Mojave Desert provide no evidence for the drastic relative increase in annual precipitation (in excess of 50 percent above present values) proposed by some authors (table 7). At this point, general analogs seem to provide the best approach for deriving estimates of full-glacial precipitation. In the White Mountains of California (fig. 1), average annual precipitation (Pa ) near the lower limit of subalpine (limber pine) woodland (at about 2,800 m) (Mooney and others, 1962, fig. 4) is calculated to be about 300 mm, based on a value of 350 mm/yr 1 at the Crooked Creek Research Station (at an elevation of 3,096 m) (La Marche, 1973, p. 635), and a local precipitation lapse rate of 17 mm/100 m (Major, 1977, p. 66). Assuming this value (300 mm) approximates average annual precipitation during the full glacial at the Eleana Range locality, the estimated relative increase of Pa is 33 to 39 percent above today's amounts (table 5). This modest increase is supported by two tree-ring chronologies from the Eleana Range-2 packrat midden (fig. 23). Annual-ring widths of these two radiocarbon-dated limber pine specimens are extremely small, averaging less than 0.2 mm. It is unlikely that such sensitive tree rings would have been produced except by trees under appreciable stress. Estimates of relative increase in precipitation of less than 40 percent also are consistent with the full-glacial record of pinyon-juniper woodland at the Specter Range-2 site. A 30 to 40 percent increase over today's amounts (table 5) would result in values estimated to be between 226 and 265 mm/yr 1 . Present precipitation at Ely, Nevada, which lies at the lower limit of pinyon-juniper woodland, is 221 to 245 mm/yr1 (table 4).
THE TRANSITION PERIOD
Several authors (Wright, 1976; Davis, 1981; Watts, 1980) have emphasized the time-transgressive nature of vegetation change at the end of the last glacial age in other parts of the continent; this also appears to have been the case in the Mojave Desert. Contrary to the assertion of Van Devender and Spaulding (1979, p. 709), the packrat-midden record provides no evidence for contemporaneous vegetation change at all sites at about 11,000 years ago (Spaulding, 1983, p. 256). Because synchroneity of vegetation change is not evident, there is a need for arbitrary time lines. The conventional dates of 10,000 B.P. for the end of the Wisconsin and 8,000 B.P. for the end of the early Holocene are adopted here.
MAJOR VEGETATION CHANGES
The latest Wisconsin (12,000 to 10,000 B.P.) vegetation at the Eleana Range-2 site was dominated by plants that presently occur nearby although a greater variety of mesophytes occured, including some full-glacial relicts. The abundance of pinyon pine and Utah juniper in ER-2( 2) and 2( 1) also indicates a denser vegetation than exists at the site today. Progressive desertification after about 10,600 B.P. caused opening of the pinyon-juniper woodland and final extirpation of such extralocals as limber pine and curl-leaf mountain mahogany.
Development of postglacial woodland at the Eleana Range occurred between about 13,200 and 11,700 B.P. This is surprisingly early, relative to the date of about 11,000 B.P. for the end of Wisconsin vegetation conditions throughout the Southwest suggested by Van Devender and Spaulding (1979, p. 706). However, the Eleana Range record agrees with many glacial, oxygen-isotope, and pollen chronologies that show impact of increasing northern- hemispheric temperatures by at least 12,000 B.P. (Dansgaard and others, 1971; Porter, 1971; Barnosky, 1981; Mehringer, 1967). The maximum of northern hemisphere summer insolation was reached by about 11,000 B.P. (Broecker and van Donk, 1970, fig. 10; Ruddiman and Mclntyre, 1981, fig. 2). Thus, an early date for the response of vegetation at the Eleana Range-2 site to a warming climate is not unexpected, particularly if species such as limber pine were near the limits of their environmental tolerance here during late Wisconsin time.
An early change to postglacial vegetation conditions also took place at low elevations on the periphery of the Amargosa Desert. The Point of Rocks midden records (at elevations ranging from 900 to 930 m) indicate that, at least at some sites, woodland gave way to desertscrub prior to 14,800 B.P. The surprisingly early dates for desert vegetation at the Point of Rocks-3 site (14,800 B.P.) and at the Point of Rocks-1 site (11,800 B.P.), indicates that woodland vegetation was not continuous below an elevation of about 1,000 m after about 15,000 years ago (Spaulding, 1983). Instead, low elevations in the vicinity of the Nevada Test Site may have supported a mosaic of woodland, occupying mesic habitats, and desertscrub on xeric sites.
In contrast to the early records of shrub vegetation in the lowlands, middens from higher elevation desert sites show that juniper woodland persisted as late as 9,400 B.P. in the Sheep Range (Spaulding, 1981, p. 191) and 7,800 B.P. in the Spotted Range (Wells and Berger, 1967, table 1). These localities were in the upper part of the late Wisconsin zone of pygmy-conifer woodland (above an elevation of 1,200 m) (fig. 14). Effective moisture was sufficient at such higher altitudes to maintain xerophytic

LATE QUATERNARY VEGETATION AND CLIMATE 41
SAMPLE ER 2(5): 14,260±110 YEARS BEFORE PRESENT
10 20 30 40 50 60 70 80 90 100 110 120 130
SAMPLE ER2I4): 1 5,300±1 30 YEARS BEFORE PRESENT
50 60
TREE-RING YEAR
100 110 120
FIGURE 23. Tree-ring chronologies from two limber-pine specimens from the Eleana Range-2 (ER-2) midden. (The radiocarbon date for each specimen also is shown; table 6.) The specimens are tied neither to a calendar year nor to the relative age of the tree and the time scale at the bottom is for illustrative purposes only. Cross-dating is not implied by the superposition of those two chronologies. Analysis by Harriet Garfinkel. Lincoln Laboratory, Massachusetts Institute of Technology.
woodland species after they had been extirpated from the lowlands.
An insight into the dynamics of vegetation change at the end of the glacial age is provided by contrasting similarity indices for midden samples from Owl Canyon and the Eleana Range. Macrofossil assemblages from the Owl Canyon-2 midden document vegetation conditions after juniper woodland gave way to desertscrub, and the two youngest assemblages from Eleana Range-2, after limber pine gave way to pinyon-juniper woodland. However, similarity coefficients between Owl Canyon-2 assemblages and the present vegetation at the Owl Canyon-2 site are less than 10, while those comparing ER-2(1) and 2(2) samples to the modern vegetaion exceed 70 (see Supple mental Data section) (fig. 21). The Eleana Range locality was near the upper limit of late Wisconsin pygmy-conifer woodland (fig. 14); plants such as juniper, pinyon pine, and pricklypear reached the Eleana Range-2 site soon after the triggering climatic change. However, thermophilous shrubs that typify present vegetation at Owl Canyon (such as creosote bush, desert spruce, and white bursage) were apparently absent from the region during the late Wisconsin. The dissimilarity between the latest Wisconsin and modern flora at Owl Canyon is thus ascribed, in large part, to lag time in northward migration of warm- desert shrubs.
The major vegetation change in the region at the end of the last glacial age, from subalpine-conifer to pinyon- juniper woodland and, at lower elevations, from pygmy- conifer woodland to desertscrub, occurred at different times at different sites (fig. 14). An important variable that affected the timing of major vegetation change, exclusive of the timing of the forcing climatic change, was the position of the fossil site relative to the environmental tolerance of species growing there. Middens from xeric sites near the lower limit of a given vegetation zone (such as Owl Canyon, Point of Rocks, or the Eleana Range) record relatively early response to postglacial warming. Records from mesic sites, and from higher elevations within a given vegetation zone, are not as sensitive and document less vegetation response until the climate change had progressed quite far.
Desert vegetation took at least 6,000 years to spread over most of its present elevational range (fig. 14). In the northern Mojave, the transformation from woodland to desertscrub was nearly complete by about 9,000 B.P. These findings diverge from the model proposed by Van Devender (1977b, p. 190-191; Van Devender and Spaulding, 1979, p. 708) indicating that widespread woodland per sisted throughout the early Holocene in most of the Mojave Desert, abruptly giving way to desertscrub at about 8,000 B.P. Early Holocene woodlands probably

42 VEGETATION AND CLIMATES OF THE LAST 45,000 YEARS, NEVADA TEST SITE
were more widespread farther south in the current Sonoran Desert.
Both final desiccation of the vast inland lakes of the Great Basin and ultimate demise of woodland vegetation in desert lowlands occurred between 10,000 and 8,000 years ago. At Searles Lake, desiccation was complete by about 9,600 B.P., the end of a period of declining lake levels that, with one major reversal, began as early as 16,200 B.P. (Smith, 1979, fig. 41; Peng and others, 1978, p. 325). In the vicinity of the Nevada Test Site, anomalous desertscrub vegetation had replaced woodland at most sites below an elevation of 1,600 m by about 9,000 B.P. (fig. 14). Anomalous desertscrub is a general term applied to past plant associations characterized by extralocal shrubs and succulents that also lack important elements of modern vegetation. Late Wisconsin and early Holocene middens from the periphery of the Amargosa Desert, and the Eureka Valley, document such vegetation (fig. 14). Most shrub species abundant in the Point of Rocks, Owl Canyon-2, and Last Chance Range midden assemblages (at elevations between 800 and 960 m) typify present vegetation at elevations between 1,400 and 2,000 m.
It is not known when anomalous desertscrub vegetation gave way to plant communities characteristic of the present vegetation at the Amargosa Desert sites. At the Eureka Valley locality, 160 km to the northwest, final development of current plant associations was delayed until after 5,000 B.P. (fig. 24). The lag in this development, from the time of extirpation of woodland to establishment of desertscrub vegetation similar to today's, resulted in part from the time it took for warm-desert species to migrate northward. Expansion of these shrubs to more northerly latitudes probably began before 10,000 B.P.; middens in the Amargosa Desert provide the earliest evidence for their arrival in the vicinity of the Nevada Test Site. Assemblages from Point of Rocks-1 and 2 sites, dating between 10,000 and 9,000 B.P., are the oldest to contain such xerophytes as creosote bush (Larrea divaricata) and chaff-bush (Amphipappus fremontii). Creosote bush does not appear in the Eureka Valley record until about 5,500 B.P., and chaff-bush does not appear until 1,500 B.P. (fig. 24). Prior claims for the presence of creosote bush of Wisconsin age in the northern Mojave Desert (Spaulding, 1976, p. 160; 1980, p. 89) must await confirmation by radiocarbon dates run directly on those fossil remains. Until such tests are made, these earlier records must be considered dubious; they are not replicated in this study. Migration lags were an important aspect of postglacial vegetation development in the eastern United States (Davis, 1981; Watts, 1980) and, despite previous statements to the contrary (Van Devender and Spaulding, 1979, p. 710), appear to have played an equally important role in the transition to modern vegetation in the Southwest.
CLIMATES OF THE TRANSITION PERIOD
The latest Wisconsin and early Holocene vegetation of most of the Mojave Desert was xerophytic, relative to that at comparable sites in the Sonoran Desert. Desertscrub communities appear to have developed earlier in the Mojave. The oldest record of shrub-dominated vegetation in the vicinity of the Nevada Test Site exceeds 14,500 years. In the southern Mojave Desert, evidence for the early inception (by at least 10,500 B.P.) of desertscrub comes from middens in the Marble Mountains, 230 km south of the Nevada Test Site (Spaulding, 1980). The elevation of these early desert-vegetation records in the Mojave Desert varies from 465 m in the Marble Mountains to 960 m in the Last Chance Range of Nevada. At the same time (11,500 to 9,000 B.P.), juniper woodland occurred at least as low as 520-m elevation in the Whipple Mountains of the western Sonoran Desert, 310 km south-southeast of the Nevada Test Site in the Colorado River Valley. Mead and others (1978, p. 185-186; Van Devender, 1977b) report that radiocarbon dates on these woodland assemblages are as young as 8,900 B.P. Other sites in western Arizona that confirm the presence of low-elevation woodland in the Sonoran Desert include those from the Artillery and New Water Mountains (Van Devender, 1973, table 3). Closer to the Nevada Test Site, in the extreme eastern part of the Mojave Desert, juniper woodland extended to at least an elevation of 560 m in the lower Grand Canyon (fig. 1). This early Holocene woodland was rich in shrub and succulent species; radiocarbon dates on these assemblages are as young as 8,900 B.P. (Phillips, 1977, table 1).
The early development of desertscrub vegetation in the Mojave Desert, and persistence of woodland in the Sonoran Desert and Grand Canyon, appears to have been a function of differing precipitation regimes. The cline of increasingly xerophytic vegetation from southeast to northwest parallels the existing gradient of warm- season precipitation from the summer-wet (monsoonal) Sonoran Desert to the summer-dry Mojave Desert. Thus, the dichotomy between paleovegetation of the two regions during the latest Wisconsin and early Holocene was probably also due to differences in the relative amount of summer rainfall. This author suggests that, beginning by 14,000 B.P., increasing summer temperatures led to a marked increase in summer, and perhaps autumn, precipitation in the present monsoonal Southwest (Sonoran and Chihuahuan Deserts). Transition period woodlands in these areas were probably maintained at low elevations by relatively high levels of effective moisture during the growing season. The Mojave Desert is farther removed from the sources of warm-season precipitation and may have been beyond the limits of major influence of this phenomenon. Desertscrub vegetation developed earlier in the Mojave Desert because there was inadequate

LATE QUATERNARY VEGETATION AND CLIMATE 43
o
(/) 2 QZ
-3 UJlg«-l a.Z iu
ul O
1" 'CC uj0^8-
<
Samples EV3
EV2B
EV1
EV2C
EV4(3)
EV4(1) '
EV4(2)
EV5B
->
12H
14
16 1EV5A
05050505050505050505050
ESTIMATED RELATIVE ABUNDANCE
EXPLANATION
A VERY RARE (less than 5 fragments) OCCURRENCE
CONNECTS CONSECUTIVE-AGE MIDDEN SAMPLES FROM THE SAME SITE
CONNECTS SAMPLES FROM DIFFERENT SITES
FIGURE 24. A time series of packrat-midden samples from the Eureka View locality, northern Eureka Valley, Inyo County, California; estimated abundance of the species in the present vegetation is presented at the top for comparison; width of bars is equal to ±la of that sample's radiocarbon age (note break and change in time scale). EV, Eureka View; subjectively assigned relative abundance values are: 5, very abundant; 4, abundant; 3, common; 2, occasional; 1, rare.
precipitation to compensate for increasing warm-season moisture deficits.
Between 12,000 and 8,000 years ago, the obliquity of the Earth was such that summer was a time of more intense insolation than it is today, and winters were less heated than at present (Bryson and Swain, 1981, p. 143-144; Kutzbach, 1981, p. 59). Peaks in northern- hemispheric summer insolation and seasonal contrast may have resulted in 20 to 100 percent more summer rainfall than at present in some monsoonal regions (Kutzbach and Otto-Bleisner, 1982; Bryson and Swain, 1981, table 2). Midden localities that document woodland vegetation in the desert West at this time, such as the lower Grand Canyon and the Whipple Mountains, are south and east of the Nevada Test Site and are closer to sources of tropical maritime air the Gulfs of California and Mexico.
The early postglacial woodland of the monsoonal Southwest probably did not result from persistence of the glacial- age precipitation regime, as suggested by Van Devender (1977b, p. 192). Rather, juniper and other xerophytic woodland species may have been maintained at lower elevations than they occur at present by enhanced summer rainfall. Although there was probably a relative increase in summer rainfall over today's meager amounts in the Mojave Desert, it was insufficient to maintain woodland at low elevations.
At about 10,000 years ago, summer and fall precipitation in the vicinity of the Nevada Test Site may have exceeded present amounts by as much as 50 percent. This inference is based on the distribution pattern of woodland across the Southwest and the timing of its disappearance in different areas. Plant species indicative of increased summer

44 VEGETATION AND CLIMATES OF THE LAST 45,000 YEARS, NEVADA TEST SITE
rainfall became more important in the Nevada Test Site midden record between 12,000 and 10,000 years ago. The abundance of Agave utahensis and cacti in the Owl Canyon-2 and Point of Rocks-2 assemblages is consistent with a thesis of increased warm-season precipitation during the Wisconsin to Holocene transition. In the Searles Lake area; the apparent latest Wisconsin expansion of shrub live-oak (Quercus turbinella) (Spaulding and others, 1983) may be evidence of increased summer rain. The interior race of this species is presently restricted to mountains of the monsoonal Southwest (Little, 1976, map 147). There may have been insufficient time for many other summer-rain dependent species to migrate into the area. Most appear to have been absent from the Southwest during the late Wisconsin (Van Devender and Spaulding, 1979, p. 708), and it may have taken them thousands of years to reach the borders of the present- day Mojave Desert.
The source of warm-season precipitation during the latest Wisconsin and early Holocene presumably was to the south in the Gulf of California and Pacific Ocean, or to the southeast in the Gulf of Mexico. Tropical storms of August through October that presently move up the trough of the Colorado River Valley may have been more common than they are today. There is no immediate evidence for a relative increase in precipitation over cur rent values during the winter half-year, although effec tive moisture during the winter probably was greater than today. While summer temperatures are inferred to have been as much as 1° to 2°C higher than today, winter temperatures may have been 1°C lower than today. This is based on the observation that seasonal contrasts were unusually large in the northern hemi sphere between 11,000 and 9,000 B.P. (Broecker and Van Donk, 1970, p. 190; Bryson and Swain, 1981, p. 143; Kutzbach and Otto-Bleisner, 1982).
THE LAST 8,000 YEARS
It generally is agreed that the middle Holocene was a time of increased northern-hemispheric temperatures (Deevey and Flint, 1957). However, estimates of the duration of this period of warm temperatures, and tim ing of the thermal maximum, differ from region to region. It appears that the period of maximum temperatures during the Holocene was time-transgressive (Wright, 1976, p. 594). As with previous portions of this report, this climatic event is considered within the context of a time-stratigraphic unit, the middle Holocene. The date chosen for the beginning of the middle Holocene, 8,000 years ago, is close to the time of final demise of woodland in high desert habitats of the northern Mojave Desert (fig. 14) (Wells and Berger, 1967, table 1), as well as its
decline throughout wide areas in the present Sonoran Desert (Van Devender, 1977b).
MIDDLE HOLOCENE CLIMATIC VARIATIONS
Pollen-stratigraphic data from north-central and north western North America are in general agreement with the Mojave Desert record. All show that the transition to postglacial vegetation conditions was complete by, at the latest, 9,000 B.P. (Barnosky, 1981; Webb and Bryson, 1972; Heusser, 1977; Wright, 1976). The apparent con flict with evidence for delayed development of desert vegetation in the Sonoran and Chihuahuan deserts (Van Devender, 1977b; Van Devender and Wiseman, 1977, p. 21) is probably due to more summer precipitation in these areas. Final extirpation of extralocals such as juni per in the lowlands of the monsoonal Southwest was delayed until the end of the early Holocene, when increased summer precipitation no longer compensated for warm- season moisture stress.
Martin (1963, p. 61) was among the first to suggest that the middle Holocene was a time of increased effec tive moisture, based on pollen data from southeastern Arizona. While little confirmation of an initial, early Holocene (10,500 to 8,000 B.P.) arid period is available (Van Devender, 1977b), Martin's hypothesis that there was enhanced summer rainfall between about 8,000 and 4,000 B.P. has been strengthened by additional studies in the Chihuahuan Desert (Mehringer and others, 1967; Van Devender and Wiseman, 1977; Van Devender and Worthington, 1977). Lacustrine evidence indicates that this also was the case in the Mojave Desert, although the relative amount of summer rain probably was less. The hypsithermal-age saline lake in the Searles Basin (fig. 1) attained a depth of up to 45 m above the present playa surface. It may have been caused by a relative increase in frequency and amount of summer rain, although it is unknown why it was dry during the preceding early Holocene. An uncorrected radiocarbon date on wood from the Overburden Mud laid down by this saline lake is 3,520±190 B.P.; an uncorrected radiocarbon date on disseminated organic carbon is 6,630±390 B.P. (Smith, 1979, p. 112, fig. 3).
Variations in the lower limit of pinyon-juniper wood land in the Sheep Range (fig. 1) also indicate increased effective moisture during the middle Holocene. Two mid dens from sites in current desert, about 150 m below the woodland boundary, contain abundant Utah juniper and common pinyon pine and are dated at 5,210±95 (the Desert View site) and 3,520±100 B.P. (the Basin Wash site) (fig. 14) (Spaulding, 1981, p. 209). Additional evi dence for a moist hypsithermal in the vicinity of the Nevada Test Site includes the presence of extralocal

LATE QUATERNARY VEGETATION AND CLIMATE 45
pricklypears ( Opuntia polyacantka and Opuntia phaea- cantha) in the Desert View midden, as well as the meso- phytes longleaf bricked a (Bricklellia cf. longifolia) and desert-willow ( Chilopsis linearis) in the desertscrub assem blage from the Willow Wash-2 site in the Sheep Range (4,125±90 B.P.) (Spaulding, 1981, table 11).
As mentioned previously, it appears the middle Holocene also was a time of higher temperatures. Isolated mid dens from the Sheep Range, dating from about 4,130 to 3,240 B.P., yield evidence for warmer winters. The record of desert-willow in the Willow Wash-2 midden is perti nent because the species is frost-sensitive and is restrict ed from such protected, cool sites today, even when there is adequate moisture. Warmer winter minima may be indicated by the presence of blue yucca ( Yucca baccata) in the CT-l(l) (3,310+100 B.P.) and Spires-1 middens (3,240±100 B.P.) (fig. 14); both sites presently lie more than 70 m above its upper limit (Spaulding, 1981, p. 136).
Northward migration of warm-desert shrubs contin ued through the middle Holocene. On xeric south slopes in the Eureka Valley (fig. 1), anomalous desertscrub characterized by shadscale, rayless brittlebush (Encelia virginensis), and cactus (Opuntia spp.) gave way to shadscale-creosote bush vegetation between 3,900 and 2,600 B.P. (fig. 24). While the unusual aspect of mid- postglacial plant communities at the Eureka View locali ty resulted in part from delayed immigration of thermophiles, many species that occurred on these xeric dolomite slopes during the middle Holocene are now restricted to more mesic habitats.
La Marche's (1973) dendrochronologic reconstruction of climate variation in the White Mountains of California, 35 km northwest of the Eureka Valley (fig. 1), provides an independent data base for the middle and late Holocene. The remains of bristlecone pine (Pinus longaeva) trees occur far above present treeline there, which is rather firm evidence of fluctuations in its upper limit caused by long-term temperature changes. A period of relatively high temperatures is inferred from the start of the record at about 7,400 B.P. to between 3,500 to 3,000 B.P. La Marche (1973, p. 655) suggests that subsequent late Holocene lowering of treeline was caused chiefly by a decline in warm-season temperatures. For the purposes of this study, a date of 3,000 B.P. for the end of the middle Holocene is accepted.
LATE HOLOCENE FLUCTUATIONS
Although records of vegetation change over the last 3,000 years are plentiful, they usually reflect environmen tal changes of a lower magnitude than most of those
discussed previously. Many late Holocene assemblages indicate increased effective moisture relative to both middle Holocene and modern conditions. In the Sheep range, the Canyon Two-l(l) midden sample (1,990±70 B.P), at an elevation of 1,740 m, contains abundant juniper and common pinyon pine (fig. 14). An older sample from this midden, CT-1(2) at 3,310±100 B.P, contains only occasional juniper and no pinyon pine. This late Holocene record of woodland vegetation comes from a site that is surrounded by blackbrush desertscrub today. The current lower limit of woodland in this part of the range (fig. 12) is at an elevation of about 2,010 m, more than 200 m above the Canyon Two site (Spaulding, 1977). Other middens from the Sheep Range that contain remains of woodland conifers 100 to 200 m below their current lower limits include the Basin Wash sample (3,520±100 B.P) and the Ey-2(l) sample at 2,920±90 B.P. (fig. 11) (Spaulding, 1981, p. 141, p. 123-125).
Late Holocene vegetation change is evident in packrat middens from the Eureka Valley and the Specter Range. Assemblages from the Eureka Valley record final extirpa tion of such extralocals as indigo bush (Psorothamnus fremontii), cacti ( Opuntia basilaris and Opuntia echinocarpa), and desert spruce (Peucephyllum schottii), between about 1,600 B.P and the present (fig. 24). A decline in the proportion and amount of summer precipitation may have caused local extinction of indigo bush and cacti. However, it is likely that lower winter temperatures eliminated desert spruce from this, its northernmost docu mented occurrence. The closest locality where Peucephyllum occurs today is on south-facing slopes of the Last Chance Range of California, 12 km southeast of the Eureka Valley sites.
Two assemblages from the Specter Range-1 site docu ment desertscrub vegetation analogous to today's, although there appears to have been a shift in plant-community composition. Fourwing saltbush (Atriplex canescens) is the most abundant species in the sample dated at 300±100 B.P. [sample Spc-l( 1)], while creosote bush and matchweed (Gutierrezia microcephala) are more important in the younger Spc-l(2) assemblage (lOO-foo B.P.) (table 6). This apparent shift to a xerophytic plant community in the last 300 radiocarbon years may be because of climat ic change. An equally likely cause may be the effect of cattle grazing in the late 19th and early 20th century. A decline in the more palatable saltbush and an increase in unpalatable and disturbance-indicator shrubs (Larrea divaricata, Gutierrezia microcephala, Hymenoclea salsola) support the latter hypothesis. Similar observations are possible based on the data from subrecent packrat mid dens from the Eureka Valley (Spaulding, 1980).

46 VEGETATION AND CLIMATES OF THE LAST 45,000 YEARS, NEVADA TEST SITE
ASSESSING PALEOENVIRONMENTAL RECONSTRUCTIONS
Packrat-midden analysis affords a high-resolution view of the environmental history of the Nevada Test Site and vicinity. However, potential errors and unknown vari ables that exist should be considered. Errors could be introduced in estimating modern climates at the fossil sites, in reconstructing past vegetation, or in extrapolat ing climatic parameters from reconstructions. Retrodictive studies, such as this one, describe phenomena that no longer exist; conclusions derived from such analyses cannot be tested through observation. However, they can be tested by attempts to replicate the fossil record and by application of proposed paleoclimatic parameters to models of physical systems, such as pluvial lakes and cryogenic deposits.
ACCURACY OF REPRESENTATION AND GENERAL ANALOGS
Plant-macrofossil assemblages from ancient packrat middens possess distinctive characteristics that permit identification of specific vegetation types. Analyses of modern middens in this study, and those performed by Cole (1981, p. 36-41; 1982), indicate that sufficient fidelity exists in the midden-vegetation relationship to permit accurate reconstruction to at least the community-type level (table 1). The possibility that first-order errors have been made in this study (such as reconstruction of juni per woodland when ponderosa-pine forest was actually present) is remote. Errors may exist in second-order reconstructions of specific plant associations (table 1), but this also is unlikely. Analyses of modern packrat middens show that plant species that are abundant or common in nearby vegetation are well-represented in the assemblages. Therefore, it is unlikely that a macrofossil assemblage would be interpreted as representing, say, a juniper-shrub woodland, when a pinyon-juniper wood land was actually present. Studies of modern middens thus far have failed to demonstrate consistent biases in foraging behavior of packrats that would invalidate the conclusions presented here. These paleoecological reconstructions usually are based on multiple macrofos sil assemblages controlled by multiple radiocarbon dates. Non-representative assemblages may be sampled on occasion, but these would have little effect on paleoeco logical reconstructions based on many samples.
Diverse bioclimatic regions of the western United States provide a range of general analogs to the fossil records that are used to infer the nature of late Quaternary climates. Use of such analogs provides an effective paleo- environmental tool, even though exact analogs between vegetation and environments of the late Pleistocene and
those of today probably do not exist (Hare, 1976; Birks, 1981). Thus, the climate that existed at the time when xerophytic juniper woodland was widespread is assumed to have been more similar to that of current dry wood land than to that of less similar vegetation types in existence now. There are no logical alternatives to the assertion that, because the late Wisconsin vegetation of the Nevada Test Site region resembled current vegeta tion of northern Nevada, the past climate probably was more similar to the present climate of that area than any other area.
The fossil record provides evidence for various paleo ecological phenomena which, in turn, are used to recon struct different aspects of the past climate. Among the most important used in this study are values of the relative vertical displacement of individual species and the inferred absence of particular taxa from the region during the late Wisconsin.
ELEVATIONAL DISPLACEMENT
Estimates of minimum elevational displacement of limber pine and Utah juniper (table 8) are based on a large data set. Contributing environmental variables, such as aspect, exposure, and substrate, were considered in the calculation of displacement estimates (Spaulding, 1981, p. 166-171). Wells (1977, p. 238) has cautioned that a vertical uncertainty of 100 m may exist in such estimates, because of the possibility of downslope transport of plant fragments from higher elevations. This is balanced, to some extent, by the probability that the lowest fossil record of a particular species does not reflect the lowest elevation that it attained. Neither consideration should seriously affect the validity of minimum estimates. For example, the three lowest fossil records of limber pine on calcareous substrate in the region are within 50-m eleva tion of each other and are from different sites (Spaulding, 1981, table 35). At one of these sites, Basin Canyon-1 at an elevation of 1,635 m in the Sheep Range (Spaulding, 1981, p. 136-140), limber pine is well represented in the macrofossil assemblages. It is improbable that these fossils represent downslope transport, because: (1) They are present in quantity; (2) the locality does not possess extreme topographic relief (Spaulding, 1981, fig. 20); and (3) two other middens from a different locality pro vide similar elevational records.
Occurrence of limber pine and Utah juniper far below their lowest modern populations is attributed to cooler summers during the late Wisconsin. These two taxa were chosen as indicator species of summer tempera tures because they are the most xerophytic arboreal taxa in present subalpine (limber pine) and woodland (Utah juniper) vegetation. The assumption is made that their downward displacement primarily was due to increased
FUTURE CLIMATIC CHANGES 47
effective moisture caused by lowered temperatures, not by increased precipitation. The alternative that their expansion was due to a relative increase in rainfall is less likely. An increase in precipitation exceeding 50 percent of current amounts would have resulted in the expansion of mesophytic species (such as ponderosa pine or spruce) absent in the regional fossil record. Moreover, summer temperatures, rather than winter or average annual temperatures, are considered the critical variable con trolling the lower limit of these trees because moisture deficits caused by higher temperatures occur during the summer.
There are no independent means available to test valid ity of lapse rates (table 8) used to convert estimates of minimum elevational displacement to estimates of changes in summer temperature (ATS ). However, it is perhaps less likely that actual Wisconsin-maximum lapse rates deviated significantly from values used here (table 8. Indeed, values of ATS derived from the fossil records of Utah juniper and limber pine are close to those proposed by other workers using quite different methods (table 7).
NEGATIVE EVIDENCE
Absence of a species from a particular region is an important consideration in the study of present biogeo- graphic and bioclimatic phenomena. Absence of shrubs intolerant of extremely low nocturnal temperatures, such as creosote bush, from the northern reaches of the Nevada Test Site is an indication of the severity of that region's winters (Beatley, 1974,1975). Unfortunately, it is impos sible to demonstrate conclusively with the fossil record that a particular species was not present somewhere in the region. Despite comprehensive collections, the past vegetation of some habitats, such as alluvial fans, remains unknown. Some species may have been restricted to isolated sites with favorable microclimates during the Wisconsin. However, this would not invalidate the obser vation that the climate of that period did not favor those species. In the face of a large data base, it would be less reasonable to claim that these inferences are impermissi ble simply because they are based on negative evidence. However, negative inferences should be drawn from large data sets only and supported by other lines of evidence, and there is always the need for further replication.
Absence of creosote bush from the Wisconsin fossil record is attributed to winter temperatures that ranged below the limit of tolerance of that species. To this assump tion can be added one qualification based on the possi bility of competitive exclusion. Today certain habitats exist that are warm enough in the winter to support creosote bush; however, creosote bush is rare or absent. These sites are characterized by higher rainfall, and, in
the vicinity of the Nevada Test Site, such plant communi ties usually are dominated by blackbrush and, occasionally, species of Lycium ( Beatley, 1974, p. 255). Although com petition between plants is difficult to demonstrate (Grime, 1979), it is likely that creosote bush is absent from these communities because species such as blackbrush are more robust competitors in somewhat wetter habitats. Absence of creosote bush from the fossil record also may be due to such competitive exclusion, but it is considered unlikely. Many plant taxa that were common at lower elevations during the Wisconsin are typical of habitats that are too cold today for creosote bush. Plant species such as blackbrush are rare in the fossil record in the vicinity of the Nevada Test Site prior to about 12,000 years ago.
RADIOCARBON DATING
Accurate radiocarbon dating of packrat middens is crucial to these paleoclimatic reconstructions. Mindful of past debates over methods in packrat-midden dating (Van Devender, 1977a; Wells, 1977), considerable care was taken in both the collection and description of ancient middens, and in the selection of samples for detailed analysis. As mentioned previously, less than 50 percent of the indurated middens located in the field were collected. Further examination and dissection of midden samples in the laboratory led to the rejection of others, on the basis of poor stratigraphic integrity and possible mixing of different-age plant debris. It is believed that many potential dating errors can be avoided by such rigorous sample selection. Reliability of these results is enhanced further by the use of time series from single sites. In a site-specific context, anomalous samples can be recog nized more easily and subjected to further radiocarbon analyses. Therefore, there is little reason to suspect seri ous errors in the inferred vegetation associations or in the chronologies of vegetation and climate change pre sented here.
FUTURE CLIMATIC CHANGE
Various mechanisms operate on different scales of time (wavelengths) to affect climate. They range from diurnal solar forcing, with a frequency measured in hours, to epeiorogenic-orogenic events with a quasi-periodicity of, perhaps, between 10 to 100 million years (Mitchell, 1976, p. 482-485). Based on current knowledge of climate dynamics and the geological record of past changes, major global climatic fluctuations likely will occur with in the next 10,000 years. This is within the hazardous lifespan of radioactive wastes contemplated for storage at the Nevada Test Site. Although any prediction of the impact of future climatic change on the environment of

48 VEGETATION AND CLIMATES OF THE LAST 45,000 YEARS, NEVADA TEST SITE
the Nevada Test Site is untestable (except indirectly by climate modeling) and speculative, it is nevertheless a critical aspect of overall assessment of site suitability.
Recent studies point to two separate phenomena as likely forcing mechanisms that may cause significant climatic change in the next 10,000 years. These are increas es in global atmospheric carbon dioxide and changes in the elements of the Earth's orbit. Each is operating on a different time frequency. The former is anthropogenic and is occurring on periods of 100 years and less. Surface- troposphere warming caused by increasing atmospheric carbon dioxide concentrations is rapid enough that the effects may be visible before the end of the century (Kellogg and Schware, 1981; Schlesinger, 1983). However, the combined effect of three orbital parameters that appear to drive the glacial-interglacial cycles [axial tilt, eccentricity, and deviation of the earth-sun distance (precession)] has demonstrable cycles of 10,000 to 100,000 years. Because climate changes caused by astronomic modulation of solar insolation are of lower frequency, their immediate effects are not as apparent.
ATMOSPHERIC CARBON DIOXIDE
Likely consequences of increased atmospheric carbon dioxide have been identified using both general circula tion and radiative-convective models of global climate (Ramanathan and Coakley, 1978; Manabe and Stouffer, 1979). Most analyses are based on a projected doubling or quadrupling of carbon dioxide content of the atmo sphere within the next 400 years. The result will be an increase in heating the surface-troposphere system by reflection of long-wave radiation from the Earth. The models of Ramanathan and others (1979, p. 4956) predict an increase in northern-hemispheric mean surface tem perature of 3.2°C, assuming a doubling of atmospheric carbon dioxide. Manabe and Wetherald (1975, p. 9) note that a consequence of doubled atmospheric carbon diox ide concentration is the increase in heat energy available for evaporation. Hence, intensity of the "hydrologic cycle" (the entire ocean-land, evaporation-precipitation system in this case) would be enhanced, in their model, by about 7 percent. A projected increase in rainfall also is implied by intensification of subtropical high-pressure systems by tropospheric warming (Manabe and Wetherald, 1975, p. 13). Schlesinger (1983) has recently reviewed model simulations of CO2-induced climate change.
In general, the projected relation of increased atmo spheric temperatures to increased precipitation is analo gous to paleoclimatic reconstructions that indicate an increased flow of tropical maritime air to land during the latest Wisconsin and middle Holocene. Increased tem peratures during the early postglacial may have led to an enhanced summer monsoon in subtropical arid regions
(Kutzbach, 1981, p. 60; Bryson and Swain, 1981, table 2). Another feature shared by both models, those used to predict the effect of carbon dioxide heating and those used to reconstruct the impact of increased insolation, is considerable seasonal and latitudinal variability in results (Ramanathan and others, 1979, p. 4956; Broecker and von Donk, 1970, p. 188; Kutzbach, 1981, p. 61).
The most important possible consequence of the increase in radiative heating of the surface-troposphere system is melting of the Antarctic ice cap (Etkins and Epstein, 1982; Kukla and Gavin, 1981). Obviously, the resultant rise in sea level will have no direct effect on the environ ment of the Nevada Test Site. However, the anticipated rise in temperatures may well have a significant impact on the general climate of the Southwest and the Nevada Tbst Site in particular. Summer temperatures are expect ed to be higher than at present by a minimum of about 3°C. Monsoonal circulation also will be enhanced. An increase in summer and fall precipitation by as much as 50 to 100 percent over current amounts is not unrealistic (Bryson and Swain, 1981, table 2). This relative increase in precipitation is dependent on: (1) Intensity of the warming; (2) accuracy of current model-atmosphere projections; and (3) proximity of any given site to the source of maritime air. Because the Nevada Test Site is beyond the influence of monsoonal rains today, it is reasonable to anticipate less increase in annual rainfall here (perhaps no more than 50 percent) than in areas farther south and east.
THE NEXT ICE AGE
The relationship between variations in the Earth's orbital configuration and the record of ice-sheet contraction and expansion is well documented (Imbrie and Imbrie,1980). The astronomical theory of climate states that modulation of solar radiation by changes in precession, obliquity, and eccentricity is the principal cause of Pleistocene ice ages. In particular, the Milankovitch model (Imbrie and Imbrie, 1980) relates orbitally controlled decreases in northern latitude summer insolation to the descent of snowline and development of perennial snowfields (Adam, 1975; Johnson and McClure, 1976). Several feedback mechanisms then would enhance their growth to continental ice sheets (Ruddiman and Mclntyre, 1981, p. 617-618). In a like manner, deglaciations such as that which occurred at the end of the Wisconsin are associated with peaks in summer insolation in the northern hemisphere (Broecker and van Donk, 1970, fig. 10; Ruddiman and Mclntyre,1981).
Given the inherent predictability of orbital parameters affecting incident solar radiation, and an adequate statistical model relating these variations to continental glaciation, future major global climate change can be predicted.

SUMMARY AND CONCLUSIONS 49
Broecker and van Donk (1970, p. 194) were among the first to observe that, based on their analyses, "*** the next 50,000 years should see unusually rapid expansion of continental ice sheets." This agrees with the subsequent work of Berger (1978, fig. 4e) that presents variations in astronomical parameters and isolation curves for the next 250,000 years. A minimum in northern-hemispheric summer insolation will occur within the next 10,000 years. That this may result in initiation of a new glacial age is seen in the model projections of Imbrie and Imbrie (1980, figs. 7 and 8). Their nonlinear model was constructed to simulate global climatic response to orbital variations, as observed in the deep-sea core record of ^O/^O variations. After adjustment and tuning, good agreement was reached between the model's response to orbital input and the actual oxygen-isotope record of continental glaciation over the last 250,000 years (fig. 25). The model's response to future orbital input is seen as a continuation of the cooling trend that has been underway for about the last 6,000 years, culminating in a glacial maximum in about 60,000 A.P. (years after present). Another, less-pronounced stade is evident in the model output at about 23,000 A.P. (fig. 25). The gradual excursion of global climate to maximum stadial conditions, followed by relatively abrupt deglaciation after 60,000 A.P., is consistent with the "sawtooth" character of the primary glacial-interglacial cycle (Broecker and van Donk, 1970; Ruddiman and Mclntyre, 1981, p. 625).
In this context, it is useful to reaffirm the statement that the Wisconsin maximum at about 18,000 B.P. represents a maximum departure from current interglacial conditions. The magnitude of that stadial episode generally is representative of what may be expected during the next glacial maximum, based on oxygen-isotope record estimates of global ice volume. The last four glacial maxima, during isotope stages 2, 6, 8, and 10, all appear to have been of comparable magnitude, as is the projected maximum at about 60,000 A.P. The implication that there is an approximately equivalent limit to each glacial buildup, attained immediately preceding each deglaciation, is supported by studies of the mechanisms of continental glaciation (Ruddiman and Mclntyre, 1981; Broecker and van Donk, 1970).
The combined potential impact of changing atmospheric carbon dioxide concentrations and orbitally induced solar- insolation variations can be summarized as follows: A brief but pronounced "super-interglacial" may well occur within the next 500 years, followed by a continued trend to the next glacial age, reaching a maximum in about 60,000 years. The relative duration of the former event may be quite brief, perhaps no more than a short-lived perturbation in the progression of glacial ages. While more modeling is needed, it is doubtful that the carbon
Model output 801 pO
50
-100 -50 0 50 100 150 200
THOUSANDS OF YEARS BEFORE PRESENT
250
From Imbrie and Imbrie, 1980 Copyright 1980 by the American Association for the Advancement of Science
FIGURE 25. Inferred past changes in global ice volume and modeled future trends (from Imbrie and Imbrie, 1980, p. 948; copyright 1980 by the American Association for the Advancement of Science); orbitally induced irradiation variations for July at lat 65° N. are presented in ^4; resultant output of Imbrie and Imbrie's(1980, fig. 7) optimum climatic response model is shown in 5; fluctuations in world ice-sheet volume are recorded in oxygen-isotope variations in two equatorial deep-sea cores Rcll -120 and V28-238 (C and D).
dioxide induced warming of the global climate will permanently affect the orbitally forced cycle of glacial ages.
SUMMARY AND CONCLUSIONS
Packrat middens provide an elaborate history of the late Quaternary environments of the Nevada Test Site. Radiocarbon-dated plant-macrofossil assemblages allow reconstruction of both the past vegetation and chronology of its change over the last 45,000 radiocarbon years. These, in turn, are the basis of models of local and regional paleoclimate. Nearly 100 individually dated macrofossil assemblages from the northern Mojave Desert, spanning 1,600 m of vertical relief, allow detailed characterization of the climatic stability of this region in general and the Nevada Test Site in particular.
A limited number of studies in western North America present paleoenvironmental reconstructions defined by specific climatic parameters (table 8). Because of the uncertainties inherent in such investigations (Hare, 1976; Birks, 1981; see also the fifth chapter of this report), many analyses resort to generalized conclusions. However, terms such as "equable," "pluvial," and "mild" are of limited use unless specified by a range of absolute values.

50 VEGETATION AND CLIMATES OF THE LAST 45,000 YEARS, NEVADA TEST SITE
TABLE 10. Summary of estimates of late Quaternary climate for the Nevada Test Siteand vicinity
[ATW , estimated changes in °C (degrees Celsius) of average winter temperature; ATg , estimated changes in °C of average summer temperature; A Ta, estimated changes in ° C of average annual temperature; % (percent) Pg, estimated percent changes in average summer precipitation relative to current amounts; %PW, estimated percent changes in average winter precipitation relative to current amounts; %Pa, estimated percent changes in average annual precipitation relative to current amounts; B.P., radiocarbon years before present]
Time(B.P.I
45,000
38,70037,80030,00018,00010,000
*TW
-2 to -3 1-6
-lto-2
ATS
___
-7 to -8+ lto+2
AT a
-lto-3-lto-2
-5-3 to -6-6 to -7
0
%PS
1/-60-40
-40 to -502-50
%PW
+ 20+ 25 to +50
+ 60 to +700
%pa
0+ 10 to +20
+ 20+ 10 to +25+ 30 to +40+ 10 to +20
1 Minimum estimate.2 Maximum estimate.
Only explicit estimates can be used to model response of hydrologic systems to climatic change, and to test alternative models of past climates. Quantitative paleoclimatic estimates in this study (table 10) do incorporate a number of uncertainties that have been discussed previously. Therefore, the climatic reconstructions are expressed as either a range of values or as a limiting (maximum or minimum) parameter.
During the Wisconsin, plant communities differed in both distribution and composition from plant communities of today. Environmental gradients governing altitudinal segregation of plant species into vegetation zones were altered, and a different scheme of zonation was the result (figs. 14,22). In a region that now supports desert vegetation, Utah juniper woodland extended from near local base level up to a transition with limber pine woodland. Great Basin Desert plants, such as sagebrush, shadscale, and rabbitbush, were common in these woodlands. Although there is no evidence for vegetation without trees prior to about 15,000 years ago, steppe-shrub communities may have existed on alluvial fans unsampled by the midden method (Thompson and Mead, 1982) and on isolated, xeric habitats. There also is no evidence for glacial-age temperate-montane forest at higher elevations. Based on the macrofossil data, only two Wisconsin vegetation zones can be identified: Xerophytic pygmy-conifer woodland at low elevations (less than 1,800 m) and subalpine- conifer woodland above that. This contrasts with the present sequence of vegetation zonation from desertscrub to, first, pygmy-conifer woodland; then, montane forest; and, finally, subalpine woodland (fig. 14). Not only was vegetation zonation during the Wisconsin simpler than today's, but plant associations also appear to have been less diverse. Many Mojave Desert species are rare or missing from the macrofossil record, as are many woodland and forest plants presently found in mild, moist environments.
The local chronology of climatic change is consistent with the global record of transitions from middle to late
Wisconsin and from late Wisconsin to Holocene. Records of middle Wisconsin interstadial (about 45,000 to 23,000 years ago) environments document xerophytic juniper shrub associations at most sites. This was a time of reduced summer rainfall and accentuated winter precipitation. Average annual precipitation during the most mesic phase was perhaps as much as 20 percent above current amounts. The available record indicates that the warmest part of the middle Wisconsin was between about 45,000 and 39,000 years ago, with average annual temperatures perhaps only 1° to 3°C below current values (table 10). Temperatures declined in the last 10,000 to 15,000 years of the middle Wisconsin interstadial, although there appear to have been marked reversals characterized by higher temperatures.
The descent of subalpine woodland to at least an elevation of 1,800 m in the Eleana and Sheep Ranges marks the beginning of the late Wisconsin stade (about 23,000 to 10,000 years ago) in this region. In the Specter Range, a vegetation turnover from juniper-shrub to pinyon-juniper woodland by about 19,000 B.P. may be evidence of the Wisconsin maximum. The northern Mojave fossil record provides no evidence for either equable temperatures (cool summers and warm winters) or a pluvial precipitation regime (annual rainfall exceeding 50 percent of current amounts). Late Wisconsin vegetation of the Nevada Test Site and vicinity was dominated by subalpine, dry woodland, and steppe species; it lacked frost-sensitive taxa and was of apparent lower diversity. A cold, continental climate with winter temperatures at least 6°C below those of today is indicated. Summer temperatures were depressed at least an equivalent amount, and average annual temperatures were perhaps 6° to 7°C lower than at present (table 10). There was a distinct lack of summer rain and a relative increase in winter precipitation by as much as 70 percent above current values. However, the estimated increase in average annual precipitation was, at the most, about 40 percent above present amounts (table 10).

SUMMARY AND CONCLUSIONS 51
This reconstruction of late Wisconsin climate in the northern Mojave Desert differs to some extent with reconstructions proposed for the monsoonal Sonoran and Chihuahuan Deserts to the south and east. Macrofossil evidence from that region has been interpreted as indicating both a pluvial precipitation regime and equable temperatures (Van Devender, 1973, table 3; Van Devender and Spaulding, 1979, p. 708; Wells, 1979, p. 311). Contrasts between inferred paleoclimates in the vicinity of the Nevada Test Site and those to the southeast may be accounted for by regional climatic variations. The relative increase in late Wisconsin precipitation in the Sonoran and Chihuahuan Deserts apparently was greater than in the Mojave Desert. Two factors can account for this. First, an enhanced zonal (west to east) flow of upper-level air, coupled with southerly displacement of winter storm tracks, may have occurred as a consequence of a steepened arctic-equator temperature gradient during the late Wisconsin. The resultant increase in the frequency of Pacific-type winter storms is postulated to have been most pronounced south of lat 36° N. To the north, the relative increase in winter precipitation probably was less due to the barrier to easterly maritime air flow posed by the Sierra Nevada (fig. 1) (Van Devender and Spaulding, 1979, p. 708). A second factor is attenuation of the present southeast- northwest cline of summer precipitation during the late Wisconsin. The northern Mojave, which today receives roughly 25 percent of its annual increment of precipitation during the summer, may have received practically no warm-season rainfall during the late Wisconsin. Farther to the south and east, there is evidence for some summer rainfall (Van Devender, 1973, p. 88), although it probably was less than today's amounts (Van Devender and Wiseman, 1977, p. 21).
The relative decline in full-glacial (about 18,000 B.P.) temperatures proposed for the Nevada Test Site area, in the northern Mojave Desert (table 10), is roughly twice that estimated for sites in the current Sonoran Desert (Van Devender, 1973, table 3). This may be due, in part, to the pluvial environment and more southerly position of the latter region. Increased relative humidity and cloud cover would lead to relatively warm nocturnal temperatures. However, the evidence for very mild late- glacial winters in the monsoonal Southwest is equivocal. For example, the presence of chuckwalla (Sauromalus obesus) and desert tortoise (Gopherus agassizi) in the late Wisconsin woodlands of the Sonoran and Chihuahuan Deserts has been a basis for inferring a negligible decline in winter temperature (Van Devender and others, 1977, p. 61; Van Devender and Mead, 1978, p. 474). However, these animal species today occur as far north as Beatty, Nevada, where the mean January temperature is about 4.5°C (table 4). Their presence in late Wisconsin woodlands in the vicinity of Ttocson, Arizona (mean January temperature
of about 9.8°C) would be consistent with a winter tem perature decline of at least 5°C. Winter temperatures at least 5°C lower than at present also would explain the absence from the fossil record of many frost-sensitive subtropical plants characterizing the present Sonoran Desert (Van Devender, 1976, p. 65; Spaulding and others, 1983).
Vegetation change marking the end of the late Wisconsin was underway by at least 14,000 years ago in the northern Mojave Desert. At higher altitudes, the Wisconsin to Holocene transition (about 12,000 to 8,000 B.P.) is seen as the demise of subalpine conifer associations and inception of the present pinyon-juniper woodland and ponderosa pine forest. Below an elevation of about 1,800 m, the transition was characterized by extirpation of woodland plants and development of desertscrub vegetation. This major environmental change was both space- and time- transgressive (fig. 14). At sensitive sites, postglacial vegetation conditions were attained before about 12,000 years ago and, at more "complacent" sites, after 9,500 B.P. Widespread desert vegetation developed at least 2,000 years earlier in the Mojave than in most areas of the Sonoran and Chihuahuan Deserts.
Climatic change of the Pleistocene to Holocene transition involved apparent concurrent increases in annual temperatures and summer rain, as well as a decline in winter precipitation. From about 11,000 to 10,000 years ago summer precipitation may have been as much as 50 percent higher than at present, although annual amounts in the northern Mojave probably were within 20 percent of current values (table 10). Late persistence of woodlands at low elevations in the Sonoran and Chihuahuan Deserts (Van Devender, 1977b) probably was due to this period of enhanced monsoonal precipitation. Annual range of temperatures at this time probably was somewhat greater than at present, with cooler winters and warmer summers. Winter temperatures increased into the Holocene; the middle Holocene (between 8,000 and 3,000 B.P.) may have been characterized by average annual temperatures 1° to 2°C above present values. Summer precipitation probably exceeded present amounts until between 3,000 and 4,000 years ago.
Gradually declining temperatures have typified the last 4,000 to 6,000 years. It is likely that, at present, this trend is being reversed by heating caused by increasing atmospheric carbon dioxide concentrations. Temperatures in excess of 3°C above present values and increased rainfall may occur within the next 500 years. However, this anticipated "super-interglacial" interval is not expected to permanently reverse the orbitally driven trend toward the next ice age. If current theoretical models are adequate, then a new glacial age is to be expected within the next 10,000 years.

52 VEGETATION AND CLIMATES OF THE LAST 45,000 YEARS, NEVADA TEST SITE
REFERENCES CITED
Adam, D. P., 1975, Ice ages and the thermal equilibrium of theearth, II: Quaternary Research, v. 5, p. 161-172.
Antevs, Ernst, 1948, The Great Basin, with emphasis on glacialand post-glacial times: Bulletin of the University of Utah,v. 38, p. 1-24.
1952, Cenozoic climates of the Great Basin: GeologischesRundschau, v. 40, p. 94-108.
.1954, Climate of New Mexico during the last glacio-pluvial:Journal of Geology, v. 62, no. 2, p. 182-191.
Bacchuber, F. W., and McClellan, W. A., 1977, Paleoecology ofmarine foraminifera in pluvial Estancia Valley, central NewMexico: Quaternary Research, v. 7, p. 254-267.
Barnosky, C. W., 1981, A record of late Quaternary vegetationfrom Davis Lake, southern Puget Lowland, Washington:Quaternary Research, v. 16, p. 221-239.
Beatley, J. C., 1974, Effects of rainfall and temperature on thedistribution and behavior of Larrea tridentata (creosote bush)in the Mojave Desert of Nevada: Ecology, v. 55, p. 245-261.
____1975, Climates and vegetation pattern across the Mojave/Great Basin Desert transition of southern Nevada: AmericanMidland Naturalist, v. 93, p. 53-70.
1976, Vascular plants of the Nevada Test Site and central-southern Nevada: National Technical Information Service Report TID-26881, 308 p.
Bell, F. C., 1979, Precipitation, in Goodall, D. W., and Perry. R. A., eds.,Arid-land ecosystems Structure, function, and manage ment: New York, Cambridge University Press, p. 373-392.
Berger, A. L., 1978, Long-term variations of caloric insolation resulting from the Earth's orbital elements: Quaternary Re search, v. 9, p. 139-167.
Berggren, W. A., and others, 1980, Towards a Quaternary time scale: Quaternary Research, v. 13, p. 277-302.
Betancourt, J. L., and Van Devender, T. R., 1981, Holocene vege tation in Chaco Canyon, New Mexico: Science, v. 214, p. 656-658.
Billings, W. D., 1949, The shadscale vegetation zone of Nevada and eastern California in relation to climate and soils: Ameri can Midland Naturalist, v. 42, p. 87-109.
Birks, H. J. B., 1981, The use of pollen analysis in the reconstruc tion of past climates A review, in Wigley, T. M. L., and others, eds., Climate and history: New York, Cambridge University Press, p. 111-138.
Bleich, V. C., and Schwartz, O. A., 1975, Observations on the home range of the desert woodrat, Neotoma lepida inter media: Journal of Mammalogy, v. 56, p. 518-519.
Bowen, D. Q., 1978, Quaternary geology: New York, Pergamon Press, 221 p.
Brakenridge, G. R., 1978, Evidence for a cold, dry full-glacial climate in the American Southwest: Quaternary Research, v. 9, p. 22-40.
Bredehoeft, J. D., and others, 1978, Geologic disposal of high-level radioactive wastes Earth-science perspectives: U.S. Geo logical Survey Circular 779, 15 p.
Broecker, W. S., and Orr, P. C., 1958, Radiocarbon chronology of Lake Lahontan and Lake Bonneville: Geological Society of America Bulletin, v. 69, no. 8, p. 1009-1032.
Broecker, W. S., and van Donk, Jan, 1970, Insolation changes, ice volumes, and the O 18 record in deep-sea cores: Reviews of Geophysics and Space Physics, v. 8, no. 1, p. 169-198.
Brown, D. E., Lowe, C. H., and Pase, C. P., 1979, A digitized clas sification system for the biotic communities of North America,
with community (series) and association examples for the Southwest: Journal of the Arizona Academy of Science, v. 14, supplement 1, 16 p.
Bryson, R. A., and Hare, F. K., eds., 1974, Climates of North America: New York, American Elsevier Publishing Company, 420 p.
Bryson, R. A., and Lowry, W. D., 1955, The synoptic climatology of the Arizona summer precipitation singularity: Bulletin of the American Meteorological Society, v. 36, p. 329-339.
Bryson, R. A., and Swain, A. M., 1981, Holocene variations of monsoon rainfall in Rajasthan: Quaternary Research, v. 16, p. 135-145.
CLIMAP (Climate: Long-range Investigation Mapping and Pre diction) Project Members, 1976, The surface of the ice-age Earth: Science, v. 191, p. 1131-1137.
Cole, K. L., 1981, Late Quaternary environments in the eastern Grand Canyon, vegetation gradients over the last 25,000 years: Tucson, University of Arizona, Ph.D. dissertation, 170 p.
____1982, Late Quaternary zonation of vegetation in the eastern Grand Canyon: Science, v. 217, p. 1141-1145.
Court, A., 1974, The climate of the conterminous United States, in Bryson, R. A., and Hare, K. F., eds., Climates of North America: New York, American Elsevier Publishing Company, p. 193-261.
Cranford, J. A., 1977, Home range and habitat utilization by Neotoma fuscipes as determined by radiotelemetry: Journal of Mammalogy, v. 58, p. 165-172.
Cronquist, Arthur, and others, 1972, Intermountain flora, v. 1: New York, Hafner, 270 p.
Dansgaard, W., and others, 1971, Climatic record revealed by the Camp Century ice core, in Turekian, K.K., ed., The late Cenozoic glacial ages: New Haven, Yale University Press, p. 37-56.
Davis, M. B., 1981, Quaternary history and the stability of forest communities, in West, D. C., and Shugart, H. H., eds.. Forest succession Concepts and application: New York, Springer- Verlag, p. 132-151.
Deevey, E. S., Jr., and Flint, R. F., 1957, Postglacial hypsithermal interval: Science, v. 125, p. 182-184.
Dreimanis, Alexis, and Raukas, A., 1975, Did Middle Wisconsin, Middle Weichselian, and their equivalents represent an inter- glacial or an interstadial complex in the northern hemisphere?, in Suggate, R. P., and Cresswell, M. M., eds.. Quaternary studies: Wellington, Transactions of the Royal Society of New Zealand, p. 109-120.
Environmental Data Service, 1961-78, Climatological data, sum maries: U.S. Department of Commerce, National Oceanic and Atmospheric Administration (published annually).
Etkins, Robert, and Epstein, E. S., 1982, The rise of global mean sea level as an indication of climate change: Science, v. 215, p.287-289.
Fenneman, N. M., 1931, Physiography of the western United States; New York, McGraw-Hill, 534 p.
Finley, R. B., Jr., 1958, The woodrats of Colorado Distribution and ecology: University of Kansas Publications in Natural History, v. 10, p. 213-552.
Flint, R. F., 1971, Glacial and Quaternary geology: New York, John Wiley, 802 p.
Galloway, R. W., 1970, The full-glacial climate in the southwestern United States: Annals of the Association of American Geog raphers, v. 60, no. 2, p. 245-256.
Gates, W. L., 1976, Modeling the ice-age climate: Science, v. 191, p. 1138-1144.

REFERENCES CITED 53
Grayson, D. K., 1979, On the quantification of vertebrate archaeo- faunas, in Sheets, P. D., and Grayson, D. K., eds.. Advances in archaeological method and theory, v. 2: New York, Academic Press, p. 199-237.
Grime, J. P., 1979, Plant strategies and vegetation processes: New York, John Wiley, 222 p.
Hales, J. E., Jr., 1974, Southwestern United States summer mon soon source Gulf of Mexico or Pacific Ocean?: Journal of Applied Meteorology, v. 13, p. 331-342.
Hare, K. L., 1976, Late Pleistocene and Holocene climates Some persistent problems: Quaternary Research, v. 6, p. 507-518.
Haynes, C. V., Jr., 1967, Quaternary geology of the Tule Springs area, Clark County, Nevada, in Wormington, H. M., and Ellis, Dorothy, eds.. Pleistocene studies in southern Nevada: Nevada State Museum Anthropological Papers 13, p. 15-104.
Heusser, C. J., 1977, Quaternary palynology of the Pacific slope of Washington: Quaternary Research, v. 8, p. 282-306.
Holmgren, A. H., and Reveal, J. L., 1966, Checklist of the vascular plants of the Intermountain Region: U.S. Forest Service Research Paper INT-32, 160 p.
Houghton, J. G., Sakamoto, C. M., and Gifford, R. O., 1975, Nevada's weather and climate: Nevada Bureau of Mines Special Pub lication 2, 78 p.
Huning, J. R., 1978, A characterization of the climate of the Cali fornia desert: Riverside, Desert Planning Staff, California Bureau of Land Management unpublished report, 220 p.
Imbrie, John, and Imbrie, J. Z., 1980, Modeling the climatic response to orbital variations: Science, v. 207, p. 943-953.
Interagency Review Group on Nuclear Waste Management, 1978, Report to the President: National Technical Information Ser vice TID-29442, 149 p.
Johnson, R. G., and McClure, B. T, 1976, A model for northern hemispheric continental ice sheet variation: Quaternary Re search, v. 6, p. 325-354.
Kellogg, W. W., and Schware, R., 1981, Climate change and society: Boulder, Colo., Westview Press, 178 p.
Kukla, George and Gavin, J., 1981, Summer ice and carbon dioxide: Science, v. 214, p. 497-503.
Kutzbach, J. E., 1981, Monsoon climate of the early Holocene Climate experiment with the Earth's orbital parameters for 9,000 years ago: Science, v. 214, p. 59-61.
Kutzbach, J. E., and Otto-Bleisner, B. L., 1982, The sensitivity of the African-Asian monsoonal climate to orbital parameter changes for 9000 years B. P. in a low-resolution general cir culation model: Journal of the Atmospheric Sciences, v. 39, p. 1177-1188.
La Marche, V. C., Jr., 1973, Holocene climatic variations inferred from treeline fluctuations in the White Mountains, California: Quaternary Research, v. 3, p. 632-660.
Langford, A. N., and Buell, M. F., 1968, Integration, identity, and stability in the plant association: Advances in Ecological Research, v. 6, p. 83-135.
Leopold, L. B., 1951, Pleistocene climate in New Mexico: American Journal of Science, v. 249, p. 152-168.
Little, E. L., Jr., 1976, Minor western hardwoods, in Atlas of United States trees, v. 3: U.S. Forest Service Miscellaneous Publication 1314, 210 maps.
Long, Austin, and Rippeteau, Bruce, 1974, Testing contempor aneity and averaging radiocarbon dates: American Antiquity, v. 39, p. 205-215.
Major, Jack, 1977, California climate in relation to vegetation in Barbour, M.G., and Major, Jack, eds., Terrestrial vege tation of California: New York, John Wiley, p. 11-74.
Manabe, Syukuro, and Stouffer, R. J., 1979, A CO-climate sensi tivity study with a mathematical model of the global climate:
Nature, v. 282, p. 491-493.Manabe, Syukuro, and Wetherald, R. T, 1975, The effects of doub
ling the CO2-concentration on the climate of a general circu lation model: Journal of Atmospheric Sciences, v. 32, p. 3-15.
Martin, P. S., 1963, The last 10,000 years A fossil pollen record of the American Southwest: Tucson, University of Arizona Press, 87 p.
Martin, P. S., and Mehringer, P. J., Jr., 1965, Pleistocene pollen analysis and biogeography of the Southwest, in Wright, H. E., Jr., and Frey, D. G., eds., The Quaternary of the United States: Princeton, N. J., Princeton University Press, p. 433- 451.
Mead, J. I., and Phillips, A. M., Ill, 1981, The late Pleistocene and Holocene fauna and flora of Vulture Cave, Grand Canyon, Arizona: Southwestern Naturalist, v. 26, p. 257-288.
Mead, J. I., Thompson, R. S., and Long, Austin, 1978, Arizona radiocarbon dates IX-carbon isotope dating of packrat mid dens: Radiocarbon, v. 20, p. 171-191.
Mehringer, P. J., Jr., 1965, Late Pleistocene vegetation in the Mojave Desert of southern Nevada: Journal of the Arizona Academy of Science, v. 3, p. 172-188.
____ 1967, Pollen analysis of the Tule Springs site, Nevada, in Wormington, H. M., and Ellis, D., eds., Pleistocene studies in southern Nevada: Nevada State Museum Anthropological Papers, v. 13, p. 129-200.
Mehringer, P. J., Jr., Martin, P. S., and Haynes, C. V., Jr., 1967, Murray Springs, a mid-postglacial pollen record from southern Arizona: American Journal of Science, v. 265, p. 786-797.
Mehringer, P. J., Jr., and Warren, C. N., 1976, Marsh, dune, and archaeological chronology, Ash Meadows, Amargosa Desert, Nevada, in Elston, Ronald, ed., Holocene enviromental change in the Great Basin: Nevada Archaeological Survey Research Paper 6, p. 120-150.
Mifflin, M. D., and Wheat, M. M., 1979, Pluvial lakes and esti mated pluvial climates of Nevada: Nevada Bureau of Mines and Geology Bulletin 94, 57 p.
Mitchell, J. M., 1976, An overview of climatic variability and its causative mechanisms: Quaternary Research, v. 6, p. 481-494.
Mitchell, V. L., 1976, The regionalization of climate in the western United States: Journal of Applied Meteorology, v. 15, p. 920- 927.
Mooney, H. A., St. Andre, G., and Wright, R. D., 1962, Alpine and subalpine vegetation patterns in the White Mountains of California: American Midland Naturalist, v. 68, p. 275-293.
Morrison, R. B., 1965, Quaternary geology of the Great Basin, in Wright, H. E., and Frey, D. G., eds.. The Quaternary of the United States: Princeton, N. J., Princeton University Press, p. 265-285.
Morrison, R. B., and Frye, J. C., 1965, Correlation of the middle and late Quaternary successions of the Lake Lahontan, Lake Bonneville, Rocky Mountain (Wasatch Range), southern Great Plains, and eastern Midwest areas: Nevada Bureau of Mines Report 9, 45 p.
Mueller-Dombois, Dieter, and Ellenberg, Heinz, 1974, Aims and methods of vegetation ecology: New York, John Wiley, 547 p.
Munz, P. A., 1974, A flora of southern California: Berkeley, Univer sity of California Press, 1,086 p.
Peng, T. H., Goddard, J. G., and Broecker, W. S., 1978, A direct comparison of 14C and 230Th ages at Searles Lake, California: Quaternary Research, v. 9, p. 319-329.
Phillips, A. M., Ill, 1977, Packrats, plants, and the Pleistocene

54 VEGETATION AND CLIMATES OF THE LAST 45,000 YEARS, NEVADA TEST SITE
in the lower Grand Canyon: Tucson, University of Arizona, Ph. D. dissertation, 123 p.
Porter, S. C., 1971, Fluctuations of late Pleistocene alpine glaciers in western North America, in Turekian, K. K., ed., The late Cenozoic glacial ages: New Haven, Yale University Press, p. 307-330.
Prell, W. L., and Hays, J. D., 1976, late Pleistocene faunal and temperature patterns of the Columbia Basin, Carribean Sea, in Cline, R. M., and Hays, J. D., eds., Investigations of late Quaternary paleoceanography and paleoclimatology: Geolo gical Society of America Memoir 145, p. 201-220.
Ramanathan, V., and Coakley, J. A., Jr., 1978, Climate modeling through radiative-convective models: Reviews of Geophysics and Space Physics, v. 16, p. 465-489.
Ramanathan, V., Lian, M. S., and Cess, R. D., 1979, Increased atmospheric CO2-zonal and seasonal estimates of the effects of the radiation energy balance and surface temperature: Journal of Geophysical Research, v. 86, p. 4949-4957.
Raun, G. G., 1966, A population of Woodrats (Neotoma micropus) in southern Texas: Bulletin of the Texas Memorial Museum, v. 11, 62 p.
Reeves, C. C., Jr., 1966, Pleistocene climate of the Llano Estacado, Pt. 2: Journal of Geology, v. 74, no. 5, Pt. 1, p. 642-647.
Robinson, S. W., 1979, Radiocarbon dating at the U.S. Geological Survey, Menlo Park, California in Berger, Rainer, and Suess, H. W., eds., Radiocarbon dating: Berkeley, University of Cali fornia Press, p. 268-273.
Ruddiman, W. F., and Mclntyre, A., 1981, Oceanic mechanisms for amplification of the 23,000-year ice volume cycle: Science, v. 212, p. 617-627.
Schlesinger, M. E., 1983, A review of climate model simulations of CO2 -induced climatic change: Corvallis, Ore., Oregon State University, Climate Research Institute Report no. 41, 135 p.
Schumm, S. A., 1965, Quaternary paleohydrology, in Wright, H. E., Jr., and Frey, D. G., eds., The Quaternary of the United States: Princeton, N. J., Princeton University Press, p. 783-794.
Sellers, W. D., and Hill, R. H., eds., 1974, Arizona climate 1931- 1972: Tucson, University of Arizona Press, 616 p.
Sergin, V. Ya., 1980, Origin and mechanism of large-scale climatic oscillations: Science, v. 209, p. 1477-1482.
Shackleton, N. J., and Opdyke, N. D., 1973, Oxygen isotope and paleomagnetic stratigraphy of equatorial Pacific core V28- 238 Oxygen isotope temperatures and ice volumes on a 10 5 year and 106 year scale: Quaternary Research, v. 3, p. 39-55.
Smith, G. I., 1979, Subsurface stratigraphy and geochemistry of late Quaternary evaporites, Searles Lake, California: U.S. Geological Survey Professional Paper 1043, 130 p.
Snyder, C. T., Hardman, George, and Zdenek, F. F., 1964, Pleisto cene lakes in the Great Basin: U.S. Geological Survey Miscel laneous Geological Investigations Map 1-416.
Snyder, C. T., and Langbein, W. B., 1962, The Pleistocene lake in Spring Valley, Nevada, and its climatic implications: Journal of Geophysical Research, v. 67, no. 6, p. 2385-2394.
Sorensen, T., 1948, A method of establishing groups of equal amplitude in plant sociology based on similarity of species content: Det Kongress Danske Videnske, Selskab Biologica Skrifter, v. 5, p. 1-34.
Spaulding, W. G., 1976, Late Quaternary vegetation change in the Sheep Range, Clark County, Nevada: American Quaternary Association Abstracts, p. 160-161.
1977, Late Quaternary vegetational change in the Sheep Range, southern Nevada: Journal of the Arizona Academy of Science, v. 12, p. 3-8.
__ 1980, The presettlement vegetation of the California Desert: Riverside, Desert Planning Staff, California Bureau of Land Management unpublished report, 97 p.
__ 1981, The late Quaternary vegetation of a southern Nevada mountain range: Tucson, University of Arizona, Ph. D. disser tation, 271 p.__ 1983, Late Wisconsin macrofossil records of desert vegetation in the American southwest: Quaternary Research, v. 19, p. 256-264.
Spaulding, W. G., Leopold, E. B., and Van Devender, T. R., 1983, Late Wisconsin paleoecology of the American southwest, in Porter, S. C., ed., The late Pleistocene of the United States: Minneapolis, University of Minnesota Press, p. 259-293.
Stones, R. C., and Hayward, C. L., 1968, Natural history of the desert woodrat, Neotoma lepida: American Midland Natural ist, v. 80, p. 458-476.
Stuiver, Minze, and Smith, G. I., 1979, Radiocarbon ages of strati- graphic units, in Smith, G. I., Subsurface stratigraphy and geochemistry of late Quaternary evaporites, Searles Lake, Cali fornia: U.S. Geological Survey Professional Paper 1043, p. 68-75.
Thompson, R. S., and Mead, J. I., 1982, Late Quaternary environ ments and biogeography in the Great Basin: Quaternary Research, v. 17, p. 39-55.
U.S. Weather Bureau, 1965, Climatography of the United States, supplement for 1931 through 1952 (no. 11-22) and supplement for 1951 through 1960 (no. 86-22): U.S. Department of Com merce, National Oceanic and Atmospheric Administration.
Van Devender, T. R., 1973, Late Pleistocene plants and animals of the Sonoran Desert, a survey of ancient packrat middens in southwestern Arizona: Tucson, University of Arizona, Ph. D. dissertation, 179 p.
____ 1976, the biota of hot deserts of North America during the last glaciation The packrat midden record: American Quaternary Association Abstracts, p. 62-67.
____ 1977a, Comment on Macrofossil analysis of woodrat (Neotoma) middens as a key to the Quaternary vegetational history of arid North America by P. V. Wells: Quaternary Research, v. 8, p. 236-237.
____ 1977b, Holocene woodlands in the Southwestern deserts:Science, v. 198, p. 189-192.
Van Devender, T. R., and Mead, J. I., 1978, Early Holocene and late Pleistocene amphibians and reptiles in Sonoran Desert packrat middens: Copeia, no. 3, p. 464-475.
Van Devender, T. R., Phillips, A. M., Ill, and Mead, J. I., 1977, Late Pleistocene reptiles and small mammals from the Lower Grand Canyon of Arizona: Southwestern Naturalist, v. 22, p. 49-66.
Van Devender, T. R., and Spaulding, W. G., 1979, Development of vegetation and climate in the southwestern United States: Science, v. 204, p. 701-710.
Van Devender, T. R., and Wiseman, F. M., 1977, A preliminary chronology of bioenviromental changes during the Paleoindian period in the monsoonal Southwest, in Johnson, Eileen, ed., Paleoindian lifeways: Lubbock, West Texas Museum Associ ation, The Museum Journal, v. 17, p. 13-27.
Van Devender, T. R., and Worthington, R. D., 1977, The herpeto- fauna of Howell's Ridge Cave and the paleoecology of the northwestern Chihuahuan Desert, in Wauer, R. H., and Riskind, D. H., eds., Transactions of the symposium on the biological resources of the Chihuahuan Desert region: U.S. National Park Service Proceedings and Transaction Series, no. 3, p. 85-106.
Watts, W. A., 1980, Late Quaternary vegetation of central Appa-

REFERENCES CITED 55
lachia and the New Jersey coastal plain: Ecological Mono graphs, v. 49, p. 427-469.
Webb, Thompson, III, and Bryson, R. A., 1972, Late- and post glacial climatic change in the northern Midwest, United States of America: Quaternary Research, v. 2, p. 70-115.
Wells, P. V., 1976, macrofossil analysis of woodrat (Neotoma) middens as a key to the Quaternary vegetational history of arid America: Quaternary Research, v. 6, p. 223-248.
____ 1977, Reply to comment by T. R. Van Devender: Quaternary Research, v. 8, p. 238-239.
1979, An equable glaciopluvial in the West Pleniglacialevidence of increased precipitation on a gradient from the Great Basin to the Sonoran and Chihuahuan deserts: Quater nary Research, v. 12, p. 311-325.
Wells, P. V., and Berger, Rainer, 1967, Late Pleistocene history of coniferous woodland in the Mojave Desert: Science, v. 155, p. 1640-1647.
Wells, P. V., and Jorgensen, C. D., 1964, Pleistocene wood rat middens and climatic change in Mohave Desert A record of juniper woodlands: Science, v. 143, p. 1171-1174.
Winograd, I. J., 1981, Radioactive waste disposal in thick unsatu- rated zones: Science: v. 212, p. 1457-1464.
Winograd, I. J., and Doty, G. C., 1980, Paleohydrology of the southern Great Basin, with special reference to water table fluctuations beneath the Nevada Test Site during the late(?) Pleistocene: U.S. Geological Survey Open-File Report 80-569, 97 p.
Winograd, I. J., and Thordarson, William, 1975, Hydrogeologic and hydrochemical framework, south-central Great Basin, Nevada- California, with special reference to the Nevada Test Site: U.S. Geological Survey Professional Paper 712-C, C1-C126 p.
Wright, H. E., Jr., 1972, Interglacial and post glacial climates The pollen record: Quaternary Research, v. 2, p. 274-282.
_____ 1976, The dynamic nature of Holocene vegetation: Quater nary Research, v. 6, p. 581-596.


SUPPLEMENTAL DATAModern packrat middens. [Data from modern packrat middens analyzed in this study, tables 11-15.] Ancient packrat middens. [Data from ancient packrat middens analyzed in this study, tables 16-25.]


SUPPLEMENTAL DATA
TABLE 11. Plants in a recent midden from the Owl Canyon-3 site and plants growing inthree habitats within 30 meters
specindex of similarity; SW, southwestern; NW, northwestern]
59
Species
Ambrosia dumosa
Amphipappus fremontii
Aristida sp.
Asteraceae undet.
Atriplex confertifolia
Boraginaceae undet.
Brickellia arguta
S. desertorum
Bromus rubens
Cheilanthes feei
Chorizanthe brevicornu
Cryptantha sp.
Echinocactus polycephalus
Ephedra torreyana
Ephedra sp.
Eriogonum heermannii
Erioneuron pulchellum
Eucnide urens
Festuca octoflora
Galium stellatum
Gilia rippleyi
Gutierrezia microcephala
Haplopappus brickellioides
Hilaria rigida
Larrea divaricata
Linanthus sp.
Nicotiana trigonophylla
Opuntia basilaris
Peucephyllum schottii
Physalis crassifolia
Plantago sp.
Pleurocornis pluriseta
Poaceae undet.
Prunus fasciculata
Salvia dorrii
Sitanion hystrix
Sphaeralcea ambigua
Stipa arida
NISP
N
Modern vegetation
(relative abundance)
SW slope
(4)
(1)
(1)
(1)
(1)
(X)
(1)
(2)
(1)
(2)
(3)
(1)
(X)
(4)
(1)
(1)
(1)
(1)
(3)
(3)
(1)
(1)
(1)
(1)
24
16
NW slope
(3)
(3)
(2)
(1)
(1)
(1)
(1)
CD
(5)
(1)
(2)
(3)
(1)
CD
(1)
15
12
Wash
(3)
(1)
(D
(1)
(1)
(D
(X)
C4)
(2)
(3)
(D
(2)
12
7
Recent midden
count
55
3
50
165
4
9
2
10
1
9
76
7
7
4
15
125
453
764
172
56
1
4
15
21
35
6
2,069
26
14
IS (SW slope vegetation to recent midden): 73
IS (NW slope vegetation to recent midden): 77
IS (wash vegetation to recent midden): 67
Number of plant taxa in midden debris, not observed in vegetation: 6
Number of plant taxa in local vegetation, not observed in the midden: 7

60 VEGETATION AND CLIMATES OF THE LAST 45,000 YEARS, NEVADA TEST SITE
TABLE 12. Plants in a recent midden from the Last Chance Range site and those growingwithin 30 meters
[Relative abundance values for modern vegetation data are in parentheses; they indicate: 5, very abundant; 4, abundant; 3, common; 2, occasional; 1, rare; X, present within 30 meters; NISP, number of identified specimens; N, number of plant taxa; Nts , number of species of trees, shrubs, and succulents; IS, Sorensen's index of similarity;]
Species
Ambrosia dumosa
Asteraceae undet.
Atriplex confertifolia
Boraginaceae undet.
Brickellia desertorum
Bromus rubens
Buddleja utahensis
Cheilanthes feei
Chorizanthe brevicornu
C. rigida
Cryptantha sp.
Echinocactus polycephalus
Ephedra funerea
E. torreyana
Ephedra sp.
Eriogonum fasciculatum
E. heermannii
E. inflatum
Eriogonum sp.
Erioneuron pulchellum
Eucnide urens
Galium stellatum
Gilia sp.
Gutierrezia microcephala
Haplopappus brickellioides
Larrea divaricata
Lepidium fremontii
Lycium andersonii
Mirabilis sp.
Mortonia utahensis
Muhlenbergia porteri
Nicotiana trigonophylla
Opuntia basilaris
Phacelia sp.
Plantago sp.
Pleurocoronis pluriseta
Poaceae undet.
Prunus fasciculata
Salvia dorrii
S. mohavensis
Sphaeralcea sp.
Stipa arida
NISP
N
Nts
Modern vegetation
(relative abundance)
(4)
(3)
(1)
(3)
(3)
(X)
(X)
(X)
(1)
(1)
(11
(1)
(1)
(X)
(X)
(1)
(3)
(1)
(X)
(2)
(4)
(1)
(1)
(1)
(2)
(1)
(X)
(1)
Q)
(1)
(2)
31
19
Recent midden
count
127
71
189
11
35
12
45
2
1
14
5
52
11
9
74
6
1
2
728
11
2
65
5
9
12
15
4
10
2
24
12
1,566
28
19
IS (vegetation at the site to plant debris in midden): 84
Number of plant taxa in midden debris, not observed in vegetation: 7
Number of plant taxa observed in local vegetation, but not observed in the midden: 5

SUPPLEMENTAL DATA
TABLE 13. Plants in a recent midden from the Specter Range-2 site and those growingwithin 30 meters
[Relative abundance values for modern vegetation data are in parentheses; they indicate: 5, very abundant; 4, abundant; 3, common; 2, occasional; 1, rare; X, present within 30 meters; NISP, number of identified specimens; N, number of plant taxa; A^s , number of species of trees, shrubs, and succulents; IS, Sorensen's index of similarity]
61
Species
Ambrosia dumosa
Amphipappus fremontii
Artemisia sec. Tridentatae
Atriplex confertifolia
Boraginaceae undet.
Brickellia watsonii
Brickellia sp.
Bromus rubens
Buddleja utahensis
Cryptantha conf ertiflora
Echinocactus polycephalus
Ephedra torreyana
Eriogonum deflexum
E. heermannii
E. inflatum
Fendlerella utahensis
Galium stellatum
Gilia sp.
Gutierrezia microcephala
Haplopappus brickellioides
Krameria parvifolia
Larrea tridentata
Leptodactylon pungens
Lycium andersonii
Oryzopsis hymenoides
Poaceae undet.
Prunus fasciculata
Salvia dorrii
Scopulophila rixfordii
Sitanion hystrix
Sphaeralcea ambigua
Sphaeralcea sp.
Stipa arida
Stipa sp.
Thamnosma montana
NISP
N
N ts
Modern vegetation
Crelative abundance).
Crest
(1)
(3)
(3)
(2)
(U
(2)
(1)
(X)
(1)
(3)
CD
17
CD
(D
(2)
(l)
(D
(21
18
13
Slopes
(2)
(2)
(2)
C2)
(X)
(3)
(X)
(3)
(1)
(3)
(1)
(1)
(1)
(3)
(D
(3)
(D
(2)
(D
19
12
Recent midden
count
2
533
6
1
7
28
262
6
3
2
20
3
1
81
1
27
103
14
151
9
1
4
1,266
23
15
IS (crest vegetation to recent midden debris): 64
IS (slope vegetation to recent midden debris): 74
Number of plant taxa in midden debris, not observed in vegetation: 5
Number of plant taxa in local vegetation, not observed in the midden: 5
Present but more than 30 meters from the site.

62 VEGETATION AND CLIMATES OF THE LAST 45,000 YEARS, NEVADA TEST SITE
TABLE 14. Plants in recent midden debris from the Eleana Range-3 site and thosegrowing within 30 meters
[Relative abundance values for modern vegetation data are in parentheses; they indicate: 5, very abundant; 4, abundant; 3, common; 2, occasional; 1, rare; X, present within 30 meters; NISP, number of identified specimens; N, number of plant taxa; Nts , number of species of trees, shrubs, and succulents; IS, Sorensen's index of similarity)
Modern vegetation Species
(relative abundance)
Artemisia nova
A. tridentata
Artemisia sec. Tridentatae
Atriplex canescens
Boraginaceae undet.
Brickellia calif ornica
Bromus rubens
Cowania mexicana
Crvptantha confertif lora
Cryptantha sp.
Ephedra torreyana
E. viridis
Ephedra sp.
Eriogonum caespitosum
E. fasciculatum
E. inflatum
E. microthecum
Festuca sp.
Forsellesia nevadensis
Haplopappus nanus
Heterotheca villosa
Juniperus osteosperma
Leptodactylon pungens
Linum lewis ii
Opuntia erinacea
Oryzopsis hymenoides
Penstemon sp.
Phacelia sp.
Pir.us flexilis
P. monophylla
Poaceae undet.
Purshia tridentata
Quercus gambelii
Rhus trilobata
Salvia columbariae
Senecio multilobatus
Sphaeralcea sp.
Stanleya pinnata
Stipa sp.
Symphoricarpos longiflorus
Symphoricarpos sp.
NISP
N
Nts
IS (current vegetation to recant midden debris): 77
Number of plant taxa in midden debris, not observed in vej
Number of plant taxa in local vegetation, not observed in
(2)
(3)
(4)
(1)
(X)
(1)
(X)
(1)
(2)
(1)
(1)
(X)
(1)
(1)
(2)
(X)
(1)
(1)
(X)
If
(X)
(X)
(2)
(1)
(X)
(X)
(1)
(1)
(3)
(2)
29
16
jetation: 6
the midden: 9
Recent midden
count
19
387
10
153
1
16
2
12
75
5
1
26
1
3
3
79
177
1
2
5
17
4
999
22
15
Present but not more than 30 meters from the midden.

SUPPLEMENTAL DATA 63
TABLE 15. Plants in a recent midden from the Connley Hills-1 and -2 sites, and those growingwithin 30 meters of each locality
[Relative abundance values for modern vegetation data are in parentheses; they indicate: 5, very abundant; 4, abundant; 3, common; 2, occasional; 1, rare; X, present within 30 meters; NISP, number of identified specimens; N, number of plant taxa; N^s , number of species of trees, shrubs, and succulents; IS, Sorensen's index of similarity]
Species
Amsinckia sp.
Artemisia tridentata
Boraginaceae undet.
Bromus tectorum
Chenopodium cf . botrys
Chrysothamnus nauseosus
C. viscidiflorus
Chrysothamnus sp .
Descurainia sp.
Juniperus occidentalis
Oryzopsis hymenoides
Poaceae undet.
Purshia tridentata
Ribes cereum
NISP
N
Nts
IS (current vegetation
IS (current vegetation
Number of plant taxa in
Number of plant taxa in
Number of plant taxa in
Number of plant taxa in
Connley Hills-1
Modern vegetation Recent midden
(relative abundance)
(X)
(4)
-
(2)
(5)
(1)
(X)
(1)
(3)
_
(1)
1,
10
5
to recent midden at Connley
to recent midden at Connley
count
2
25
8
35
37
2
148
11
432
8
904
_
1
613
12
5
Hills 1): 100
Hills 2): 91
Connley Hills 1 midden debris, not observed
vegetation at Connley Hills 1, not observed
Connley Hills 2 midden debris, not observed
vegetation at Connley Hills 2, not observed
Connley Hills-2
Modern vegetation Recent midden
(relative abundance) count
_
(3) 138
-
(3) 18
50
(5) 230
(1)
40
(X) 97
(3) 1,059
7
(2) 156
15
(1) 8
1,818
8 11
5 6
in vegetation: 0
in the midden: 0
in vegetation: 2
in the midden: 0
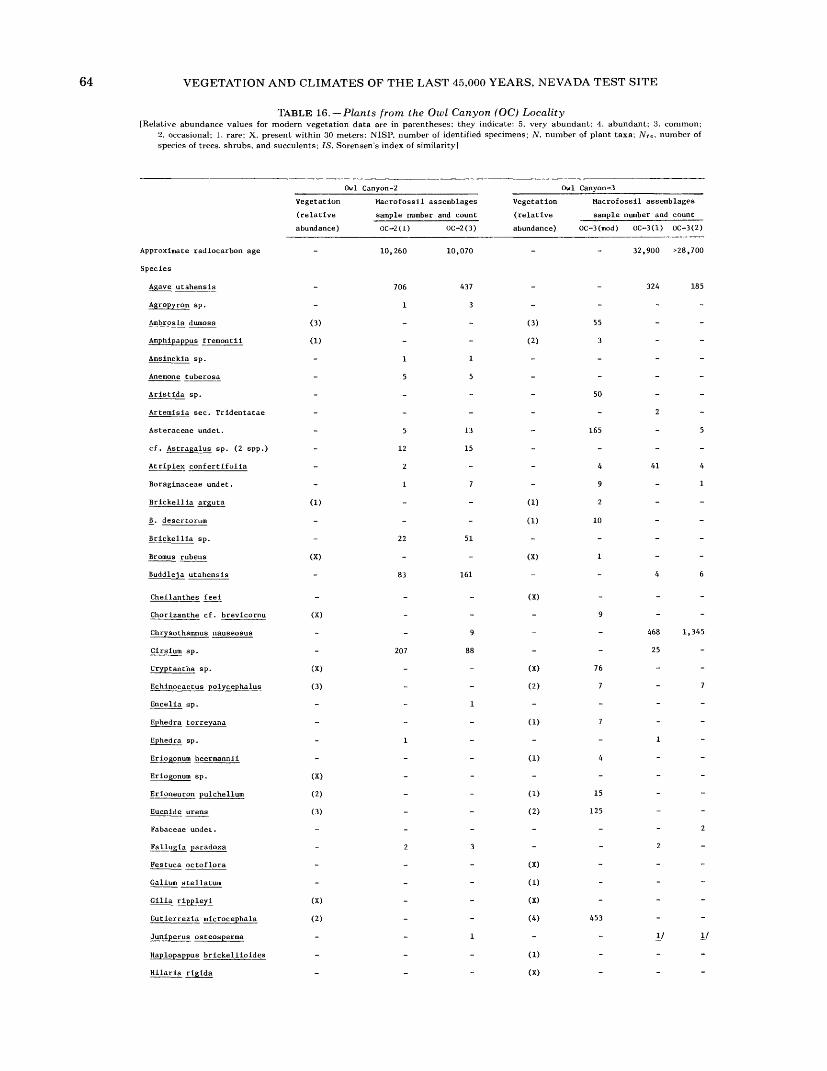
64 VEGETATION AND CLIMATES OF THE LAST 45,000 YEARS, NEVADA TEST SITE
TABLE 16. Plants from the Owl Canyon (OC) Locality[Relative abundance values for modern vegetation data are in parentheses; they indicate: 5, very abundant; 4, abundant; 3. common;
2, occasional; 1, rare; X, present within 30 meters; NISP, number of identified specimens; N, number of plant taxa; Nt*, number of species of trees, shrubs, and succulents; IS, Sorensen's index of similarity]
Owl Canyon-2
Vegetation Macrofossil assemblages
(relative sample number and count
abundance) OC-2(1) OC-2(3)
Approximate radiocarbon age - 10,260 10,070
Species
Agave utahensls - 706 437
Agropyron sp. - 13
Ambrosia dumosa (3)
Amphipappus fremontil (1)
Amslnckla sp. - 11
Anemone tuberosa - 55
Arlstlda sp. - - -
Arteralsla sec. Trldentatae - - -
Asteraceae undeL. - 5 13
cf. Astragalus sp. (2 spp.) - 12 15
Atrlplex confertlfolla - 2 -
Boraginaceae undet. - 17
Brickellla arguta (1)
B. desertorum - - -
Brickellla sp. - 22 51
Bromus rubeus (X) - -
Buddleja utahensls - 83 161
Chellanthes feel - - -
Chorlzanthe cf. brevlcornu (X)
Chrysothamnus nauseosus - - 9
Clrstum sp. - 207 88
Crypt ant ha sp. (X)
Echlnocactus polycephalus (3) - -
Encella sp. - - 1
Ephedra torreyana - -
Ephedca sp. - 1 -
Erlogonum heermannli - - -
Erlogonum sp. (X)
Erloneuron pulchellum (2)
Eucnlde urens (3)
Fabaceae undet. - - -
Fallugla paradoxa - 23
Festuca octoflora - - -
Gallum stellatum - - -
Gllla rippleyl (X)
Gutlerrezia mlcrocephala (2)
Junlperus osteosperma - - 1
Haplopappus brlckellioldea - - -
Hllarla rlglda - - -
Vegetation
(relative
abundance)
(3)
(2)
(1)
(1)
(X)
(X)
(X)
(2)
(1)
(1)
(1)
(2)
(X)
(1)
(X)
(4)
(1)
(X)
Owl Canyon-3
Macrofossil assemblages
sample number and count
OC-3(mod) OC-3(1) OC-3(2)
32,900 >28,700
324 185
55 - -
3 - -
50 - -
2 -
165 - 5
4 41 4
9 - 1
2 - -
10 - -
1 - -
4 6
9 - -
468 1,345
25 -
76 - -
7 - 7
7 - -
1 -
15 - -
125
- 2
2 -
453
I/ I/
_

SUPPLEMENTAL DATA
TABLE 16. Plants from the Owl Canyon (OC) Locality Continued
65
Owl Canyon-2
Vegetation Macrofossll assemblages
(relative sample number and count
Larrea dlvaricata
Lepldlum cf. fremontil
cf. Leptodactylon sp.
Llnanthus sp.
Lye lum sp.
Nlcotiana trlgonophylla
Opuntia basilaris
Opuntla sp.
Penstemon sp.
Peucephylluro schottil
Physalls crasslfolla
Plantago sp.
Pleurocoronls plurlseta
Poaceae undet.
Prunus fasciculata
Psorothamnus fremontli
Salvia dorrii
Scopulophila rlxfordll
Sitanion hystrlx
Sphaeralcea ambigua
Sphaeralcea sp.
Stipa arida
Stlpa sp.
Symphorlcarpos longiflorus
NISP
N
Nts
IS (to current vegetation)
abundance) OC--2(1)
(3)
1
3
12
(3)
(3)
63
44
7
17
91
(1)
29
(4)
1,315
17 23
10 14
8
OC--2(3)
2
21
1
75
33
3
1
115
12
3
1,063
24
15
8
Vegetation
(relative
abundance)
(2)
(1)
(1)
(3)
(3)
(1)
(2)
(X)
(1)
(X)
28
20
Owl Canyon -3
Macrofossll assemblages
sample number and count
OC--3(mod) OC-
764
172
56
1
4
15
21
35
6
2,069 1
26
16
72
-3(1) OC--3(2)
3
1
130 129
2 9
4
3
6 7
279 614
2 11
33 34
,329 2,360
18 16
16 13
27 24
Very abundant (>1,000), not counted.

66 VEGETATION AND CLIMATES OF THE LAST 45,000 YEARS, NEVADA TEST SITE
TABLE 17. Plants from the Point of Rocks (PR) I site[Relative abundance values for modern vegetation data are in parentheses; they indicate: 5, very abundant;
4, abundant; 3, common; 2, occasional; 1, rare; X, present within 30 meters; NISP, number of identified specimens; N, number of plant taxa; Nts , number of species of trees, shrubs, and succulents; IS, Sorensen's index of similarity]
Approximate radiocarbon age
Species
Ameranthus sp.
Ambrosia dumosa
Ambrosia sp.
Amsinckia tesselata
Amsinckia sp.
Aristida sp.
Artemisia sec. Tridentatae
Asteraceae undet.
Atriplex canescans
Atriplex confertifolia
Boraginaceae undet.
Brickellia arguta
JB. watsonii
Brickallia sp.
Bromus rubens
Ceratoides lanata
Cheilanthes feei
Chorizanthe rigida
Coleogyne ramoslssima
Cryptantha sp.
Echinocactus polycephalus
Ephedra funerea
Ephedra torreyana
Ephedra sp.
Eriogonum inflatum
Erioneuron pulchellum
Erodium cicutarium
Eucnide urens
Forsellesla nevedensis
Galium Stellaturn
Vegetation
(reletive
abundance)
Macrofossil assemblages
sample number and count
(2)
(X)
(X)
(1)
(2)
(1)
(X)
(X)
(X)
(2)
(2)
(11
(X)
(3)
(X)
(2)
(2)
PR-l(l) PR-1(3)
9,840
36
11,680
13
50
10
56
89

SUPPLEMENTAL DATA
TABLE 17. Plants from the Point of Rocks (PR)-l site Continued
67
Gilia sp.
Gutierrezia microcephala
Krameria parvifolia
Langloisia setosissima
Larrea divaricata
Lepidium cf. fremontii
Lepidium sp.
Lepidospartum latisquamum
Leptodactylon pungens
Lycium andersonii
L. pallidum
Lycium sp.
Menodora spinescens
Nicotiana trigonophylla
Opuntia basilaris
0. echinocarpa
0. cf. ramosissima
Opuntia sp .
Penstemon sp.
Peucephyllum schottii
Phacelia sp.
Plantago sp.
Poaceae undet.
Porophyllum gracile
Prunus fasciculata
Purshia glandulosa
Purshia sp .
Salvia dorrii
Scopulophila rixfordii
Sphaeralcea ambigua
Sphaeralcea sp.
Svmphoricarpos longiflorus
Thamnosma montana
Yucca brevifolia
NISP
N
N ts
IS (to current vegetation)
Vegetation
(relative
abundance)
(4)
(1)
(2)
(1)
(3)
(1)
(1)
(1)
(1)
(X)
(X)
(1)
(2)
(1)
31
19
Macrofo
sample
PR-l(l)
76
142
25
60
5
43
49
1
30
6
566
1
19
J
2
12
1,256
24
19
37
ssil assemblages
number and count
PR-1 (3)
1
152
7
13
185
3
14
16
18
258
1
42
117
2
3
7
17
1,098
23
17
39
Species in the vicinity, but occurring more than 30 meters from the site.

68 VEGETATION AND CLIMATES OF THE LAST 45,000 YEARS, NEVADA TEST SITE
TABLE 18. Plants from the Point of Rocks <PR)-2 and -3 sites[Relative abundance values for modern vegetation data are in parentheses; they indicate: 5, very abundant; 4, abundant; 3, common; 2, occasional;
1, rare; X, present within 30 meters; NISP, number of identified specimens; N, number of plant taxa; AT(S , number of species of trees, shrubs, and succulents; IS, Sorensen's index of similarity]
Approximate radiocarbon age
Species
Agave utahensis
Ambrosia dumosa
Amphipappus fremontii
Amsinckia sp.
Aristida cf. adscensionis
Artemisia cf. bigelovii
Artemisia sec. Tridentatae
Asteraceae undet.
Atriplex cf. canescens
A. confertifolia
Boraginaceae undet .
Brickellia arguta
Bromus rubens
Buddleja utahensis
Ceratoides lanata
Cheilanthes feei
Chorizanthe brevicornu
C. rigida
Chorizanthe sp.
Chrysothamnus nauseosus
Coleogyne ramosissima
Coryphantha vivipara
Cryptantha spp.
Draba sp.
Echinocactus polycephalus
Encelia virginensis
Ephedra funerea
E. torreyana
Ephedra sp.
Eriogonum heermannii
E. inflatum
Erioneuron pulchellum
Eucnide urens
Eurotia lanata
Fallagia paradoxa
Festuca octoflora
Forsellesia nevadensls
Galium stellatum
Gilia sp.
Gutierrezia microcephala
Gutierrezia sp.
Haplopappus brickellioides
Haplopappus cf. nanus
Hilaria ridiga
Krameria parvifolia
Lappula redowskii
Larrea divaricata
Lepidium fremontii
Lepidium sp.
Leptojactylon pungens
Vegetation
(relative
abundance)
(2)
(2)
(X)
(X)
(4)
(3)
(X)
(X)
(X)
(1)
(1)
(2)
(X)
(2)
(2)
(3)
(3)
(2)
(2)
(1)
(2)
Point of Rocks-2
Macrofossil assemblages
sample number and count
PR-2(2) PR-2(3)
9,560 9,260
186 195
3 45
2
2
31 21
5 30
1
9 17
9
2
6
66 103
4 8
2 3
1
3
96 236
8 15
9
2
34 53
1
1
30 2
102 8
1 7
Point of Rocks -3
Vegetation Macrofossil assemblages
(relative sample number and count
abundance) PR-3
34,800
(4)
(3)
(X) 5
(3)
2
14
(1) 415
_ i
(1)
(X)
11
(X)
(X)
101
111
21
(1) 1
(2)
(1)
123
5
(2)
(1)
1
(X) 4
(2)
(2) 9
9
(11
(3)
(11
1

SUPPLEMENTAL DATA
TABLE 18. Plants from the Point of Rocks (PR)-2 and -3 sites Continued
69
Lycium andersonii
Lycium sp.
Mirabilis sp.
Nicotiana trigonophylla
Opuntia basilaris
0. cf. erinacea
Oryzopsis hymenoides
Penstemon sp.
Petrophytum caespitosum
Peucephyllum schottii
Phacelia sp.
Pleurocoronis pluriseta
Poaceae undet.
Prunus fasciculata
Scopulophila rixfordii
Sphaeralcea ambigua
Sphaeralcea sp.
Stephanomeria pauciflora
Stipa sp.
Symphoricarpos longiflorus
Thamnosma montana
Tidestromia oblongifolia
Yucca brevifolia
Y. schidigera
NISP
N
Nts
Vegetation
(relative
abundance)
U)
(1)
(2)
(2)
(1)
(1)
I/
27
17
Point of Rocks-2
Macrofossil assemblages
sample number and count
PR-2(2) PR-2(3)
2
32
2
1
57
442
84
1
2
3
1,210
28
12
41
2
34
34
3
104
220
171
1
29
18
1,390
31
18
40
Vegetation
(relative
abundance)
(2)
(2)
(X)
(2)
(2)
27
15
Point of Rocks -3
Macrofossil assemblages
sample number and count
PR -3
17
19
2
14
4
17
1
151
961
13
1,968
28
18
24
Species in the vicinity but occurring more than 30 meters from the site.

70 VEGETATION AND CLIMATES OF THE LAST 45,000 YEARS, NEVADA TEST SITE
TABLE 19. Plants from the Last Chance Range (LCR)-l site[Relative abundance values for modern vegetation data are in parentheses; they indicate: 5, very abundant; 4, abundant; 3, common;
2, occasional; 1, rare; X, present within 30 meters; NISP, number of identified specimens; AT, number of plant taxa; ATts , number of species of trees, shrubs, and succulents; IS, Sorensen's index of similarity]
Approximate radiocarbon age
Species
Agave utahensis
Ambrosia acanthicarpa
A. dumosa
Amslnckla sp.
Anemone tuberosa
Artemlsia sec. Tridentatae
Asteraceae undet.
Atriplex confertifolia
Boraginaceae undet.
Brickellia arguta
B. desertorum
Broraus rubens
Huddle j a utahensis
Castilleja sp.
Cercocarpus intricatus
Cheilanthes feel
Chorizanthe brevicornu
C. riglda
Cirsium sp.
Cryptantha cf. pterocarya
Cryptantha sp.
Echinocactus polycephalus
cf. Echinocereus sp.
Encella virginensis
Ephedra funerea
E. torreyana
E. viridis
Ephedra sp.
Eriogonum fasciculatum
Eriogonum heermannii
E. inflatum
Eriogonum sp.
Erioneuron pulchellum
Eschscholtzla sp.
Eucnide urens
Forsellesla nevadensls
Galium stellatum
Gilia sp.
Gutierrezia mlcrocephala
Haplopappus brickelliodes
Junlperus osteosperma
Larrea divaricata
Lepidium fremontii
Lepldium sp.
Lesquerella sp.
Lycium andersonli
Lycium sp. (not L. andersonii)
Mirabilis sp.
Mortonia utahensis
Muhlenbergia porterl
Nicotiana trigonophylla
Opuntia basilaris
0. cf. echinocarpa
Opuntia sp.
Vegetation
(relative
abundance)
(4)
(3)
(1)
(3)
(3)
(X)
(X)
(X)
(1)
(1)
(1)
(1)
(1)
(X)
(X)
(1)
(3)
(1)
(X)
(2)
(4)
(1)
(1)
(1)
(2)
(1)
Macrofossil assemblages
sample number and count
LCR-l(mod)
127
71
189
11
35
12
45
2
1
14
5
52
11
9
74
6
1
2
728
11
2
65
5
9
LCR-K2)
9,280
45
4
13
1
101
2
3
1
1
1
1
14
5
2
29
1
7
170
28
1
110
854
3
16
LCR-K3)
11,760
76
17
1
4
82
6
1
9
6
37
10
5
1
32
1
64
719
I/
29
14
4
2
10

SUPPLEMENTAL DATA
TABLE 19. Plants from the Last Chance Range (LCR)-l site Continued
71
Penstemon sp.
Phacelia sp.
Plantago sp.
Pleurocoronis pluriseta
Poaceae undet.
Prunus fasciculata
Salvia dorrii
S . mohavensis
Sphaeralcea sp.
Stanleya cf. elata
Stipa arida
Symphoricarpos longiflorus
Yucca brevifolia
NISP
N
Nts
IS (to current vegetation)
Vegetation
(relative
abundance)
(X)
-
(1)
-
_
(1)
(1)
_
_
(2)
_
_
_
31
19
-
Macrofossil assemblages
sample number and count
LCR-l(mod)
_
12
_
15
4
10
2
24
_
12
_
_
1,566
28
19
79
LCR-K2)
5
3
2
-
43
_
36
_
19
3
_
4
217
1,751
34
20
31
LCR-1(3)
_
-
13
41
820
_
32
_
_
183
_
2,219
28
18
32
Very abundant (>1,000), not counted.

72 VEGETATION AND CLIMATES OF THE LAST 45,000 YEARS, NEVADA TEST SITE
TABLE 20. Plants from the Specter Range (Spc)-2 site Continued[Relative abundance values for modern vegetation data are in parentheses; they indicate: 5, very abundant; 4, abundant; 3, common;
2, occasional; 1, rare; X, present within 30 meters; NISP, number of identified specimens; N, number of plant taxa; Nts , number of species of trees, shrubs, and succulents; IS, Sorensen's index of similarity]
Approximate radiocarbon age
Species
Ambrosia dumosa
Amphipappus fremontii
Artemisia sec. Tridentatae
Asteraceae undet.
Atriplex confertifolia
Boraginaceae undet.
Brassicaceae undet.
Brickellia watsonii
Brickellia sp.
Bromus rubens
Buddleja utahensis
Castilleja sp.
Ceratoides lanata
Cercocarpus intricatus
Chrysothamnus nauseosus
C. visidiflorus
Chrysothamnus sp.
Coleogyne ramosissima
Cryptantha cf. confertiflora
Ecliinocactus polycephalus
Ephedra rorreyana
Ephedra sp.
Erigeron sp.
Eriogonum deflexum
E. cf. fasciculatum
E. heermannii
E. inflatum
Fendlerella utahensis
Forsellesia cf. nevadensis
Galium stellatum
Cilia sp.
Gutierrezia microcephala
Haplopappus brickelliodes
H. cooperi - type
Hecastocleis shockleyi
Juniperus osteosperma
Krameria parvifolia
Larrea divaricata
Lepldium sp.
Leptodactylon pungens
Lesquerella sp.
Lycium andersonii
Mortonia utahensis
Opuntia sp.
Oryzopsis hymenoides
Penstemon cf. petiolatus
Petrophytum caespitosum
Pinus monophylla
Pleurocoronis pluriseta
Poaceae undet.
Prunus fasciculata
Purshia tridentata
Vegetation . Macrofossil assemblages
(relative , , . sample number and count
abundance)
Ledges
Crest and Spc-2(mod) Spc-2(2) Spc--2(2) Spc-2(3) Spc--2(6) Spc-2(8) Spc--2(10) Spc^dl^
talus
18,740 19,290 23,280 25,900 -/ 27,900 29,140 -/ 32,260
(1) - - - ."-_ _-
(3)-- ______
2 1 2 48 21 4 - 9
2---- 28 3
(3) (2) 533 - - 336 21 33 40 217
6 12---- 1
(2)- ______
(2) (2) 7 - - -
(2) 28 ----- -
-(!)- - -- 4 12 2
35 32 1
--_ _ _ 5 - 3 -
--- x 4 3 _ _ _
(1) - !___-_-
(!) _ ___---
(!)-- ______
(2) (3) 262 ----- -
1 2 - - - - 1
_ - _ !____-
(X) - ____--
-_- _ _ 5 2 - -
(1) (3) 6 - 3 2 1 - -
(X)-- ______
- - 3 138 128 28 - 65 100
_ 1
(DO)
(3) (3) 20 - - - -
(1) 3 _____ 9
14 10 - 29
__ ______ i
21 21 21 21 21 21 21
(1) (1) - ______
3/ - !___-_-
(1) - 81 ----- -
-- - 8 13-- -- 1
(1) ______
--- ______ 16
!____- 1
-- 1-25 341- 1
- - - 7 12 150 51 36 207
- - - 631 2] - -
-__ ___- 8 _
-- 27 3 122- 4
(1) (3) 103 ----- -
--_ ____ i- l
Spc-2(ll) 2 Spc-2(12)
32,100 25,150
6 5
118 18
1
25
1
5
12
5
2
1 5
211 7
19
4 3
21 21
-
3 1
3
1 1
4
303 57
1
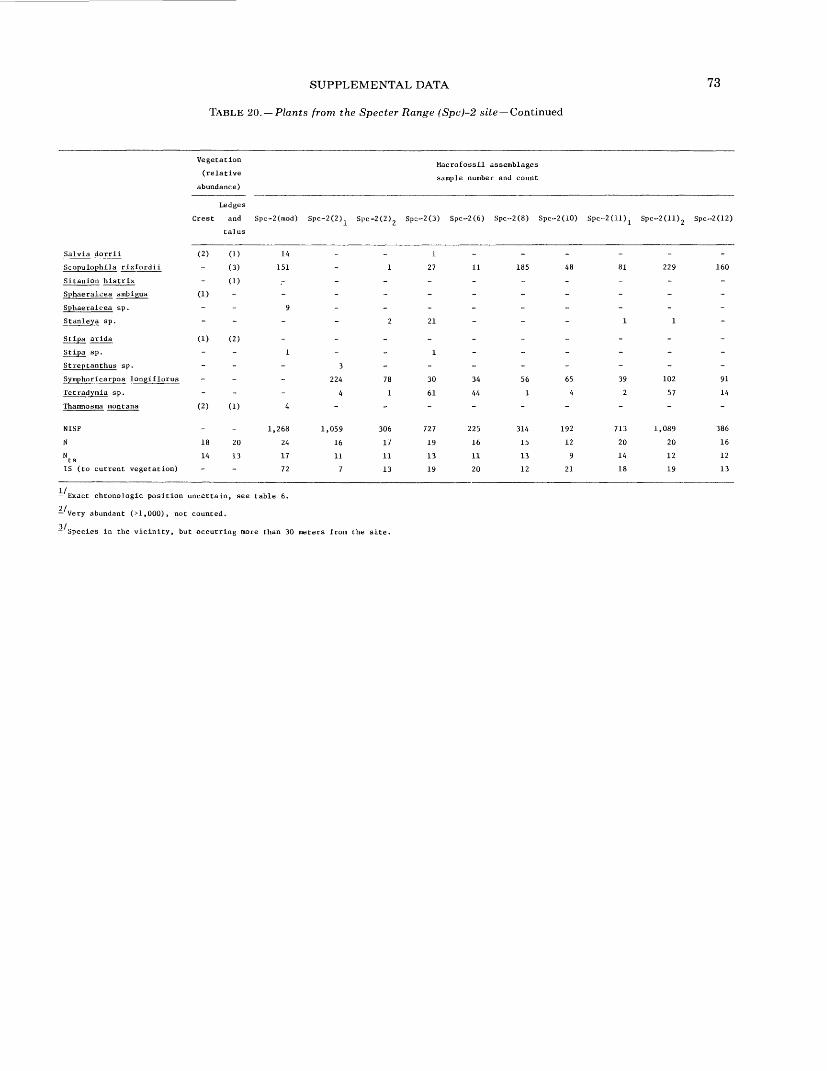
SUPPLEMENTAL DATA
TABLE 20. Plants from the Specter Range (Spc)-2 site Continued
73
Salvia dorrii
Scopulophila rlxfordii
Sitanion histrlx
Sphaeralcea ambigua
Sphaeralcea sp.
Stanleya sp.
Stipa arida
Stipa sp.
Streptanthus sp.
Symphoricarpos longiflorus
Tetrad ymia sp.
Tharanosma montana
NISP
N
N ts
IS (to current vegetation)
Vegetation
(relative
abundance)
Ledges
Crest and Spc-2(mod)
talus
(2) (]) 14
(3) 151
U)
(1)
- - 9
-
(1) (2)
- - 1
-
(2) (1) 4
1,268
18 20 24
14 13 17
72
Macrofossil assemblages
sample number and count
Spc-2(2) Spc-2(2) 2 Spc-2(3) Spc-2(6) Spc--2(8) Spc--2(10) Spc-2(ll) 1 Spc--2(ll) 2 Spc--2(12)
__!___ __
1 27 11 185 48 81 229 160
______ __
2 21--- 11-
1 - - - -
3_____ --
224 78 30 34 56 65 39 102 91
4 1 61 44 14 2 57 14
1,059 306 727 225 314 192 713 1,089 386
16 17 19 16 15 12 20 20 16
11 11 13 11 13 9 14 12 12
7 13 19 20 12 21 18 19 13
Exact chronologic position uncertain, see table 6.
2/ Very abundant (>1,000), not counted.
Species in the vicinity, but occurring more than 30 meters from the site.

74 VEGETATION AND CLIMATES OF THE LAST 45,000 YEARS, NEVADA TEST SITE
TABLE 21. Plants from the Specter Range (Spc)-3 site[Relative abundance values for modern vegetation data are in parentheses; they indicate: 5, very abundant; 4, abundant;
3, common; 2, occasional; 1, rare; X, present within 30 meters; NISP, number of identified specimens; N, number of plant taxa; NIS , number of species of trees, shrubs, and succulents; IS, Sorensen's index of similarity]
Approximate radiocarbon age
Species
Ambrosia dumosa
Amphipappus fremontii
Aristida sp.
Artemisia sec. Tridentatae
Asteraceae undet.
Atriplex confertifolia
Boraginaceae undet.
Brickellia arguta
B. watsonii
Buddleja utahensis
Castilleja sp.
Ceratoides lanata
Cheilanthes feei
Chrysothamnus nauseosus
Coleogvne ramosissima
Cowania mexicana
Cryptantha cf . pterocarya
Cryptantha sp.
Descurainia sp.
Echinocactus polycephalus
Encelia virginensis
Eohedra funerea
E. nevadensis
Ephedra sp.
cf . Eriogonum fasciculatum
E. heermannii
E. inflatum
Fendlerella utahensis
Forsellesia cf. nevadensis
Galium stellatum
Gilia sp.
Grayia spinosa
Gutierrezia microcephala
Haplopappus cooperi (or nanus)
Juniperus osteosperma
Larrea tridentata
Lepidium fremontii
cf. Leptodactylon pungens
Vegetation
(relative
abundance)
(1)
(2)
(1)
(2)
(3)
(1)
(3)
(2)
(X)
2/
_
(X)
(1)
(1)
(1)
(1)
_
(X)
_
(1)
(2)
(2)
_
2/
(3)
_
Macrofossil assemblages
sample number and count
Spc-3A(l) Spc-3A(2)
20,200 I/
_
_
2 36
19
118 9
-
_
_
1
166 4
1 62
3
16
5
10
15
2
_
_
_
_
207
1 1
_ _
3 32
1 4
_
24
3 1
2 1
7
3/ 3/
_
2 5
1
Spc-3B
28,460
-
_
127
8
201
1
_
_
21
_
3
_
_
-
_
.
_
1_
_
17
2_
2
_
_
2
3/
_
2
2

SUPPLEMENTAL DATA
TABLE 21. Plants from the Specter Range (Spc)-3 site Continued
75
Lesquerella sp.
Lycium andersonii
L. pallidum
Lye ium sp.
Mirabilis sp.
Mortonia utahensis
Opuntia cf . erinacea
Opuntia sp.
Oryzopsis hymenoides
Petrophytum caespitosum
Phacelia cf. rotundifolia
Phacelia sp.
Plagiobothrys jonesii
Poa fendleriana
Poaceae undet.
Scopulophila rixfordii
Sphaeralcea amhigua
Sphaeralcea sp.
Stephanomeria pauciflora
Stipa arida
Symphoricarpos longiflorus
Tetradymla axillaris
Thamnosma montana
Yucca brevifolia
Yucca sp.
NISP
N
Nts
IS (to current vegetation)
Macrofossil assemblages Vegetation s
. . sample number and count
abundance) Spc-3A(l) Spc-3A(2)
1 -
(2)
(2)
1
- 2
5
5
(X) 3 2
12 1
(X)
- 6
(X)
(1)- 5
(3) 10 8
(2)
2 -
(1)
(2)
91 609
(1)
(1)
- 3
423 1,107
33 18 33
20 15 22
34 43
Spc-3B
2
1
1
15
1
114
162
686
22
15
17
Contaminated sample, see table 6.
2/ Species in the vicinity, but occurring more than 30 meters from the site.
Very abundant (>1,000), not counted.

76 VEGETATION AND CLIMATES OF THE LAST 45,000 YEARS, NEVADA TEST SITE
TABLE 22. Plants from the Specter Range (Spc)-l site[Relative abundance values for modern vegetation data are in parentheses; they indicate: 5, very abundant; 4, abundant;
3, common; 2, occasional; 1, rare; X, present within 30 meters; NISP, number of identified specimens; N, number of plant taxa; Nts , number of species of trees, shrubs, and succulents; IS, Sorensen's index of similarity]
Approximate radiocarbon ages
Species
Acamptopappus sphaerocephalus
Ambrosia dumosa
A. eriocentra
Amsinckia sp.
Arabis sp.
Aristida glauca
Asteraceae undet.
Atriplex canescens
A. confertifolia
Boraginaceae undet.
Brickellia arguta
B. desertorum
Bromus rigidus
B. rubens
Buddleja utahensis
Castilleja sp.
Ceratoides lanata
Chorizanthe rigida
Chrysothamnus viscidif lorus
Coleogyne ramosissima
Coryphantha vivipara
Cryptantha sp.
Cuscuta sp.
Descurainia sp.
Dichelostemma pulchellum
Echinocactus polycephalus
Echinocereus sp.
Encelia virginensis
Ephedra nevadensis
E. torreyana
Ephedra sp.
Eriogonum heermannii
E. fasciculatum
E. inflatum
In wash
(2)
(1)
(X)
(3)
(X)
(X)
(X)
(1)
(X)
(3)
Vegetation
(relative abundance)
On rocks On top
and terrace of ridge
(1)
(1)
(X)
(X)
(1)
(3)
(2)
(X)
(1)
(X)
(1)
I/
II
(1)
(X)
(1)
I/
(1)
(1)
(4)
(X)
Macrofossil assemblages
sample number and count
Spc-l(l) Spc-l(2)
300+40 100-100
3 21
1 3
22 21
625 140
30
2 5
8 2
10
4 29
40 22
1
1
1
1 2
1
77 70
3 4
5 8

SUPPLEMENTAL DATA
TABLE 22. Plants from the Specter Range (Spc)-l site Continued
77
Erioneuron pulchellum
Euphorbia sp.
[ 'estuca octoflora
Cilia sp.
Grayia spinosa
Gutierrezia microcephala
Hilaria rigida
Hymenoclea salsola
Krameria grayi
Larrea divaricata
Lepidium fremontii
Lepidium sp .
Leptodactylon pungens
Lycium andersonii
L. pallidum
In wash
(X)
(3)
(4)
(1)
(X)
(2)
(1)
Vegetation
(relative abundance)
On rocks On top
and terrace of ridge
(1)
(X)
(X)
(1)
(1)
(X)
I/
(1)
(2)
Macrofossil assemblages
sample number and count
Spc-l(l)
2
35
75
15
1
87
34
Spc-l(2)
1
6
55
171
84
576
23
6
Lycium sp.
Kachaeranthera tortifolia (1)
Mirabilis bigelovii
Opuntia basila'fis
Opuntia sp. (not (3. basilaris)
Oryzopsis hymenoides
Oxytheca perfoliolata (X)
Phacelia sp. (X)
Plantago sp.
Poaceae undet. -
Psorothamnus fremontii
Salazaria mexicana (1)
Salsola kali (X)
Scopulophila rixfordii
Sphaeralcea ambigua (1)
Stanleya pinnata (1)
Stipa sp.
Thamnosma montana (1)
Yucca schidigera
Yucca sp.
NISP
N 26
Nts U
IS (to current vegetation, combined)
(X)
(X)
(2)
(X)
(1)
(1)
(1)
(X)
(1)
(1)
(1)
I/
1,165
35
25
73
55
1,469
34
24
70
Species in the vicinity, but occurring more than 30 meters from the site.
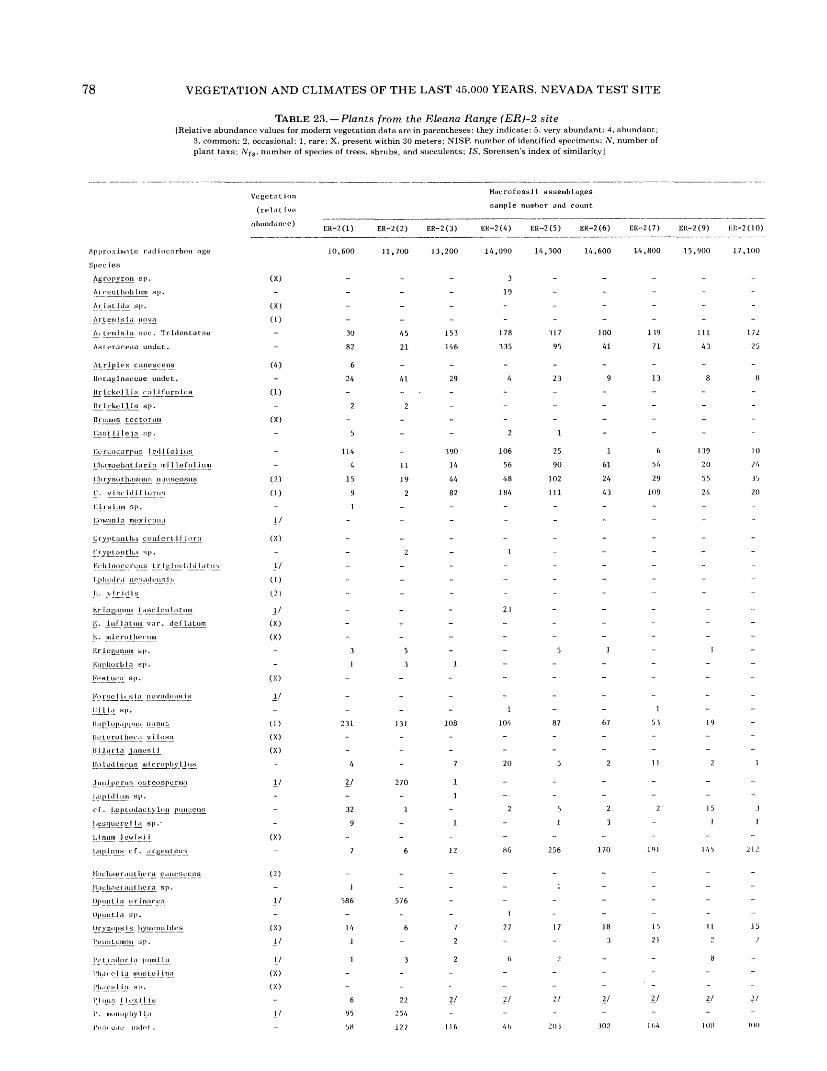
78 VEGETATION AND CLIMATES OF THE LAST 45,000 YEARS, NEVADA TEST SITE
TABLE 23. Plants from the Eleana Range (ER)-2 site[Relative abundance values for modern vegetation data are in parentheses; they indicate: 5, very abundant: 4, abundant;
3, common; 2, occasional; 1, rare; X, present within 30 meters; NISP, number of identified specimens; TV, number of plant taxa; N^s , number of species of trees, shrubs, and succulents; IS, Sorensen's index of similarity]
Approximate radiocarbon age
Spec lea
Ag ro pyron s p .
ArrcuLhobtum sp.
A r 1st Ida sp.
Arlemlsjj^ jiovn^
A. UMiiisla sec. Tridentatae
Aslerareae undet.
ALripie-x canescens
Boraglnactiae undet.
HrickcJlia rnlifornica
RrickellJa sp.
Bcoraiis tcctorum
Iii! s LLL!llS. !; P-
Cercocarpus lediloliiis
Cli.i_maeJ>ntiar.Iji mi Itefol ium
Clirysothaiiinur! IUUHCOSUS
c - vl?.t^dtLJJiEil5
CLI si inn sp.
Cowan i a muxu-aiui
CrypLanlh.i confcrt Jl lora
Crypjumtlia -;p.
I'Vhinocereus irijjloi-liiu I.itus
Kphedra iiov.Hleiisih
( : . v i r i (1 1 s
Kr tognnuin 1 .ssciculatum
R. In T In Linn var. dcflalum
K. microtlierum
Er logonum sp.
luipjiorbla sp.
Kestura sp.
I'orsclUsla nevadcuisi s
(HI Id sp.
i'MJCiSl'-'il'l'.'l?. £2145.
llen-rolliec.i v _i_los^
Ililaria James li
Ho 1 od Lsc-us micropliy LJiis
JiinJperuK oateospurma
I.upjdlum sp.
cf. l.cpLodacLvlon pun|;,ens
I,est|uurel la sp.-
Llnura JcwlsJl
I.iip-_lnus cf. <iL'geiiteu'j
Macliaerantlu'ra c.mc> scans
M.tclinet ant hera sp.
OpiinLia erinacen
(IpiintJa s)>.
Orj/zopsls hyrai;noidcs
VeiiaLcinoii sp.
Pu t iji_d_o r la piiKUjjl
I'lidi-ol la inusLei Ina
I'li.u-tlia s|>.
I'lntis I U-xJHs
1'. monopj.ylla
I'oa. u.u- niidi-l .
Vegetation
(rejative
abundance) ER_?(1)
JO, 600
(X)
-
(X)
(1)30
82
CO 6
24
(1)
2
(X)
5
1H
4
(2) 15
(1) 9
1
\l
(X)
-
I/
(1)
(?-)
I/
(X)
(X)
3
1
(X)
i/
-
(1) 231
(X)
(X)
4
11 27
-
32
9
(X)
7
(2)
1
i/ 586
-
(X) 14
!/ i
y i(X)
(X)
6
]/ 95
58
MacrofossJ] assemblages
sample number and count
ER-2(2) ER-2(3) ER~2(4) ER-2(5) ER-2(6) ER-2(7) ER-2(9) £11-2(10)
11,700 13,200 14,090 14,300 14,600 14,800 15,900 17,100
3
__ 19 _____
-
_
45 153 178 317 100 U9 111 172
21 146 335 95 41 71 43 25
_
41 29 4 23 9 13 8 8
_,_
2 ______
__ ______
2 1 - - - -
390 106 25 1 6 139 10
11 14 56 90 61 54 20 24
]9 44 48 102 24 29 55 35
2 82 184 Jll 43 109 24 20
_
_
-
2- !____-
-
__ ______
-
21
__ ____ --
__ ___- __
5 - - 5 1 1 -
3 1 - - - - _ _
-
_
1 - - 1 - -
131 108 104 87 67 53 19
-
_
7 20 5 2 11 21
270 1 -
1 -
1 - 2 5 2 2 15 3
1 - 1 3 J 1
- -
6 12 86 256 170 191 145 212
__ ___- _ -
; -576 - _ _ _ - - -
t -
6 7 27 17 18 15 11 15
2 - - 3 21 22
32 6 2 8 -
-
_
22 21 21 21 21 21 21 21
254 - -
127 116 4b 20 i 302 1 (>4 1 IW UMI
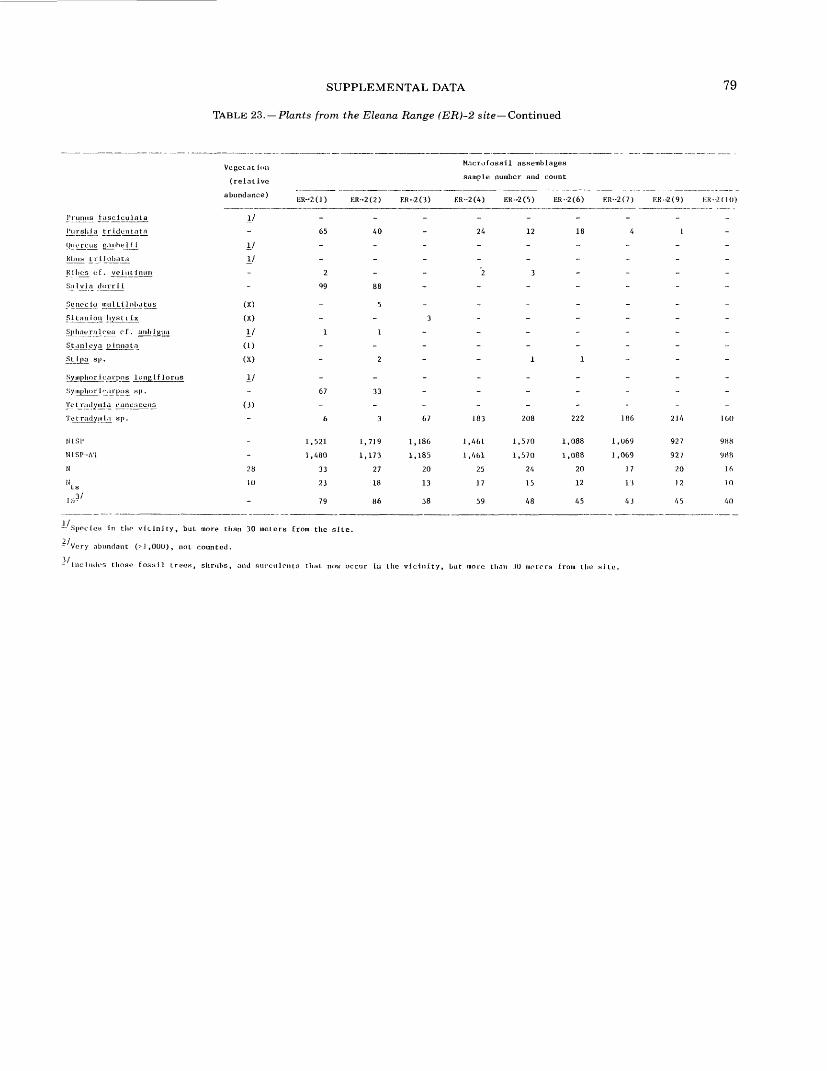
SUPPLEMENTAL DATA
TABLE 23. Plants from the Eleana Range (ER)-2 site Continued
79
i'runus fasciculata
1'urshia tridentata
(Juercus g-imbem.
Kliu^ U-j.J_obata_
Ribes c:f. veiiiUnum
Si\ 1 vi a dorrU
Scnecto inultllolutus
Sitanion hyst i ix
Sphatralcea cf. anib i gua
St.mloya p innata
St Ipa sp.
Symplioricarpos long If lor us
Syiiiphorii-.irpus .sp.
Tclradpnia canes cens
'I'er racism la sp.
NISI'
NISI'-AT
N
H LS
IS-3 '
Species in the vicinity, but
- Very abundant (>1,000), not
-'includes tliose fosyil trees,
., , Macrofossil assemblages Vegetation 6(relative sample number and count
abundance) ER-?.(j) ER-2(2) ER-2(3) ER-2(4) ER-2(5) ER-2(6) ER--2(7)
I/ _______
65 40 - 24 12 18 4
17 _______
y _______
2 2 3 - -
99 88 -
(X) - 5
(X) 3
y i i(1) _______
(X) - 2 - - 1 1 -
I/ -__-__-
67 33 - -
(J) _______
6 3 67 183 208 222 186
1,521 1,719 1,186 1,461 1,570 1,088 1,069
1,480 1,173 1,185 1,461 1,570 1,088 1,069
28 33 27 20 25 24 20 17
10 23 18 13 17 15 12 1'J
79 86 58 59 48 45 4J
more than 30 meters from the site.
counted.
KR--2(9) KR--2(10)
_
1
-
-
_
-
_
-
-
-
-
-
-
214 160
927 988
927 9«8
20 16
12 10
45 40
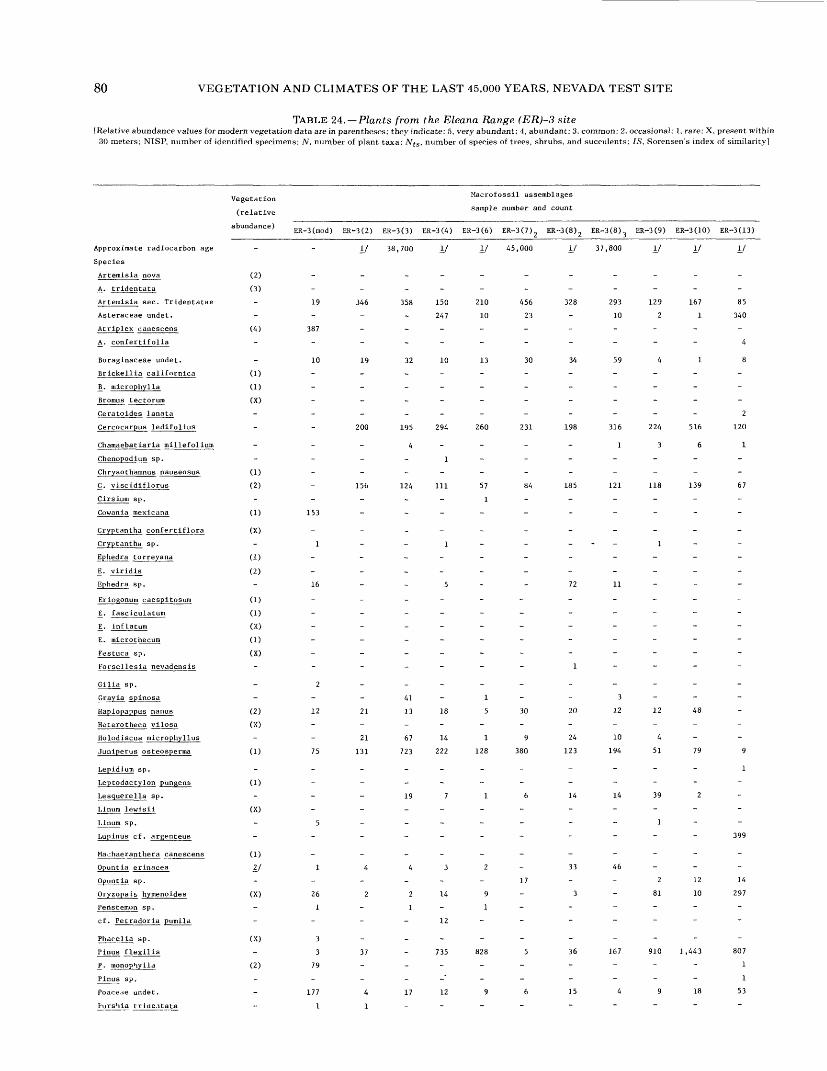
80 VEGETATION AND CLIMATES OF THE LAST 45,000 YEARS, NEVADA TEST SITE
TABLE 24. Plants from the Eleana Range (ER)-3 site[Relative abundance values for modern vegetation data are in parentheses; they indicate; 5, very abundant; 4, abundant; 3, common; 2, occasional; 1, rare; X, present within
30 meters; NISP, number of identified specimens; N, number of plant taxa: NfS , number of species of trees, shrubs, and succulents; IS, Sorensen's index of similarity]
Approximate radiocarbon age
Species
Arteraisia nova
A. tridentata
Artemisia sec. Tridentatae
Asteraceae undet.
Atriplex canescens
A. confertifolia
Boraginaceae undet.
Brickellia californica
B. raicrophylla
Broraus tectorum
Ceratoides lanata
Cercocarpus ledifolius
Charaaebatiaria millefolium
Chenopodium sp.
Chryaothamnus nauseosus
C. viscidif lorus
Cirsiura sp.
Cowania mexicana
Cryptantha confertiflora
Cryptantha sp.
Ephedra torreyana
E. viridis
Ephedra sp.
Eriogonum caespitosum
E. fasciculatura
E. inflatura
E. microthecum
Festuca sp.
Forsellesia nevadensis
Gilia sp.
Grayia spinosa
Hapiopappus nanus
Heterotheca vilosa
Holodiscus microphyllus
Juniperus osteosperraa
Lepidium sp.
Leptodactylon pungens
Lesquerella sp.
Llnum lewisii
Linura sp.
Lupinus cf . argenteus
Maohaeranthera canescens
Opuntia erinacea
Opuntia sp.
Oryzopsib hymenoides
Penstemon sp.
cf. Petradoria puraila
Pharelia sp.
Pinus flexilis
P. monophylla
Pir.us sp.
Poaceae undet.
PursMa triaeatata
Vegetation
(relative
abundance)
(2)
(3)
(4)
(1)
(1)
(X)
(1)
(2)
(1)
(X)
(1)
(2)
(1)
(1)
(X)
(1)
(X)
(2)
(X)
(1)
(1)
(X)
(1)
U
(X)
(X)
(2)
Macrofossil assemblages
sample number and count
ER-3(mod) ER-3(2) ER-3(3) ER-3(4) ER-3(6) ER-3(7) ER--3(8) 2 ER~3(8) ER-3(9) ER-3(10) ER--3(13)
I/ 38,700 I/ 11 45,000 I/ 37,800 I/ I/ I/
19 J46 358 150 210 456 328 293 129 167 85
- 247 10 23 - 10 2 1 340
387 - ___ _ _ ___
10 19 32 10 13 30 34 59 4 1 8
_________ 2
200 195 294 260 231 198 316 224 516 120
4---- 1361
1- - - ___
156 124 111 57 84 185 121 118 139 67
---!----- -
153 _ ___ _ - ___
1 - -i- - _._ i _
16 - 5 - 72 11 - -
_ _ _ - -
2 _____
-41-1- - 3 - - -
12 21 13 18 5 30 20 12 12 48
21 67 14 1 9 24 10 4 -
75 131 723 222 128 380 123 194 51 79 9
_ _ - 1
19 7 1 6 14 14 39 2 -
5___-_ _ _ i _ -
_--- - ---399
1 4 432- 33 46 - -
17 - - 2 12 14
26 2 2 14 9 3 - 81 10 297
1- 1-1- -----
_ _ 12 - - _____
3 _ _ _ _ - _____
3 37 - 735 828 5 36 167 910 1,443 807
79----- ____ i
_ _- ____ i
177 4 17 12 9 6 15 4 9 18 53
1 1 - - - - _____

SUPPLEMENTAL DATA 81
TABLE 24. Plants from the Eleana Range <ER)-3 site Continued
Quercus gambelii
Rhus trilobata
Ribes cf. velutinum
Ribes sp.
Salvia coluinbariae
S. dorrii
Senecio multilobatus
Sphaeralcea sp.
Stanleya pinnata
Stipa sp.
Symphoricarpos longiflorus
Symphoricarpos sp.
Tetradymia sp.
NISP
N
N ts
g
Vegetation
(relative
abundance)
2/
(1)
_
_
(X)
(X)
(1)
(1)
(X)
(2)
_
-
-
33
20
Macrofossil assemblages
sample number and count
ER-3(mod) ER-3(2) ER-3(3) ER-3(4) ER-3(6) ER-3(7) 2 ER-3(8> 2 ER-3(8) ER--3(9) ER-3(10) ER-3(13)
2-_-_------
5 ----------
I - I - - - 1 - - -!_4______
_
______ i
17 _________ i
__________
___ _ - - i _
__________
4 - 27 79 39 28 135 101 97 132 86
125 18 78 37 81 126 71 92 100 26
999 1,068 1,646 2,014 1,616 1,386 1,347 1,434 1,780 2,674 2,322
22 14 17 21 19 14 16 19 19 15 20
14 11 12 14 12 10 12 14 11 10 16
Age uncertain, see table 6.
21 Species in the vicinity, but more than 30 meters from the site.

82 VEGETATION AND CLIMATES OF THE LAST 45,000 YEARS, NEVADA TEST SITE
TABLE 25. Plants from the Eureka View (EV) fossil locality 1[Macrofossil data are presented in terms of relative abundance classes; 5, very abundant; 4, abundant; 3, common; 2, occasional; 1, rare; 0, less than five fragments,
a possible contaminant. B.P., before present; N, total number of plant taxa; Np, total number of woody perennials; IS, Sorensen's index of similarity between macrofossil assemblage and the modern plant community (using N); %, percent. Data from Spaulding (1980)]
Relative abundance of apecies
in macrofossil assemblage
Approximate radiocarbon age
21 2 /
Species
Ambrosia dumos
Amphipappus fremontii
Amsinckia intermedia
A- tesselata
Amsinckia sp.
Aristida adscensionis
Artemisia sec. Tridentatae
Atriplex confertlfolia^2/
Brickellia arguta
Cheilanthes feei-
Chorizanthe cf. brevicornu21 Chorizanthe cf. rigid a-'
cf. Chrysothamnus sp.
Echinocactus polycephalu
Encelia virginensis21 Ephedra nevadensis
Ephedra cf. viridis
2/
2,635+
140 B.P.
EV-4(1) EV-4 (2) EV-4 (3)
1,580+
140 B.P.
3,930+
180 B.P.
535+
150 B.P.
5,595+
210 B.P.
6,795+
190 B.P.
5,435+
220 B.P.
14,720+
530 B.P.
8,330+
250 B.P.
2/
Eriogonum inflatum
E. fasciculatum-
Eriogonum sp.
Erloneuron pulchellum
2/ Eucnide urens
Euphorbia sp.
Festuca sp.
Foresellesia nevadensis Gilla sp.-/
Gutierrezia microcephal2 /
Haplopappus brickellioides
K. Iaricifoliui3
Haplopappus sp.
Hecastocleis shockleyi
Juniperus osteosperma
2/
Larrea tridentat
Lepidium cf. fremontii
Lepidium sp.
Lycium sp.
cf. Machaeranthera sp.
Mirabilis sp.
Nama sp.-'
Nicotiana trigonophyll
Opuntia basllaris
(). echinocarpa
Opuntia sp.
Penstemon sp.
Peucephyllum schottii21 Phacelia crenulata
Phacelia sp.
21
2f Physalis cf. crassifolia '
Pinus cf. flexilis
Psorothamnus fremontii

SUPPLEMENTAL DATA 83
TABLE 25. Plants from the Eureka View (EV) fossil locality Continued 1
Relative abundance of species
in inacrofossil assemblage
Salvia dorrii
cf. Sclerocactus sp.
Scopulophila rixfordii-
Sphaeralcea sp.
Stipa sp.
Symphoricarpos cf. longiflorus
Tidestomia oblongifolia2/
Viguiera retieulata
N (26)
Np (15)
N /N (100) (58%)
IS
EV-1 EV-2A
1
1
1
3
19 18
12 8
63% 44%
62 64
EV-2B
-
2
22
13
59%
58
EV-2C
1
1
1
18
11
61%
54
EV-3 EV-4(1)
1 1
1
2
14 16
9 11
64% 69%
50 38
EV-4(2) EV~4(3) EV-5A
- - 1
1
21-
- - 1
- 1 -
1
13 12 22
10 10 14
77% 77% 64%
31 41 17
EV-5B
1
12
6
50%
37
In the northern Eureka Valley, Inyo County, California (1,390 to 1,555 meters; T. 7 S., R. 38 E., S^NW** sec. 23; Soldier Pass,
California-Nevada 15" quadrangle).
2/ Plant species presently at site.
Dominant plant species presently at site.
*U.S. GOVERNMENT PRINTING OFFICE.-1986 676-047/26010