vegetables and pulses yearbook data - cornell...
TRANSCRIPT
Yearbook tables contain a time series of the annual per capita supply and use data for fresh and processed vegetables and for dry pulse crops. Included are U.S. production, exports, imports, per capita utilization, and prices.
Notice: Effective March 20, 2015, the Vegetables and Pulses Yearbook reflects a number of enhancements. The publication now includes an additional 30 supply and utilization tables uniquely provided by the Economic Research Service. Consistent with notifications in the 2014 Vegetables and Pulses Yearbook tables, the 2015 version decreases publication redundancy across USDA agencies without reduction in data availability. Users are directed to original date sources in the note on the bottom of each of these tables in the 2014 Vegetables and Pulses Yearbook. A side-by-side comparison of 2014 vs. 2015 Yearbook contents will be found in the Data Documentation on the Economic Research Service website for Vegetable and Pulses data (http://www.ers.usda.gov/data-products/vegetables-and-pulses-data.aspx).
Vegetables and Pulses Yearbook Data Hodan Farah Wells, Jennifer Bond, and Suzanne Thornsbury
March 20, 2015
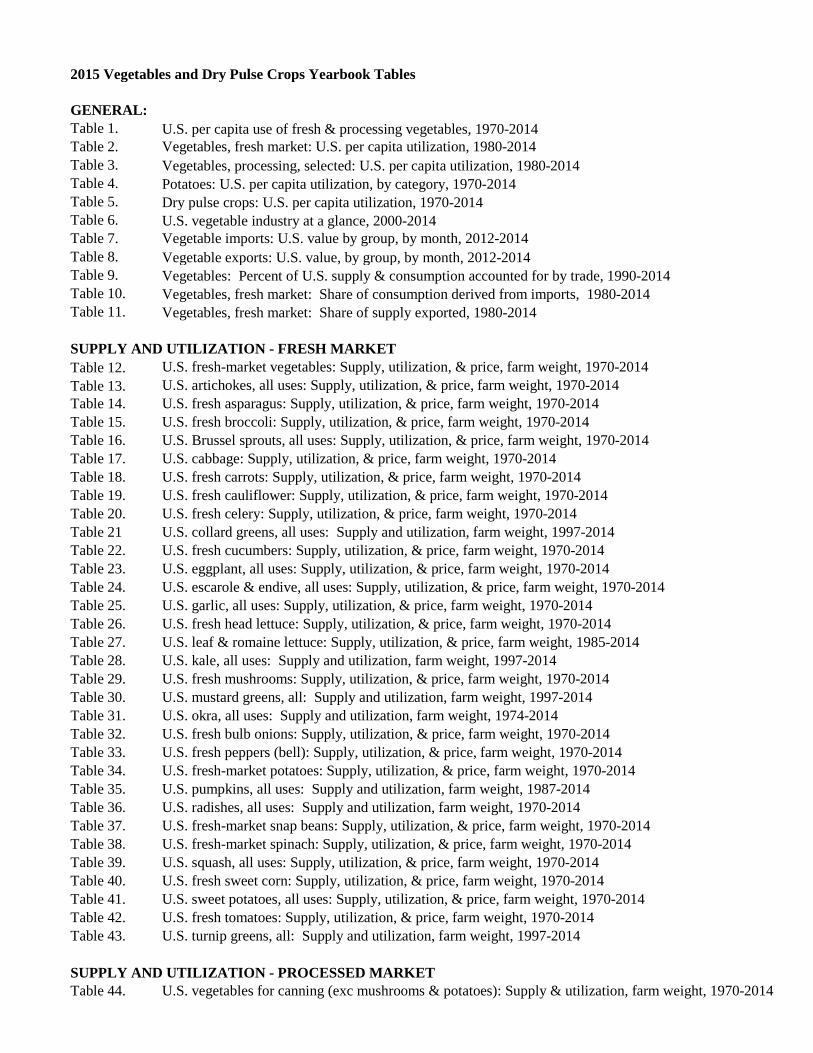
2015 Vegetables and Dry Pulse Crops Yearbook Tables GENERAL: Table 1. U.S. per capita use of fresh & processing vegetables, 1970-2014 Table 2. Vegetables, fresh market: U.S. per capita utilization, 1980-2014 Table 3. Vegetables, processing, selected: U.S. per capita utilization, 1980-2014 Table 4. Potatoes: U.S. per capita utilization, by category, 1970-2014 Table 5. Dry pulse crops: U.S. per capita utilization, 1970-2014 Table 6. U.S. vegetable industry at a glance, 2000-2014 Table 7. Vegetable imports: U.S. value by group, by month, 2012-2014 Table 8. Vegetable exports: U.S. value, by group, by month, 2012-2014 Table 9. Vegetables: Percent of U.S. supply & consumption accounted for by trade, 1990-2014 Table 10. Vegetables, fresh market: Share of consumption derived from imports, 1980-2014 Table 11. Vegetables, fresh market: Share of supply exported, 1980-2014 SUPPLY AND UTILIZATION - FRESH MARKET Table 12. U.S. fresh-market vegetables: Supply, utilization, & price, farm weight, 1970-2014 Table 13. U.S. artichokes, all uses: Supply, utilization, & price, farm weight, 1970-2014 Table 14. U.S. fresh asparagus: Supply, utilization, & price, farm weight, 1970-2014 Table 15. U.S. fresh broccoli: Supply, utilization, & price, farm weight, 1970-2014 Table 16. U.S. Brussel sprouts, all uses: Supply, utilization, & price, farm weight, 1970-2014 Table 17. U.S. cabbage: Supply, utilization, & price, farm weight, 1970-2014 Table 18. U.S. fresh carrots: Supply, utilization, & price, farm weight, 1970-2014 Table 19. U.S. fresh cauliflower: Supply, utilization, & price, farm weight, 1970-2014 Table 20. U.S. fresh celery: Supply, utilization, & price, farm weight, 1970-2014 Table 21 U.S. collard greens, all uses: Supply and utilization, farm weight, 1997-2014 Table 22. U.S. fresh cucumbers: Supply, utilization, & price, farm weight, 1970-2014 Table 23. U.S. eggplant, all uses: Supply, utilization, & price, farm weight, 1970-2014 Table 24. U.S. escarole & endive, all uses: Supply, utilization, & price, farm weight, 1970-2014 Table 25. U.S. garlic, all uses: Supply, utilization, & price, farm weight, 1970-2014 Table 26. U.S. fresh head lettuce: Supply, utilization, & price, farm weight, 1970-2014 Table 27. U.S. leaf & romaine lettuce: Supply, utilization, & price, farm weight, 1985-2014 Table 28. U.S. kale, all uses: Supply and utilization, farm weight, 1997-2014 Table 29. U.S. fresh mushrooms: Supply, utilization, & price, farm weight, 1970-2014 Table 30. U.S. mustard greens, all: Supply and utilization, farm weight, 1997-2014 Table 31. U.S. okra, all uses: Supply and utilization, farm weight, 1974-2014 Table 32. U.S. fresh bulb onions: Supply, utilization, & price, farm weight, 1970-2014 Table 33. U.S. fresh peppers (bell): Supply, utilization, & price, farm weight, 1970-2014 Table 34. U.S. fresh-market potatoes: Supply, utilization, & price, farm weight, 1970-2014 Table 35. U.S. pumpkins, all uses: Supply and utilization, farm weight, 1987-2014 Table 36. U.S. radishes, all uses: Supply and utilization, farm weight, 1970-2014 Table 37. U.S. fresh-market snap beans: Supply, utilization, & price, farm weight, 1970-2014 Table 38. U.S. fresh-market spinach: Supply, utilization, & price, farm weight, 1970-2014 Table 39. U.S. squash, all uses: Supply, utilization, & price, farm weight, 1970-2014 Table 40. U.S. fresh sweet corn: Supply, utilization, & price, farm weight, 1970-2014 Table 41. U.S. sweet potatoes, all uses: Supply, utilization, & price, farm weight, 1970-2014 Table 42. U.S. fresh tomatoes: Supply, utilization, & price, farm weight, 1970-2014 Table 43. U.S. turnip greens, all: Supply and utilization, farm weight, 1997-2014 SUPPLY AND UTILIZATION - PROCESSED MARKET Table 44. U.S. vegetables for canning (exc mushrooms & potatoes): Supply & utilization, farm weight, 1970-2014
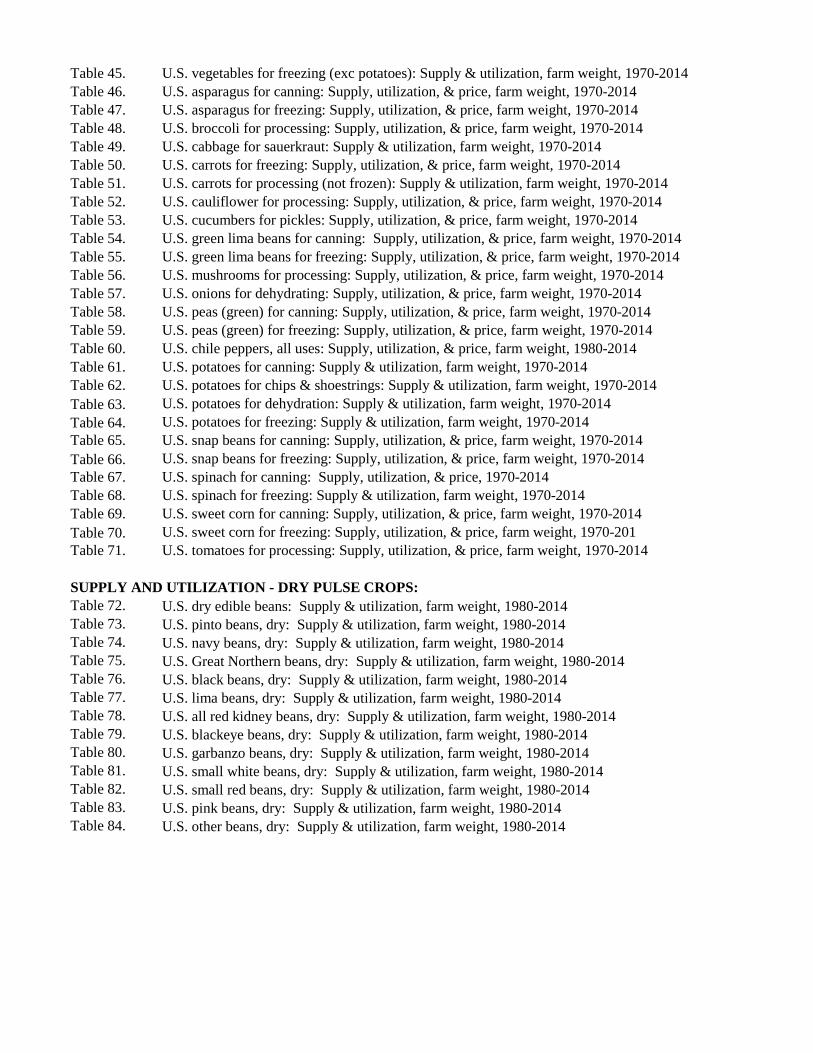
Table 45. U.S. vegetables for freezing (exc potatoes): Supply & utilization, farm weight, 1970-2014 Table 46. U.S. asparagus for canning: Supply, utilization, & price, farm weight, 1970-2014 Table 47. U.S. asparagus for freezing: Supply, utilization, & price, farm weight, 1970-2014 Table 48. U.S. broccoli for processing: Supply, utilization, & price, farm weight, 1970-2014 Table 49. U.S. cabbage for sauerkraut: Supply & utilization, farm weight, 1970-2014 Table 50. U.S. carrots for freezing: Supply, utilization, & price, farm weight, 1970-2014 Table 51. U.S. carrots for processing (not frozen): Supply & utilization, farm weight, 1970-2014 Table 52. U.S. cauliflower for processing: Supply, utilization, & price, farm weight, 1970-2014 Table 53. U.S. cucumbers for pickles: Supply, utilization, & price, farm weight, 1970-2014 Table 54. U.S. green lima beans for canning: Supply, utilization, & price, farm weight, 1970-2014 Table 55. U.S. green lima beans for freezing: Supply, utilization, & price, farm weight, 1970-2014 Table 56. U.S. mushrooms for processing: Supply, utilization, & price, farm weight, 1970-2014 Table 57. U.S. onions for dehydrating: Supply, utilization, & price, farm weight, 1970-2014 Table 58. U.S. peas (green) for canning: Supply, utilization, & price, farm weight, 1970-2014 Table 59. U.S. peas (green) for freezing: Supply, utilization, & price, farm weight, 1970-2014 Table 60. U.S. chile peppers, all uses: Supply, utilization, & price, farm weight, 1980-2014 Table 61. U.S. potatoes for canning: Supply & utilization, farm weight, 1970-2014 Table 62. U.S. potatoes for chips & shoestrings: Supply & utilization, farm weight, 1970-2014 Table 63. U.S. potatoes for dehydration: Supply & utilization, farm weight, 1970-2014 Table 64. U.S. potatoes for freezing: Supply & utilization, farm weight, 1970-2014 Table 65. U.S. snap beans for canning: Supply, utilization, & price, farm weight, 1970-2014 Table 66. U.S. snap beans for freezing: Supply, utilization, & price, farm weight, 1970-2014 Table 67. U.S. spinach for canning: Supply, utilization, & price, 1970-2014 Table 68. U.S. spinach for freezing: Supply & utilization, farm weight, 1970-2014 Table 69. U.S. sweet corn for canning: Supply, utilization, & price, farm weight, 1970-2014 Table 70. U.S. sweet corn for freezing: Supply, utilization, & price, farm weight, 1970-201 Table 71. U.S. tomatoes for processing: Supply, utilization, & price, farm weight, 1970-2014 SUPPLY AND UTILIZATION - DRY PULSE CROPS: Table 72. U.S. dry edible beans: Supply & utilization, farm weight, 1980-2014 Table 73. U.S. pinto beans, dry: Supply & utilization, farm weight, 1980-2014 Table 74. U.S. navy beans, dry: Supply & utilization, farm weight, 1980-2014 Table 75. U.S. Great Northern beans, dry: Supply & utilization, farm weight, 1980-2014 Table 76. U.S. black beans, dry: Supply & utilization, farm weight, 1980-2014 Table 77. U.S. lima beans, dry: Supply & utilization, farm weight, 1980-2014 Table 78. U.S. all red kidney beans, dry: Supply & utilization, farm weight, 1980-2014 Table 79. U.S. blackeye beans, dry: Supply & utilization, farm weight, 1980-2014 Table 80. U.S. garbanzo beans, dry: Supply & utilization, farm weight, 1980-2014 Table 81. U.S. small white beans, dry: Supply & utilization, farm weight, 1980-2014 Table 82. U.S. small red beans, dry: Supply & utilization, farm weight, 1980-2014 Table 83. U.S. pink beans, dry: Supply & utilization, farm weight, 1980-2014 Table 84. U.S. other beans, dry: Supply & utilization, farm weight, 1980-2014

Vegetables and Pulses Yearbook Data/#89011/ March 20, 2015Economic Research Service, USDA
Table 1a --U.S. per capita use of selected, commercially produced, fresh, and processing vegetables and dry pulse crops, 1970-2014 Crop 1970 1971 1972 1973 1974 1975 1976 1977 1978 1979 1980 1981 1982
Asparagus, all 1.3 1.3 1.3 1.3 1.1 1.2 1.2 1.0 0.9 0.7 0.8 0.8 0.7 Fresh 0.4 0.4 0.4 0.4 0.4 0.4 0.4 0.3 0.3 0.3 0.3 0.3 0.4 Canning 0.6 0.6 0.6 0.6 0.5 0.6 0.5 0.5 0.4 0.3 0.4 0.4 0.3 Freezing 0.3 0.3 0.3 0.3 0.2 0.2 0.3 0.2 0.2 0.2 0.1 0.1 0.1Snap/green beans, all 7.6 7.5 7.5 8.0 7.7 7.0 7.8 7.5 7.5 7.5 7.2 7.6 7.0 Fresh 1.5 1.5 1.5 1.4 1.4 1.5 1.5 1.4 1.3 1.3 1.3 1.3 1.3 Canning 4.7 4.6 4.6 4.9 4.9 4.5 4.9 4.8 4.8 4.7 4.6 4.6 4.2 Freezing 1.4 1.4 1.4 1.7 1.5 1.1 1.5 1.4 1.4 1.4 1.4 1.7 1.5Broccoli, all 1/ 1.5 1.6 1.6 1.8 1.8 2.0 2.2 2.3 2.4 2.6 2.9 3.2 3.5 Fresh 0.5 0.7 0.7 0.8 0.8 1.0 1.1 1.2 1.0 1.2 1.4 1.7 2.0 Freezing 1.0 0.9 0.9 1.0 1.0 1.0 1.1 1.1 1.4 1.4 1.5 1.6 1.5Cabbage, all 11.1 11.3 10.6 11.0 11.1 11.0 10.6 10.5 10.6 10.1 10.0 10.2 10.3 Fresh 8.8 8.8 8.4 8.9 8.8 8.9 8.4 8.3 8.6 8.1 8.0 8.2 8.6 Canning (kraut) 2.3 2.5 2.2 2.1 2.3 2.1 2.2 2.2 2.1 2.1 2.0 2.0 1.7Carrots, all 2/ 9.5 9.5 10.4 10.7 10.7 10.0 10.0 9.0 8.7 9.6 9.6 9.6 9.6 Fresh 6.0 6.1 6.5 6.7 6.9 6.4 6.4 5.3 5.3 5.9 6.2 6.1 6.6 Canning 2.1 2.0 2.4 2.3 2.0 1.9 1.9 1.9 1.6 1.8 1.8 1.6 1.2 Freezing 1.4 1.3 1.5 1.8 1.8 1.6 1.6 1.8 1.8 1.9 1.7 1.9 1.8Cauliflower, all 1/ 1.2 1.3 1.4 1.4 1.5 1.5 1.6 1.8 1.6 1.8 1.9 2.3 2.2 Fresh 0.7 0.7 0.8 0.8 0.8 0.9 1.0 1.1 0.8 1.1 1.1 1.4 1.3 Freezing 0.5 0.6 0.5 0.6 0.7 0.6 0.6 0.7 0.8 0.7 0.8 0.9 0.9Celery 7.3 7.3 7.1 7.6 7.4 6.9 7.4 7.1 7.1 7.1 7.4 7.3 7.4Sweet corn, all 3/ 27.9 27.7 28.1 28.3 27.0 26.0 26.8 28.9 26.3 26.0 25.9 24.7 23.4 Fresh 7.8 7.5 7.8 7.9 7.7 7.8 8.0 7.6 6.6 6.5 6.5 6.2 6.0 Canning 14.3 14.8 15.0 14.5 13.5 12.0 13.1 14.1 13.4 12.7 13.0 12.1 11.6 Freezing 5.8 5.5 5.3 5.9 5.8 6.2 5.7 7.2 6.3 6.9 6.4 6.3 5.8Cucumbers, all 8.5 8.3 8.4 8.4 8.7 8.9 9.2 9.3 9.9 9.7 9.3 9.3 9.3 Fresh 2.8 2.8 3.0 2.8 3.0 2.8 3.1 3.5 3.8 3.8 3.9 4.0 4.2 Pickling 5.7 5.5 5.4 5.7 5.7 6.1 6.1 5.8 6.1 5.9 5.4 5.3 5.1Melons ** 21.6 20.6 20.1 19.7 17.5 17.6 18.8 19.4 20.2 19.2 18.0 19.4 22.3 Watermelon 13.5 13.0 12.3 12.7 11.3 11.4 12.6 12.6 11.9 11.4 10.7 11.7 12.5 Cantaloupe 7.2 6.6 6.8 5.9 5.1 5.1 5.1 5.5 6.6 6.1 5.9 6.1 7.7 Honeydew 0.9 0.9 1.0 1.1 1.0 1.1 1.0 1.1 1.6 1.6 1.4 1.5 1.8 Others 0.0 0.0 0.0 0.0 0.0 0.0 0.1 0.1 0.1 0.1 0.1 0.1 0.3Lettuce, all 22.4 22.4 22.4 23.1 23.5 23.5 24.2 25.8 25.1 25.1 25.6 24.9 24.9 Head lettuce 22.4 22.4 22.4 23.1 23.5 23.5 24.2 25.8 25.1 25.1 25.6 24.9 24.9 Romaine & leaf -- -- -- -- -- -- -- -- -- -- -- -- --Onions, all 11.3 12.2 11.6 11.4 12.7 12.5 11.8 12.4 12.2 13.4 12.2 11.6 14.2 Fresh 10.1 10.7 10.7 10.2 11.2 10.5 11.0 11.1 10.9 11.4 11.4 10.7 12.2 Dehydrating 1.2 1.5 0.9 1.2 1.5 2.0 0.8 1.3 1.3 1.9 0.8 0.8 2.0Green peas, all 4/ 5.1 5.2 5.1 5.3 4.8 4.7 4.7 4.8 4.7 4.5 4.5 4.4 4.1 Canning 3.2 3.2 3.1 3.4 2.9 2.8 2.9 3.1 2.9 2.6 2.7 2.7 2.5 Freezing 1.9 2.1 2.0 1.9 1.9 1.9 1.9 1.8 1.8 1.9 1.8 1.7 1.7Peppers, all 2.2 2.3 2.4 2.5 2.7 2.5 2.7 2.8 2.8 2.9 5.9 6.1 6.0 Bell peppers, all 2.2 2.3 2.4 2.5 2.7 2.5 2.7 2.8 2.8 2.9 2.9 2.8 3.0 Chile peppers, all -- -- -- -- -- -- -- -- -- -- 3.1 13.8 3.1Tomatoes, all 74.2 111.2 77.0 34.4 73.2 76.1 78.2 47.0 71.8 16.6 76.4 11.8 73.0 Fresh 12.1 11.3 12.1 12.5 11.8 12.0 12.6 12.4 12.9 12.4 12.8 12.3 12.9 Canning 62.1 68.3 64.9 58.4 61.3 61.9 65.7 62.8 58.8 64.3 63.6 59.3 60.1Other, fresh 5/ 4.3 4.3 4.4 4.7 4.8 5.1 5.0 5.3 5.3 6.0 6.3 6.4 6.6Other, canning 6/ 2.7 3.0 3.0 2.9 2.5 2.7 2.9 2.8 2.8 2.4 2.5 2.3 2.0Other, freezing 7/ 2.9 3.2 3.1 3.2 2.9 2.8 3.0 2.7 2.8 2.7 2.6 2.6 2.6 Subtotal, no melons 8/ 201.0 208.0 205.3 202.5 204.1 202.3 209.3 209.1 202.1 208.7 211.0 204.9 206.9 Fresh 86.9 86.7 88.3 90.2 91.2 90.2 92.7 93.0 91.7 93.1 95.0 93.6 97.4 Canning 97.7 104.5 101.2 94.8 95.6 94.6 100.2 97.9 92.8 96.7 99.0 93.7 91.7 Freezing 15.2 15.2 14.9 16.4 15.7 15.5 15.7 16.8 16.4 16.9 16.2 16.8 15.7 Subtotal, with melons 8/ 222.6 228.6 225.5 222.3 221.5 219.9 228.1 228.4 222.3 227.9 229.0 224.2 229.1 Fresh 108.5 107.3 108.4 109.9 108.6 107.8 111.5 112.4 111.8 112.3 113.0 112.9 119.6Potatoes, all 121.7 117.8 119.4 118.2 117.2 121.9 125.3 122.1 119.5 117.9 114.7 116.5 115.0 Fresh 61.8 56.1 57.9 52.4 49.4 52.6 49.5 50.1 46.0 49.4 51.1 45.8 47.1 Processing 59.9 61.7 61.5 65.8 67.8 69.3 75.8 72.0 73.5 68.5 63.6 70.7 67.9Sweet potatoes 5.4 4.9 4.9 5.0 4.9 5.4 5.4 4.7 4.9 5.1 4.4 4.7 5.5Mushrooms 1.3 1.4 1.6 1.7 1.8 1.9 2.1 2.5 2.7 2.9 2.7 2.9 2.9Dry peas & lentils 0.8 0.7 0.8 0.6 0.7 0.4 0.6 0.4 0.8 0.4 0.4 0.6 0.4Dry edible beans 6.2 6.6 6.0 7.3 5.0 6.6 6.1 6.3 5.0 6.1 5.3 5.2 7.3Total (no melons) 336.4 339.4 338.0 335.3 333.7 338.5 348.8 345.1 335.0 341.0 338.5 334.8 338.0Total (with melons) 358.0 360.0 358.2 355.1 351.1 356.1 367.5 364.4 355.2 360.3 356.5 354.1 360.2See footnotes at end of table. Continued--
------------------------------------------------------------------------ pounds, farm-weight --------------------------------------------------------------------------------

Vegetables and Pulses Yearbook Data/#89011/ March 20, 2015Economic Research Service, USDA
Table 1b --U.S. per capita use of selected, commercially produced, fresh, and processing vegetables and dry pulse crops, 1970-2014 --Continued Crop 1983 1984 1985 1986 1987 1988 1989 1990 1991 1992 1993 1994 1995
Asparagus, all 0.8 0.8 0.9 1.0 1.0 1.1 1.0 1.0 1.0 1.0 0.9 0.9 0.9 Fresh 0.4 0.4 0.5 0.6 0.6 0.6 0.6 0.6 0.6 0.6 0.6 0.6 0.6 Canning 0.3 0.3 0.3 0.3 0.3 0.3 0.3 0.3 0.3 0.3 0.3 0.3 0.3 Freezing 0.1 0.1 0.1 0.1 0.1 0.1 0.1 0.1 0.1 0.1 0.1 0.1 0.1Snap/grn beans, all 6.8 6.8 6.9 6.6 6.7 6.7 7.1 6.7 7.0 7.2 7.2 7.3 6.8 Fresh 1.2 1.3 1.3 1.3 1.2 1.2 1.2 1.1 1.1 1.5 1.5 1.5 1.6 Canning 4.1 3.7 3.8 3.9 3.8 3.8 3.9 3.7 4.1 4.0 4.0 3.8 3.5 Freezing 1.5 1.8 1.9 1.5 1.7 1.7 2.0 1.9 1.8 1.7 1.7 1.9 1.7Broccoli, all 1/ 3.6 4.2 4.5 4.8 5.3 6.2 6.0 5.6 5.3 5.8 5.6 6.7 6.9 Fresh 2.0 2.5 2.6 3.1 3.1 3.8 3.8 3.4 3.0 3.4 3.3 4.4 4.3 Freezing 1.6 1.7 2.0 1.8 2.2 2.4 2.2 2.2 2.3 2.4 2.3 2.3 2.6Cabbage, all 10.3 10.3 10.3 10.2 10.7 10.4 9.9 9.5 9.6 9.8 10.7 10.3 9.5 Fresh 8.2 8.6 8.7 8.6 9.1 9.0 8.6 8.3 8.2 8.7 9.3 9.1 8.1 Canning (kraut) 2.1 1.7 1.6 1.6 1.6 1.4 1.3 1.2 1.4 1.2 1.4 1.2 1.4Carrots, all 9.5 10.7 9.7 9.5 11.4 10.5 11.5 11.8 11.3 12.3 14.7 16.9 15.4 Fresh 6.5 6.7 6.5 6.5 8.3 7.1 8.1 8.3 7.7 8.3 10.9 12.7 11.2 Canning 1.3 1.9 1.4 1.2 1.0 1.1 0.9 1.2 1.2 1.7 1.1 1.4 1.6 Freezing 1.8 2.1 1.8 1.8 2.1 2.3 2.5 2.3 2.4 2.3 2.8 2.8 2.6Cauliflower, all 1/ 2.3 2.8 2.8 3.1 3.1 3.1 3.1 3.0 2.5 2.5 2.8 2.6 2.3 Fresh 1.4 1.8 1.8 2.2 2.1 2.2 2.3 2.2 2.0 1.8 2.1 2.0 1.6 Freezing 0.9 1.0 0.9 0.9 1.0 0.9 0.8 0.8 0.6 0.7 0.7 0.6 0.6Celery 7.0 7.1 6.9 6.5 6.6 7.2 7.5 7.2 6.7 7.3 7.3 7.2 6.9Sweet corn, all 2/ 24.4 24.7 26.2 25.7 24.7 24.9 24.4 26.3 26.3 27.7 27.8 27.3 28.6 Fresh 6.1 6.4 6.4 6.1 6.3 5.8 6.5 6.7 5.9 6.9 7.0 8.2 7.8 Canning 11.6 10.2 11.9 12.1 10.6 10.4 9.5 11.0 11.1 11.9 11.1 10.1 10.4 Freezing 6.7 8.0 7.9 7.6 7.8 8.7 8.4 8.6 9.4 8.9 9.7 9.1 10.3Cucumbers, all 9.7 9.9 10.2 10.0 10.6 10.1 10.0 9.7 9.6 9.5 9.5 10.1 10.7 Fresh 4.5 4.7 4.4 4.6 5.1 4.8 4.8 4.7 4.6 4.9 5.2 5.4 5.6 Pickling 5.2 5.2 5.8 5.3 5.5 5.3 5.2 5.0 5.1 4.6 4.3 4.8 5.1Melons ** 19.9 24.1 24.3 24.9 24.7 24.1 26.9 24.8 23.6 25.5 24.9 25.6 26.4 Watermelon 11.3 14.4 13.5 12.8 13.0 13.6 13.6 13.3 12.7 14.7 14.2 15.0 15.2 Cantaloup 6.5 7.7 8.5 9.4 9.2 7.9 10.4 9.2 8.6 8.5 8.6 8.4 9.0 Honeydew 1.8 1.8 2.1 2.4 2.2 2.4 2.5 2.1 1.9 2.1 1.7 2.0 1.9 Other 0.2 0.2 0.2 0.3 0.3 0.3 0.4 0.2 0.3 0.3 0.3 0.3 0.3Lettuce, all 22.4 24.9 26.9 24.3 28.2 30.2 32.3 31.5 30.0 30.5 29.4 30.7 28.1 Head lettuce 22.4 24.9 23.7 21.9 25.7 27.0 28.7 27.8 26.0 25.8 24.4 25.0 22.2 Romaine & leaf -- -- 3.3 2.4 2.5 3.2 3.6 3.8 4.0 4.7 5.0 5.7 5.9Onions, all 13.8 14.6 15.2 15.6 14.9 16.2 16.4 17.1 17.3 17.5 19.2 17.9 19.1 Fresh 12.2 13.1 13.6 13.7 13.4 14.6 14.8 15.1 15.7 16.1 17.2 16.9 17.8 Dehydrating 1.7 1.5 1.6 1.9 1.5 1.7 1.6 2.0 1.6 1.4 2.0 1.0 1.3Green peas, all 3/ 4.2 4.0 4.1 4.1 3.7 3.7 3.7 4.2 4.2 4.1 3.5 3.6 3.6 Canning 2.4 2.0 2.1 2.2 2.0 1.8 1.7 2.0 1.9 2.1 1.6 1.4 1.6 Freezing 1.8 2.0 2.1 1.9 1.7 1.9 2.0 2.2 2.3 2.0 1.9 2.1 2.1Peppers, all 6.6 7.2 7.7 8.1 8.4 8.8 9.2 10.7 10.8 12.7 12.5 11.2 10.8 Bell peppers, all 3.3 3.6 3.8 4.0 4.2 4.5 4.7 5.9 6.3 7.1 7.6 7.1 7.0 Chile peppers, all 3.3 114.9 3.9 4.2 4.2 80.5 4.5 48.5 4.5 17.5 4.9 13.8 3.8Tomatoes, all 74.4 111.2 78.1 34.4 81.1 76.1 86.2 47.0 92.5 16.6 92.1 11.8 91.4 Fresh 4/ 13.5 14.2 14.9 15.8 15.9 16.8 16.8 15.5 15.4 15.5 16.3 16.2 16.8 Canning 60.9 68.5 63.2 63.6 65.2 61.3 69.4 75.3 77.1 73.3 75.8 76.3 74.6Other, fresh 5/ 7.0 7.0 7.5 7.0 7.4 7.6 8.3 8.4 8.6 8.9 9.1 9.7 9.2Other, canning 6/ 1.7 1.9 1.6 1.6 1.4 1.5 1.4 2.4 2.4 2.0 2.1 2.6 2.3Other, freezing 7/ 2.4 2.4 2.5 2.7 2.5 2.9 2.8 2.1 2.6 2.5 2.8 2.9 2.8 Subtotal, no melons 8/ 207.1 221.8 222.0 220.2 227.7 229.1 240.5 247.9 247.7 249.9 257.1 260.4 255.2 Fresh 95.9 102.3 105.8 104.2 111.5 115.4 120.2 118.9 115.8 121.3 126.8 131.6 126.7 Canning 92.8 99.1 95.5 95.9 95.6 91.1 98.2 106.8 108.9 106.6 106.4 106.0 104.5 Freezing 16.7 19.0 19.1 18.3 19.1 21.0 20.6 20.2 21.4 20.6 22.0 21.8 22.7 Subtotal, with melons 8/ 227.0 246.0 246.3 245.1 252.4 253.2 267.4 272.6 271.3 275.5 282.0 286.0 281.6 Fresh 115.8 126.4 130.1 129.1 136.2 139.5 147.1 143.6 139.4 146.9 151.7 157.3 153.0Potatoes, all 118.7 122.1 122.4 125.9 126.0 122.3 127.0 123.9 134.1 129.9 136.7 136.7 136.9 Fresh 49.8 48.3 46.3 48.8 47.9 49.6 50.0 46.7 50.2 48.3 50.1 49.6 49.2 Processing 68.9 73.8 76.1 77.1 78.1 72.7 77.0 77.2 83.9 81.6 86.6 87.1 87.7Sweet potatoes 4.6 4.9 5.4 4.4 4.4 4.1 3.9 4.4 3.9 4.1 3.7 4.5 4.2Mushrooms 3.5 3.5 3.6 3.8 3.6 3.5 3.6 3.7 3.7 3.7 3.7 4.0 3.8Dry peas & lentils 9/ 0.4 0.4 0.4 0.7 0.6 0.7 0.6 0.5 0.5 0.6 0.5 0.4 0.9Dry edible beans 6.2 5.3 6.8 6.3 5.3 6.7 5.4 6.7 7.4 7.8 7.2 7.7 7.5Total (no melons) 340.5 358.0 360.6 361.3 367.6 366.4 381.0 387.1 397.2 396.0 408.9 413.7 408.5Total (with melons) 360.4 382.2 384.9 386.2 392.3 390.5 407.9 411.9 420.9 421.6 433.8 439.3 434.9See footnotes at end of table. Continued--
------------------------------------------------------------------------ pounds, farm-weight --------------------------------------------------------------------------------
Vegetables and Pulses Yearbook Data/#89011/ March 20, 2015Economic Research Service, USDA
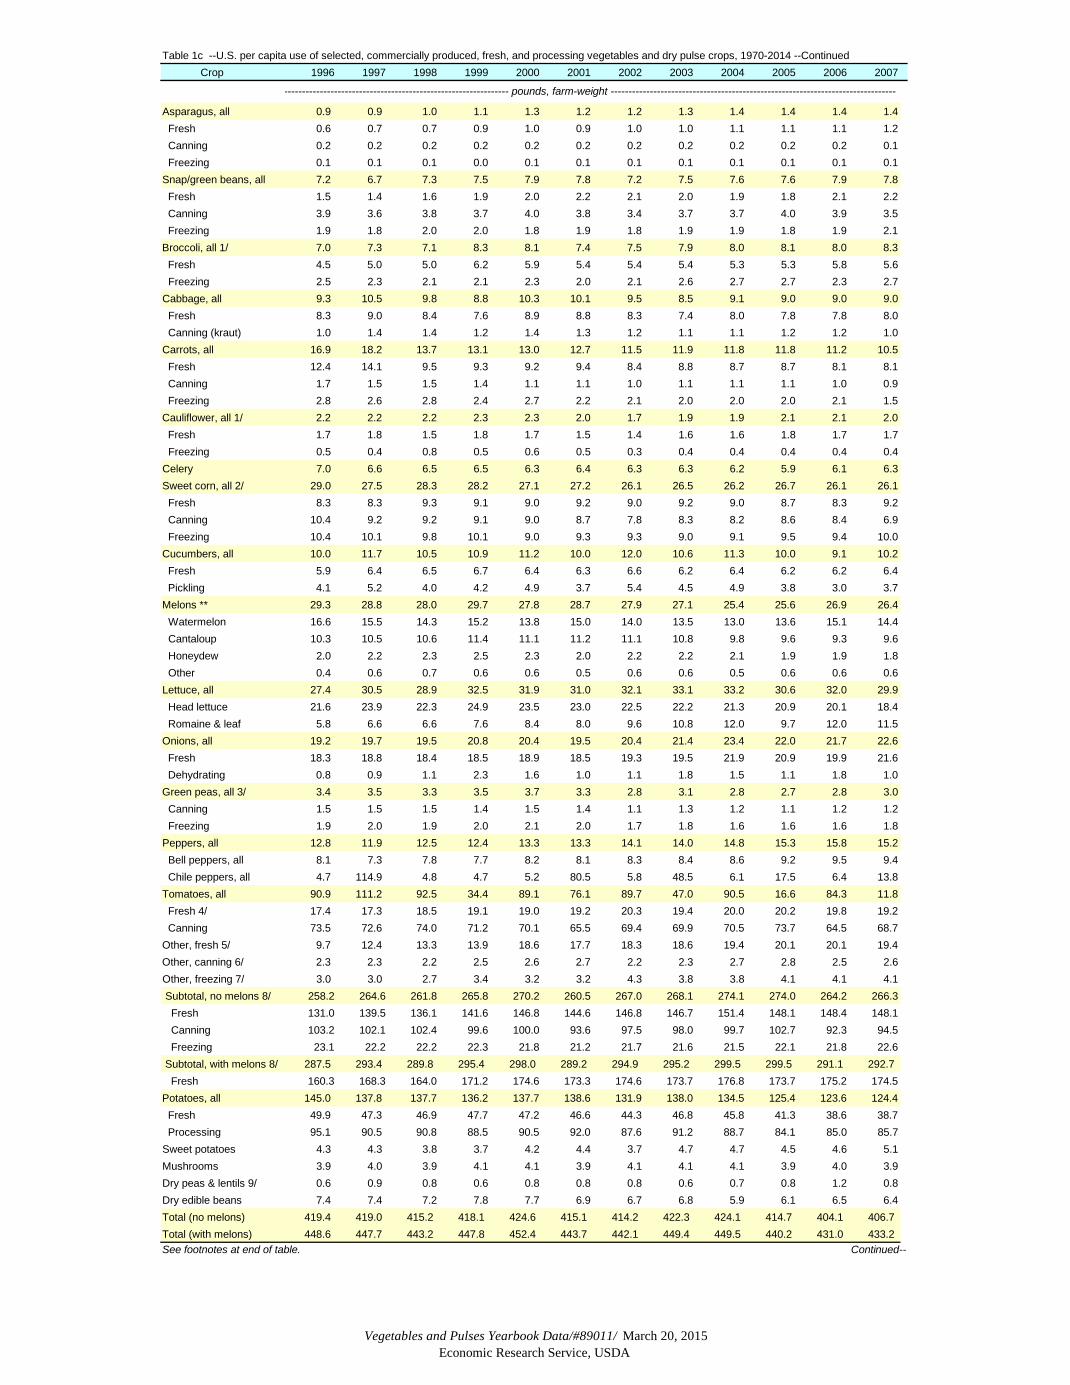
Table 1c --U.S. per capita use of selected, commercially produced, fresh, and processing vegetables and dry pulse crops, 1970-2014 --Continued Crop 1996 1997 1998 1999 2000 2001 2002 2003 2004 2005 2006 2007
Asparagus, all 0.9 0.9 1.0 1.1 1.3 1.2 1.2 1.3 1.4 1.4 1.4 1.4 Fresh 0.6 0.7 0.7 0.9 1.0 0.9 1.0 1.0 1.1 1.1 1.1 1.2 Canning 0.2 0.2 0.2 0.2 0.2 0.2 0.2 0.2 0.2 0.2 0.2 0.1 Freezing 0.1 0.1 0.1 0.0 0.1 0.1 0.1 0.1 0.1 0.1 0.1 0.1Snap/green beans, all 7.2 6.7 7.3 7.5 7.9 7.8 7.2 7.5 7.6 7.6 7.9 7.8 Fresh 1.5 1.4 1.6 1.9 2.0 2.2 2.1 2.0 1.9 1.8 2.1 2.2 Canning 3.9 3.6 3.8 3.7 4.0 3.8 3.4 3.7 3.7 4.0 3.9 3.5 Freezing 1.9 1.8 2.0 2.0 1.8 1.9 1.8 1.9 1.9 1.8 1.9 2.1Broccoli, all 1/ 7.0 7.3 7.1 8.3 8.1 7.4 7.5 7.9 8.0 8.1 8.0 8.3 Fresh 4.5 5.0 5.0 6.2 5.9 5.4 5.4 5.4 5.3 5.3 5.8 5.6 Freezing 2.5 2.3 2.1 2.1 2.3 2.0 2.1 2.6 2.7 2.7 2.3 2.7Cabbage, all 9.3 10.5 9.8 8.8 10.3 10.1 9.5 8.5 9.1 9.0 9.0 9.0 Fresh 8.3 9.0 8.4 7.6 8.9 8.8 8.3 7.4 8.0 7.8 7.8 8.0 Canning (kraut) 1.0 1.4 1.4 1.2 1.4 1.3 1.2 1.1 1.1 1.2 1.2 1.0Carrots, all 16.9 18.2 13.7 13.1 13.0 12.7 11.5 11.9 11.8 11.8 11.2 10.5 Fresh 12.4 14.1 9.5 9.3 9.2 9.4 8.4 8.8 8.7 8.7 8.1 8.1 Canning 1.7 1.5 1.5 1.4 1.1 1.1 1.0 1.1 1.1 1.1 1.0 0.9 Freezing 2.8 2.6 2.8 2.4 2.7 2.2 2.1 2.0 2.0 2.0 2.1 1.5Cauliflower, all 1/ 2.2 2.2 2.2 2.3 2.3 2.0 1.7 1.9 1.9 2.1 2.1 2.0 Fresh 1.7 1.8 1.5 1.8 1.7 1.5 1.4 1.6 1.6 1.8 1.7 1.7 Freezing 0.5 0.4 0.8 0.5 0.6 0.5 0.3 0.4 0.4 0.4 0.4 0.4Celery 7.0 6.6 6.5 6.5 6.3 6.4 6.3 6.3 6.2 5.9 6.1 6.3Sweet corn, all 2/ 29.0 27.5 28.3 28.2 27.1 27.2 26.1 26.5 26.2 26.7 26.1 26.1 Fresh 8.3 8.3 9.3 9.1 9.0 9.2 9.0 9.2 9.0 8.7 8.3 9.2 Canning 10.4 9.2 9.2 9.1 9.0 8.7 7.8 8.3 8.2 8.6 8.4 6.9 Freezing 10.4 10.1 9.8 10.1 9.0 9.3 9.3 9.0 9.1 9.5 9.4 10.0Cucumbers, all 10.0 11.7 10.5 10.9 11.2 10.0 12.0 10.6 11.3 10.0 9.1 10.2 Fresh 5.9 6.4 6.5 6.7 6.4 6.3 6.6 6.2 6.4 6.2 6.2 6.4 Pickling 4.1 5.2 4.0 4.2 4.9 3.7 5.4 4.5 4.9 3.8 3.0 3.7Melons ** 29.3 28.8 28.0 29.7 27.8 28.7 27.9 27.1 25.4 25.6 26.9 26.4 Watermelon 16.6 15.5 14.3 15.2 13.8 15.0 14.0 13.5 13.0 13.6 15.1 14.4 Cantaloup 10.3 10.5 10.6 11.4 11.1 11.2 11.1 10.8 9.8 9.6 9.3 9.6 Honeydew 2.0 2.2 2.3 2.5 2.3 2.0 2.2 2.2 2.1 1.9 1.9 1.8 Other 0.4 0.6 0.7 0.6 0.6 0.5 0.6 0.6 0.5 0.6 0.6 0.6Lettuce, all 27.4 30.5 28.9 32.5 31.9 31.0 32.1 33.1 33.2 30.6 32.0 29.9 Head lettuce 21.6 23.9 22.3 24.9 23.5 23.0 22.5 22.2 21.3 20.9 20.1 18.4 Romaine & leaf 5.8 6.6 6.6 7.6 8.4 8.0 9.6 10.8 12.0 9.7 12.0 11.5Onions, all 19.2 19.7 19.5 20.8 20.4 19.5 20.4 21.4 23.4 22.0 21.7 22.6 Fresh 18.3 18.8 18.4 18.5 18.9 18.5 19.3 19.5 21.9 20.9 19.9 21.6 Dehydrating 0.8 0.9 1.1 2.3 1.6 1.0 1.1 1.8 1.5 1.1 1.8 1.0Green peas, all 3/ 3.4 3.5 3.3 3.5 3.7 3.3 2.8 3.1 2.8 2.7 2.8 3.0 Canning 1.5 1.5 1.5 1.4 1.5 1.4 1.1 1.3 1.2 1.1 1.2 1.2 Freezing 1.9 2.0 1.9 2.0 2.1 2.0 1.7 1.8 1.6 1.6 1.6 1.8Peppers, all 12.8 11.9 12.5 12.4 13.3 13.3 14.1 14.0 14.8 15.3 15.8 15.2 Bell peppers, all 8.1 7.3 7.8 7.7 8.2 8.1 8.3 8.4 8.6 9.2 9.5 9.4 Chile peppers, all 4.7 114.9 4.8 4.7 5.2 80.5 5.8 48.5 6.1 17.5 6.4 13.8Tomatoes, all 90.9 111.2 92.5 34.4 89.1 76.1 89.7 47.0 90.5 16.6 84.3 11.8 Fresh 4/ 17.4 17.3 18.5 19.1 19.0 19.2 20.3 19.4 20.0 20.2 19.8 19.2 Canning 73.5 72.6 74.0 71.2 70.1 65.5 69.4 69.9 70.5 73.7 64.5 68.7Other, fresh 5/ 9.7 12.4 13.3 13.9 18.6 17.7 18.3 18.6 19.4 20.1 20.1 19.4Other, canning 6/ 2.3 2.3 2.2 2.5 2.6 2.7 2.2 2.3 2.7 2.8 2.5 2.6Other, freezing 7/ 3.0 3.0 2.7 3.4 3.2 3.2 4.3 3.8 3.8 4.1 4.1 4.1 Subtotal, no melons 8/ 258.2 264.6 261.8 265.8 270.2 260.5 267.0 268.1 274.1 274.0 264.2 266.3 Fresh 131.0 139.5 136.1 141.6 146.8 144.6 146.8 146.7 151.4 148.1 148.4 148.1 Canning 103.2 102.1 102.4 99.6 100.0 93.6 97.5 98.0 99.7 102.7 92.3 94.5 Freezing 23.1 22.2 22.2 22.3 21.8 21.2 21.7 21.6 21.5 22.1 21.8 22.6 Subtotal, with melons 8/ 287.5 293.4 289.8 295.4 298.0 289.2 294.9 295.2 299.5 299.5 291.1 292.7 Fresh 160.3 168.3 164.0 171.2 174.6 173.3 174.6 173.7 176.8 173.7 175.2 174.5Potatoes, all 145.0 137.8 137.7 136.2 137.7 138.6 131.9 138.0 134.5 125.4 123.6 124.4 Fresh 49.9 47.3 46.9 47.7 47.2 46.6 44.3 46.8 45.8 41.3 38.6 38.7 Processing 95.1 90.5 90.8 88.5 90.5 92.0 87.6 91.2 88.7 84.1 85.0 85.7Sweet potatoes 4.3 4.3 3.8 3.7 4.2 4.4 3.7 4.7 4.7 4.5 4.6 5.1Mushrooms 3.9 4.0 3.9 4.1 4.1 3.9 4.1 4.1 4.1 3.9 4.0 3.9Dry peas & lentils 9/ 0.6 0.9 0.8 0.6 0.8 0.8 0.8 0.6 0.7 0.8 1.2 0.8Dry edible beans 7.4 7.4 7.2 7.8 7.7 6.9 6.7 6.8 5.9 6.1 6.5 6.4Total (no melons) 419.4 419.0 415.2 418.1 424.6 415.1 414.2 422.3 424.1 414.7 404.1 406.7Total (with melons) 448.6 447.7 443.2 447.8 452.4 443.7 442.1 449.4 449.5 440.2 431.0 433.2See footnotes at end of table. Continued--
--------------------------------------------------------------- pounds, farm-weight --------------------------------------------------------------------------------

Vegetables and Pulses Yearbook Data/#89011/ March 20, 2015Economic Research Service, USDA
Table 1d --U.S. per capita use of selected, commercially produced, fresh, and processing vegetables and dry pulse crops, 1970-2014 Crop 2008 2009 2010 2011 2012 2013 2014p
Asparagus, all 1.5 1.5 1.6 1.6 1.7 1.6 1.8 Fresh 1.2 1.3 1.4 1.4 1.4 1.4 1.6 Canning 0.2 0.2 0.1 0.1 0.1 0.1 0.1 Freezing 0.1 0.1 0.1 0.1 0.1 0.1 0.1Snap/green beans, all 7.4 7.2 7.5 6.4 6.5 6.6 6.0 Fresh 2.0 1.7 1.9 1.7 1.6 1.6 1.5 Canning 3.3 3.6 3.7 3.2 2.9 2.9 2.8 Freezing 2.1 1.9 2.0 1.5 1.9 2.1 1.8Broccoli, all 1/ 8.7 8.7 8.1 8.6 8.9 9.4 9.3 Fresh 6.0 6.2 5.6 5.9 6.3 6.9 6.7 Freezing 2.7 2.5 2.5 2.7 2.6 2.5 2.6Cabbage, all 9.0 8.2 8.5 7.6 7.4 7.9 8.0 Fresh 8.1 7.3 7.5 6.6 6.3 6.9 7.1 Canning (kraut) 0.9 0.9 1.0 1.0 1.2 1.0 1.0Carrots, all 10.6 9.8 10.0 9.9 9.9 10.4 10.4 Fresh 8.1 7.4 7.8 7.5 7.9 8.0 8.5 Canning 1.0 0.9 0.7 0.8 0.8 0.8 0.7 Freezing 1.5 1.5 1.5 1.6 1.2 1.7 1.2Cauliflower, all 1/ 2.0 2.1 1.7 1.7 1.5 1.7 1.9 Fresh 1.6 1.7 1.3 1.2 1.2 1.3 1.5 Freezing 0.4 0.4 0.4 0.4 0.3 0.3 0.4Celery 6.2 6.2 6.1 6.0 6.0 5.5 5.5Sweet corn, all 2/ 25.1 25.8 24.6 23.7 24.3 21.6 21.3 Fresh 9.1 9.2 9.2 8.2 8.7 8.9 7.9 Canning 6.7 7.6 6.9 5.8 5.8 5.8 5.8 Freezing 9.2 9.1 8.5 9.8 9.8 7.0 7.7Cucumbers, all 9.9 11.9 10.5 9.2 10.1 10.5 10.9 Fresh 6.4 6.8 6.7 6.4 7.1 7.3 7.4 Pickling 3.5 5.1 3.7 2.8 3.0 3.2 3.5Melons 10/ 26.7 26.2 26.4 25.5 --- --- --- Watermelon 15.6 14.9 15.7 14.8 --- --- --- Cantaloup 8.9 9.1 8.6 8.7 --- --- --- Honeydew 1.7 1.6 1.5 1.5 --- --- --- Other 0.5 0.6 0.6 0.5 --- --- ---Lettuce, all 27.3 26.1 27.9 27.5 27.9 25.5 24.8 Head lettuce 16.9 16.1 15.9 15.8 15.9 14.1 14.0 Romaine & leaf 10.4 10.0 12.0 11.7 11.9 11.4 10.8Onions, all 21.7 21.5 20.9 20.4 21.2 19.5 20.6 Fresh 20.2 19.6 19.6 19.1 20.0 18.6 18.5 Dehydrating 1.5 1.9 1.3 1.3 1.3 1.0 2.0Green peas, all 3/ 2.9 3.0 2.6 2.4 2.7 2.4 2.3 Canning 1.1 1.3 1.1 0.8 0.8 0.9 0.7 Freezing 1.8 1.7 1.5 1.6 1.9 1.5 1.6Peppers, all 15.8 16.4 16.9 17.2 17.9 17.0 17.8 Bell peppers, all 9.6 9.8 10.3 10.6 10.7 10.0 10.6 Chile peppers, all 6.2 6.6 6.6 6.6 7.2 7.0 7.2Tomatoes, all 85.6 89.9 91.6 86.7 87.3 86.1 87.8 Fresh 4/ 18.5 19.6 20.6 21.0 20.8 20.2 20.6 Canning 67.1 70.3 71.1 65.7 66.5 65.9 67.2Other, fresh 5/ 19.1 18.4 18.3 18.8 19.3 18.5 19.3Other, canning 6/ 2.6 2.3 2.5 2.5 2.6 2.6 2.5Other, freezing 7/ 4.0 4.3 4.5 4.3 4.5 4.3 4.6 Subtotal, no melons 8/ 259.4 263.2 263.9 254.4 259.5 251.2 254.8 Fresh 143.3 141.2 144.2 141.8 145.1 140.6 141.5 Canning 92.8 98.7 97.4 89.4 90.9 90.0 91.5 Freezing 21.9 21.4 20.9 21.9 22.3 19.5 19.8 Subtotal, with melons 8/ 286.0 289.4 290.2 279.9 --- --- --- Fresh 170.0 167.4 170.6 167.3 --- --- ---Potatoes, all 118.3 113.5 113.9 110.3 114.8 116.0 111.2 Fresh 37.8 36.7 36.8 34.1 34.4 34.8 34.4 Processing 80.5 76.8 77.1 76.2 80.5 81.2 76.7Sweet potatoes 5.1 5.3 6.7 7.5 7.3 6.7 7.5Mushrooms 3.9 3.6 3.6 3.8 4.0 3.8 3.8Dry peas & lentils 9/ 0.4 0.8 1.6 0.8 0.6 1.3 1.3Dry edible beans 10/ 6.4 6.0 7.0 5.7 6.3 5.8 6.3Total (no melons) 10/ 393.5 392.5 396.7 382.6 392.5 384.7 384.9Total (with melons) 419.8 418.7 423.0 408.0 --- --- --- -- = Not available. p = preliminary. r = revised. 1/ All production for processing broccoli and cauliflower is for freezing. 2/ On-cob basis. 3/ In-shell basis. 4/ Includes domestically-producedhothouse tomatoes after 1996 (all years include imported hothouse tomatoes). 5/ Includes artichokes, Brussels sprouts, eggplant,endive/escarole, garlic, radishes, green limas, squash, & spinach. After 2000 includes okra, pumpkins, kale, collards, turnip greens, and mustard greens. 6/ Includes beets, green limas (1992-2014), spinach, and miscellaneous imports (1990-2014). 7/ Includes green limas, spinach, and miscellaneous freezing vegetables. 8/ Fresh, canning, and freezing data do not sum to the total because onions for dehydrating are included in the total. 9/ Production from new areas in the upper Midwest added in 1998. A portion of this is used for animal feed. 10/ Includes garbanzo beans (chickpeas). 10/ Beginning in 2012, data coverage for melons is included in the Fruit and Tree Nuts Yearbook. Source: USDA, Economic Research Service.
----------------------------------------------- pounds, farm-weight ---------------------------------------------------

Vegetables and Pulses Yearbook Data/#89011/ March 20, 2015Economic Research Service, USDA
Table 2--Vegetables, fresh market: U.S. per capita utilization, 1980-2014 1/
Year Aspara- Arti- Snap/grn Cauli- Celery Sweet Cucum- Eggplant Escarole/ Lettuce
gus chokes 2/ beans Broccoli Cabbage Carrots flower 2/ corn bers 2/ endive Head Leaf/romaine
1980 0.3 0.6 1.3 1.4 8.0 6.2 1.1 7.4 6.5 3.9 0.5 0.5 25.6 --1981 0.3 0.8 1.3 1.7 8.2 6.1 1.4 7.3 6.2 4.0 0.5 0.4 24.9 --1982 0.4 0.8 1.3 2.0 8.6 6.6 1.3 7.4 6.0 4.2 0.5 0.4 24.9 --1983 0.4 0.7 1.2 2.0 8.2 6.5 1.4 7.0 6.1 4.5 0.5 0.4 22.4 --1984 0.4 1.0 1.3 2.5 8.6 6.7 1.8 7.1 6.4 4.7 0.5 0.4 24.9 --1985 0.5 1.0 1.3 2.6 8.7 6.5 1.8 6.9 6.4 4.4 0.5 0.4 23.7 3.31986 0.6 0.9 1.3 3.1 8.6 6.5 2.2 6.5 6.1 4.6 0.5 0.4 21.9 2.41987 0.6 1.0 1.2 3.1 9.1 8.3 2.1 6.6 6.3 5.1 0.5 0.3 25.7 2.51988 0.6 0.9 1.2 3.8 9.0 7.1 2.2 7.2 5.8 4.8 0.4 0.4 27.0 3.21989 0.6 1.0 1.2 3.8 8.6 8.1 2.3 7.5 6.5 4.8 0.4 0.3 28.7 3.6
1990 0.6 0.9 1.1 3.4 8.3 8.3 2.2 7.2 6.7 4.7 0.4 0.3 27.8 3.81991 0.6 0.8 1.1 3.0 8.2 7.7 2.0 6.7 5.9 4.6 0.4 0.2 26.0 4.01992 0.6 0.9 1.5 3.4 8.7 8.3 1.8 7.3 6.9 4.9 0.5 0.3 25.8 4.71993 0.6 0.9 1.5 3.3 9.3 10.9 2.1 7.3 7.0 5.2 0.5 0.3 24.4 5.01994 0.6 1.3 1.5 4.4 9.1 12.7 2.0 7.2 8.2 5.4 0.5 0.3 25.0 5.71995 0.6 0.9 1.6 4.3 8.1 11.2 1.6 6.9 7.8 5.6 0.5 0.3 22.2 5.91996 0.6 1.0 1.5 4.5 8.3 12.4 1.7 7.0 8.3 5.9 0.6 0.3 21.6 5.81997 0.7 1.0 1.4 5.0 9.0 14.1 1.8 6.6 8.3 6.4 0.7 0.3 23.9 6.61998 0.7 1.2 1.6 5.0 8.4 9.5 1.5 6.5 9.3 6.5 0.7 0.3 22.3 6.61999 0.9 1.3 1.9 6.2 7.6 9.3 1.8 6.5 9.1 6.7 0.7 0.2 24.9 7.6
2000 1.0 1.2 2.0 5.9 8.9 9.2 1.7 6.3 9.0 6.4 0.8 0.4 23.5 8.42001 0.9 1.2 2.2 5.4 8.8 9.4 1.5 6.4 9.2 6.3 0.8 0.4 23.0 8.02002 1.0 1.3 2.1 5.4 8.3 8.4 1.4 6.3 9.0 6.6 0.7 0.3 22.5 9.62003 1.0 1.4 2.0 5.4 7.4 8.8 1.6 6.3 9.2 6.2 0.7 0.3 22.2 10.82004 1.1 1.4 1.9 5.3 8.0 8.7 1.6 6.2 9.0 6.4 0.7 0.3 21.3 12.02005 1.1 1.4 1.8 5.3 7.8 8.7 1.8 5.9 8.7 6.2 0.9 0.3 20.9 9.72006 1.1 1.7 2.1 5.8 7.8 8.1 1.7 6.1 8.3 6.1 0.9 0.3 20.1 12.02007 1.2 1.6 2.2 5.6 8.0 8.1 1.7 6.3 9.2 6.4 0.9 0.3 18.4 11.52008 1.2 1.5 2.0 6.0 8.1 8.1 1.6 6.2 9.1 6.4 0.8 0.3 16.9 10.42009 1.3 1.5 1.7 6.2 7.3 7.4 1.7 6.2 9.2 6.8 0.8 0.2 16.1 10.0
2010 1.4 1.5 1.9 5.6 7.5 7.8 1.3 6.1 9.2 6.7 0.7 0.2 15.9 12.02011 1.4 1.7 1.7 5.9 6.6 7.5 1.2 6.0 8.2 6.4 0.7 0.3 15.8 11.72012 1.4 1.5 1.6 6.3 6.3 7.9 1.2 6.0 8.7 7.1 0.8 0.3 15.9 11.92013 1.4 1.3 1.6 6.9 6.9 8.0 1.3 5.5 8.9 7.3 0.8 0.2 14.1 11.42014p 1.6 1.4 1.5 6.7 7.1 8.5 1.5 5.5 7.9 7.4 0.8 0.2 14.0 10.8
Garlic Bell Pump- Southern Tomatoes Water- Canta- Honey- All Total Total 2/ Onions peppers 2/ kins Radishes Spinach Squash greens 5/ 3/ melon 6/ loupe 6/ dews 6/ others 4/ No Melons w/ Melons 6/
1980 0.9 11.4 2.9 -- 0.6 0.4 2.3 -- 12.8 10.7 5.9 1.4 0.7 95.1 113.01981 0.7 10.7 2.8 -- 0.6 0.5 2.3 -- 12.3 11.7 6.1 1.5 0.8 93.6 112.91982 0.8 12.2 3.0 -- 0.5 0.6 2.5 -- 12.9 12.5 7.7 1.8 0.9 97.7 119.61983 1.0 12.2 3.3 -- 0.6 0.5 2.6 -- 13.5 11.3 6.5 1.8 1.0 96.1 115.81984 0.8 13.1 3.6 -- 0.5 0.5 2.6 -- 14.2 14.4 7.7 1.8 1.0 102.5 126.41985 1.1 13.6 3.8 -- 0.5 0.7 2.7 -- 14.9 13.5 8.5 2.1 0.9 106.0 130.11986 0.8 13.7 4.0 -- 0.5 0.6 2.8 -- 15.8 12.8 9.4 2.4 0.9 104.5 129.11987 1.2 13.4 4.2 -- 0.5 0.6 2.9 -- 15.9 13.0 9.2 2.2 0.8 111.8 136.21988 1.1 14.6 4.5 -- 0.6 0.6 3.1 -- 16.8 13.6 7.9 2.4 1.0 115.7 139.51989 1.0 14.8 4.7 -- 0.7 0.6 3.5 -- 16.8 13.6 10.4 2.5 1.2 120.6 147.1
1990 1.4 15.1 5.9 -- 0.7 0.8 3.5 -- 15.5 13.3 9.2 2.1 0.8 119.0 143.61991 1.5 15.7 6.3 -- 0.6 0.8 3.7 -- 15.4 12.7 8.6 1.9 0.9 116.1 139.41992 1.5 16.1 7.1 -- 0.5 0.8 3.8 -- 15.5 14.7 8.5 2.1 0.9 121.6 146.91993 1.8 17.2 7.6 -- 0.5 0.7 3.8 -- 16.3 14.2 8.6 1.7 1.1 127.1 151.71994 1.8 16.9 7.1 -- 0.4 0.8 4.0 -- 16.2 15.0 8.4 2.0 0.9 131.9 157.31995 1.9 17.8 7.0 -- 0.4 0.7 3.8 -- 16.8 15.2 9.0 1.9 1.1 127.0 153.01996 2.3 18.3 8.1 -- 0.4 0.6 3.7 -- 17.4 16.6 10.3 2.0 1.1 131.4 160.31997 2.0 18.8 7.3 -- 0.5 1.1 3.9 2.4 17.3 15.5 10.5 2.2 1.1 140.0 168.31998 2.6 18.4 7.8 -- 0.4 1.0 4.2 2.4 18.5 14.3 10.6 2.3 1.3 136.7 164.01999 3.3 18.5 7.7 -- 0.4 1.0 4.1 2.4 19.1 15.2 11.4 2.5 1.2 142.2 171.2
2000 2.2 18.9 8.2 4.7 0.5 1.4 4.5 2.4 19.0 13.8 11.1 2.3 1.2 147.5 174.72001 2.4 18.5 8.1 4.2 0.5 1.1 4.2 2.3 19.2 15.0 11.2 2.0 1.1 145.1 173.32002 2.5 19.3 8.3 4.1 0.5 1.4 4.6 2.3 20.3 14.0 11.1 2.2 1.1 147.3 174.62003 2.8 19.5 8.4 3.9 0.4 1.6 4.3 2.5 19.4 13.5 10.8 2.2 1.2 147.2 173.72004 2.6 21.9 8.6 4.6 0.5 1.9 4.3 2.5 20.0 13.0 9.8 2.1 1.3 151.9 176.72005 2.4 20.9 9.2 4.9 0.5 2.3 4.4 2.2 20.2 13.6 9.6 1.9 1.3 148.7 173.72006 2.7 19.9 9.5 4.8 0.5 2.0 4.6 1.9 19.8 15.1 9.3 1.9 1.3 149.0 175.22007 2.7 21.6 9.4 5.0 0.5 1.6 4.2 1.9 19.2 14.4 9.6 1.8 1.4 148.7 174.52008 2.8 20.2 9.6 4.7 0.5 1.8 4.2 1.7 18.5 15.6 8.9 1.7 1.3 143.8 170.02009 2.4 19.6 9.8 4.0 0.5 2.0 4.4 1.9 19.6 14.9 9.1 1.6 1.3 141.8 167.5
2010 2.3 19.6 10.3 4.4 0.5 1.7 4.3 2.0 20.6 15.7 8.6 1.5 1.3 144.8 170.62011 2.3 19.1 10.6 4.4 0.4 1.8 4.4 2.0 21.0 14.8 8.7 1.5 1.4 142.4 167.42012 2.3 20.0 10.7 5.0 0.3 1.6 4.6 2.1 20.8 -- -- -- 0.8 145.1 --2013 2.0 18.6 10.0 4.7 0.5 1.6 4.4 2.3 20.2 -- -- -- 0.7 140.7 --2014p 1.9 18.5 10.6 5.4 0.4 1.7 4.5 2.1 20.6 -- -- -- 0.8 141.4 -- -- = Not available. p = preliminary. r = revised. Totals may not sum due to rounding. 1/ Excludes potatoes, sweet potatoes, and mushrooms. 2/ Includes fresh and processing. 3/ After 1996, includes an ERS estimate of domestically produced hothouse tomatoes. Hothouse tomato imports are included in all years. 4/ Includes Brussels sprouts, miscellaneous melons, and okra through 2011; Brussels sprouts and okra only beginning in 2012. Green lima beans included since 1992. 5/ Collards, kale, mustard greens and turnip greens. 6/ Beginning in 2012, data coverage for melons is included in the Fruit and Tree Nuts Yearbook . Source: USDA, Economic Research Service.
--------------------------------------------------------------------------------------------------- Pounds per person ---------------------------------------------------------------------------------------------------------------------
------------------------------------------------------------------------------------------------------------ Pounds per person ----------------------------------------------------------------------------------------------------------------------------
Vegetables and Pulses Yearbook Data/#89011/ March 20, 2015Economic Research Service, USDA
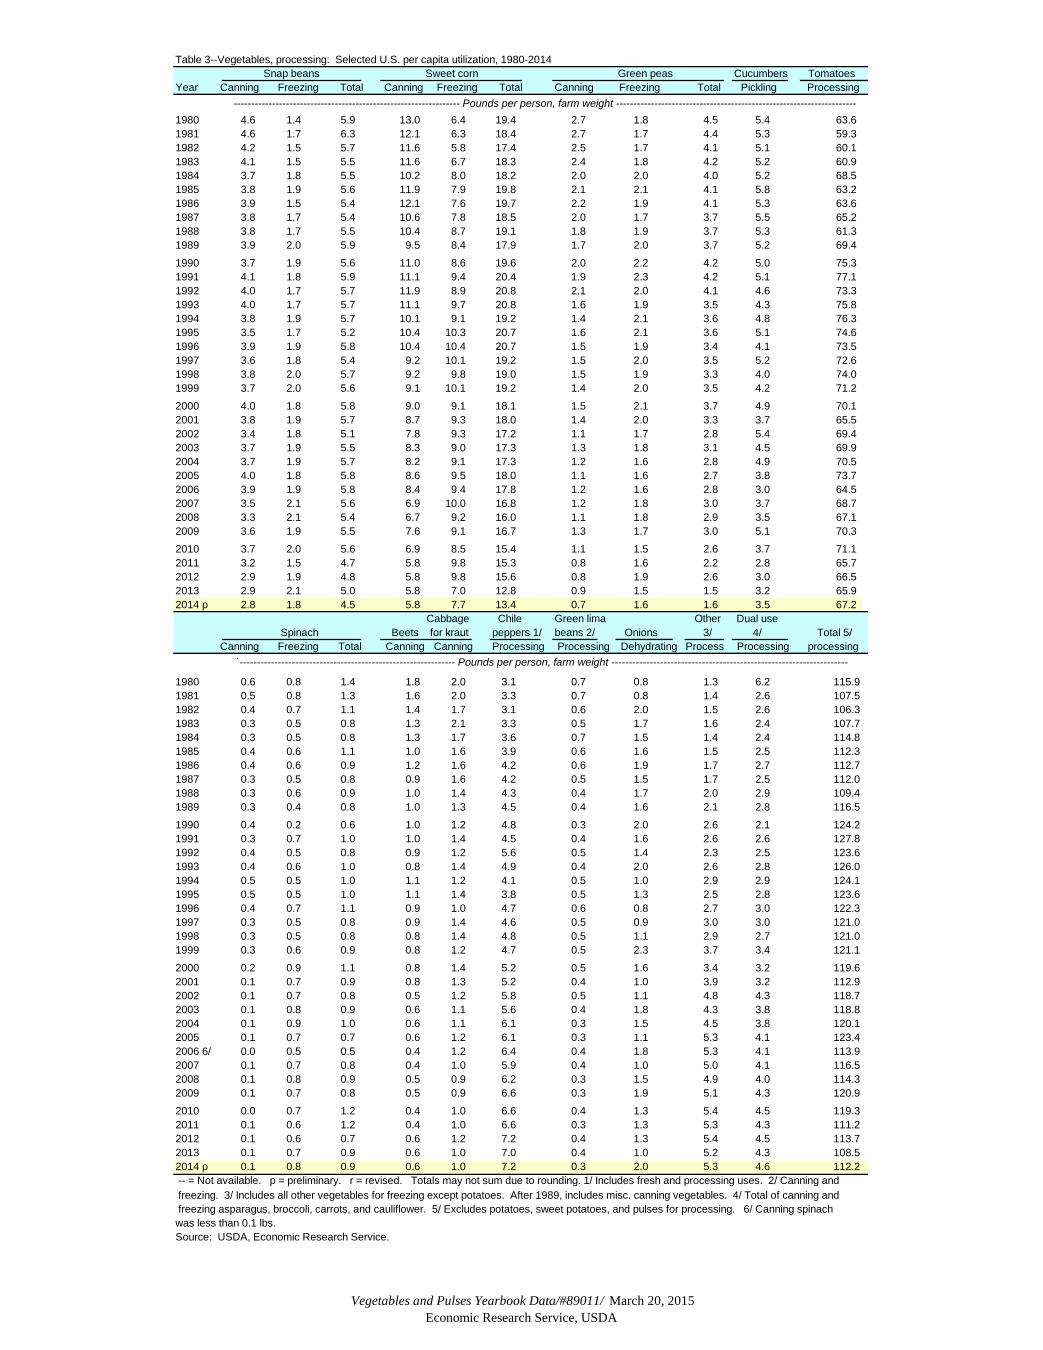
Table 3--Vegetables, processing: Selected U.S. per capita utilization, 1980-2014Snap beans Sweet corn Green peas Cucumbers Tomatoes
Year Canning Freezing Total Canning Freezing Total Canning Freezing Total Pickling Processing
1980 4.6 1.4 5.9 13.0 6.4 19.4 2.7 1.8 4.5 5.4 63.61981 4.6 1.7 6.3 12.1 6.3 18.4 2.7 1.7 4.4 5.3 59.31982 4.2 1.5 5.7 11.6 5.8 17.4 2.5 1.7 4.1 5.1 60.11983 4.1 1.5 5.5 11.6 6.7 18.3 2.4 1.8 4.2 5.2 60.91984 3.7 1.8 5.5 10.2 8.0 18.2 2.0 2.0 4.0 5.2 68.51985 3.8 1.9 5.6 11.9 7.9 19.8 2.1 2.1 4.1 5.8 63.21986 3.9 1.5 5.4 12.1 7.6 19.7 2.2 1.9 4.1 5.3 63.61987 3.8 1.7 5.4 10.6 7.8 18.5 2.0 1.7 3.7 5.5 65.21988 3.8 1.7 5.5 10.4 8.7 19.1 1.8 1.9 3.7 5.3 61.31989 3.9 2.0 5.9 9.5 8.4 17.9 1.7 2.0 3.7 5.2 69.4
1990 3.7 1.9 5.6 11.0 8.6 19.6 2.0 2.2 4.2 5.0 75.31991 4.1 1.8 5.9 11.1 9.4 20.4 1.9 2.3 4.2 5.1 77.11992 4.0 1.7 5.7 11.9 8.9 20.8 2.1 2.0 4.1 4.6 73.31993 4.0 1.7 5.7 11.1 9.7 20.8 1.6 1.9 3.5 4.3 75.81994 3.8 1.9 5.7 10.1 9.1 19.2 1.4 2.1 3.6 4.8 76.31995 3.5 1.7 5.2 10.4 10.3 20.7 1.6 2.1 3.6 5.1 74.61996 3.9 1.9 5.8 10.4 10.4 20.7 1.5 1.9 3.4 4.1 73.51997 3.6 1.8 5.4 9.2 10.1 19.2 1.5 2.0 3.5 5.2 72.61998 3.8 2.0 5.7 9.2 9.8 19.0 1.5 1.9 3.3 4.0 74.01999 3.7 2.0 5.6 9.1 10.1 19.2 1.4 2.0 3.5 4.2 71.2
2000 4.0 1.8 5.8 9.0 9.1 18.1 1.5 2.1 3.7 4.9 70.12001 3.8 1.9 5.7 8.7 9.3 18.0 1.4 2.0 3.3 3.7 65.52002 3.4 1.8 5.1 7.8 9.3 17.2 1.1 1.7 2.8 5.4 69.42003 3.7 1.9 5.5 8.3 9.0 17.3 1.3 1.8 3.1 4.5 69.92004 3.7 1.9 5.7 8.2 9.1 17.3 1.2 1.6 2.8 4.9 70.52005 4.0 1.8 5.8 8.6 9.5 18.0 1.1 1.6 2.7 3.8 73.72006 3.9 1.9 5.8 8.4 9.4 17.8 1.2 1.6 2.8 3.0 64.52007 3.5 2.1 5.6 6.9 10.0 16.8 1.2 1.8 3.0 3.7 68.72008 3.3 2.1 5.4 6.7 9.2 16.0 1.1 1.8 2.9 3.5 67.12009 3.6 1.9 5.5 7.6 9.1 16.7 1.3 1.7 3.0 5.1 70.3
2010 3.7 2.0 5.6 6.9 8.5 15.4 1.1 1.5 2.6 3.7 71.12011 3.2 1.5 4.7 5.8 9.8 15.3 0.8 1.6 2.2 2.8 65.72012 2.9 1.9 4.8 5.8 9.8 15.6 0.8 1.9 2.6 3.0 66.52013 2.9 2.1 5.0 5.8 7.0 12.8 0.9 1.5 1.5 3.2 65.92014 p 2.8 1.8 4.5 5.8 7.7 13.4 0.7 1.6 1.6 3.5 67.2
Cabbage Chile Green lima Other Dual use Spinach Beets for kraut peppers 1/ beans 2/ Onions 3/ 4/ Total 5/
Canning Freezing Total Canning Canning Processing Processing Dehydrating Process Processing processing
1980 0.6 0.8 1.4 1.8 2.0 3.1 0.7 0.8 1.3 6.2 115.91981 0.5 0.8 1.3 1.6 2.0 3.3 0.7 0.8 1.4 2.6 107.51982 0.4 0.7 1.1 1.4 1.7 3.1 0.6 2.0 1.5 2.6 106.31983 0.3 0.5 0.8 1.3 2.1 3.3 0.5 1.7 1.6 2.4 107.71984 0.3 0.5 0.8 1.3 1.7 3.6 0.7 1.5 1.4 2.4 114.81985 0.4 0.6 1.1 1.0 1.6 3.9 0.6 1.6 1.5 2.5 112.31986 0.4 0.6 0.9 1.2 1.6 4.2 0.6 1.9 1.7 2.7 112.71987 0.3 0.5 0.8 0.9 1.6 4.2 0.5 1.5 1.7 2.5 112.01988 0.3 0.6 0.9 1.0 1.4 4.3 0.4 1.7 2.0 2.9 109.41989 0.3 0.4 0.8 1.0 1.3 4.5 0.4 1.6 2.1 2.8 116.5
1990 0.4 0.2 0.6 1.0 1.2 4.8 0.3 2.0 2.6 2.1 124.21991 0.3 0.7 1.0 1.0 1.4 4.5 0.4 1.6 2.6 2.6 127.81992 0.4 0.5 0.8 0.9 1.2 5.6 0.5 1.4 2.3 2.5 123.61993 0.4 0.6 1.0 0.8 1.4 4.9 0.4 2.0 2.6 2.8 126.01994 0.5 0.5 1.0 1.1 1.2 4.1 0.5 1.0 2.9 2.9 124.11995 0.5 0.5 1.0 1.1 1.4 3.8 0.5 1.3 2.5 2.8 123.61996 0.4 0.7 1.1 0.9 1.0 4.7 0.6 0.8 2.7 3.0 122.31997 0.3 0.5 0.8 0.9 1.4 4.6 0.5 0.9 3.0 3.0 121.01998 0.3 0.5 0.8 0.8 1.4 4.8 0.5 1.1 2.9 2.7 121.01999 0.3 0.6 0.9 0.8 1.2 4.7 0.5 2.3 3.7 3.4 121.1
2000 0.2 0.9 1.1 0.8 1.4 5.2 0.5 1.6 3.4 3.2 119.62001 0.1 0.7 0.9 0.8 1.3 5.2 0.4 1.0 3.9 3.2 112.92002 0.1 0.7 0.8 0.5 1.2 5.8 0.5 1.1 4.8 4.3 118.72003 0.1 0.8 0.9 0.6 1.1 5.6 0.4 1.8 4.3 3.8 118.82004 0.1 0.9 1.0 0.6 1.1 6.1 0.3 1.5 4.5 3.8 120.12005 0.1 0.7 0.7 0.6 1.2 6.1 0.3 1.1 5.3 4.1 123.42006 6/ 0.0 0.5 0.5 0.4 1.2 6.4 0.4 1.8 5.3 4.1 113.92007 0.1 0.7 0.8 0.4 1.0 5.9 0.4 1.0 5.0 4.1 116.52008 0.1 0.8 0.9 0.5 0.9 6.2 0.3 1.5 4.9 4.0 114.32009 0.1 0.7 0.8 0.5 0.9 6.6 0.3 1.9 5.1 4.3 120.9
2010 0.0 0.7 1.2 0.4 1.0 6.6 0.4 1.3 5.4 4.5 119.32011 0.1 0.6 1.2 0.4 1.0 6.6 0.3 1.3 5.3 4.3 111.22012 0.1 0.6 0.7 0.6 1.2 7.2 0.4 1.3 5.4 4.5 113.72013 0.1 0.7 0.9 0.6 1.0 7.0 0.4 1.0 5.2 4.3 108.52014 p 0.1 0.8 0.9 0.6 1.0 7.2 0.3 2.0 5.3 4.6 112.2 -- = Not available. p = preliminary. r = revised. Totals may not sum due to rounding. 1/ Includes fresh and processing uses. 2/ Canning and freezing. 3/ Includes all other vegetables for freezing except potatoes. After 1989, includes misc. canning vegetables. 4/ Total of canning and freezing asparagus, broccoli, carrots, and cauliflower. 5/ Excludes potatoes, sweet potatoes, and pulses for processing. 6/ Canning spinach was less than 0.1 lbs.Source: USDA, Economic Research Service.
----------------------------------------------------------------- Pounds per person, farm weight ---------------------------------------------------------------------
`-------------------------------------------------------------- Pounds per person, farm weight --------------------------------------------------------------------

Vegetables and Pulses Yearbook Data/#89011/ March 20, 2015Economic Research Service, USDA
Table 4--Potatoes: U.S. per capita utilization, by category, 1970-2014 1/ Processing
Year Total Fresh Total Freezing Chipping Dehy- Canning
drating
1970 121.7 61.8 59.9 28.5 17.4 12.0 2.01971 117.8 56.1 61.7 30.1 17.2 12.3 2.11972 119.4 57.9 61.5 30.3 16.7 12.4 2.11973 118.3 52.4 65.8 34.2 16.3 13.1 2.21974 117.2 49.4 67.8 35.3 15.7 14.5 2.31975 121.9 52.6 69.3 37.1 15.5 14.7 2.01976 125.3 49.5 75.9 41.8 15.8 16.3 2.01977 122.1 50.1 72.0 42.2 16.2 11.4 2.21978 119.4 46.0 73.5 42.6 16.5 12.1 2.31979 117.8 49.3 68.5 38.5 16.7 11.2 2.1
1980 114.7 51.1 63.6 35.4 16.5 9.8 1.91981 116.5 45.8 70.7 41.5 16.6 10.8 1.81982 115.0 47.1 67.9 38.6 17.0 10.4 1.91983 118.7 49.8 68.9 39.2 17.8 10.0 1.91984 122.1 48.3 73.8 43.7 18.0 10.3 1.81985 122.4 46.3 76.1 45.4 17.6 11.2 1.91986 125.9 48.8 77.1 46.3 18.1 10.9 1.81987 126.0 47.9 78.1 47.9 17.6 10.8 1.81988 122.3 49.6 72.7 43.3 17.1 10.4 1.91989 127.0 50.0 77.0 46.8 17.4 10.8 2.0
1990 123.9 46.7 77.2 46.4 16.4 12.6 1.81991 134.1 50.2 83.9 51.1 17.3 13.8 1.71992 129.9 48.3 81.6 49.9 17.1 12.8 1.81993 136.7 50.1 86.6 53.5 17.7 13.7 1.71994 136.7 49.6 87.1 55.7 16.5 13.2 1.71995 136.9 49.2 87.7 56.2 16.4 13.2 1.91996 145.0 49.9 95.1 60.2 16.4 16.7 1.81997 137.8 47.3 90.5 57.8 15.5 15.5 1.71998 137.7 46.9 90.8 58.1 14.7 16.5 1.51999 136.2 47.7 88.5 58.5 15.9 12.4 1.7
2000 137.7 47.2 90.5 57.5 15.6 15.7 1.72001 138.6 46.6 92.0 58.2 17.4 14.8 1.62002 131.9 44.3 87.6 55.2 16.3 14.7 1.42003 138.0 46.8 91.2 57.1 17.2 15.5 1.42004 134.5 45.8 88.7 57.3 16.4 13.8 1.22005 125.4 41.3 84.1 54.3 16.1 12.8 0.92006 123.6 38.6 85.0 53.2 18.6 12.4 0.82007 124.4 38.7 85.7 53.2 18.6 13.0 0.92008 118.3 37.8 80.5 51.5 15.7 12.4 0.92009 113.4 36.7 76.7 50.4 13.7 11.8 0.8
2010 113.9 36.8 77.1 50.2 15.0 11.2 0.72011 110.3 34.1 76.2 48.2 16.8 10.6 0.72012 114.8 34.4 80.5 48.4 17.5 13.8 0.82013 116.0 34.8 81.2 49.3 18.1 13.3 0.62014 p 111.2 34.4 76.7 47.5 17.0 11.7 0.5 p = Preliminary. 1/ Calendar-year estimates on a fresh-equivalent basis. Source: USDA, Economic Research Service.
------------------------------------------------------------ Pounds per person, farm weight ---------------------------------------------------------------
Vegetables and Pulses Yearbook Data/#89011/ March 20, 2015Economic Research Service, USDA
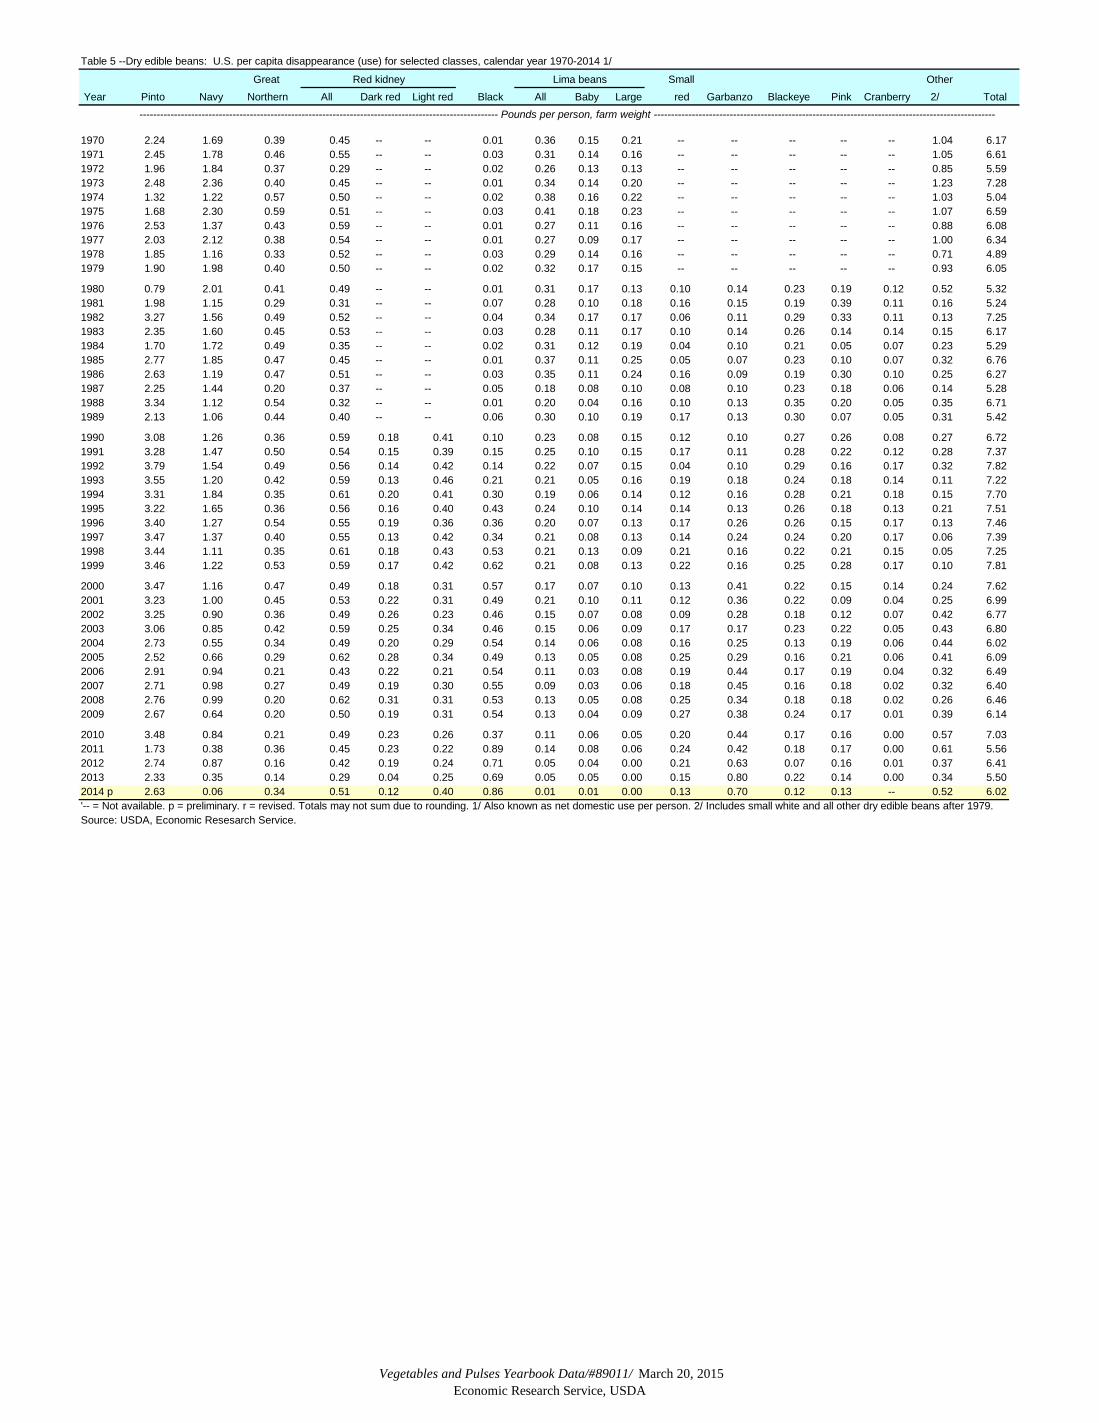
Table 5 --Dry edible beans: U.S. per capita disappearance (use) for selected classes, calendar year 1970-2014 1/
Great Red kidney Lima beans Small Other Year Pinto Navy Northern All Dark red Light red Black All Baby Large red Garbanzo Blackeye Pink Cranberry 2/ Total
1970 2.24 1.69 0.39 0.45 -- -- 0.01 0.36 0.15 0.21 -- -- -- -- -- 1.04 6.171971 2.45 1.78 0.46 0.55 -- -- 0.03 0.31 0.14 0.16 -- -- -- -- -- 1.05 6.611972 1.96 1.84 0.37 0.29 -- -- 0.02 0.26 0.13 0.13 -- -- -- -- -- 0.85 5.591973 2.48 2.36 0.40 0.45 -- -- 0.01 0.34 0.14 0.20 -- -- -- -- -- 1.23 7.281974 1.32 1.22 0.57 0.50 -- -- 0.02 0.38 0.16 0.22 -- -- -- -- -- 1.03 5.041975 1.68 2.30 0.59 0.51 -- -- 0.03 0.41 0.18 0.23 -- -- -- -- -- 1.07 6.591976 2.53 1.37 0.43 0.59 -- -- 0.01 0.27 0.11 0.16 -- -- -- -- -- 0.88 6.081977 2.03 2.12 0.38 0.54 -- -- 0.01 0.27 0.09 0.17 -- -- -- -- -- 1.00 6.341978 1.85 1.16 0.33 0.52 -- -- 0.03 0.29 0.14 0.16 -- -- -- -- -- 0.71 4.891979 1.90 1.98 0.40 0.50 -- -- 0.02 0.32 0.17 0.15 -- -- -- -- -- 0.93 6.05
1980 0.79 2.01 0.41 0.49 -- -- 0.01 0.31 0.17 0.13 0.10 0.14 0.23 0.19 0.12 0.52 5.321981 1.98 1.15 0.29 0.31 -- -- 0.07 0.28 0.10 0.18 0.16 0.15 0.19 0.39 0.11 0.16 5.241982 3.27 1.56 0.49 0.52 -- -- 0.04 0.34 0.17 0.17 0.06 0.11 0.29 0.33 0.11 0.13 7.251983 2.35 1.60 0.45 0.53 -- -- 0.03 0.28 0.11 0.17 0.10 0.14 0.26 0.14 0.14 0.15 6.171984 1.70 1.72 0.49 0.35 -- -- 0.02 0.31 0.12 0.19 0.04 0.10 0.21 0.05 0.07 0.23 5.291985 2.77 1.85 0.47 0.45 -- -- 0.01 0.37 0.11 0.25 0.05 0.07 0.23 0.10 0.07 0.32 6.761986 2.63 1.19 0.47 0.51 -- -- 0.03 0.35 0.11 0.24 0.16 0.09 0.19 0.30 0.10 0.25 6.271987 2.25 1.44 0.20 0.37 -- -- 0.05 0.18 0.08 0.10 0.08 0.10 0.23 0.18 0.06 0.14 5.281988 3.34 1.12 0.54 0.32 -- -- 0.01 0.20 0.04 0.16 0.10 0.13 0.35 0.20 0.05 0.35 6.711989 2.13 1.06 0.44 0.40 -- -- 0.06 0.30 0.10 0.19 0.17 0.13 0.30 0.07 0.05 0.31 5.42
1990 3.08 1.26 0.36 0.59 0.18 0.41 0.10 0.23 0.08 0.15 0.12 0.10 0.27 0.26 0.08 0.27 6.721991 3.28 1.47 0.50 0.54 0.15 0.39 0.15 0.25 0.10 0.15 0.17 0.11 0.28 0.22 0.12 0.28 7.371992 3.79 1.54 0.49 0.56 0.14 0.42 0.14 0.22 0.07 0.15 0.04 0.10 0.29 0.16 0.17 0.32 7.821993 3.55 1.20 0.42 0.59 0.13 0.46 0.21 0.21 0.05 0.16 0.19 0.18 0.24 0.18 0.14 0.11 7.221994 3.31 1.84 0.35 0.61 0.20 0.41 0.30 0.19 0.06 0.14 0.12 0.16 0.28 0.21 0.18 0.15 7.701995 3.22 1.65 0.36 0.56 0.16 0.40 0.43 0.24 0.10 0.14 0.14 0.13 0.26 0.18 0.13 0.21 7.511996 3.40 1.27 0.54 0.55 0.19 0.36 0.36 0.20 0.07 0.13 0.17 0.26 0.26 0.15 0.17 0.13 7.461997 3.47 1.37 0.40 0.55 0.13 0.42 0.34 0.21 0.08 0.13 0.14 0.24 0.24 0.20 0.17 0.06 7.391998 3.44 1.11 0.35 0.61 0.18 0.43 0.53 0.21 0.13 0.09 0.21 0.16 0.22 0.21 0.15 0.05 7.251999 3.46 1.22 0.53 0.59 0.17 0.42 0.62 0.21 0.08 0.13 0.22 0.16 0.25 0.28 0.17 0.10 7.81
2000 3.47 1.16 0.47 0.49 0.18 0.31 0.57 0.17 0.07 0.10 0.13 0.41 0.22 0.15 0.14 0.24 7.622001 3.23 1.00 0.45 0.53 0.22 0.31 0.49 0.21 0.10 0.11 0.12 0.36 0.22 0.09 0.04 0.25 6.992002 3.25 0.90 0.36 0.49 0.26 0.23 0.46 0.15 0.07 0.08 0.09 0.28 0.18 0.12 0.07 0.42 6.772003 3.06 0.85 0.42 0.59 0.25 0.34 0.46 0.15 0.06 0.09 0.17 0.17 0.23 0.22 0.05 0.43 6.802004 2.73 0.55 0.34 0.49 0.20 0.29 0.54 0.14 0.06 0.08 0.16 0.25 0.13 0.19 0.06 0.44 6.022005 2.52 0.66 0.29 0.62 0.28 0.34 0.49 0.13 0.05 0.08 0.25 0.29 0.16 0.21 0.06 0.41 6.092006 2.91 0.94 0.21 0.43 0.22 0.21 0.54 0.11 0.03 0.08 0.19 0.44 0.17 0.19 0.04 0.32 6.492007 2.71 0.98 0.27 0.49 0.19 0.30 0.55 0.09 0.03 0.06 0.18 0.45 0.16 0.18 0.02 0.32 6.402008 2.76 0.99 0.20 0.62 0.31 0.31 0.53 0.13 0.05 0.08 0.25 0.34 0.18 0.18 0.02 0.26 6.462009 2.67 0.64 0.20 0.50 0.19 0.31 0.54 0.13 0.04 0.09 0.27 0.38 0.24 0.17 0.01 0.39 6.14
2010 3.48 0.84 0.21 0.49 0.23 0.26 0.37 0.11 0.06 0.05 0.20 0.44 0.17 0.16 0.00 0.57 7.032011 1.73 0.38 0.36 0.45 0.23 0.22 0.89 0.14 0.08 0.06 0.24 0.42 0.18 0.17 0.00 0.61 5.562012 2.74 0.87 0.16 0.42 0.19 0.24 0.71 0.05 0.04 0.00 0.21 0.63 0.07 0.16 0.01 0.37 6.412013 2.33 0.35 0.14 0.29 0.04 0.25 0.69 0.05 0.05 0.00 0.15 0.80 0.22 0.14 0.00 0.34 5.502014 p 2.63 0.06 0.34 0.51 0.12 0.40 0.86 0.01 0.01 0.00 0.13 0.70 0.12 0.13 -- 0.52 6.02'-- = Not available. p = preliminary. r = revised. Totals may not sum due to rounding. 1/ Also known as net domestic use per person. 2/ Includes small white and all other dry edible beans after 1979.
-------------------------------------------------------------------------------------------------------- Pounds per person, farm weight ---------------------------------------------------------------------------------------------------
Source: USDA, Economic Resesarch Service.
Vegetables and Pulses Yearbook Data/#89011/ March 20, 2015Economic Research Service, USDA
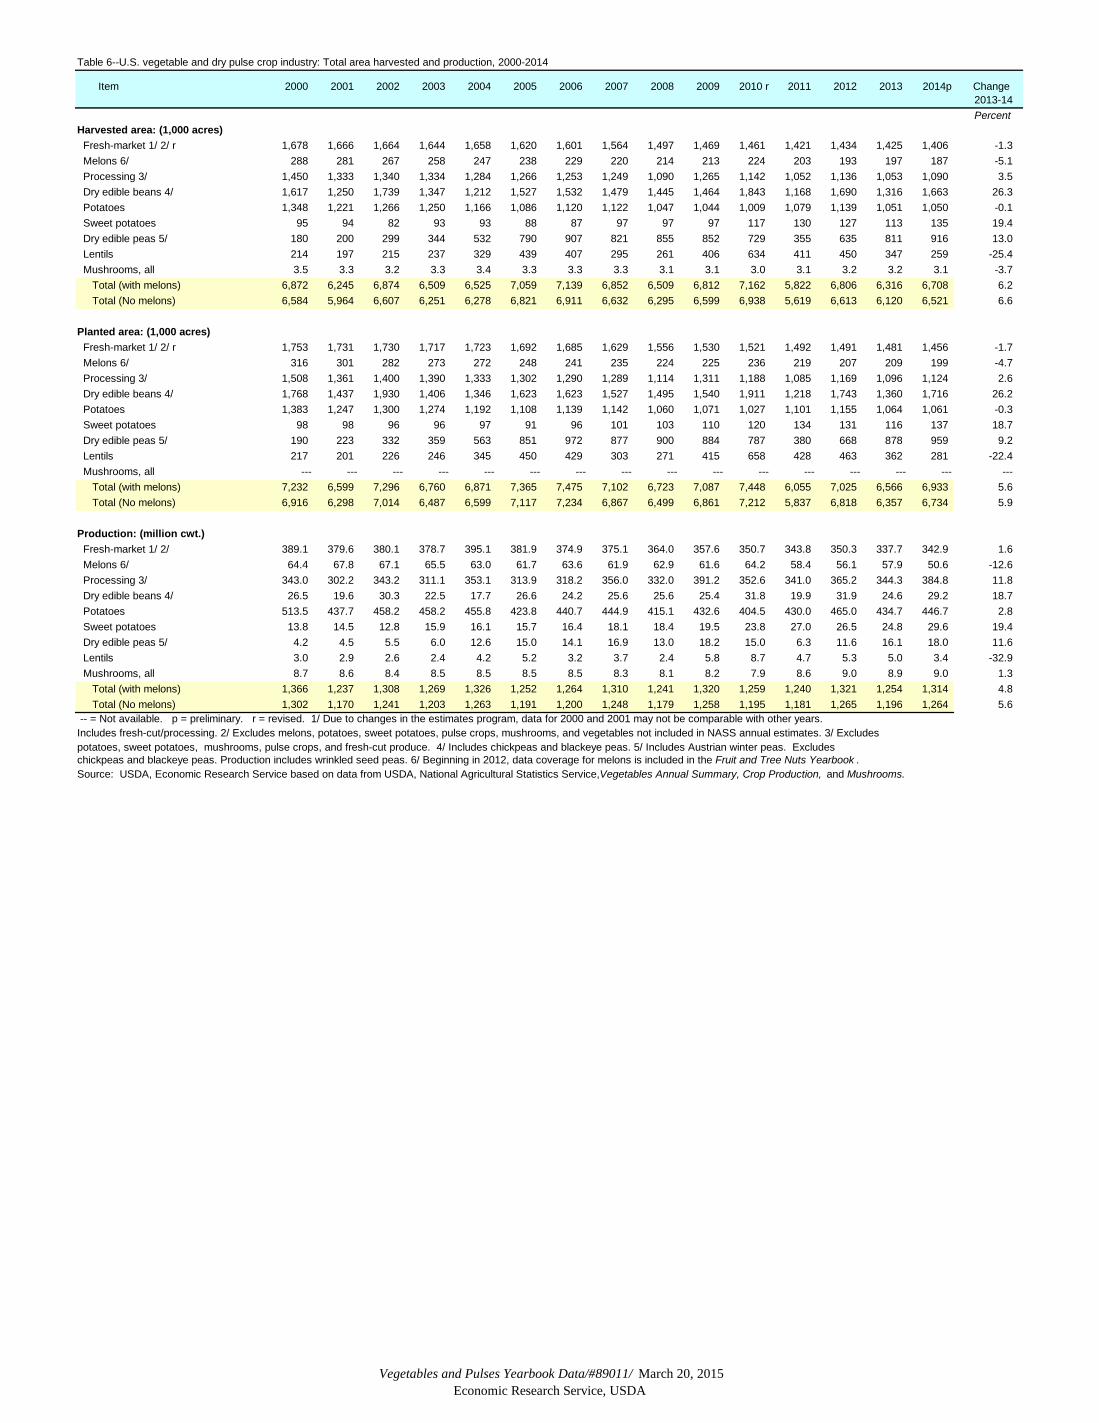
Table 6--U.S. vegetable and dry pulse crop industry: Total area harvested and production, 2000-2014
Item 2000 2001 2002 2003 2004 2005 2006 2007 2008 2009 2010 r 2011 2012 2013 2014p Change 2013-14Percent
Harvested area: (1,000 acres) Fresh-market 1/ 2/ r 1,678 1,666 1,664 1,644 1,658 1,620 1,601 1,564 1,497 1,469 1,461 1,421 1,434 1,425 1,406 -1.3 Melons 6/ 288 281 267 258 247 238 229 220 214 213 224 203 193 197 187 -5.1 Processing 3/ 1,450 1,333 1,340 1,334 1,284 1,266 1,253 1,249 1,090 1,265 1,142 1,052 1,136 1,053 1,090 3.5 Dry edible beans 4/ 1,617 1,250 1,739 1,347 1,212 1,527 1,532 1,479 1,445 1,464 1,843 1,168 1,690 1,316 1,663 26.3 Potatoes 1,348 1,221 1,266 1,250 1,166 1,086 1,120 1,122 1,047 1,044 1,009 1,079 1,139 1,051 1,050 -0.1 Sweet potatoes 95 94 82 93 93 88 87 97 97 97 117 130 127 113 135 19.4 Dry edible peas 5/ 180 200 299 344 532 790 907 821 855 852 729 355 635 811 916 13.0 Lentils 214 197 215 237 329 439 407 295 261 406 634 411 450 347 259 -25.4 Mushrooms, all 3.5 3.3 3.2 3.3 3.4 3.3 3.3 3.3 3.1 3.1 3.0 3.1 3.2 3.2 3.1 -3.7 Total (with melons) 6,872 6,245 6,874 6,509 6,525 7,059 7,139 6,852 6,509 6,812 7,162 5,822 6,806 6,316 6,708 6.2 Total (No melons) 6,584 5,964 6,607 6,251 6,278 6,821 6,911 6,632 6,295 6,599 6,938 5,619 6,613 6,120 6,521 6.6
Planted area: (1,000 acres) Fresh-market 1/ 2/ r 1,753 1,731 1,730 1,717 1,723 1,692 1,685 1,629 1,556 1,530 1,521 1,492 1,491 1,481 1,456 -1.7 Melons 6/ 316 301 282 273 272 248 241 235 224 225 236 219 207 209 199 -4.7 Processing 3/ 1,508 1,361 1,400 1,390 1,333 1,302 1,290 1,289 1,114 1,311 1,188 1,085 1,169 1,096 1,124 2.6 Dry edible beans 4/ 1,768 1,437 1,930 1,406 1,346 1,623 1,623 1,527 1,495 1,540 1,911 1,218 1,743 1,360 1,716 26.2 Potatoes 1,383 1,247 1,300 1,274 1,192 1,108 1,139 1,142 1,060 1,071 1,027 1,101 1,155 1,064 1,061 -0.3 Sweet potatoes 98 98 96 96 97 91 96 101 103 110 120 134 131 116 137 18.7 Dry edible peas 5/ 190 223 332 359 563 851 972 877 900 884 787 380 668 878 959 9.2 Lentils 217 201 226 246 345 450 429 303 271 415 658 428 463 362 281 -22.4 Mushrooms, all --- --- --- --- --- --- --- --- --- --- --- --- --- --- --- --- Total (with melons) 7,232 6,599 7,296 6,760 6,871 7,365 7,475 7,102 6,723 7,087 7,448 6,055 7,025 6,566 6,933 5.6 Total (No melons) 6,916 6,298 7,014 6,487 6,599 7,117 7,234 6,867 6,499 6,861 7,212 5,837 6,818 6,357 6,734 5.9
Production: (million cwt.) Fresh-market 1/ 2/ 389.1 379.6 380.1 378.7 395.1 381.9 374.9 375.1 364.0 357.6 350.7 343.8 350.3 337.7 342.9 1.6 Melons 6/ 64.4 67.8 67.1 65.5 63.0 61.7 63.6 61.9 62.9 61.6 64.2 58.4 56.1 57.9 50.6 -12.6 Processing 3/ 343.0 302.2 343.2 311.1 353.1 313.9 318.2 356.0 332.0 391.2 352.6 341.0 365.2 344.3 384.8 11.8 Dry edible beans 4/ 26.5 19.6 30.3 22.5 17.7 26.6 24.2 25.6 25.6 25.4 31.8 19.9 31.9 24.6 29.2 18.7 Potatoes 513.5 437.7 458.2 458.2 455.8 423.8 440.7 444.9 415.1 432.6 404.5 430.0 465.0 434.7 446.7 2.8 Sweet potatoes 13.8 14.5 12.8 15.9 16.1 15.7 16.4 18.1 18.4 19.5 23.8 27.0 26.5 24.8 29.6 19.4 Dry edible peas 5/ 4.2 4.5 5.5 6.0 12.6 15.0 14.1 16.9 13.0 18.2 15.0 6.3 11.6 16.1 18.0 11.6 Lentils 3.0 2.9 2.6 2.4 4.2 5.2 3.2 3.7 2.4 5.8 8.7 4.7 5.3 5.0 3.4 -32.9 Mushrooms, all 8.7 8.6 8.4 8.5 8.5 8.5 8.5 8.3 8.1 8.2 7.9 8.6 9.0 8.9 9.0 1.3 Total (with melons) 1,366 1,237 1,308 1,269 1,326 1,252 1,264 1,310 1,241 1,320 1,259 1,240 1,321 1,254 1,314 4.8 Total (No melons) 1,302 1,170 1,241 1,203 1,263 1,191 1,200 1,248 1,179 1,258 1,195 1,181 1,265 1,196 1,264 5.6 -- = Not available. p = preliminary. r = revised. 1/ Due to changes in the estimates program, data for 2000 and 2001 may not be comparable with other years. Includes fresh-cut/processing. 2/ Excludes melons, potatoes, sweet potatoes, pulse crops, mushrooms, and vegetables not included in NASS annual estimates. 3/ Excludes potatoes, sweet potatoes, mushrooms, pulse crops, and fresh-cut produce. 4/ Includes chickpeas and blackeye peas. 5/ Includes Austrian winter peas. Excludes chickpeas and blackeye peas. Production includes wrinkled seed peas. 6/ Beginning in 2012, data coverage for melons is included in the Fruit and Tree Nuts Yearbook . Source: USDA, Economic Research Service based on data from USDA, National Agricultural Statistics Service,Vegetables Annual Summary, Crop Production, and Mushrooms.

Vegetables and Pulses Yearbook Data/#89011/ March 20, 2015Economic Research Service, USDA
Table 7--Vegetable imports: U.S. value by group, by month, 2012-2014 * Month Dried Total Total and Fresh Melons Canned Frozen Mushrooms Potatoes Dry peas Dry beans Seed & dehy- no with year 1/ 5/ 1/ 1/ 2/ 2/ 2/ 2/ 3/ drated 4/ Melons Melons 5/
2012: Jan. 636.7 --- 102.8 84.1 29.9 103.6 5.0 17.7 39.4 70.8 1,090.0 --- Feb. 614.3 --- 78.9 79.9 29.2 107.0 5.7 15.2 28.8 58.1 1,017.1 --- Mar. 604.9 --- 96.4 84.6 26.3 109.0 6.2 15.9 36.0 58.4 1,037.7 --- Apr. 499.6 --- 93.2 74.9 28.3 108.3 4.4 12.9 40.0 59.6 921.2 --- May 501.3 --- 97.8 73.9 33.2 98.6 5.4 14.9 41.6 61.7 928.5 --- June 384.0 --- 94.2 64.8 27.0 89.1 4.1 10.3 36.6 60.5 770.5 --- July 333.8 --- 99.7 63.0 20.7 79.2 5.1 11.4 40.3 61.9 715.1 --- Aug. 331.3 --- 99.1 68.0 25.6 80.3 3.7 10.9 39.7 57.3 715.8 --- Sep. 322.5 --- 95.7 69.3 20.1 86.9 4.2 11.8 31.8 55.5 698.0 --- Oct. 378.5 --- 113.3 77.9 24.5 104.9 5.8 12.0 35.3 61.4 813.5 --- Nov. 455.0 --- 112.8 78.9 26.1 95.1 6.7 10.7 57.9 69.1 912.5 --- Dec. 531.0 --- 112.9 74.2 27.6 92.4 7.1 10.5 40.8 66.0 962.4 ---Annual 5,593.0 --- 1,196.8 893.5 318.6 1,154.5 63.4 154.3 468.1 740.3 10,582.4 ---
2013:
Jan. 619.7 --- 111.5 77.6 26.5 94.1 6.2 12.5 40.1 69.4 1,057.6 --- Feb. 648.4 --- 90.3 73.1 21.6 87.2 8.3 12.2 40.6 59.9 1,041.5 --- Mar. 771.7 --- 91.8 72.8 24.5 112.0 8.9 11.7 39.3 57.6 1,190.2 --- Apr. 616.5 --- 100.9 78.2 26.1 109.2 5.6 12.4 32.9 69.0 1,050.8 --- May 568.7 --- 93.5 75.0 26.7 104.7 4.8 12.7 37.9 72.8 996.8 --- June 421.1 --- 93.8 65.7 25.9 92.7 5.3 13.3 38.8 60.9 817.6 --- July 404.4 --- 94.2 69.8 22.9 96.4 4.9 11.9 39.4 65.8 809.7 --- Aug. 402.0 --- 96.3 65.9 22.0 92.4 4.2 10.4 32.8 61.3 787.4 --- Sep. 382.2 --- 94.1 73.5 23.5 95.6 4.1 12.8 30.2 61.6 777.7 --- Oct. 452.2 --- 112.8 80.8 26.5 95.9 6.3 13.6 41.5 72.1 901.7 --- Nov. 508.3 --- 104.3 76.0 27.5 94.2 6.5 11.2 40.8 75.8 944.6 --- Dec. 572.2 --- 108.0 76.9 28.8 101.2 4.7 12.1 47.2 79.3 1,030.3 ---Annual 6,367.3 --- 1,191.3 885.5 302.6 1,175.7 70.0 146.7 461.4 805.4 11,405.9 ---
2014 p: Jan. 727.6 --- 105.9 81.5 26.2 96.3 5.6 13.0 43.6 84.0 1,183.7 --- Feb. 649.6 --- 89.7 84.7 23.1 89.2 5.4 14.2 31.9 71.7 1,059.5 --- Mar. 680.7 --- 100.4 88.0 26.6 109.9 8.1 14.6 34.0 74.2 1,136.6 --- Apr. 600.6 --- 99.5 83.1 26.3 115.2 13.8 16.0 40.3 80.4 1,075.1 --- May 507.0 --- 100.1 81.9 28.8 115.3 8.6 15.5 39.2 77.9 974.3 --- June 418.9 --- 97.3 72.5 27.2 100.3 12.6 15.5 53.5 72.1 870.0 --- July 403.6 --- 101.3 70.9 28.9 90.2 8.6 13.7 51.2 78.6 847.1 --- Aug. 360.1 --- 91.8 68.4 27.5 81.3 9.6 10.9 33.4 67.3 750.3 --- Sep. 388.6 --- 101.2 73.5 27.5 84.8 9.5 12.0 31.5 68.7 797.3 --- Oct. 477.0 --- 121.2 83.0 28.2 95.7 7.2 14.0 39.1 76.9 942.4 --- Nov. 519.7 --- 109.8 75.1 28.2 89.6 5.2 11.4 38.2 76.7 953.9 --- Dec. 643.1 --- 110.8 77.2 32.2 97.0 7.4 13.0 49.8 81.6 1,112.1 ---Annual 6,376.6 --- 1,228.9 939.9 330.6 1,164.8 101.7 163.9 485.7 910.1 11,702.2 ---
Percent change 2014 from 2013:0.1 --- 3.2 6.1 9.2 -0.9 45.3 11.7 5.3 13.0 2.6 ---
-- = Not available. p = preliminary. r = revised. 1/ Includes pulses and sweet potatoes. Excludes potatoes, mushrooms, and herbs. 2/ Excludes seed or spawn (mushroom). 3/ Excludes guar seeds. 4/ Includes herbs and spices. 5/ Beginning in 2012, data coverage and market analysis for melons is included in the Fruit and Tree Nuts Outlook . Source: USDA, Economic Research Service based on data from the U.S. Department of Commerce, U.S. Census Bureau.
---------------------------------------------------------------------------------$ millions -----------------------------------------------------------------------------------

Vegetables and Pulses Yearbook Data/#89011/ March 20, 2015Economic Research Service, USDA
Table 8--Vegetable exports: U.S. value, by group, by month, 2012-2014 Month Dried Total Total and Fresh Melons Canned Frozen Mushroom Potatoes Dry peas Dry beans Seed & dehy- no with year 1/ 5/ 2/ 3/ drated 4/ Melons Melons 5/
2012: Jan. 154.8 --- 78.4 22.5 3.1 121.5 18.2 30.9 54.9 15.2 499.5 --- Feb. 142.2 --- 76.7 22.5 2.7 123.6 13.0 30.0 53.8 15.4 479.9 --- Mar. 161.1 --- 85.2 24.6 3.1 130.7 20.9 42.1 51.2 17.2 536.2 --- Apr. 170.6 --- 73.8 21.4 2.7 135.5 19.1 33.2 35.2 12.4 503.9 --- May 197.7 --- 81.9 23.8 2.6 148.2 17.2 41.1 30.0 16.5 559.0 --- June 177.9 --- 84.9 25.3 2.6 144.7 16.1 33.8 31.8 15.9 533.1 --- July 157.3 --- 84.6 20.6 2.6 143.8 26.5 33.7 25.6 14.5 509.1 --- Aug. 137.5 --- 86.3 26.0 2.0 146.4 38.5 29.0 34.8 16.0 516.5 --- Sep. 137.5 --- 85.4 22.6 2.7 128.0 28.2 38.9 30.4 13.8 487.5 --- Oct. 151.4 --- 98.0 25.6 4.2 147.5 24.9 48.6 37.3 21.6 559.1 --- Nov. 163.6 --- 89.4 24.7 4.2 134.6 27.8 46.1 37.6 14.8 542.5 --- Dec. 172.9 --- 92.4 23.6 4.3 138.1 23.2 45.5 57.5 15.6 573.0 ---Annual 1,924.6 --- 1,016.9 283.1 36.9 1,642.5 273.5 453.0 480.2 188.7 6,299.4 ---2013:
Jan. 170.7 --- 93.9 23.1 2.7 126.0 23.6 33.7 44.8 16.0 534.5 --- Feb. 169.3 --- 87.1 21.3 3.2 117.3 27.1 30.4 54.1 15.4 525.2 --- Mar. 208.1 --- 98.3 24.4 2.8 131.7 28.0 34.5 50.7 16.5 595.1 --- Apr. 184.4 --- 105.3 22.3 2.4 137.0 42.9 39.7 36.6 12.8 583.5 --- May 218.0 --- 100.9 27.7 2.9 147.5 25.1 37.0 28.2 14.3 601.5 --- June 190.5 --- 95.7 23.6 4.3 147.3 19.0 28.5 23.7 16.2 549.0 --- July 165.3 --- 85.1 24.2 3.0 154.8 16.8 29.0 26.5 15.9 520.6 --- Aug. 142.8 --- 95.1 22.7 3.2 144.9 13.7 28.9 31.4 16.4 499.1 --- Sep. 145.5 --- 100.7 24.4 6.3 135.4 45.0 27.8 31.1 14.4 530.6 --- Oct. 178.4 --- 110.3 27.0 7.9 150.0 42.8 43.0 43.2 20.3 623.1 --- Nov. 190.1 --- 97.5 26.3 6.2 151.0 24.8 44.3 47.4 17.9 605.4 --- Dec. 182.4 --- 96.2 23.3 3.5 132.2 29.7 41.8 45.1 17.9 572.0 ---Annual 2,145.6 --- 1,166.3 290.5 48.5 1,675.1 338.6 418.6 462.8 193.9 6,739.7 ---
2014: p Jan. 185.4 --- 96.3 24.1 2.3 136.4 22.9 38.4 48.9 18.1 572.8 --- Feb. 157.0 --- 109.7 20.4 2.7 132.1 19.0 38.9 54.3 15.5 549.7 --- Mar. 184.7 --- 110.2 26.7 2.9 143.9 30.9 39.4 55.9 20.5 615.1 --- Apr. 200.3 --- 121.3 26.3 2.5 147.0 22.4 34.5 40.0 18.6 612.9 --- May 218.6 --- 118.1 27.6 2.2 168.2 24.4 27.8 30.3 16.2 633.3 --- June 205.7 --- 106.0 24.9 2.3 167.0 43.6 26.7 32.0 16.0 624.2 --- July 174.1 --- 100.5 24.8 2.9 139.9 38.9 22.9 29.6 14.8 548.7 --- Aug. 137.3 --- 106.5 25.4 2.4 138.3 50.2 20.2 29.3 15.1 524.6 --- Sep. 141.9 --- 110.6 26.3 5.4 130.5 53.0 26.2 29.3 17.3 540.4 --- Oct. 176.8 --- 109.7 30.9 7.3 145.6 41.2 45.2 35.9 17.6 610.1 --- Nov. 190.4 --- 98.1 24.4 5.8 117.7 25.8 44.3 40.4 17.7 564.6 --- Dec. 196.8 --- 104.8 25.9 3.9 137.0 26.5 34.9 54.0 16.5 600.2 ---Annual 2,168.8 --- 1,291.8 307.7 42.8 1,703.5 398.7 399.4 479.9 204.0 6,996.5 ---
Percent change 2014 from 2013 (excluding melons):1.1 --- 10.8 5.9 -11.8 1.7 17.7 -4.6 3.7 5.2 3.8 ---
-- = Not available. p = preliminary. r = revised. 1/ Includes fresh-market pulses and sweet potatoes. Excludes potatoes, mushrooms, and herbs. 2/ Includes seed. 3/ Excludes potato seed. 4/ Beginning in 1993, includes dried capsicum peppers. Includes herbs and spices.5/ Beginning in 2012, data coverage and market analysis for melons is included in the Fruit and Tree Nuts Outloo k. Source: USDA, Economic Research Service based on data from the U.S. Department of Commerce, U.S. Census Bureau.
---------------------------------------------------------------------------------$ millions -----------------------------------------------------------------------------------

Vegetables and Pulses Yearbook Data/#89011/ March 20, 2015Economic Research Service, USDA
Table 9--Vegetables: Percent of U.S. supply & consumption accounted for by trade, 1990-2014 1/Percent Percent of
Year & Total Total of supply consumption category Exports Imports supply 2/ utilization exported 3/ imported 4/
Fresh market: 1990 2,731 4,031 40,326 35,914 6.8 11.21991 2,947 4,223 39,757 35,328 7.4 12.01992 3,314 3,699 42,702 37,719 7.8 9.81993 3,369 4,573 44,511 39,464 7.6 11.61994 3,811 4,630 47,041 41,412 8.1 11.21995 3,607 5,525 46,212 40,784 7.8 13.51996 3,648 6,489 48,634 43,212 7.5 15.01997 3,765 6,858 51,637 45,911 7.3 14.91998 3,753 7,724 50,967 45,288 7.4 17.11999 3,959 7,620 54,085 47,815 7.3 15.9
2000 4,267 7,461 55,800 49,311 7.6 15.12001 4,196 8,050 55,853 49,426 7.5 16.32002 4,330 8,551 56,758 50,320 7.6 17.02003 4,307 8,958 56,852 50,518 7.6 17.72004 4,426 9,111 58,899 51,863 7.5 17.62005 4,328 9,784 57,781 51,432 7.5 19.02006 4,014 10,440 58,355 52,392 6.9 19.92007 3,881 11,157 58,923 52,698 6.6 21.22008 4,036 11,399 57,984 51,729 7.0 22.02009 3,805 11,745 57,574 51,474 6.6 22.8
2010 3,961 13,287 59,198 52,916 6.7 25.12011 4,079 13,582 58,459 51,992 7.0 26.12012 4,130 13,827 59,219 53,013 7.0 26.12013 4,072 14,595 58,626 52,485 6.9 27.82014 p 3,940 14,265 57,538 51,295 6.8 27.8
Freezing:1990 689 719 9,553 5,062 7.2 14.21991 694 713 9,894 5,421 7.0 13.21992 745 899 9,970 5,286 7.5 17.01993 736 952 9,852 5,709 7.5 16.71994 764 991 10,490 5,753 7.3 17.21995 786 991 11,028 6,050 7.1 16.41996 783 1,051 10,943 6,241 7.2 16.81997 924 1,085 11,155 6,049 8.3 17.91998 994 1,084 11,250 6,092 8.8 17.81999 967 1,259 11,249 6,285 8.6 20.0
2000 933 1,229 10,893 6,164 8.6 19.92001 895 1,214 10,774 6,047 8.3 20.12002 863 1,362 10,959 6,235 7.9 21.82003 852 1,541 11,276 6,272 7.6 24.62004 802 1,749 11,383 6,311 7.0 27.72005 878 1,828 11,657 6,530 7.5 28.02006 857 1,835 11,585 6,513 7.4 28.22007 919 2,137 11,942 6,832 7.7 31.32008 981 2,295 11,848 6,671 8.3 34.42009 831 2,149 11,971 6,571 6.9 32.7
2010 875 2,182 11,740 6,477 7.5 33.72011 978 2,418 11,889 6,847 8.2 35.32012 935 2,384 12,124 7,006 7.7 34.02013 918 2,291 11,465 6,185 8.0 37.02014 p 1,025 2,407 11,668 6,331 8.8 38.0
Canning:1990 1,659 1,930 46,092 26,868 3.6 7.21991 1,909 1,627 49,386 27,614 3.9 5.91992 2,686 1,475 47,304 27,376 5.7 5.41993 2,932 1,546 45,134 27,687 6.5 5.61994 2,951 1,888 48,405 27,920 6.1 6.81995 3,194 1,726 49,640 27,862 6.4 6.21996 3,478 1,794 51,066 27,824 6.8 6.41997 4,097 1,998 49,415 27,855 8.3 7.21998 3,880 2,387 46,240 28,277 8.4 8.41999 3,563 3,016 50,601 27,811 7.0 10.8
2000 3,546 2,352 51,281 28,240 6.9 8.32001 3,620 3,101 48,056 26,713 7.5 11.62002 3,643 3,659 51,634 28,085 7.1 13.02003 4,067 3,363 50,193 28,479 8.1 11.82004 4,138 3,710 52,956 29,263 7.8 12.72005 4,011 3,728 50,988 30,389 7.9 12.32006 3,987 4,244 48,732 27,568 8.2 15.42007 3,853 4,246 52,803 28,528 7.3 14.92008 6,443 3,947 55,382 28,277 11.6 14.02009 5,418 4,026 59,565 30,358 9.1 13.3
2010 5,752 4,175 59,534 30,171 9.7 13.82011 7,162 4,089 57,975 27,894 12.4 14.72012 7,186 4,249 59,378 28,576 12.1 14.92013 8,815 4,182 58,607 28,526 15.0 14.72014 p 9,307 3,306 59,379 28,456 15.7 11.6p=preliminary. 1/ Includes 30 major fresh vegetables plus the three major melons. Excludes potatoes. 2/ Equals production plus imports and includes the net change in onion stocks and nets out onion shrinkage. 3/ Percent of U.S. supply of vegetablesand melons exported. 4/ Percent of U.S. consumption of vegetables and melons accounted for by imports.Source: USDA, Economic Research Service.
---------------------------Million pounds, fresh-weight-------------------------- ----------- Percent ------------
Vegetables and Pulses Yearbook Data/#89011/ March 20, 2015Economic Research Service, USDA
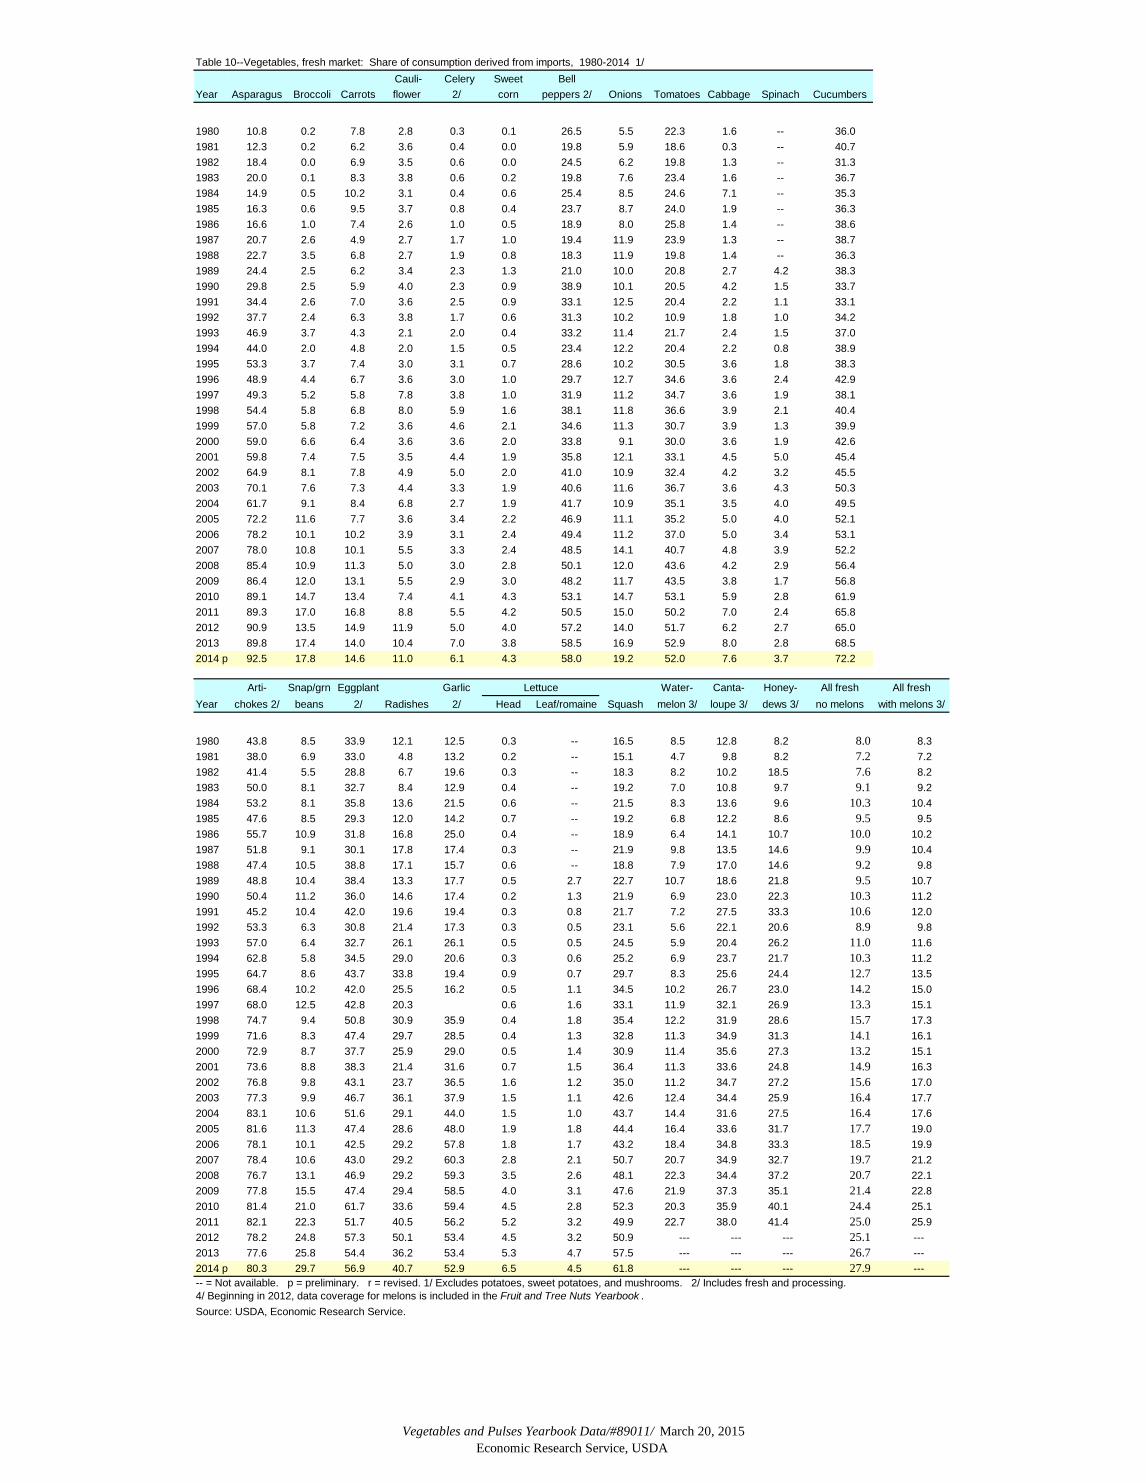
Table 10--Vegetables, fresh market: Share of consumption derived from imports, 1980-2014 1/ Cauli- Celery Sweet Bell
Year Asparagus Broccoli Carrots flower 2/ corn peppers 2/ Onions Tomatoes Cabbage Spinach Cucumbers
1980 10.8 0.2 7.8 2.8 0.3 0.1 26.5 5.5 22.3 1.6 -- 36.01981 12.3 0.2 6.2 3.6 0.4 0.0 19.8 5.9 18.6 0.3 -- 40.71982 18.4 0.0 6.9 3.5 0.6 0.0 24.5 6.2 19.8 1.3 -- 31.31983 20.0 0.1 8.3 3.8 0.6 0.2 19.8 7.6 23.4 1.6 -- 36.71984 14.9 0.5 10.2 3.1 0.4 0.6 25.4 8.5 24.6 7.1 -- 35.31985 16.3 0.6 9.5 3.7 0.8 0.4 23.7 8.7 24.0 1.9 -- 36.31986 16.6 1.0 7.4 2.6 1.0 0.5 18.9 8.0 25.8 1.4 -- 38.61987 20.7 2.6 4.9 2.7 1.7 1.0 19.4 11.9 23.9 1.3 -- 38.71988 22.7 3.5 6.8 2.7 1.9 0.8 18.3 11.9 19.8 1.4 -- 36.31989 24.4 2.5 6.2 3.4 2.3 1.3 21.0 10.0 20.8 2.7 4.2 38.31990 29.8 2.5 5.9 4.0 2.3 0.9 38.9 10.1 20.5 4.2 1.5 33.71991 34.4 2.6 7.0 3.6 2.5 0.9 33.1 12.5 20.4 2.2 1.1 33.11992 37.7 2.4 6.3 3.8 1.7 0.6 31.3 10.2 10.9 1.8 1.0 34.21993 46.9 3.7 4.3 2.1 2.0 0.4 33.2 11.4 21.7 2.4 1.5 37.01994 44.0 2.0 4.8 2.0 1.5 0.5 23.4 12.2 20.4 2.2 0.8 38.91995 53.3 3.7 7.4 3.0 3.1 0.7 28.6 10.2 30.5 3.6 1.8 38.31996 48.9 4.4 6.7 3.6 3.0 1.0 29.7 12.7 34.6 3.6 2.4 42.91997 49.3 5.2 5.8 7.8 3.8 1.0 31.9 11.2 34.7 3.6 1.9 38.11998 54.4 5.8 6.8 8.0 5.9 1.6 38.1 11.8 36.6 3.9 2.1 40.41999 57.0 5.8 7.2 3.6 4.6 2.1 34.6 11.3 30.7 3.9 1.3 39.92000 59.0 6.6 6.4 3.6 3.6 2.0 33.8 9.1 30.0 3.6 1.9 42.62001 59.8 7.4 7.5 3.5 4.4 1.9 35.8 12.1 33.1 4.5 5.0 45.42002 64.9 8.1 7.8 4.9 5.0 2.0 41.0 10.9 32.4 4.2 3.2 45.52003 70.1 7.6 7.3 4.4 3.3 1.9 40.6 11.6 36.7 3.6 4.3 50.32004 61.7 9.1 8.4 6.8 2.7 1.9 41.7 10.9 35.1 3.5 4.0 49.52005 72.2 11.6 7.7 3.6 3.4 2.2 46.9 11.1 35.2 5.0 4.0 52.12006 78.2 10.1 10.2 3.9 3.1 2.4 49.4 11.2 37.0 5.0 3.4 53.12007 78.0 10.8 10.1 5.5 3.3 2.4 48.5 14.1 40.7 4.8 3.9 52.22008 85.4 10.9 11.3 5.0 3.0 2.8 50.1 12.0 43.6 4.2 2.9 56.42009 86.4 12.0 13.1 5.5 2.9 3.0 48.2 11.7 43.5 3.8 1.7 56.82010 89.1 14.7 13.4 7.4 4.1 4.3 53.1 14.7 53.1 5.9 2.8 61.92011 89.3 17.0 16.8 8.8 5.5 4.2 50.5 15.0 50.2 7.0 2.4 65.82012 90.9 13.5 14.9 11.9 5.0 4.0 57.2 14.0 51.7 6.2 2.7 65.02013 89.8 17.4 14.0 10.4 7.0 3.8 58.5 16.9 52.9 8.0 2.8 68.52014 p 92.5 17.8 14.6 11.0 6.1 4.3 58.0 19.2 52.0 7.6 3.7 72.2
Arti- Snap/grn Eggplant Garlic Lettuce Water- Canta- Honey- All fresh All freshYear chokes 2/ beans 2/ Radishes 2/ Head Leaf/romaine Squash melon 3/ loupe 3/ dews 3/ no melons with melons 3/
1980 43.8 8.5 33.9 12.1 12.5 0.3 -- 16.5 8.5 12.8 8.2 8.0 8.31981 38.0 6.9 33.0 4.8 13.2 0.2 -- 15.1 4.7 9.8 8.2 7.2 7.21982 41.4 5.5 28.8 6.7 19.6 0.3 -- 18.3 8.2 10.2 18.5 7.6 8.21983 50.0 8.1 32.7 8.4 12.9 0.4 -- 19.2 7.0 10.8 9.7 9.1 9.21984 53.2 8.1 35.8 13.6 21.5 0.6 -- 21.5 8.3 13.6 9.6 10.3 10.41985 47.6 8.5 29.3 12.0 14.2 0.7 -- 19.2 6.8 12.2 8.6 9.5 9.51986 55.7 10.9 31.8 16.8 25.0 0.4 -- 18.9 6.4 14.1 10.7 10.0 10.21987 51.8 9.1 30.1 17.8 17.4 0.3 -- 21.9 9.8 13.5 14.6 9.9 10.41988 47.4 10.5 38.8 17.1 15.7 0.6 -- 18.8 7.9 17.0 14.6 9.2 9.81989 48.8 10.4 38.4 13.3 17.7 0.5 2.7 22.7 10.7 18.6 21.8 9.5 10.71990 50.4 11.2 36.0 14.6 17.4 0.2 1.3 21.9 6.9 23.0 22.3 10.3 11.21991 45.2 10.4 42.0 19.6 19.4 0.3 0.8 21.7 7.2 27.5 33.3 10.6 12.01992 53.3 6.3 30.8 21.4 17.3 0.3 0.5 23.1 5.6 22.1 20.6 8.9 9.81993 57.0 6.4 32.7 26.1 26.1 0.5 0.5 24.5 5.9 20.4 26.2 11.0 11.61994 62.8 5.8 34.5 29.0 20.6 0.3 0.6 25.2 6.9 23.7 21.7 10.3 11.21995 64.7 8.6 43.7 33.8 19.4 0.9 0.7 29.7 8.3 25.6 24.4 12.7 13.51996 68.4 10.2 42.0 25.5 16.2 0.5 1.1 34.5 10.2 26.7 23.0 14.2 15.01997 68.0 12.5 42.8 20.3 0.6 1.6 33.1 11.9 32.1 26.9 13.3 15.11998 74.7 9.4 50.8 30.9 35.9 0.4 1.8 35.4 12.2 31.9 28.6 15.7 17.31999 71.6 8.3 47.4 29.7 28.5 0.4 1.3 32.8 11.3 34.9 31.3 14.1 16.12000 72.9 8.7 37.7 25.9 29.0 0.5 1.4 30.9 11.4 35.6 27.3 13.2 15.12001 73.6 8.8 38.3 21.4 31.6 0.7 1.5 36.4 11.3 33.6 24.8 14.9 16.32002 76.8 9.8 43.1 23.7 36.5 1.6 1.2 35.0 11.2 34.7 27.2 15.6 17.02003 77.3 9.9 46.7 36.1 37.9 1.5 1.1 42.6 12.4 34.4 25.9 16.4 17.72004 83.1 10.6 51.6 29.1 44.0 1.5 1.0 43.7 14.4 31.6 27.5 16.4 17.62005 81.6 11.3 47.4 28.6 48.0 1.9 1.8 44.4 16.4 33.6 31.7 17.7 19.02006 78.1 10.1 42.5 29.2 57.8 1.8 1.7 43.2 18.4 34.8 33.3 18.5 19.92007 78.4 10.6 43.0 29.2 60.3 2.8 2.1 50.7 20.7 34.9 32.7 19.7 21.22008 76.7 13.1 46.9 29.2 59.3 3.5 2.6 48.1 22.3 34.4 37.2 20.7 22.12009 77.8 15.5 47.4 29.4 58.5 4.0 3.1 47.6 21.9 37.3 35.1 21.4 22.82010 81.4 21.0 61.7 33.6 59.4 4.5 2.8 52.3 20.3 35.9 40.1 24.4 25.12011 82.1 22.3 51.7 40.5 56.2 5.2 3.2 49.9 22.7 38.0 41.4 25.0 25.92012 78.2 24.8 57.3 50.1 53.4 4.5 3.2 50.9 --- --- --- 25.1 ---2013 77.6 25.8 54.4 36.2 53.4 5.3 4.7 57.5 --- --- --- 26.7 ---2014 p 80.3 29.7 56.9 40.7 52.9 6.5 4.5 61.8 --- --- --- 27.9 ----- = Not available. p = preliminary. r = revised. 1/ Excludes potatoes, sweet potatoes, and mushrooms. 2/ Includes fresh and processing. 4/ Beginning in 2012, data coverage for melons is included in the Fruit and Tree Nuts Yearbook . Source: USDA, Economic Research Service.
Vegetables and Pulses Yearbook Data/#89011/ March 20, 2015Economic Research Service, USDA
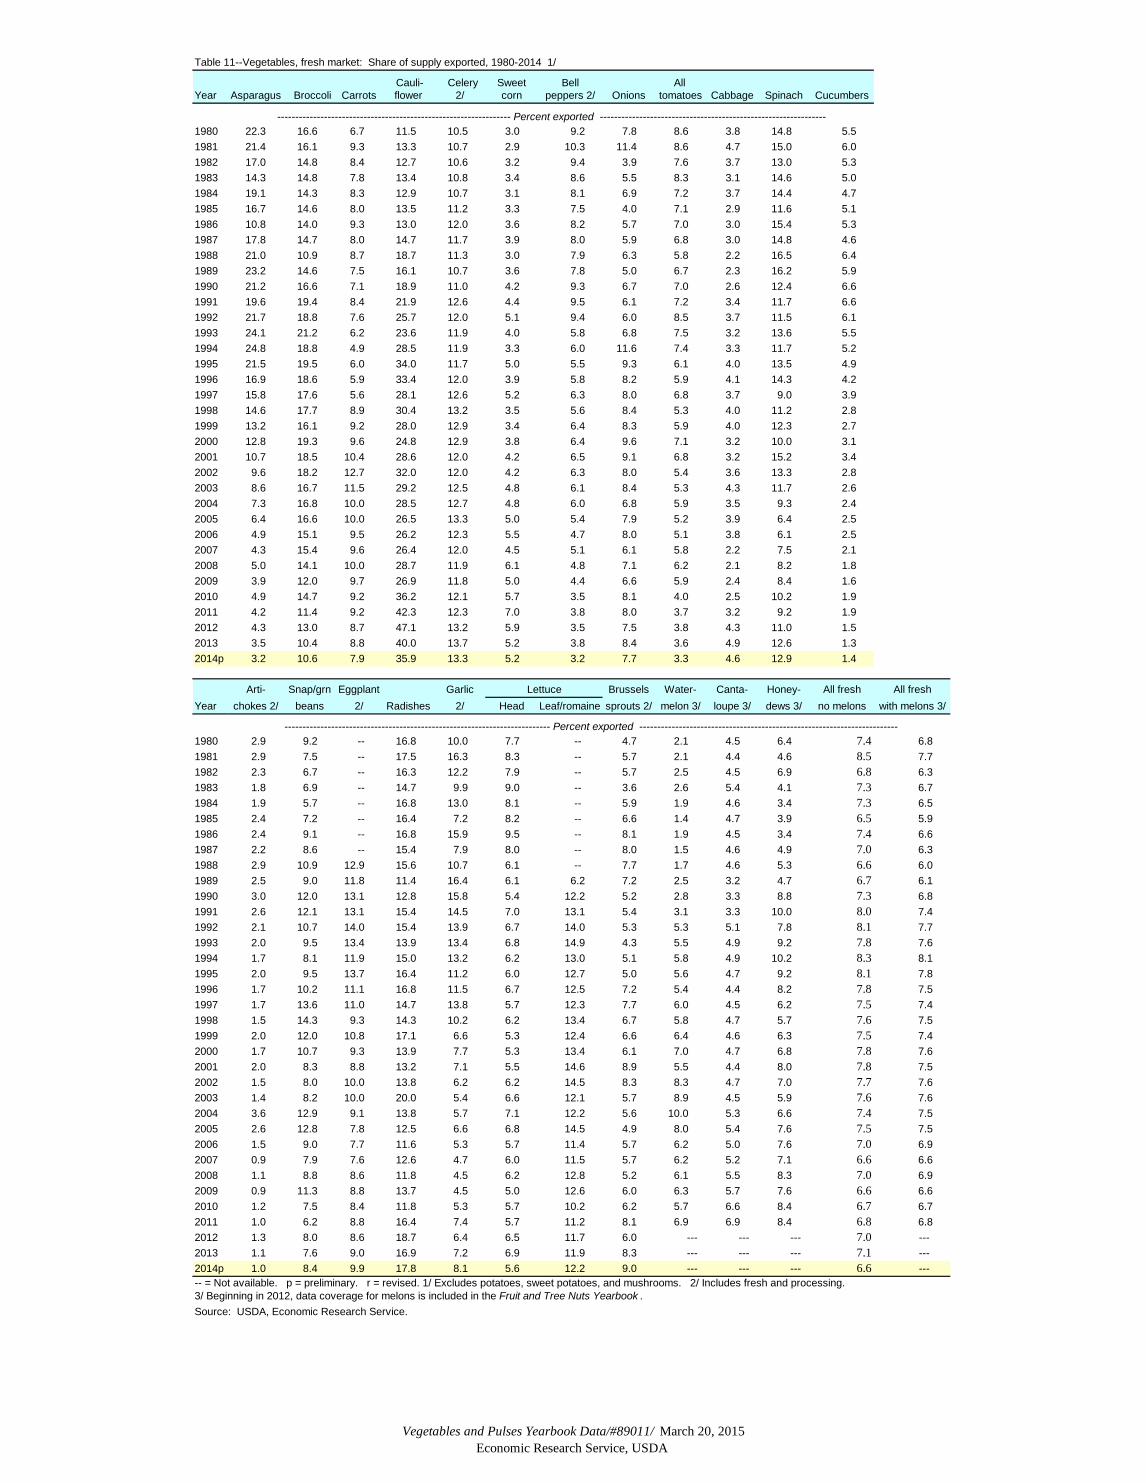
Table 11--Vegetables, fresh market: Share of supply exported, 1980-2014 1/
Cauli- Celery Sweet Bell All Year Asparagus Broccoli Carrots flower 2/ corn peppers 2/ Onions tomatoes Cabbage Spinach Cucumbers
1980 22.3 16.6 6.7 11.5 10.5 3.0 9.2 7.8 8.6 3.8 14.8 5.51981 21.4 16.1 9.3 13.3 10.7 2.9 10.3 11.4 8.6 4.7 15.0 6.01982 17.0 14.8 8.4 12.7 10.6 3.2 9.4 3.9 7.6 3.7 13.0 5.31983 14.3 14.8 7.8 13.4 10.8 3.4 8.6 5.5 8.3 3.1 14.6 5.01984 19.1 14.3 8.3 12.9 10.7 3.1 8.1 6.9 7.2 3.7 14.4 4.71985 16.7 14.6 8.0 13.5 11.2 3.3 7.5 4.0 7.1 2.9 11.6 5.11986 10.8 14.0 9.3 13.0 12.0 3.6 8.2 5.7 7.0 3.0 15.4 5.31987 17.8 14.7 8.0 14.7 11.7 3.9 8.0 5.9 6.8 3.0 14.8 4.61988 21.0 10.9 8.7 18.7 11.3 3.0 7.9 6.3 5.8 2.2 16.5 6.41989 23.2 14.6 7.5 16.1 10.7 3.6 7.8 5.0 6.7 2.3 16.2 5.91990 21.2 16.6 7.1 18.9 11.0 4.2 9.3 6.7 7.0 2.6 12.4 6.61991 19.6 19.4 8.4 21.9 12.6 4.4 9.5 6.1 7.2 3.4 11.7 6.61992 21.7 18.8 7.6 25.7 12.0 5.1 9.4 6.0 8.5 3.7 11.5 6.11993 24.1 21.2 6.2 23.6 11.9 4.0 5.8 6.8 7.5 3.2 13.6 5.51994 24.8 18.8 4.9 28.5 11.9 3.3 6.0 11.6 7.4 3.3 11.7 5.21995 21.5 19.5 6.0 34.0 11.7 5.0 5.5 9.3 6.1 4.0 13.5 4.91996 16.9 18.6 5.9 33.4 12.0 3.9 5.8 8.2 5.9 4.1 14.3 4.21997 15.8 17.6 5.6 28.1 12.6 5.2 6.3 8.0 6.8 3.7 9.0 3.91998 14.6 17.7 8.9 30.4 13.2 3.5 5.6 8.4 5.3 4.0 11.2 2.81999 13.2 16.1 9.2 28.0 12.9 3.4 6.4 8.3 5.9 4.0 12.3 2.72000 12.8 19.3 9.6 24.8 12.9 3.8 6.4 9.6 7.1 3.2 10.0 3.12001 10.7 18.5 10.4 28.6 12.0 4.2 6.5 9.1 6.8 3.2 15.2 3.42002 9.6 18.2 12.7 32.0 12.0 4.2 6.3 8.0 5.4 3.6 13.3 2.82003 8.6 16.7 11.5 29.2 12.5 4.8 6.1 8.4 5.3 4.3 11.7 2.62004 7.3 16.8 10.0 28.5 12.7 4.8 6.0 6.8 5.9 3.5 9.3 2.42005 6.4 16.6 10.0 26.5 13.3 5.0 5.4 7.9 5.2 3.9 6.4 2.52006 4.9 15.1 9.5 26.2 12.3 5.5 4.7 8.0 5.1 3.8 6.1 2.52007 4.3 15.4 9.6 26.4 12.0 4.5 5.1 6.1 5.8 2.2 7.5 2.12008 5.0 14.1 10.0 28.7 11.9 6.1 4.8 7.1 6.2 2.1 8.2 1.82009 3.9 12.0 9.7 26.9 11.8 5.0 4.4 6.6 5.9 2.4 8.4 1.62010 4.9 14.7 9.2 36.2 12.1 5.7 3.5 8.1 4.0 2.5 10.2 1.92011 4.2 11.4 9.2 42.3 12.3 7.0 3.8 8.0 3.7 3.2 9.2 1.92012 4.3 13.0 8.7 47.1 13.2 5.9 3.5 7.5 3.8 4.3 11.0 1.52013 3.5 10.4 8.8 40.0 13.7 5.2 3.8 8.4 3.6 4.9 12.6 1.32014p 3.2 10.6 7.9 35.9 13.3 5.2 3.2 7.7 3.3 4.6 12.9 1.4
Arti- Snap/grn Eggplant Garlic Lettuce Brussels Water- Canta- Honey- All fresh All freshYear chokes 2/ beans 2/ Radishes 2/ Head Leaf/romaine sprouts 2/ melon 3/ loupe 3/ dews 3/ no melons with melons 3/
1980 2.9 9.2 -- 16.8 10.0 7.7 -- 4.7 2.1 4.5 6.4 7.4 6.81981 2.9 7.5 -- 17.5 16.3 8.3 -- 5.7 2.1 4.4 4.6 8.5 7.71982 2.3 6.7 -- 16.3 12.2 7.9 -- 5.7 2.5 4.5 6.9 6.8 6.31983 1.8 6.9 -- 14.7 9.9 9.0 -- 3.6 2.6 5.4 4.1 7.3 6.71984 1.9 5.7 -- 16.8 13.0 8.1 -- 5.9 1.9 4.6 3.4 7.3 6.51985 2.4 7.2 -- 16.4 7.2 8.2 -- 6.6 1.4 4.7 3.9 6.5 5.91986 2.4 9.1 -- 16.8 15.9 9.5 -- 8.1 1.9 4.5 3.4 7.4 6.61987 2.2 8.6 -- 15.4 7.9 8.0 -- 8.0 1.5 4.6 4.9 7.0 6.31988 2.9 10.9 12.9 15.6 10.7 6.1 -- 7.7 1.7 4.6 5.3 6.6 6.01989 2.5 9.0 11.8 11.4 16.4 6.1 6.2 7.2 2.5 3.2 4.7 6.7 6.11990 3.0 12.0 13.1 12.8 15.8 5.4 12.2 5.2 2.8 3.3 8.8 7.3 6.81991 2.6 12.1 13.1 15.4 14.5 7.0 13.1 5.4 3.1 3.3 10.0 8.0 7.41992 2.1 10.7 14.0 15.4 13.9 6.7 14.0 5.3 5.3 5.1 7.8 8.1 7.71993 2.0 9.5 13.4 13.9 13.4 6.8 14.9 4.3 5.5 4.9 9.2 7.8 7.61994 1.7 8.1 11.9 15.0 13.2 6.2 13.0 5.1 5.8 4.9 10.2 8.3 8.11995 2.0 9.5 13.7 16.4 11.2 6.0 12.7 5.0 5.6 4.7 9.2 8.1 7.81996 1.7 10.2 11.1 16.8 11.5 6.7 12.5 7.2 5.4 4.4 8.2 7.8 7.51997 1.7 13.6 11.0 14.7 13.8 5.7 12.3 7.7 6.0 4.5 6.2 7.5 7.41998 1.5 14.3 9.3 14.3 10.2 6.2 13.4 6.7 5.8 4.7 5.7 7.6 7.51999 2.0 12.0 10.8 17.1 6.6 5.3 12.4 6.6 6.4 4.6 6.3 7.5 7.42000 1.7 10.7 9.3 13.9 7.7 5.3 13.4 6.1 7.0 4.7 6.8 7.8 7.62001 2.0 8.3 8.8 13.2 7.1 5.5 14.6 8.9 5.5 4.4 8.0 7.8 7.52002 1.5 8.0 10.0 13.8 6.2 6.2 14.5 8.3 8.3 4.7 7.0 7.7 7.62003 1.4 8.2 10.0 20.0 5.4 6.6 12.1 5.7 8.9 4.5 5.9 7.6 7.62004 3.6 12.9 9.1 13.8 5.7 7.1 12.2 5.6 10.0 5.3 6.6 7.4 7.52005 2.6 12.8 7.8 12.5 6.6 6.8 14.5 4.9 8.0 5.4 7.6 7.5 7.52006 1.5 9.0 7.7 11.6 5.3 5.7 11.4 5.7 6.2 5.0 7.6 7.0 6.92007 0.9 7.9 7.6 12.6 4.7 6.0 11.5 5.7 6.2 5.2 7.1 6.6 6.62008 1.1 8.8 8.6 11.8 4.5 6.2 12.8 5.2 6.1 5.5 8.3 7.0 6.92009 0.9 11.3 8.8 13.7 4.5 5.0 12.6 6.0 6.3 5.7 7.6 6.6 6.62010 1.2 7.5 8.4 11.8 5.3 5.7 10.2 6.2 5.7 6.6 8.4 6.7 6.72011 1.0 6.2 8.8 16.4 7.4 5.7 11.2 8.1 6.9 6.9 8.4 6.8 6.82012 1.3 8.0 8.6 18.7 6.4 6.5 11.7 6.0 --- --- --- 7.0 ---2013 1.1 7.6 9.0 16.9 7.2 6.9 11.9 8.3 --- --- --- 7.1 ---2014p 1.0 8.4 9.9 17.8 8.1 5.6 12.2 9.0 --- --- --- 6.6 ----- = Not available. p = preliminary. r = revised. 1/ Excludes potatoes, sweet potatoes, and mushrooms. 2/ Includes fresh and processing. 3/ Beginning in 2012, data coverage for melons is included in the Fruit and Tree Nuts Yearbook . Source: USDA, Economic Research Service.
-------------------------------------------------------------------------- Percent exported ------------------------------------------------------------------------
----------------------------------------------------------------- Percent exported ---------------------------------------------------------------
Vegetables and Pulses Yearbook Data /#89011/March 20, 2015Economic Research Service, USDA
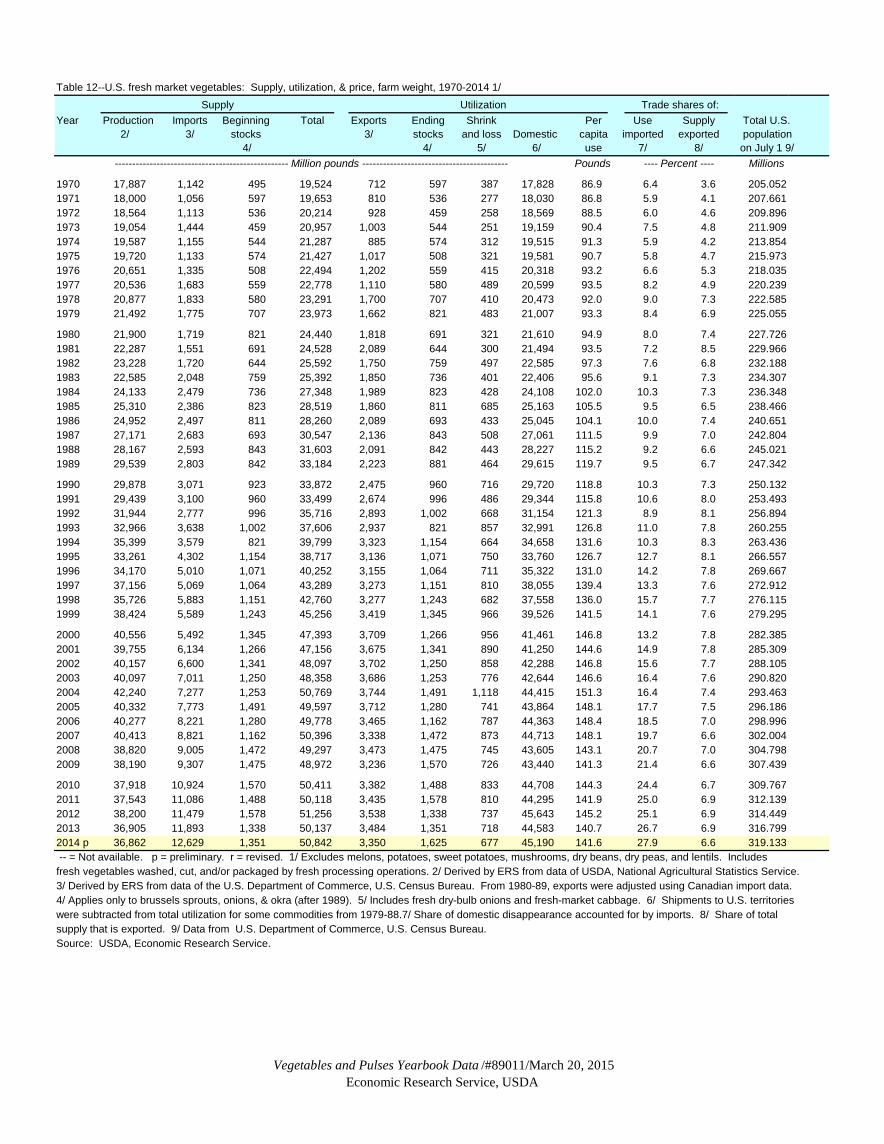
Table 12--U.S. fresh market vegetables: Supply, utilization, & price, farm weight, 1970-2014 1/ Supply Utilization Trade shares of:
Year Production Imports Beginning Total Exports Ending Shrink Per Use Supply Total U.S.2/ 3/ stocks 3/ stocks and loss Domestic capita imported exported population
4/ 4/ 5/ 6/ use 7/ 8/ on July 1 9/ -------------------------------------------------- Million pounds ------------------------------------------ Pounds Millions
1970 17,887 1,142 495 19,524 712 597 387 17,828 86.9 6.4 3.6 205.0521971 18,000 1,056 597 19,653 810 536 277 18,030 86.8 5.9 4.1 207.6611972 18,564 1,113 536 20,214 928 459 258 18,569 88.5 6.0 4.6 209.8961973 19,054 1,444 459 20,957 1,003 544 251 19,159 90.4 7.5 4.8 211.9091974 19,587 1,155 544 21,287 885 574 312 19,515 91.3 5.9 4.2 213.8541975 19,720 1,133 574 21,427 1,017 508 321 19,581 90.7 5.8 4.7 215.9731976 20,651 1,335 508 22,494 1,202 559 415 20,318 93.2 6.6 5.3 218.0351977 20,536 1,683 559 22,778 1,110 580 489 20,599 93.5 8.2 4.9 220.2391978 20,877 1,833 580 23,291 1,700 707 410 20,473 92.0 9.0 7.3 222.5851979 21,492 1,775 707 23,973 1,662 821 483 21,007 93.3 8.4 6.9 225.055
1980 21,900 1,719 821 24,440 1,818 691 321 21,610 94.9 8.0 7.4 227.7261981 22,287 1,551 691 24,528 2,089 644 300 21,494 93.5 7.2 8.5 229.9661982 23,228 1,720 644 25,592 1,750 759 497 22,585 97.3 7.6 6.8 232.1881983 22,585 2,048 759 25,392 1,850 736 401 22,406 95.6 9.1 7.3 234.3071984 24,133 2,479 736 27,348 1,989 823 428 24,108 102.0 10.3 7.3 236.3481985 25,310 2,386 823 28,519 1,860 811 685 25,163 105.5 9.5 6.5 238.4661986 24,952 2,497 811 28,260 2,089 693 433 25,045 104.1 10.0 7.4 240.6511987 27,171 2,683 693 30,547 2,136 843 508 27,061 111.5 9.9 7.0 242.8041988 28,167 2,593 843 31,603 2,091 842 443 28,227 115.2 9.2 6.6 245.0211989 29,539 2,803 842 33,184 2,223 881 464 29,615 119.7 9.5 6.7 247.342
1990 29,878 3,071 923 33,872 2,475 960 716 29,720 118.8 10.3 7.3 250.1321991 29,439 3,100 960 33,499 2,674 996 486 29,344 115.8 10.6 8.0 253.4931992 31,944 2,777 996 35,716 2,893 1,002 668 31,154 121.3 8.9 8.1 256.8941993 32,966 3,638 1,002 37,606 2,937 821 857 32,991 126.8 11.0 7.8 260.2551994 35,399 3,579 821 39,799 3,323 1,154 664 34,658 131.6 10.3 8.3 263.4361995 33,261 4,302 1,154 38,717 3,136 1,071 750 33,760 126.7 12.7 8.1 266.5571996 34,170 5,010 1,071 40,252 3,155 1,064 711 35,322 131.0 14.2 7.8 269.6671997 37,156 5,069 1,064 43,289 3,273 1,151 810 38,055 139.4 13.3 7.6 272.9121998 35,726 5,883 1,151 42,760 3,277 1,243 682 37,558 136.0 15.7 7.7 276.1151999 38,424 5,589 1,243 45,256 3,419 1,345 966 39,526 141.5 14.1 7.6 279.295
2000 40,556 5,492 1,345 47,393 3,709 1,266 956 41,461 146.8 13.2 7.8 282.3852001 39,755 6,134 1,266 47,156 3,675 1,341 890 41,250 144.6 14.9 7.8 285.3092002 40,157 6,600 1,341 48,097 3,702 1,250 858 42,288 146.8 15.6 7.7 288.1052003 40,097 7,011 1,250 48,358 3,686 1,253 776 42,644 146.6 16.4 7.6 290.8202004 42,240 7,277 1,253 50,769 3,744 1,491 1,118 44,415 151.3 16.4 7.4 293.4632005 40,332 7,773 1,491 49,597 3,712 1,280 741 43,864 148.1 17.7 7.5 296.1862006 40,277 8,221 1,280 49,778 3,465 1,162 787 44,363 148.4 18.5 7.0 298.9962007 40,413 8,821 1,162 50,396 3,338 1,472 873 44,713 148.1 19.7 6.6 302.0042008 38,820 9,005 1,472 49,297 3,473 1,475 745 43,605 143.1 20.7 7.0 304.7982009 38,190 9,307 1,475 48,972 3,236 1,570 726 43,440 141.3 21.4 6.6 307.439
2010 37,918 10,924 1,570 50,411 3,382 1,488 833 44,708 144.3 24.4 6.7 309.7672011 37,543 11,086 1,488 50,118 3,435 1,578 810 44,295 141.9 25.0 6.9 312.1392012 38,200 11,479 1,578 51,256 3,538 1,338 737 45,643 145.2 25.1 6.9 314.4492013 36,905 11,893 1,338 50,137 3,484 1,351 718 44,583 140.7 26.7 6.9 316.7992014 p 36,862 12,629 1,351 50,842 3,350 1,625 677 45,190 141.6 27.9 6.6 319.133 -- = Not available. p = preliminary. r = revised. 1/ Excludes melons, potatoes, sweet potatoes, mushrooms, dry beans, dry peas, and lentils. Includesfresh vegetables washed, cut, and/or packaged by fresh processing operations. 2/ Derived by ERS from data of USDA, National Agricultural Statistics Service. 3/ Derived by ERS from data of the U.S. Department of Commerce, U.S. Census Bureau. From 1980-89, exports were adjusted using Canadian import data. 4/ Applies only to brussels sprouts, onions, & okra (after 1989). 5/ Includes fresh dry-bulb onions and fresh-market cabbage. 6/ Shipments to U.S. territories were subtracted from total utilization for some commodities from 1979-88.7/ Share of domestic disappearance accounted for by imports. 8/ Share of total supply that is exported. 9/ Data from U.S. Department of Commerce, U.S. Census Bureau. Source: USDA, Economic Research Service.
---- Percent ----
Vegetables and Pulses Yearbook Data /#89011/March 20, 2015Economic Research Service, USDA
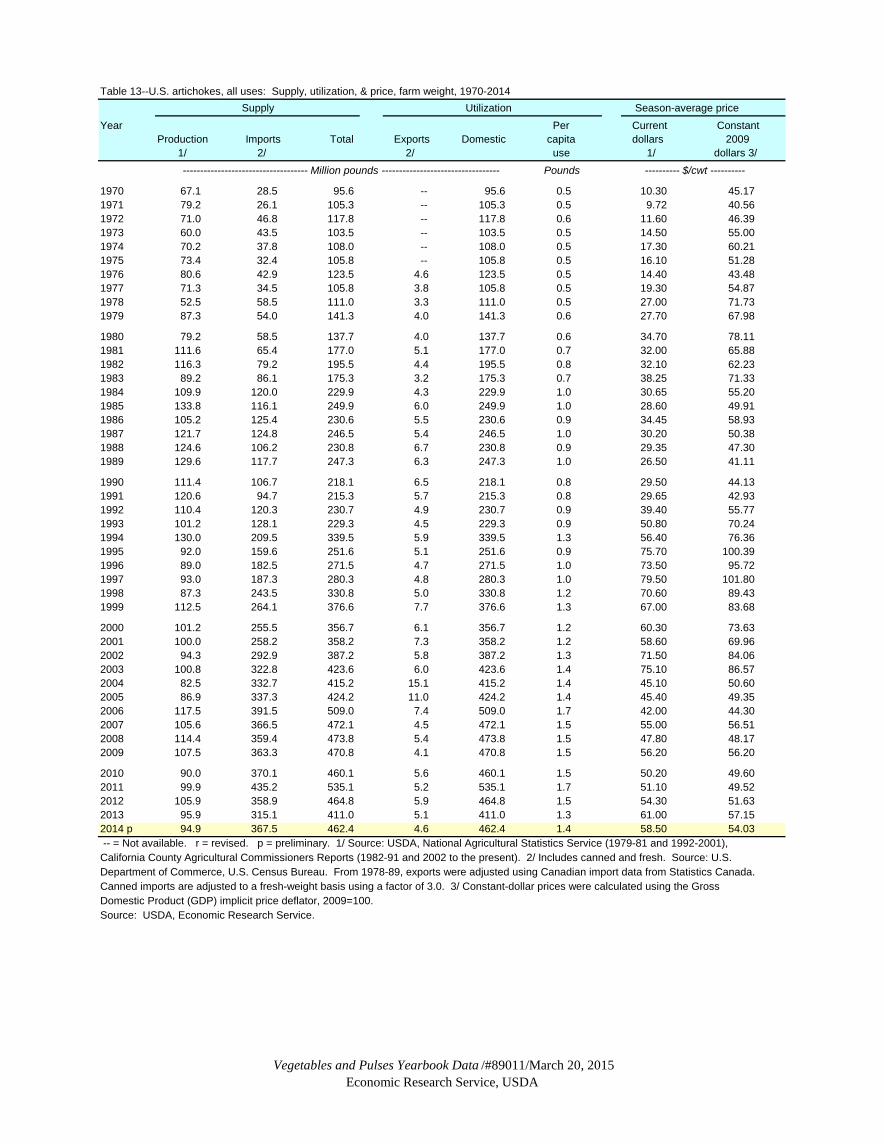
Table 13--U.S. artichokes, all uses: Supply, utilization, & price, farm weight, 1970-2014Supply Utilization Season-average price
Year Per Current ConstantProduction Imports Total Exports Domestic capita dollars 2009 1/ 2/ 2/ use 1/ dollars 3/
------------------------------------ Million pounds ---------------------------------- Pounds
1970 67.1 28.5 95.6 -- 95.6 0.5 10.30 45.171971 79.2 26.1 105.3 -- 105.3 0.5 9.72 40.561972 71.0 46.8 117.8 -- 117.8 0.6 11.60 46.391973 60.0 43.5 103.5 -- 103.5 0.5 14.50 55.001974 70.2 37.8 108.0 -- 108.0 0.5 17.30 60.211975 73.4 32.4 105.8 -- 105.8 0.5 16.10 51.281976 80.6 42.9 123.5 4.6 123.5 0.5 14.40 43.481977 71.3 34.5 105.8 3.8 105.8 0.5 19.30 54.871978 52.5 58.5 111.0 3.3 111.0 0.5 27.00 71.731979 87.3 54.0 141.3 4.0 141.3 0.6 27.70 67.98
1980 79.2 58.5 137.7 4.0 137.7 0.6 34.70 78.111981 111.6 65.4 177.0 5.1 177.0 0.7 32.00 65.881982 116.3 79.2 195.5 4.4 195.5 0.8 32.10 62.231983 89.2 86.1 175.3 3.2 175.3 0.7 38.25 71.331984 109.9 120.0 229.9 4.3 229.9 1.0 30.65 55.201985 133.8 116.1 249.9 6.0 249.9 1.0 28.60 49.911986 105.2 125.4 230.6 5.5 230.6 0.9 34.45 58.931987 121.7 124.8 246.5 5.4 246.5 1.0 30.20 50.381988 124.6 106.2 230.8 6.7 230.8 0.9 29.35 47.301989 129.6 117.7 247.3 6.3 247.3 1.0 26.50 41.11
1990 111.4 106.7 218.1 6.5 218.1 0.8 29.50 44.131991 120.6 94.7 215.3 5.7 215.3 0.8 29.65 42.931992 110.4 120.3 230.7 4.9 230.7 0.9 39.40 55.771993 101.2 128.1 229.3 4.5 229.3 0.9 50.80 70.241994 130.0 209.5 339.5 5.9 339.5 1.3 56.40 76.361995 92.0 159.6 251.6 5.1 251.6 0.9 75.70 100.391996 89.0 182.5 271.5 4.7 271.5 1.0 73.50 95.721997 93.0 187.3 280.3 4.8 280.3 1.0 79.50 101.801998 87.3 243.5 330.8 5.0 330.8 1.2 70.60 89.431999 112.5 264.1 376.6 7.7 376.6 1.3 67.00 83.68
2000 101.2 255.5 356.7 6.1 356.7 1.2 60.30 73.63 2001 100.0 258.2 358.2 7.3 358.2 1.2 58.60 69.962002 94.3 292.9 387.2 5.8 387.2 1.3 71.50 84.062003 100.8 322.8 423.6 6.0 423.6 1.4 75.10 86.572004 82.5 332.7 415.2 15.1 415.2 1.4 45.10 50.602005 86.9 337.3 424.2 11.0 424.2 1.4 45.40 49.352006 117.5 391.5 509.0 7.4 509.0 1.7 42.00 44.302007 105.6 366.5 472.1 4.5 472.1 1.5 55.00 56.512008 114.4 359.4 473.8 5.4 473.8 1.5 47.80 48.172009 107.5 363.3 470.8 4.1 470.8 1.5 56.20 56.20
2010 90.0 370.1 460.1 5.6 460.1 1.5 50.20 49.602011 99.9 435.2 535.1 5.2 535.1 1.7 51.10 49.522012 105.9 358.9 464.8 5.9 464.8 1.5 54.30 51.632013 95.9 315.1 411.0 5.1 411.0 1.3 61.00 57.152014 p 94.9 367.5 462.4 4.6 462.4 1.4 58.50 54.03 -- = Not available. r = revised. p = preliminary. 1/ Source: USDA, National Agricultural Statistics Service (1979-81 and 1992-2001),California County Agricultural Commissioners Reports (1982-91 and 2002 to the present). 2/ Includes canned and fresh. Source: U.S. Department of Commerce, U.S. Census Bureau. From 1978-89, exports were adjusted using Canadian import data from Statistics Canada. Canned imports are adjusted to a fresh-weight basis using a factor of 3.0. 3/ Constant-dollar prices were calculated using the Gross Domestic Product (GDP) implicit price deflator, 2009=100. Source: USDA, Economic Research Service.
---------- $/cwt ----------

Vegetables and Pulses Yearbook Data /#89011/March 20, 2015Economic Research Service, USDA
Table 14--U.S. fresh asparagus: Supply, utilization, & price, farm weight, 1970-2014 Supply Utilization Season-average price
Year Per Current Constant Production Imports Total Exports Domestic capita dollars 2009 1/ 2/ 2/ use 1/ dollars 3/
------------------------------------ Million pounds --------------------------------- Pounds ----------- $/cwt -----------
1970 97.4 -- 97.4 6.8 90.6 0.4 22.30 97.791971 85.8 -- 85.8 7.2 78.6 0.4 29.20 121.851972 94.7 -- 94.7 10.1 84.6 0.4 26.70 106.781973 88.0 7.3 95.3 10.5 84.8 0.4 31.10 117.951974 84.9 9.1 94.0 10.9 83.1 0.4 33.40 116.241975 91.5 8.5 100.0 11.1 88.9 0.4 34.00 108.301976 96.2 8.2 104.5 10.4 94.0 0.4 38.10 115.041977 76.7 7.1 83.8 9.8 74.0 0.3 47.00 133.631978 71.7 5.0 76.7 12.6 64.1 0.3 52.20 138.671979 64.8 6.7 71.5 15.1 56.4 0.3 64.40 158.04
1980 78.9 7.2 86.1 19.2 66.9 0.3 58.10 130.781981 82.1 8.8 90.9 19.5 71.4 0.3 70.50 145.151982 89.4 16.1 105.5 17.9 87.6 0.4 -- --1983 98.0 20.2 118.2 16.9 101.3 0.4 -- --1984 104.3 14.3 118.6 22.6 96.0 0.4 73.70 132.731985 115.2 18.0 133.2 22.3 111.0 0.5 79.30 138.391986 138.7 24.1 162.8 17.6 145.1 0.6 70.60 120.771987 138.8 28.4 167.2 29.7 137.5 0.6 65.60 109.431988 148.1 32.3 180.4 37.8 142.6 0.6 70.50 113.621989 149.2 34.5 183.7 42.6 141.1 0.6 68.20 105.80
1990 142.4 43.8 186.2 39.4 146.8 0.6 68.60 102.631991 137.0 52.4 189.4 37.2 152.2 0.6 78.90 114.231992 137.6 57.7 195.3 42.3 153.0 0.6 92.00 130.231993 125.2 69.3 194.5 46.9 147.7 0.6 95.70 132.321994 131.1 64.8 195.9 48.5 147.4 0.6 100.00 135.381995 110.0 79.1 189.1 40.7 148.4 0.6 113.00 149.861996 111.4 76.1 187.5 31.7 155.8 0.6 92.90 120.991997 124.8 88.6 213.4 33.6 179.8 0.7 108.00 138.291998 126.4 109.8 236.2 34.4 201.9 0.7 124.00 157.071999 145.5 142.3 287.8 38.1 249.7 0.9 131.00 163.60
2000 150.4 159.4 309.8 39.6 270.1 1.0 117.00 142.87 2001 137.2 156.8 294.0 31.6 262.4 0.9 140.00 167.132002 126.7 180.3 307.0 29.3 277.6 1.0 110.00 129.332003 119.4 212.6 332.0 28.6 303.4 1.0 105.00 121.032004 152.4 203.7 356.1 26.1 330.1 1.1 81.30 91.212005 114.4 238.8 353.2 22.6 330.6 1.1 87.40 95.012006 91.1 265.3 356.4 17.3 339.0 1.1 88.90 93.762007 92.7 273.5 366.2 15.7 350.5 1.2 98.90 101.612008 71.8 308.3 380.1 19.0 361.1 1.2 103.00 103.792009 70.3 344.0 414.3 16.4 397.9 1.3 108.00 108.00
2010 67.9 377.2 445.1 21.9 423.2 1.4 122.00 120.542011 65.0 385.1 450.1 19.0 431.1 1.4 122.00 118.222012 62.0 413.7 475.7 20.6 455.1 1.4 117.00 111.262013 62.0 402.0 464.0 16.4 447.6 1.4 131.00 122.742014 p 56.8 486.4 543.2 17.2 526.0 1.6 106.00 97.91-- = Not available. r = revised. p = preliminary. 1/ Source: USDA, National Agricultural Statistics Service. Production data were adjusted by ERS for 1970-81 to account for States not included in NASS estimates. ERS estimates for 1982 and 1983. 2/ Source: U.S. Department of Commerce, U.S. Census Bureau. From 1978-89, U.S. exports were adjusted using Canadian import data. 3/ Constant-dollar prices were calculated using GDP implicit price deflator, 2009=100. Source: USDA Economic Research Service.
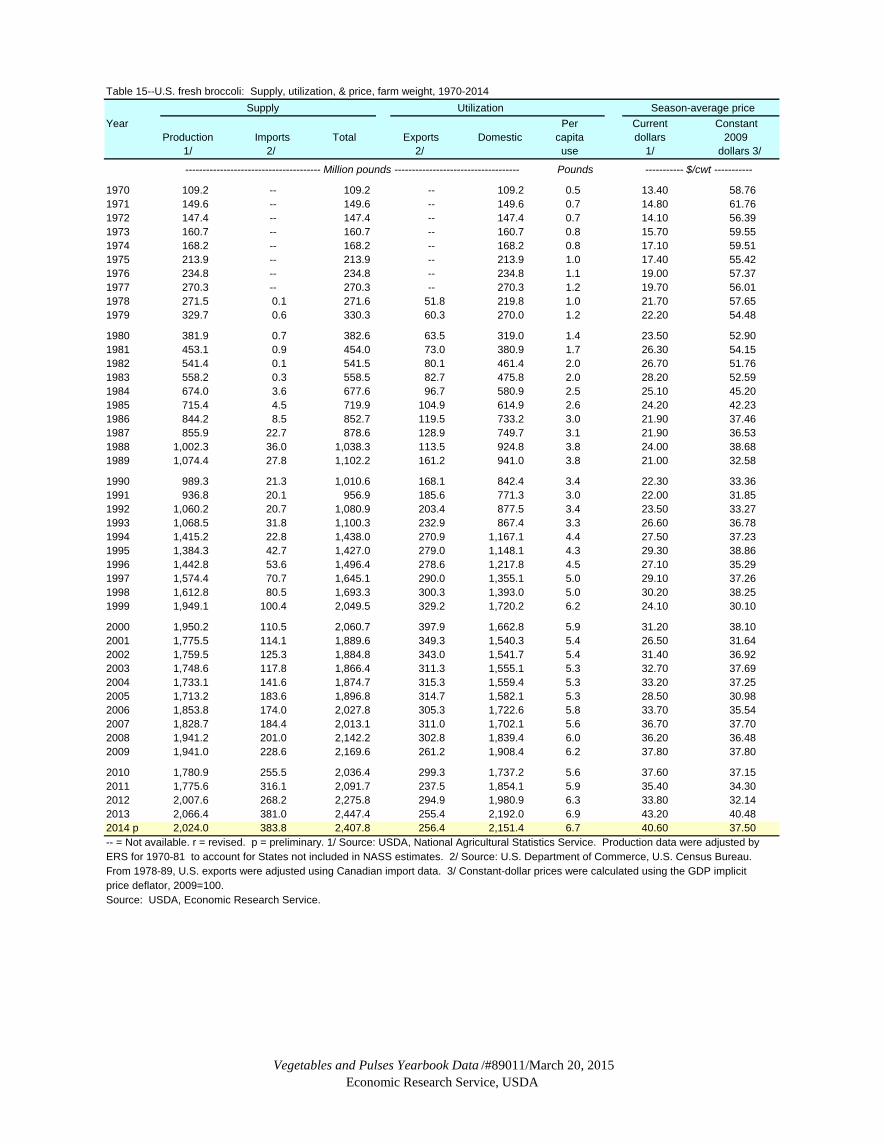
Vegetables and Pulses Yearbook Data /#89011/March 20, 2015Economic Research Service, USDA
Table 15--U.S. fresh broccoli: Supply, utilization, & price, farm weight, 1970-2014Supply Utilization Season-average price
Year Per Current ConstantProduction Imports Total Exports Domestic capita dollars 2009
1/ 2/ 2/ use 1/ dollars 3/
--------------------------------------- Million pounds ------------------------------------ Pounds ----------- $/cwt -----------
1970 109.2 -- 109.2 -- 109.2 0.5 13.40 58.761971 149.6 -- 149.6 -- 149.6 0.7 14.80 61.761972 147.4 -- 147.4 -- 147.4 0.7 14.10 56.391973 160.7 -- 160.7 -- 160.7 0.8 15.70 59.551974 168.2 -- 168.2 -- 168.2 0.8 17.10 59.511975 213.9 -- 213.9 -- 213.9 1.0 17.40 55.421976 234.8 -- 234.8 -- 234.8 1.1 19.00 57.371977 270.3 -- 270.3 -- 270.3 1.2 19.70 56.011978 271.5 0.1 271.6 51.8 219.8 1.0 21.70 57.651979 329.7 0.6 330.3 60.3 270.0 1.2 22.20 54.48
1980 381.9 0.7 382.6 63.5 319.0 1.4 23.50 52.901981 453.1 0.9 454.0 73.0 380.9 1.7 26.30 54.151982 541.4 0.1 541.5 80.1 461.4 2.0 26.70 51.761983 558.2 0.3 558.5 82.7 475.8 2.0 28.20 52.591984 674.0 3.6 677.6 96.7 580.9 2.5 25.10 45.201985 715.4 4.5 719.9 104.9 614.9 2.6 24.20 42.231986 844.2 8.5 852.7 119.5 733.2 3.0 21.90 37.461987 855.9 22.7 878.6 128.9 749.7 3.1 21.90 36.531988 1,002.3 36.0 1,038.3 113.5 924.8 3.8 24.00 38.681989 1,074.4 27.8 1,102.2 161.2 941.0 3.8 21.00 32.58
1990 989.3 21.3 1,010.6 168.1 842.4 3.4 22.30 33.361991 936.8 20.1 956.9 185.6 771.3 3.0 22.00 31.851992 1,060.2 20.7 1,080.9 203.4 877.5 3.4 23.50 33.271993 1,068.5 31.8 1,100.3 232.9 867.4 3.3 26.60 36.781994 1,415.2 22.8 1,438.0 270.9 1,167.1 4.4 27.50 37.231995 1,384.3 42.7 1,427.0 279.0 1,148.1 4.3 29.30 38.861996 1,442.8 53.6 1,496.4 278.6 1,217.8 4.5 27.10 35.291997 1,574.4 70.7 1,645.1 290.0 1,355.1 5.0 29.10 37.261998 1,612.8 80.5 1,693.3 300.3 1,393.0 5.0 30.20 38.251999 1,949.1 100.4 2,049.5 329.2 1,720.2 6.2 24.10 30.10
2000 1,950.2 110.5 2,060.7 397.9 1,662.8 5.9 31.20 38.10 2001 1,775.5 114.1 1,889.6 349.3 1,540.3 5.4 26.50 31.642002 1,759.5 125.3 1,884.8 343.0 1,541.7 5.4 31.40 36.922003 1,748.6 117.8 1,866.4 311.3 1,555.1 5.3 32.70 37.692004 1,733.1 141.6 1,874.7 315.3 1,559.4 5.3 33.20 37.252005 1,713.2 183.6 1,896.8 314.7 1,582.1 5.3 28.50 30.982006 1,853.8 174.0 2,027.8 305.3 1,722.6 5.8 33.70 35.542007 1,828.7 184.4 2,013.1 311.0 1,702.1 5.6 36.70 37.702008 1,941.2 201.0 2,142.2 302.8 1,839.4 6.0 36.20 36.482009 1,941.0 228.6 2,169.6 261.2 1,908.4 6.2 37.80 37.80
2010 1,780.9 255.5 2,036.4 299.3 1,737.2 5.6 37.60 37.15 2011 1,775.6 316.1 2,091.7 237.5 1,854.1 5.9 35.40 34.302012 2,007.6 268.2 2,275.8 294.9 1,980.9 6.3 33.80 32.142013 2,066.4 381.0 2,447.4 255.4 2,192.0 6.9 43.20 40.482014 p 2,024.0 383.8 2,407.8 256.4 2,151.4 6.7 40.60 37.50-- = Not available. r = revised. p = preliminary. 1/ Source: USDA, National Agricultural Statistics Service. Production data were adjusted by ERS for 1970-81 to account for States not included in NASS estimates. 2/ Source: U.S. Department of Commerce, U.S. Census Bureau. From 1978-89, U.S. exports were adjusted using Canadian import data. 3/ Constant-dollar prices were calculated using the GDP implicit price deflator, 2009=100. Source: USDA, Economic Research Service.

Vegetables and Pulses Yearbook Data /#89011/March 20, 2015Economic Research Service, USDA
Table 16--U.S. Brussel sprouts, all: Supply, utilization, & price, farm weight, 1970-2014 Supply Utilization Season-average price
Year Production Imports Beginning Total Exports Ending Per Current Constant1/ 2/ stocks 2/ stocks Domestic capita dollars 2009
3/ use 1/ dollars 4/ -------------------------------------------- Million pounds ------------------------------------- Pounds
1970 58.7 -- 49.8 108.5 -- 43.5 65.1 0.3 13.50 59.201971 65.5 -- 43.5 109.0 -- 46.7 62.3 0.3 12.40 51.741972 72.5 -- 46.7 119.2 -- 60.6 58.6 0.3 14.30 57.191973 64.1 -- 60.6 124.7 -- 68.0 56.7 0.3 13.90 52.721974 65.6 -- 68.0 133.6 -- 62.3 71.3 0.3 18.60 64.731975 69.6 -- 62.3 131.9 -- 65.2 66.7 0.3 17.50 55.741976 58.8 -- 65.2 124.0 -- 48.5 75.5 0.3 18.50 55.861977 78.3 -- 48.5 126.8 -- 50.0 76.8 0.3 18.90 53.731978 88.5 9.4 50.0 147.9 3.4 66.0 78.5 0.4 21.40 56.851979 77.0 8.4 66.0 151.4 5.7 62.8 82.9 0.4 20.70 50.80
1980 72.9 9.1 62.8 144.8 6.8 73.0 65.0 0.3 21.50 48.401981 74.3 13.6 73.0 160.9 9.2 68.1 83.6 0.4 21.80 44.881982 61.8 13.0 68.1 142.9 8.2 60.5 74.2 0.3 22.40 43.421983 50.5 14.5 60.5 125.5 4.5 52.2 68.8 0.3 21.40 39.911984 63.1 21.5 52.2 136.8 8.0 56.3 72.5 0.3 20.90 37.641985 68.3 22.6 56.3 147.2 9.7 59.1 78.4 0.3 20.40 35.601986 53.7 16.9 59.1 129.7 10.5 40.6 78.6 0.3 20.70 35.411987 53.2 27.5 40.6 121.3 9.7 48.8 62.8 0.3 21.65 36.111988 53.7 19.0 48.8 121.5 9.4 49.4 62.7 0.3 20.70 33.361989 61.8 27.2 49.4 138.4 10.0 45.1 83.3 0.3 21.80 33.82
1990 58.7 24.3 45.1 128.1 6.7 42.1 79.3 0.3 23.05 34.481991 52.8 16.4 42.1 111.3 6.0 29.5 75.8 0.3 23.20 33.591992 56.0 28.2 29.5 113.7 6.0 35.2 72.5 0.3 30.50 43.171993 80.0 27.1 35.2 142.3 6.1 45.7 90.5 0.3 30.90 42.721994 63.0 23.5 45.7 132.2 6.7 40.2 85.3 0.3 24.60 33.301995 56.1 24.1 40.2 120.4 6.0 25.1 89.3 0.3 25.70 34.081996 68.4 25.8 25.1 119.3 8.5 21.7 89.1 0.3 29.40 38.291997 51.2 29.1 21.7 102.0 7.9 26.5 67.6 0.2 41.40 53.011998 51.2 32.3 26.5 110.0 7.4 24.9 77.7 0.3 41.00 51.941999 57.6 31.1 24.9 113.6 7.5 34.1 72.0 0.3 37.20 46.46
2000 46.8 32.1 34.1 113.0 6.9 26.1 79.9 0.3 34.40 42.012001 39.6 31.9 26.1 97.6 8.7 23.4 65.6 0.2 36.50 43.572002 32.8 36.2 23.4 92.4 7.7 26.9 57.9 0.2 28.05 32.982003 32.0 41.1 26.9 99.9 5.7 25.2 69.1 0.2 32.60 37.582004 39.3 44.4 25.2 108.9 6.1 30.8 71.9 0.2 36.27 40.692005 45.8 43.4 30.8 119.9 5.9 28.8 85.2 0.3 31.52 34.262006 41.9 49.3 28.8 120.0 6.8 28.8 84.4 0.3 35.92 37.892007 45.8 52.1 28.8 126.7 7.2 28.6 90.9 0.3 39.66 40.752008 38.7 66.2 28.6 133.5 6.9 28.0 98.6 0.3 34.72 34.982009 38.5 54.7 28.0 121.3 7.2 27.6 86.4 0.3 42.20 42.20
2010 34.3 55.1 27.6 117.0 7.2 23.7 86.1 0.3 44.95 44.412011 36.7 75.6 23.7 136.0 11.0 14.8 110.2 0.4 51.72 50.122012 45.5 95.4 14.8 155.7 9.3 18.2 128.3 0.4 65.24 62.032013 40.8 109.3 18.2 168.3 13.8 18.1 136.4 0.4 66.61 62.412014 p 41.0 126.7 18.1 185.8 16.7 21.2 147.9 0.5 -- -- -- = Not available. r = revised. p = preliminary. 1/ Source: USDA, National Agricultural Statistics Service. Includes fresh and processing. Data for 1982-91 and after 2001 from California County Agric Commisioner reports. 2/ Source: Bureau of the Census, U.S. Departmentof Commerce and Statistics Canada. All processed product weight data converted to a fresh basis using an average factor of 1.33. 3/ Source: USDA, National Agricultural Statistics Service. Includes cold storage data converted to fresh-weight using a factor of 1.33.4/ Constant-dollar prices were calculated using the GDP implicit price deflator, 2009=100.Source: USDA, Economic Research Service.
------- $/cwt --------

Vegetables and Pulses Yearbook Data /#89011/March 20, 2015Economic Research Service, USDA
Table 17--U.S. fresh cabbage: Supply, utilization, & price, farm weight, 1970-2014 1/Supply Utilization Season-average price
Shrink Per Current ConstantYear Production Imports Total Exports and loss Domestic capita dollars 2009
2/ 3/ 3/ 4/ use 2/ dollars 5/ ------------------------------------------- Million pounds ----------------------------------------- Pounds
1970 1,866.9 7.7 1,874.6 61.1 35.2 1,778.3 8.7 3.41 14.951971 1,921.5 7.5 1,929.0 71.0 26.0 1,832.0 8.8 3.32 13.851972 1,861.1 6.4 1,867.5 90.2 20.0 1,757.3 8.4 3.52 14.081973 1,990.7 12.7 2,003.4 101.8 24.0 1,877.6 8.9 5.09 19.311974 1,971.2 0.8 1,972.0 55.8 28.9 1,887.3 8.8 4.60 16.011975 2,019.7 5.3 2,025.0 65.1 35.1 1,924.8 8.9 5.37 17.101976 1,912.2 0.6 1,912.8 56.4 32.6 1,823.8 8.4 5.87 17.721977 1,917.4 39.9 1,957.3 72.8 60.4 1,824.1 8.3 8.91 25.331978 2,013.4 24.0 2,037.4 107.3 27.5 1,902.6 8.5 8.37 22.241979 1,936.9 17.1 1,954.0 101.7 40.0 1,812.3 8.1 8.09 19.85
1980 1,884.9 29.8 1,914.7 73.5 20.0 1,821.2 8.0 8.10 18.231981 1,981.1 5.9 1,987.0 92.8 19.5 1,874.7 8.2 7.16 14.741982 2,087.7 26.6 2,114.3 78.3 49.2 1,986.8 8.6 9.20 17.831983 1,975.0 30.8 2,005.8 61.2 21.8 1,922.8 8.2 8.90 16.601984 2,002.3 143.2 2,145.5 78.8 41.8 2,024.9 8.6 11.90 21.431985 2,132.2 39.1 2,171.3 63.0 24.8 2,083.5 8.7 8.80 15.361986 2,143.4 28.5 2,171.9 64.7 27.7 2,079.5 8.6 8.20 14.031987 2,275.9 29.1 2,305.0 68.4 32.5 2,204.1 9.1 7.90 13.181988 2,251.2 30.7 2,281.9 50.3 24.6 2,207.0 9.0 7.70 12.411989 2,146.5 57.3 2,203.8 50.3 25.7 2,127.8 8.6 7.60 11.79
1990 2,163.4 88.2 2,251.6 59.2 107.1 2,085.3 8.3 7.70 11.521991 2,187.1 45.5 2,232.6 77.0 76.0 2,079.6 8.2 8.30 12.021992 2,326.7 39.5 2,366.2 86.9 53.7 2,225.6 8.7 9.11 12.901993 2,481.3 58.1 2,539.4 81.5 31.7 2,426.2 9.3 11.40 15.761994 2,478.3 51.7 2,530.0 82.9 54.5 2,392.6 9.1 9.32 12.621995 2,210.4 78.6 2,289.0 92.3 31.5 2,165.3 8.1 11.50 15.251996 2,290.0 79.2 2,369.2 96.9 45.4 2,226.9 8.3 10.20 13.281997 2,526.7 87.7 2,614.4 95.5 59.1 2,459.9 9.0 11.10 14.211998 2,377.3 89.8 2,467.1 99.5 40.4 2,327.2 8.4 12.90 16.341999 2,163.5 81.4 2,244.9 88.9 46.3 2,109.7 7.6 11.30 14.11
2000 2,562.3 89.9 2,652.2 85.2 53.9 2,513.2 8.9 12.30 15.022001 2,546.0 113.4 2,659.4 85.5 55.2 2,518.7 8.8 13.40 16.002002 2,422.7 99.6 2,522.3 90.8 41.7 2,389.9 8.3 12.90 15.172003 2,216.4 77.8 2,294.2 98.7 44.3 2,151.1 7.4 13.30 15.332004 2,411.8 83.3 2,495.1 86.6 48.2 2,360.3 8.0 13.10 14.702005 2,323.4 114.6 2,438.0 93.9 46.5 2,297.6 7.8 13.60 14.782006 2,341.1 116.0 2,457.1 92.6 46.8 2,317.6 7.8 14.10 14.872007 2,388.6 116.0 2,504.6 55.7 47.8 2,401.2 8.0 16.40 16.852008 2,451.6 104.3 2,555.9 52.8 49.0 2,454.0 8.1 14.70 14.812009 2,246.7 84.4 2,331.1 56.8 44.9 2,229.3 7.3 15.60 15.60
2010 2,279.7 136.7 2,416.4 60.0 45.6 2,310.8 7.5 17.40 17.192011 2,013.4 142.7 2,156.1 68.4 40.3 2,047.4 6.6 17.60 17.052012 1,975.2 121.7 2,096.9 90.6 39.5 1,966.8 6.3 18.50 17.592013 2,175.0 176.4 2,351.4 115.3 43.5 2,192.7 6.9 20.10 18.832014 p 2,235.9 171.1 2,407.0 111.3 44.7 2,251.0 7.1 20.40 18.84 -- = Not available. r = revised. p = preliminary. 1/ Largely head cabbage. End of year stocks and shrinkage are not included. 2/ Source: USDA, National Agricultural Statistics Service. From 1982-91, U.S. production and price were estimated by ERS based on available State reports. 3/ Source: U.S. Department of Commerce, U.S. Census Bureau. From 1978-89, U.S. exports were adjustedusing Canadian import data. Excludes sauerkraut. 4/ New York data through 2002. Estimated by ERS thereafter. 5/ Constant-dollar prices were calculated using the GDP implict price deflator, 2009=100. Source: USDA, Economic Research Service.
---------$/cwt ---------
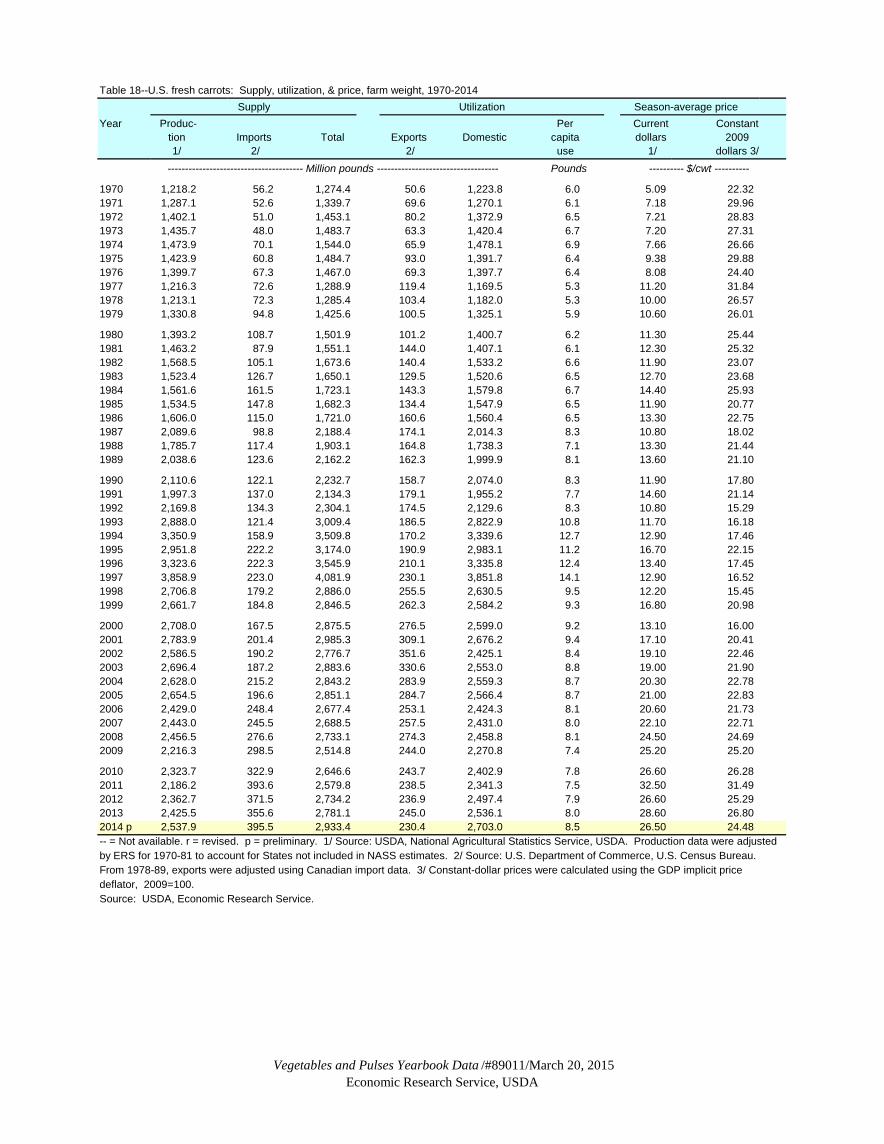
Vegetables and Pulses Yearbook Data /#89011/March 20, 2015Economic Research Service, USDA
Table 18--U.S. fresh carrots: Supply, utilization, & price, farm weight, 1970-2014Supply Utilization Season-average price
Year Produc- Per Current Constanttion Imports Total Exports Domestic capita dollars 20091/ 2/ 2/ use 1/ dollars 3/
--------------------------------------- Million pounds ----------------------------------- Pounds ---------- $/cwt ----------
1970 1,218.2 56.2 1,274.4 50.6 1,223.8 6.0 5.09 22.321971 1,287.1 52.6 1,339.7 69.6 1,270.1 6.1 7.18 29.961972 1,402.1 51.0 1,453.1 80.2 1,372.9 6.5 7.21 28.831973 1,435.7 48.0 1,483.7 63.3 1,420.4 6.7 7.20 27.311974 1,473.9 70.1 1,544.0 65.9 1,478.1 6.9 7.66 26.661975 1,423.9 60.8 1,484.7 93.0 1,391.7 6.4 9.38 29.881976 1,399.7 67.3 1,467.0 69.3 1,397.7 6.4 8.08 24.401977 1,216.3 72.6 1,288.9 119.4 1,169.5 5.3 11.20 31.841978 1,213.1 72.3 1,285.4 103.4 1,182.0 5.3 10.00 26.571979 1,330.8 94.8 1,425.6 100.5 1,325.1 5.9 10.60 26.01
1980 1,393.2 108.7 1,501.9 101.2 1,400.7 6.2 11.30 25.441981 1,463.2 87.9 1,551.1 144.0 1,407.1 6.1 12.30 25.321982 1,568.5 105.1 1,673.6 140.4 1,533.2 6.6 11.90 23.071983 1,523.4 126.7 1,650.1 129.5 1,520.6 6.5 12.70 23.681984 1,561.6 161.5 1,723.1 143.3 1,579.8 6.7 14.40 25.931985 1,534.5 147.8 1,682.3 134.4 1,547.9 6.5 11.90 20.771986 1,606.0 115.0 1,721.0 160.6 1,560.4 6.5 13.30 22.751987 2,089.6 98.8 2,188.4 174.1 2,014.3 8.3 10.80 18.021988 1,785.7 117.4 1,903.1 164.8 1,738.3 7.1 13.30 21.441989 2,038.6 123.6 2,162.2 162.3 1,999.9 8.1 13.60 21.10
1990 2,110.6 122.1 2,232.7 158.7 2,074.0 8.3 11.90 17.801991 1,997.3 137.0 2,134.3 179.1 1,955.2 7.7 14.60 21.141992 2,169.8 134.3 2,304.1 174.5 2,129.6 8.3 10.80 15.291993 2,888.0 121.4 3,009.4 186.5 2,822.9 10.8 11.70 16.181994 3,350.9 158.9 3,509.8 170.2 3,339.6 12.7 12.90 17.461995 2,951.8 222.2 3,174.0 190.9 2,983.1 11.2 16.70 22.151996 3,323.6 222.3 3,545.9 210.1 3,335.8 12.4 13.40 17.451997 3,858.9 223.0 4,081.9 230.1 3,851.8 14.1 12.90 16.521998 2,706.8 179.2 2,886.0 255.5 2,630.5 9.5 12.20 15.451999 2,661.7 184.8 2,846.5 262.3 2,584.2 9.3 16.80 20.98
2000 2,708.0 167.5 2,875.5 276.5 2,599.0 9.2 13.10 16.002001 2,783.9 201.4 2,985.3 309.1 2,676.2 9.4 17.10 20.412002 2,586.5 190.2 2,776.7 351.6 2,425.1 8.4 19.10 22.462003 2,696.4 187.2 2,883.6 330.6 2,553.0 8.8 19.00 21.902004 2,628.0 215.2 2,843.2 283.9 2,559.3 8.7 20.30 22.782005 2,654.5 196.6 2,851.1 284.7 2,566.4 8.7 21.00 22.832006 2,429.0 248.4 2,677.4 253.1 2,424.3 8.1 20.60 21.732007 2,443.0 245.5 2,688.5 257.5 2,431.0 8.0 22.10 22.712008 2,456.5 276.6 2,733.1 274.3 2,458.8 8.1 24.50 24.692009 2,216.3 298.5 2,514.8 244.0 2,270.8 7.4 25.20 25.20
2010 2,323.7 322.9 2,646.6 243.7 2,402.9 7.8 26.60 26.282011 2,186.2 393.6 2,579.8 238.5 2,341.3 7.5 32.50 31.492012 2,362.7 371.5 2,734.2 236.9 2,497.4 7.9 26.60 25.292013 2,425.5 355.6 2,781.1 245.0 2,536.1 8.0 28.60 26.802014 p 2,537.9 395.5 2,933.4 230.4 2,703.0 8.5 26.50 24.48-- = Not available. r = revised. p = preliminary. 1/ Source: USDA, National Agricultural Statistics Service, USDA. Production data were adjusted by ERS for 1970-81 to account for States not included in NASS estimates. 2/ Source: U.S. Department of Commerce, U.S. Census Bureau. From 1978-89, exports were adjusted using Canadian import data. 3/ Constant-dollar prices were calculated using the GDP implicit price deflator, 2009=100.Source: USDA, Economic Research Service.
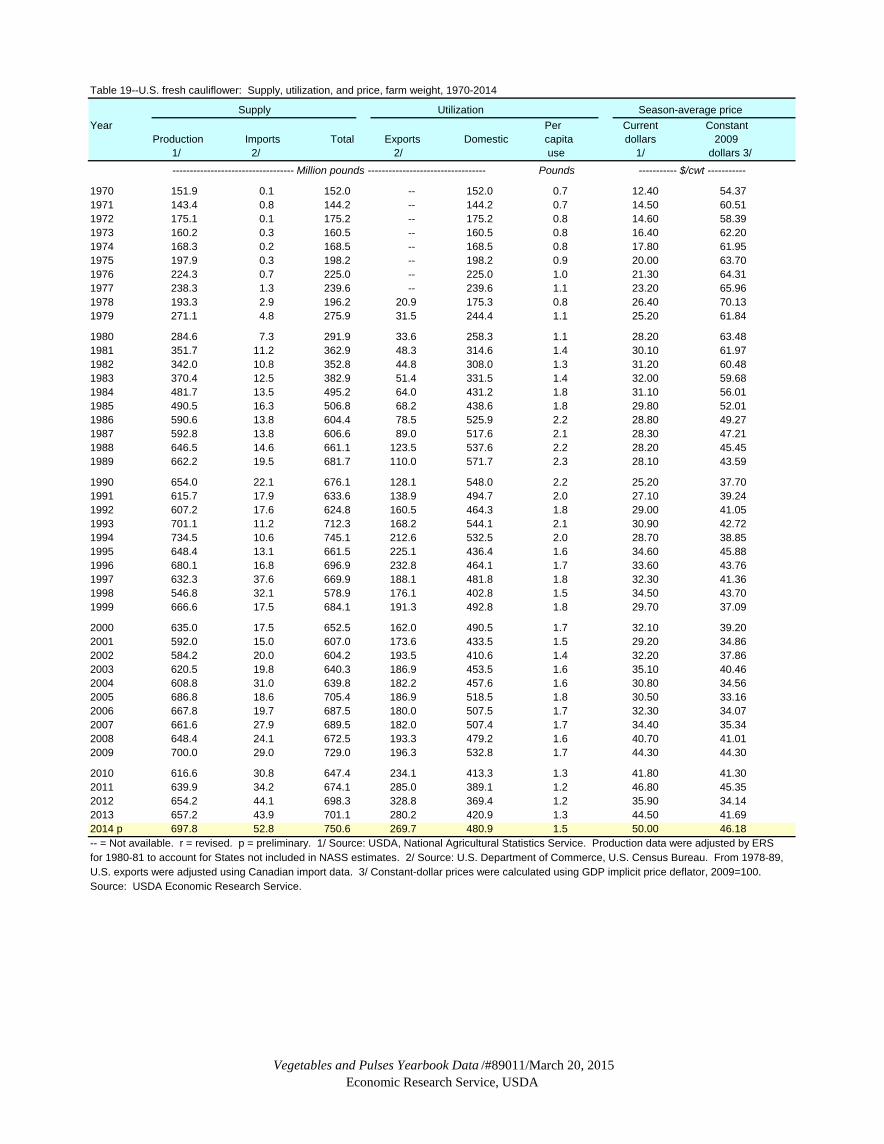
Vegetables and Pulses Yearbook Data /#89011/March 20, 2015Economic Research Service, USDA
Table 19--U.S. fresh cauliflower: Supply, utilization, and price, farm weight, 1970-2014
Supply Utilization Season-average priceYear Per Current Constant
Production Imports Total Exports Domestic capita dollars 20091/ 2/ 2/ use 1/ dollars 3/
----------------------------------- Million pounds ---------------------------------- Pounds ----------- $/cwt -----------
1970 151.9 0.1 152.0 -- 152.0 0.7 12.40 54.371971 143.4 0.8 144.2 -- 144.2 0.7 14.50 60.511972 175.1 0.1 175.2 -- 175.2 0.8 14.60 58.391973 160.2 0.3 160.5 -- 160.5 0.8 16.40 62.201974 168.3 0.2 168.5 -- 168.5 0.8 17.80 61.951975 197.9 0.3 198.2 -- 198.2 0.9 20.00 63.701976 224.3 0.7 225.0 -- 225.0 1.0 21.30 64.311977 238.3 1.3 239.6 -- 239.6 1.1 23.20 65.961978 193.3 2.9 196.2 20.9 175.3 0.8 26.40 70.131979 271.1 4.8 275.9 31.5 244.4 1.1 25.20 61.84
1980 284.6 7.3 291.9 33.6 258.3 1.1 28.20 63.481981 351.7 11.2 362.9 48.3 314.6 1.4 30.10 61.971982 342.0 10.8 352.8 44.8 308.0 1.3 31.20 60.481983 370.4 12.5 382.9 51.4 331.5 1.4 32.00 59.681984 481.7 13.5 495.2 64.0 431.2 1.8 31.10 56.011985 490.5 16.3 506.8 68.2 438.6 1.8 29.80 52.011986 590.6 13.8 604.4 78.5 525.9 2.2 28.80 49.271987 592.8 13.8 606.6 89.0 517.6 2.1 28.30 47.211988 646.5 14.6 661.1 123.5 537.6 2.2 28.20 45.451989 662.2 19.5 681.7 110.0 571.7 2.3 28.10 43.59
1990 654.0 22.1 676.1 128.1 548.0 2.2 25.20 37.701991 615.7 17.9 633.6 138.9 494.7 2.0 27.10 39.241992 607.2 17.6 624.8 160.5 464.3 1.8 29.00 41.051993 701.1 11.2 712.3 168.2 544.1 2.1 30.90 42.721994 734.5 10.6 745.1 212.6 532.5 2.0 28.70 38.851995 648.4 13.1 661.5 225.1 436.4 1.6 34.60 45.881996 680.1 16.8 696.9 232.8 464.1 1.7 33.60 43.761997 632.3 37.6 669.9 188.1 481.8 1.8 32.30 41.361998 546.8 32.1 578.9 176.1 402.8 1.5 34.50 43.701999 666.6 17.5 684.1 191.3 492.8 1.8 29.70 37.09
2000 635.0 17.5 652.5 162.0 490.5 1.7 32.10 39.202001 592.0 15.0 607.0 173.6 433.5 1.5 29.20 34.862002 584.2 20.0 604.2 193.5 410.6 1.4 32.20 37.862003 620.5 19.8 640.3 186.9 453.5 1.6 35.10 40.462004 608.8 31.0 639.8 182.2 457.6 1.6 30.80 34.562005 686.8 18.6 705.4 186.9 518.5 1.8 30.50 33.162006 667.8 19.7 687.5 180.0 507.5 1.7 32.30 34.072007 661.6 27.9 689.5 182.0 507.4 1.7 34.40 35.342008 648.4 24.1 672.5 193.3 479.2 1.6 40.70 41.012009 700.0 29.0 729.0 196.3 532.8 1.7 44.30 44.30
2010 616.6 30.8 647.4 234.1 413.3 1.3 41.80 41.302011 639.9 34.2 674.1 285.0 389.1 1.2 46.80 45.352012 654.2 44.1 698.3 328.8 369.4 1.2 35.90 34.142013 657.2 43.9 701.1 280.2 420.9 1.3 44.50 41.692014 p 697.8 52.8 750.6 269.7 480.9 1.5 50.00 46.18-- = Not available. r = revised. p = preliminary. 1/ Source: USDA, National Agricultural Statistics Service. Production data were adjusted by ERS for 1980-81 to account for States not included in NASS estimates. 2/ Source: U.S. Department of Commerce, U.S. Census Bureau. From 1978-89, U.S. exports were adjusted using Canadian import data. 3/ Constant-dollar prices were calculated using GDP implicit price deflator, 2009=100. Source: USDA Economic Research Service.
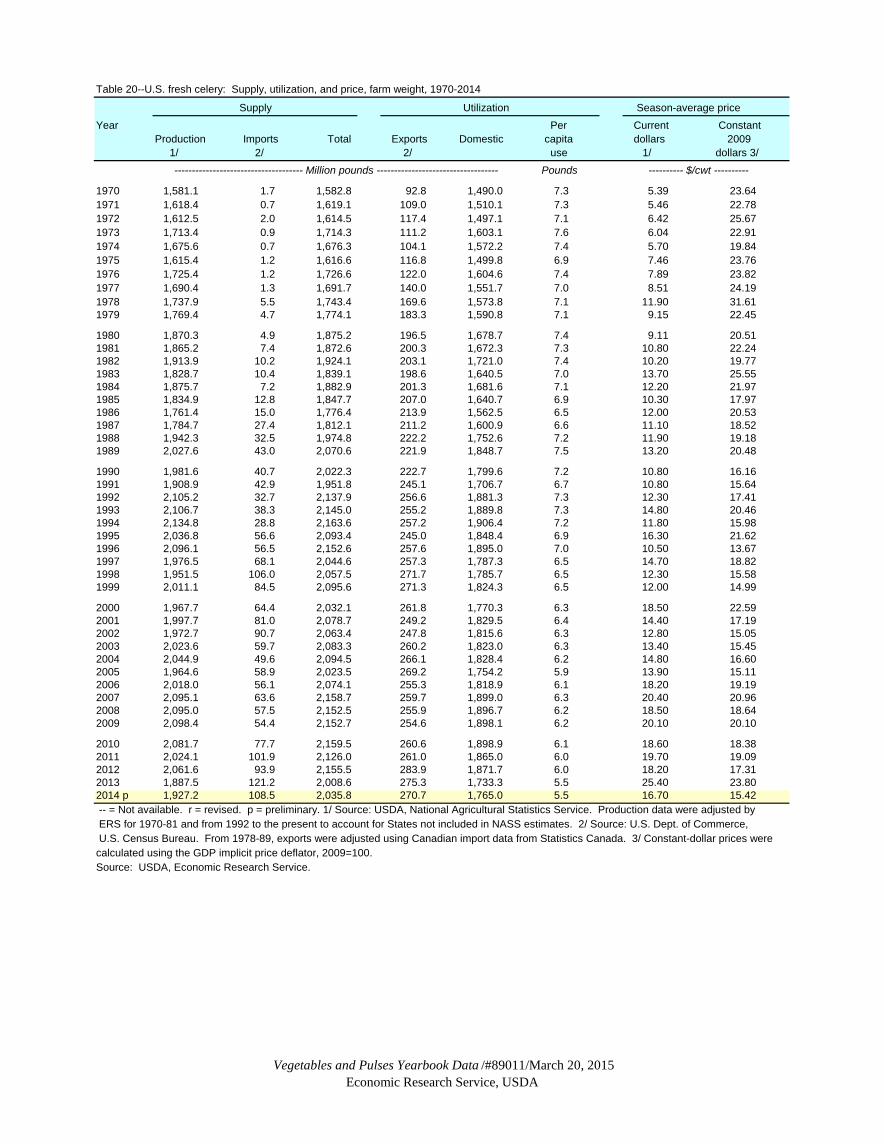
Vegetables and Pulses Yearbook Data /#89011/March 20, 2015Economic Research Service, USDA
Table 20--U.S. fresh celery: Supply, utilization, and price, farm weight, 1970-2014
Supply Utilization Season-average priceYear Per Current Constant
Production Imports Total Exports Domestic capita dollars 2009 1/ 2/ 2/ use 1/ dollars 3/
------------------------------------- Million pounds ----------------------------------- Pounds ---------- $/cwt ----------
1970 1,581.1 1.7 1,582.8 92.8 1,490.0 7.3 5.39 23.641971 1,618.4 0.7 1,619.1 109.0 1,510.1 7.3 5.46 22.781972 1,612.5 2.0 1,614.5 117.4 1,497.1 7.1 6.42 25.671973 1,713.4 0.9 1,714.3 111.2 1,603.1 7.6 6.04 22.911974 1,675.6 0.7 1,676.3 104.1 1,572.2 7.4 5.70 19.841975 1,615.4 1.2 1,616.6 116.8 1,499.8 6.9 7.46 23.761976 1,725.4 1.2 1,726.6 122.0 1,604.6 7.4 7.89 23.821977 1,690.4 1.3 1,691.7 140.0 1,551.7 7.0 8.51 24.191978 1,737.9 5.5 1,743.4 169.6 1,573.8 7.1 11.90 31.611979 1,769.4 4.7 1,774.1 183.3 1,590.8 7.1 9.15 22.45
1980 1,870.3 4.9 1,875.2 196.5 1,678.7 7.4 9.11 20.511981 1,865.2 7.4 1,872.6 200.3 1,672.3 7.3 10.80 22.241982 1,913.9 10.2 1,924.1 203.1 1,721.0 7.4 10.20 19.771983 1,828.7 10.4 1,839.1 198.6 1,640.5 7.0 13.70 25.551984 1,875.7 7.2 1,882.9 201.3 1,681.6 7.1 12.20 21.971985 1,834.9 12.8 1,847.7 207.0 1,640.7 6.9 10.30 17.971986 1,761.4 15.0 1,776.4 213.9 1,562.5 6.5 12.00 20.531987 1,784.7 27.4 1,812.1 211.2 1,600.9 6.6 11.10 18.521988 1,942.3 32.5 1,974.8 222.2 1,752.6 7.2 11.90 19.181989 2,027.6 43.0 2,070.6 221.9 1,848.7 7.5 13.20 20.48
1990 1,981.6 40.7 2,022.3 222.7 1,799.6 7.2 10.80 16.161991 1,908.9 42.9 1,951.8 245.1 1,706.7 6.7 10.80 15.641992 2,105.2 32.7 2,137.9 256.6 1,881.3 7.3 12.30 17.411993 2,106.7 38.3 2,145.0 255.2 1,889.8 7.3 14.80 20.461994 2,134.8 28.8 2,163.6 257.2 1,906.4 7.2 11.80 15.981995 2,036.8 56.6 2,093.4 245.0 1,848.4 6.9 16.30 21.621996 2,096.1 56.5 2,152.6 257.6 1,895.0 7.0 10.50 13.671997 1,976.5 68.1 2,044.6 257.3 1,787.3 6.5 14.70 18.821998 1,951.5 106.0 2,057.5 271.7 1,785.7 6.5 12.30 15.581999 2,011.1 84.5 2,095.6 271.3 1,824.3 6.5 12.00 14.99
2000 1,967.7 64.4 2,032.1 261.8 1,770.3 6.3 18.50 22.59 2001 1,997.7 81.0 2,078.7 249.2 1,829.5 6.4 14.40 17.192002 1,972.7 90.7 2,063.4 247.8 1,815.6 6.3 12.80 15.052003 2,023.6 59.7 2,083.3 260.2 1,823.0 6.3 13.40 15.452004 2,044.9 49.6 2,094.5 266.1 1,828.4 6.2 14.80 16.602005 1,964.6 58.9 2,023.5 269.2 1,754.2 5.9 13.90 15.112006 2,018.0 56.1 2,074.1 255.3 1,818.9 6.1 18.20 19.192007 2,095.1 63.6 2,158.7 259.7 1,899.0 6.3 20.40 20.962008 2,095.0 57.5 2,152.5 255.9 1,896.7 6.2 18.50 18.642009 2,098.4 54.4 2,152.7 254.6 1,898.1 6.2 20.10 20.10
2010 2,081.7 77.7 2,159.5 260.6 1,898.9 6.1 18.60 18.382011 2,024.1 101.9 2,126.0 261.0 1,865.0 6.0 19.70 19.092012 2,061.6 93.9 2,155.5 283.9 1,871.7 6.0 18.20 17.312013 1,887.5 121.2 2,008.6 275.3 1,733.3 5.5 25.40 23.802014 p 1,927.2 108.5 2,035.8 270.7 1,765.0 5.5 16.70 15.42 -- = Not available. r = revised. p = preliminary. 1/ Source: USDA, National Agricultural Statistics Service. Production data were adjusted by ERS for 1970-81 and from 1992 to the present to account for States not included in NASS estimates. 2/ Source: U.S. Dept. of Commerce, U.S. Census Bureau. From 1978-89, exports were adjusted using Canadian import data from Statistics Canada. 3/ Constant-dollar prices were calculated using the GDP implicit price deflator, 2009=100. Source: USDA, Economic Research Service.
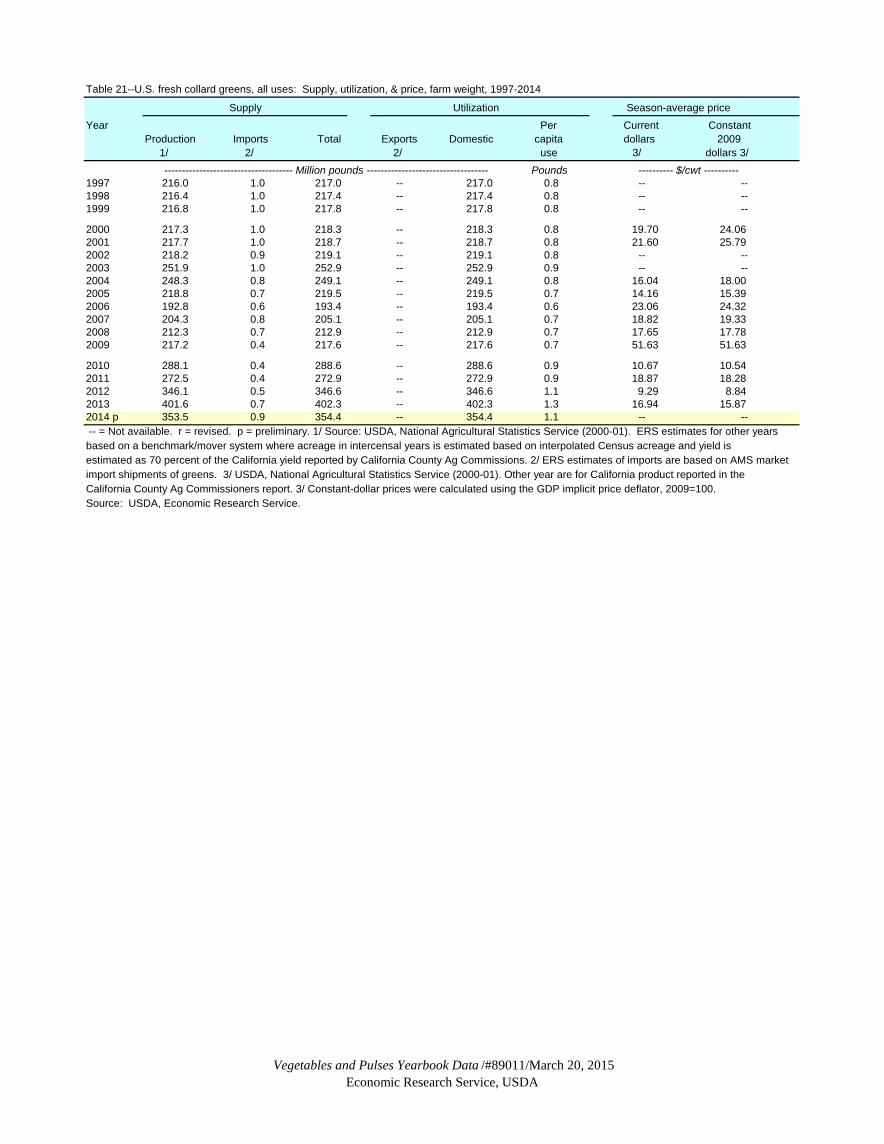
Vegetables and Pulses Yearbook Data /#89011/March 20, 2015Economic Research Service, USDA
Table 21--U.S. fresh collard greens, all uses: Supply, utilization, & price, farm weight, 1997-2014
Supply Utilization Season-average priceYear Per Current Constant
Production Imports Total Exports Domestic capita dollars 2009 1/ 2/ 2/ use 3/ dollars 3/
------------------------------------- Million pounds ----------------------------------- Pounds ---------- $/cwt ----------1997 216.0 1.0 217.0 -- 217.0 0.8 -- --1998 216.4 1.0 217.4 -- 217.4 0.8 -- --1999 216.8 1.0 217.8 -- 217.8 0.8 -- --
2000 217.3 1.0 218.3 -- 218.3 0.8 19.70 24.06 2001 217.7 1.0 218.7 -- 218.7 0.8 21.60 25.792002 218.2 0.9 219.1 -- 219.1 0.8 -- --2003 251.9 1.0 252.9 -- 252.9 0.9 -- --2004 248.3 0.8 249.1 -- 249.1 0.8 16.04 18.002005 218.8 0.7 219.5 -- 219.5 0.7 14.16 15.392006 192.8 0.6 193.4 -- 193.4 0.6 23.06 24.322007 204.3 0.8 205.1 -- 205.1 0.7 18.82 19.332008 212.3 0.7 212.9 -- 212.9 0.7 17.65 17.782009 217.2 0.4 217.6 -- 217.6 0.7 51.63 51.63
2010 288.1 0.4 288.6 -- 288.6 0.9 10.67 10.542011 272.5 0.4 272.9 -- 272.9 0.9 18.87 18.282012 346.1 0.5 346.6 -- 346.6 1.1 9.29 8.842013 401.6 0.7 402.3 -- 402.3 1.3 16.94 15.872014 p 353.5 0.9 354.4 -- 354.4 1.1 -- -- -- = Not available. r = revised. p = preliminary. 1/ Source: USDA, National Agricultural Statistics Service (2000-01). ERS estimates for other years based on a benchmark/mover system where acreage in intercensal years is estimated based on interpolated Census acreage and yield isestimated as 70 percent of the California yield reported by California County Ag Commissions. 2/ ERS estimates of imports are based on AMS market import shipments of greens. 3/ USDA, National Agricultural Statistics Service (2000-01). Other year are for California product reported in theCalifornia County Ag Commissioners report. 3/ Constant-dollar prices were calculated using the GDP implicit price deflator, 2009=100. Source: USDA, Economic Research Service.

Vegetables and Pulses Yearbook Data /#89011/March 20, 2015Economic Research Service, USDA
Table 22--U.S. fresh cucumbers: Supply, utilization, & price, farm weight, 1970-2014Supply Utilization Season-average price
Per Current ConstantYear Production Imports Total Exports Domestic capita dollars 2009
1/ 2/ 2/ use 1/ dollars 3/
------------------------------------- Million pounds ----------------------------------- Pounds ---------- $/cwt ----------
1970 447.8 143.3 591.1 13.2 577.9 2.8 6.42 28.151971 432.6 157.4 590.0 11.6 578.4 2.8 7.57 31.591972 470.2 169.5 639.7 16.9 622.8 3.0 8.14 32.551973 420.6 177.6 598.2 16.5 581.7 2.7 9.34 35.421974 467.6 182.2 649.8 17.5 632.3 3.0 10.40 36.191975 496.9 131.1 628.0 22.2 605.8 2.8 10.50 33.441976 510.9 213.9 724.8 52.6 672.2 3.1 9.67 29.201977 564.7 251.0 815.7 45.9 769.8 3.5 10.00 28.431978 593.1 305.0 898.1 50.7 847.4 3.8 12.10 32.141979 592.1 320.0 912.1 49.3 862.8 3.8 14.70 36.07
1980 614.3 316.2 930.5 51.0 879.5 3.9 13.70 30.841981 603.7 374.6 978.3 58.5 919.8 4.0 15.20 31.291982 722.2 304.6 1,026.8 54.9 971.9 4.2 12.70 24.621983 728.6 390.6 1,119.2 56.2 1,063.0 4.5 14.05 26.201984 766.1 388.3 1,154.4 54.7 1,099.7 4.7 13.45 24.221985 723.2 380.5 1,103.7 55.9 1,047.8 4.4 12.75 22.251986 745.7 429.1 1,174.8 61.8 1,113.0 4.6 12.75 21.811987 813.3 476.0 1,289.3 59.1 1,230.2 5.1 15.60 26.021988 834.9 428.6 1,263.5 81.4 1,182.1 4.8 15.75 25.381989 805.2 452.8 1,258.0 74.8 1,183.2 4.8 17.00 26.37
1990 857.6 394.6 1,252.2 83.0 1,169.2 4.7 15.80 23.641991 854.1 382.9 1,237.0 81.6 1,155.4 4.6 19.75 28.591992 915.6 432.5 1,348.1 82.1 1,265.9 4.9 19.10 27.041993 933.5 502.3 1,435.8 79.4 1,356.4 5.2 18.10 25.031994 941.5 549.1 1,490.6 77.9 1,412.7 5.4 16.00 21.661995 1000.2 572.0 1,572.2 77.1 1,495.1 5.6 16.50 21.881996 983.6 686.3 1,669.9 70.7 1,599.2 5.9 19.00 24.751997 1157.1 667.5 1,824.6 71.8 1,752.9 6.4 17.70 22.661998 1119.7 723.3 1,843.0 50.9 1,792.1 6.5 20.00 25.331999 1182.6 749.6 1,932.2 52.8 1,879.4 6.7 18.20 22.73
2000 1087.3 763.4 1,850.7 57.1 1,793.5 6.4 19.90 24.302001 1039.2 811.5 1,850.7 62.5 1,788.2 6.3 19.80 23.642002 1093.9 868.7 1,962.6 54.4 1,908.2 6.6 19.00 22.342003 938.1 900.3 1,838.4 47.6 1,790.8 6.2 19.90 22.942004 1000.5 933.4 1,933.9 47.0 1,886.9 6.4 20.20 22.662005 926.5 955.1 1,881.6 47.1 1,834.4 6.2 23.10 25.112006 907.9 974.3 1,882.2 46.3 1,836.0 6.1 25.30 26.682007 970.0 1012.2 1,982.2 42.4 1,939.8 6.4 24.60 25.272008 884.3 1097.9 1,982.2 35.3 1,947.0 6.4 24.80 24.992009 935.9 1188.8 2,124.7 33.0 2,091.7 6.8 25.60 25.60
2010 835.1 1291.0 2,126.1 41.1 2,085.0 6.7 22.90 22.632011 719.4 1310.0 2,029.4 38.4 1,991.0 6.4 26.70 25.872012 818.2 1453.8 2,272.0 33.9 2,238.1 7.1 25.00 23.772013 760.3 1587.7 2,348.0 31.4 2,316.6 7.3 26.80 25.112014 p 689.5 1703.9 2,393.4 32.3 2,361.1 7.4 24.40 22.54 -- = Not available. r = revised. p = preliminary. 1/ Source: UDSA, National Agricultural Statistics Service. From 1982-91, U.S. production was estimated by ERS based on available State reports. 2/ Source: U.S. Department of Commerce, U.S. Census Bureau. From 1978-89, U.S. exports were adjusted using Canadian import data. 3/ Constant-dollar prices were calculated using the GDP implict price deflator, 2009=100. Source: USDA Economic Research Service.
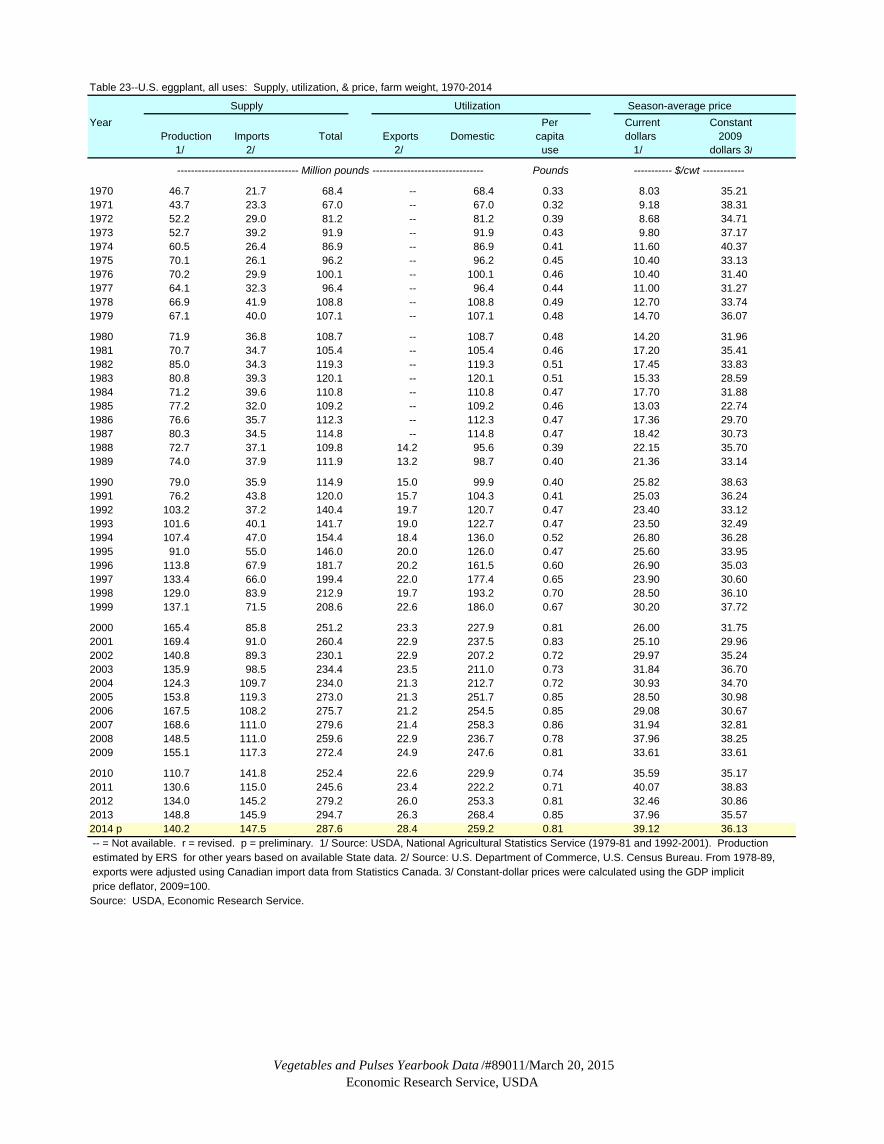
Vegetables and Pulses Yearbook Data /#89011/March 20, 2015Economic Research Service, USDA
Table 23--U.S. eggplant, all uses: Supply, utilization, & price, farm weight, 1970-2014
Supply Utilization Season-average priceYear Per Current Constant
Production Imports Total Exports Domestic capita dollars 2009 1/ 2/ 2/ use 1/ dollars 3/
----------------------------------- Million pounds -------------------------------- Pounds ----------- $/cwt ------------
1970 46.7 21.7 68.4 -- 68.4 0.33 8.03 35.211971 43.7 23.3 67.0 -- 67.0 0.32 9.18 38.311972 52.2 29.0 81.2 -- 81.2 0.39 8.68 34.711973 52.7 39.2 91.9 -- 91.9 0.43 9.80 37.171974 60.5 26.4 86.9 -- 86.9 0.41 11.60 40.371975 70.1 26.1 96.2 -- 96.2 0.45 10.40 33.131976 70.2 29.9 100.1 -- 100.1 0.46 10.40 31.401977 64.1 32.3 96.4 -- 96.4 0.44 11.00 31.271978 66.9 41.9 108.8 -- 108.8 0.49 12.70 33.741979 67.1 40.0 107.1 -- 107.1 0.48 14.70 36.07
1980 71.9 36.8 108.7 -- 108.7 0.48 14.20 31.961981 70.7 34.7 105.4 -- 105.4 0.46 17.20 35.411982 85.0 34.3 119.3 -- 119.3 0.51 17.45 33.831983 80.8 39.3 120.1 -- 120.1 0.51 15.33 28.591984 71.2 39.6 110.8 -- 110.8 0.47 17.70 31.881985 77.2 32.0 109.2 -- 109.2 0.46 13.03 22.741986 76.6 35.7 112.3 -- 112.3 0.47 17.36 29.701987 80.3 34.5 114.8 -- 114.8 0.47 18.42 30.731988 72.7 37.1 109.8 14.2 95.6 0.39 22.15 35.701989 74.0 37.9 111.9 13.2 98.7 0.40 21.36 33.14
1990 79.0 35.9 114.9 15.0 99.9 0.40 25.82 38.631991 76.2 43.8 120.0 15.7 104.3 0.41 25.03 36.241992 103.2 37.2 140.4 19.7 120.7 0.47 23.40 33.121993 101.6 40.1 141.7 19.0 122.7 0.47 23.50 32.491994 107.4 47.0 154.4 18.4 136.0 0.52 26.80 36.281995 91.0 55.0 146.0 20.0 126.0 0.47 25.60 33.951996 113.8 67.9 181.7 20.2 161.5 0.60 26.90 35.031997 133.4 66.0 199.4 22.0 177.4 0.65 23.90 30.601998 129.0 83.9 212.9 19.7 193.2 0.70 28.50 36.101999 137.1 71.5 208.6 22.6 186.0 0.67 30.20 37.72
2000 165.4 85.8 251.2 23.3 227.9 0.81 26.00 31.75 2001 169.4 91.0 260.4 22.9 237.5 0.83 25.10 29.962002 140.8 89.3 230.1 22.9 207.2 0.72 29.97 35.242003 135.9 98.5 234.4 23.5 211.0 0.73 31.84 36.702004 124.3 109.7 234.0 21.3 212.7 0.72 30.93 34.702005 153.8 119.3 273.0 21.3 251.7 0.85 28.50 30.982006 167.5 108.2 275.7 21.2 254.5 0.85 29.08 30.672007 168.6 111.0 279.6 21.4 258.3 0.86 31.94 32.812008 148.5 111.0 259.6 22.9 236.7 0.78 37.96 38.252009 155.1 117.3 272.4 24.9 247.6 0.81 33.61 33.61
2010 110.7 141.8 252.4 22.6 229.9 0.74 35.59 35.172011 130.6 115.0 245.6 23.4 222.2 0.71 40.07 38.832012 134.0 145.2 279.2 26.0 253.3 0.81 32.46 30.862013 148.8 145.9 294.7 26.3 268.4 0.85 37.96 35.572014 p 140.2 147.5 287.6 28.4 259.2 0.81 39.12 36.13 -- = Not available. r = revised. p = preliminary. 1/ Source: USDA, National Agricultural Statistics Service (1979-81 and 1992-2001). Production estimated by ERS for other years based on available State data. 2/ Source: U.S. Department of Commerce, U.S. Census Bureau. From 1978-89, exports were adjusted using Canadian import data from Statistics Canada. 3/ Constant-dollar prices were calculated using the GDP implicit price deflator, 2009=100.Source: USDA, Economic Research Service.

Vegetables and Pulses Yearbook Data /#89011/March 20, 2015Economic Research Service, USDA
Table 24--U.S. escarole & endive, all uses: Supply, utilization, & price, farm weight, 1970-2014
Supply Utilization Season-average priceYear Per Current Constant
Production Imports Total Exports Domestic capita dollars 2009 1/ 2/ 2/ use 3/ dollars 4/
----------------------------------- Million pounds -------------------------------- Pounds ----------- $/cwt ------------
1970 112.0 2.1 114.1 -- 114.1 0.56 6.48 28.411971 115.5 1.9 117.4 -- 117.4 0.57 9.10 37.971972 118.0 1.8 119.8 -- 119.8 0.57 7.99 31.951973 119.9 2.3 122.2 -- 122.2 0.58 11.60 44.001974 112.3 1.9 114.2 -- 114.2 0.53 10.80 37.591975 109.2 1.6 110.8 -- 110.8 0.51 12.10 38.541976 111.0 1.8 112.8 -- 112.8 0.52 13.90 41.971977 102.5 1.4 103.9 -- 103.9 0.47 15.90 45.211978 104.7 2.0 106.7 -- 106.7 0.48 20.80 55.261979 108.7 2.2 110.9 -- 110.9 0.49 18.40 45.15
1980 100.3 2.5 102.8 -- 102.8 0.45 16.60 37.371981 99.8 2.1 101.9 -- 101.9 0.44 17.20 35.411982 84.3 3.3 87.6 -- 87.6 0.38 26.60 51.561983 88.3 4.2 92.5 -- 92.5 0.39 20.68 38.571984 85.9 5.6 91.5 -- 91.5 0.39 19.68 35.441985 86.6 6.2 92.8 -- 92.8 0.39 19.32 33.721986 80.9 7.2 88.1 -- 88.1 0.37 21.68 37.091987 75.5 7.4 82.9 -- 82.9 0.34 19.84 33.091988 77.5 10.1 87.6 -- 87.6 0.36 19.60 31.591989 70.2 6.6 76.8 0.1 76.7 0.31 16.40 25.44
1990 57.6 5.5 63.1 0.7 62.3 0.25 18.80 28.121991 54.5 6.5 61.0 0.7 60.3 0.24 25.76 37.301992 70.6 7.9 78.5 0.7 77.8 0.30 20.80 29.441993 67.4 4.4 71.8 0.7 71.1 0.27 24.90 34.431994 75.3 5.1 80.4 1.0 79.4 0.30 26.20 35.471995 70.9 5.7 76.6 1.1 75.5 0.28 27.50 36.471996 80.0 3.7 83.7 1.3 82.4 0.31 21.90 28.521997 78.0 4.4 82.4 3.0 79.4 0.29 23.80 30.481998 74.0 7.2 81.2 1.0 80.1 0.29 31.30 39.651999 56.9 5.1 62.0 0.7 61.3 0.22 26.90 33.60
2000 93.6 5.5 99.1 1.0 98.1 0.35 30.90 37.73 2001 93.3 6.0 99.3 0.4 98.8 0.35 29.50 35.222002 87.4 5.2 92.6 0.9 91.7 0.32 22.53 26.492003 89.8 5.2 95.0 0.9 94.0 0.32 25.16 29.002004 85.5 5.8 91.3 0.5 90.8 0.31 23.56 26.432005 70.1 5.3 75.4 0.5 74.9 0.25 32.12 34.912006 87.7 4.7 92.4 0.5 91.9 0.31 24.79 26.142007 73.2 4.7 77.9 0.1 77.8 0.26 27.31 28.052008 63.1 4.3 67.5 0.2 67.3 0.22 63.15 63.632009 53.5 4.3 57.8 0.3 57.5 0.19 41.65 41.65
2010 50.0 3.9 53.9 0.7 53.2 0.17 47.23 46.662011 80.4 3.9 84.3 0.8 83.5 0.27 26.16 25.352012 74.9 4.7 79.6 0.9 78.8 0.25 24.38 23.182013 56.0 6.0 62.0 0.4 61.6 0.19 34.14 31.982014 p 48.2 5.8 53.9 0.5 53.4 0.17 -- -- -- = Not available. r = revised. p = preliminary. 1/ Source: USDA, National Agricultural Statistics Service (1979-81 and 1992-2001). Estimated byERS 1982-91 and 2002-05 based on available State data. After 2005, ERS estimates based on census area and California yields 2/ Source is U.S. Census Bureau, U.S. Department of Commerce. Includes whitloof chicory. 3/ Prices for 1982-91 and 2002 are for Florida escarole only. Prices after 2001 are California only. 4/ Constant-dollar prices were calculated using the GDP implicit price deflator, 2009=100.Source: USDA, Economic Research Service.
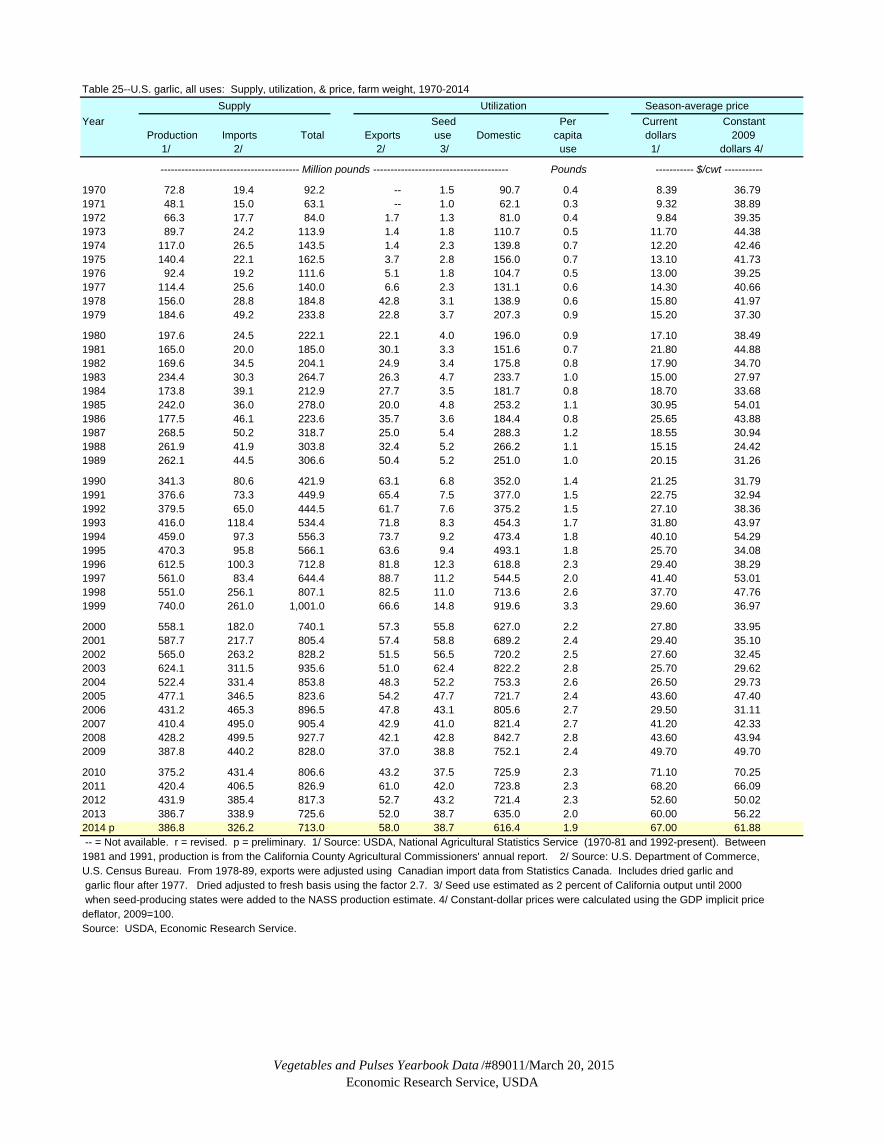
Vegetables and Pulses Yearbook Data /#89011/March 20, 2015Economic Research Service, USDA
Table 25--U.S. garlic, all uses: Supply, utilization, & price, farm weight, 1970-2014Supply Utilization Season-average price
Year Seed Per Current Constant Production Imports Total Exports use Domestic capita dollars 2009 1/ 2/ 2/ 3/ use 1/ dollars 4/
---------------------------------------- Million pounds --------------------------------------- Pounds
1970 72.8 19.4 92.2 -- 1.5 90.7 0.4 8.39 36.791971 48.1 15.0 63.1 -- 1.0 62.1 0.3 9.32 38.891972 66.3 17.7 84.0 1.7 1.3 81.0 0.4 9.84 39.351973 89.7 24.2 113.9 1.4 1.8 110.7 0.5 11.70 44.381974 117.0 26.5 143.5 1.4 2.3 139.8 0.7 12.20 42.461975 140.4 22.1 162.5 3.7 2.8 156.0 0.7 13.10 41.731976 92.4 19.2 111.6 5.1 1.8 104.7 0.5 13.00 39.251977 114.4 25.6 140.0 6.6 2.3 131.1 0.6 14.30 40.661978 156.0 28.8 184.8 42.8 3.1 138.9 0.6 15.80 41.971979 184.6 49.2 233.8 22.8 3.7 207.3 0.9 15.20 37.30
1980 197.6 24.5 222.1 22.1 4.0 196.0 0.9 17.10 38.491981 165.0 20.0 185.0 30.1 3.3 151.6 0.7 21.80 44.881982 169.6 34.5 204.1 24.9 3.4 175.8 0.8 17.90 34.701983 234.4 30.3 264.7 26.3 4.7 233.7 1.0 15.00 27.971984 173.8 39.1 212.9 27.7 3.5 181.7 0.8 18.70 33.681985 242.0 36.0 278.0 20.0 4.8 253.2 1.1 30.95 54.011986 177.5 46.1 223.6 35.7 3.6 184.4 0.8 25.65 43.881987 268.5 50.2 318.7 25.0 5.4 288.3 1.2 18.55 30.941988 261.9 41.9 303.8 32.4 5.2 266.2 1.1 15.15 24.421989 262.1 44.5 306.6 50.4 5.2 251.0 1.0 20.15 31.26
1990 341.3 80.6 421.9 63.1 6.8 352.0 1.4 21.25 31.791991 376.6 73.3 449.9 65.4 7.5 377.0 1.5 22.75 32.941992 379.5 65.0 444.5 61.7 7.6 375.2 1.5 27.10 38.361993 416.0 118.4 534.4 71.8 8.3 454.3 1.7 31.80 43.971994 459.0 97.3 556.3 73.7 9.2 473.4 1.8 40.10 54.291995 470.3 95.8 566.1 63.6 9.4 493.1 1.8 25.70 34.081996 612.5 100.3 712.8 81.8 12.3 618.8 2.3 29.40 38.291997 561.0 83.4 644.4 88.7 11.2 544.5 2.0 41.40 53.011998 551.0 256.1 807.1 82.5 11.0 713.6 2.6 37.70 47.761999 740.0 261.0 1,001.0 66.6 14.8 919.6 3.3 29.60 36.97
2000 558.1 182.0 740.1 57.3 55.8 627.0 2.2 27.80 33.95 2001 587.7 217.7 805.4 57.4 58.8 689.2 2.4 29.40 35.102002 565.0 263.2 828.2 51.5 56.5 720.2 2.5 27.60 32.452003 624.1 311.5 935.6 51.0 62.4 822.2 2.8 25.70 29.622004 522.4 331.4 853.8 48.3 52.2 753.3 2.6 26.50 29.732005 477.1 346.5 823.6 54.2 47.7 721.7 2.4 43.60 47.402006 431.2 465.3 896.5 47.8 43.1 805.6 2.7 29.50 31.112007 410.4 495.0 905.4 42.9 41.0 821.4 2.7 41.20 42.332008 428.2 499.5 927.7 42.1 42.8 842.7 2.8 43.60 43.942009 387.8 440.2 828.0 37.0 38.8 752.1 2.4 49.70 49.70
2010 375.2 431.4 806.6 43.2 37.5 725.9 2.3 71.10 70.252011 420.4 406.5 826.9 61.0 42.0 723.8 2.3 68.20 66.092012 431.9 385.4 817.3 52.7 43.2 721.4 2.3 52.60 50.022013 386.7 338.9 725.6 52.0 38.7 635.0 2.0 60.00 56.222014 p 386.8 326.2 713.0 58.0 38.7 616.4 1.9 67.00 61.88 -- = Not available. r = revised. p = preliminary. 1/ Source: USDA, National Agricultural Statistics Service (1970-81 and 1992-present). Between1981 and 1991, production is from the California County Agricultural Commissioners' annual report. 2/ Source: U.S. Department of Commerce,U.S. Census Bureau. From 1978-89, exports were adjusted using Canadian import data from Statistics Canada. Includes dried garlic and garlic flour after 1977. Dried adjusted to fresh basis using the factor 2.7. 3/ Seed use estimated as 2 percent of California output until 2000 when seed-producing states were added to the NASS production estimate. 4/ Constant-dollar prices were calculated using the GDP implicit price deflator, 2009=100. Source: USDA, Economic Research Service.
----------- $/cwt -----------
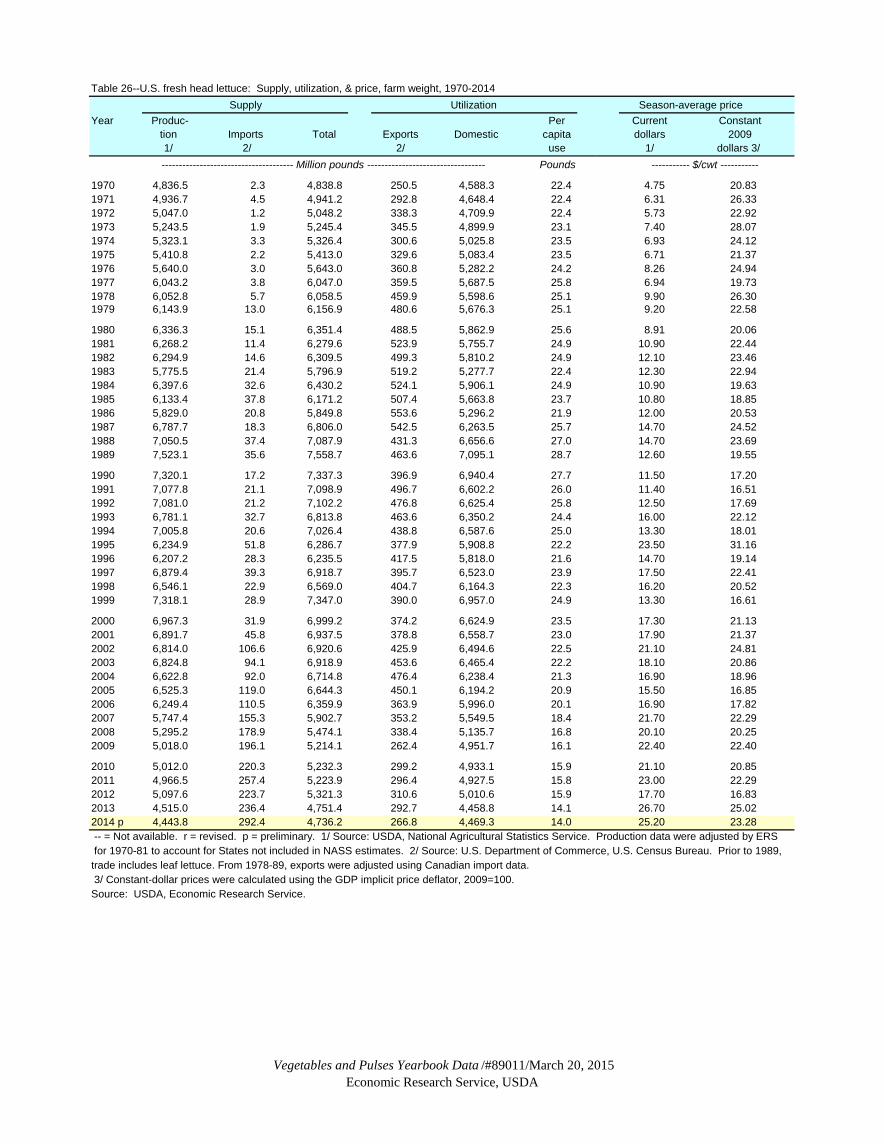
Vegetables and Pulses Yearbook Data /#89011/March 20, 2015Economic Research Service, USDA
Table 26--U.S. fresh head lettuce: Supply, utilization, & price, farm weight, 1970-2014Supply Utilization Season-average price
Year Produc- Per Current Constanttion Imports Total Exports Domestic capita dollars 20091/ 2/ 2/ use 1/ dollars 3/ -------------------------------------- Million pounds ---------------------------------- Pounds
1970 4,836.5 2.3 4,838.8 250.5 4,588.3 22.4 4.75 20.831971 4,936.7 4.5 4,941.2 292.8 4,648.4 22.4 6.31 26.331972 5,047.0 1.2 5,048.2 338.3 4,709.9 22.4 5.73 22.921973 5,243.5 1.9 5,245.4 345.5 4,899.9 23.1 7.40 28.071974 5,323.1 3.3 5,326.4 300.6 5,025.8 23.5 6.93 24.121975 5,410.8 2.2 5,413.0 329.6 5,083.4 23.5 6.71 21.371976 5,640.0 3.0 5,643.0 360.8 5,282.2 24.2 8.26 24.941977 6,043.2 3.8 6,047.0 359.5 5,687.5 25.8 6.94 19.731978 6,052.8 5.7 6,058.5 459.9 5,598.6 25.1 9.90 26.301979 6,143.9 13.0 6,156.9 480.6 5,676.3 25.1 9.20 22.58
1980 6,336.3 15.1 6,351.4 488.5 5,862.9 25.6 8.91 20.061981 6,268.2 11.4 6,279.6 523.9 5,755.7 24.9 10.90 22.441982 6,294.9 14.6 6,309.5 499.3 5,810.2 24.9 12.10 23.461983 5,775.5 21.4 5,796.9 519.2 5,277.7 22.4 12.30 22.941984 6,397.6 32.6 6,430.2 524.1 5,906.1 24.9 10.90 19.631985 6,133.4 37.8 6,171.2 507.4 5,663.8 23.7 10.80 18.851986 5,829.0 20.8 5,849.8 553.6 5,296.2 21.9 12.00 20.531987 6,787.7 18.3 6,806.0 542.5 6,263.5 25.7 14.70 24.521988 7,050.5 37.4 7,087.9 431.3 6,656.6 27.0 14.70 23.691989 7,523.1 35.6 7,558.7 463.6 7,095.1 28.7 12.60 19.55
1990 7,320.1 17.2 7,337.3 396.9 6,940.4 27.7 11.50 17.201991 7,077.8 21.1 7,098.9 496.7 6,602.2 26.0 11.40 16.511992 7,081.0 21.2 7,102.2 476.8 6,625.4 25.8 12.50 17.691993 6,781.1 32.7 6,813.8 463.6 6,350.2 24.4 16.00 22.121994 7,005.8 20.6 7,026.4 438.8 6,587.6 25.0 13.30 18.011995 6,234.9 51.8 6,286.7 377.9 5,908.8 22.2 23.50 31.161996 6,207.2 28.3 6,235.5 417.5 5,818.0 21.6 14.70 19.141997 6,879.4 39.3 6,918.7 395.7 6,523.0 23.9 17.50 22.411998 6,546.1 22.9 6,569.0 404.7 6,164.3 22.3 16.20 20.521999 7,318.1 28.9 7,347.0 390.0 6,957.0 24.9 13.30 16.61
2000 6,967.3 31.9 6,999.2 374.2 6,624.9 23.5 17.30 21.132001 6,891.7 45.8 6,937.5 378.8 6,558.7 23.0 17.90 21.372002 6,814.0 106.6 6,920.6 425.9 6,494.6 22.5 21.10 24.812003 6,824.8 94.1 6,918.9 453.6 6,465.4 22.2 18.10 20.862004 6,622.8 92.0 6,714.8 476.4 6,238.4 21.3 16.90 18.962005 6,525.3 119.0 6,644.3 450.1 6,194.2 20.9 15.50 16.852006 6,249.4 110.5 6,359.9 363.9 5,996.0 20.1 16.90 17.822007 5,747.4 155.3 5,902.7 353.2 5,549.5 18.4 21.70 22.292008 5,295.2 178.9 5,474.1 338.4 5,135.7 16.8 20.10 20.252009 5,018.0 196.1 5,214.1 262.4 4,951.7 16.1 22.40 22.40
2010 5,012.0 220.3 5,232.3 299.2 4,933.1 15.9 21.10 20.852011 4,966.5 257.4 5,223.9 296.4 4,927.5 15.8 23.00 22.292012 5,097.6 223.7 5,321.3 310.6 5,010.6 15.9 17.70 16.832013 4,515.0 236.4 4,751.4 292.7 4,458.8 14.1 26.70 25.022014 p 4,443.8 292.4 4,736.2 266.8 4,469.3 14.0 25.20 23.28 -- = Not available. r = revised. p = preliminary. 1/ Source: USDA, National Agricultural Statistics Service. Production data were adjusted by ERS for 1970-81 to account for States not included in NASS estimates. 2/ Source: U.S. Department of Commerce, U.S. Census Bureau. Prior to 1989, trade includes leaf lettuce. From 1978-89, exports were adjusted using Canadian import data. 3/ Constant-dollar prices were calculated using the GDP implicit price deflator, 2009=100.Source: USDA, Economic Research Service.
----------- $/cwt -----------

Vegetables and Pulses Yearbook Data /#89011/March 20, 2015Economic Research Service, USDA
Table 27--U.S. leaf and romaine lettuce: Supply, utilization, & price, farm weight, 1985-2014Supply Utilization Season-average price
Year Produc- Per Current Constanttion Imports Total Exports Domestic capita dollars 20091/ 2/ 2/ use 1/ 3/ dollars 4/
--------------------------------------- Million pounds ---------------------------------- Pounds
1985 778.7 -- 778.7 -- 778.7 3.3 -- --1986 571.2 -- 571.2 -- 571.2 2.4 -- --1987 613.0 -- 613.0 -- 613.0 2.5 -- --1988 784.2 -- 784.2 -- 784.2 3.2 -- --1989 915.8 23.5 939.3 57.9 881.4 3.6 -- --
1990 1,061.6 12.1 1,073.7 130.6 943.1 3.8 15.60 23.341991 1,157.5 8.3 1,165.8 152.7 1,013.1 4.0 15.00 21.721992 1,388.7 5.9 1,394.6 195.0 1,199.6 4.7 20.66 29.251993 1,535.5 6.8 1,542.3 230.2 1,312.1 5.0 25.35 35.051994 1,710.0 8.9 1,718.9 223.1 1,495.8 5.7 23.92 32.381995 1,787.4 11.7 1,799.1 227.9 1,571.2 5.9 30.10 39.921996 1,775.6 16.6 1,792.2 223.4 1,568.8 5.8 23.00 29.951997 2,024.5 28.6 2,053.1 253.3 1,799.8 6.6 24.21 31.001998 2,076.7 32.0 2,108.7 282.3 1,826.4 6.6 25.40 32.171999 2,393.1 28.4 2,421.5 301.2 2,120.3 7.6 20.57 25.68
2000 2,702.4 32.8 2,735.2 367.4 2,367.8 8.4 24.24 29.592001 2,646.1 34.6 2,680.7 390.4 2,290.2 8.0 22.85 27.272002 3,197.4 33.7 3,231.1 467.0 2,764.1 9.6 28.75 33.802003 3,547.3 33.1 3,580.4 433.6 3,146.8 10.8 28.97 33.392004 3,971.3 35.2 4,006.5 489.8 3,516.7 12.0 23.24 26.082005 3,297.3 51.9 3,349.2 486.3 2,862.9 9.7 25.45 27.662006 3,981.7 61.3 4,043.0 461.0 3,582.0 12.0 26.56 28.022007 3,864.9 74.4 3,939.3 453.4 3,485.9 11.5 26.63 27.362008 3,555.5 82.6 3,638.1 466.1 3,172.0 10.4 25.05 25.242009 3,420.0 95.6 3,515.6 442.5 3,073.1 10.0 31.33 31.33
2010 4,039.3 103.3 4,142.6 422.3 3,720.3 12.0 28.60 28.262011 4,008.1 115.4 4,123.5 463.7 3,659.9 11.7 32.43 31.422012 4,108.1 120.8 4,228.9 480.8 3,748.1 11.9 26.44 25.152013 3,927.0 169.7 4,096.7 482.8 3,613.9 11.4 34.73 32.542014 p 3,766.3 153.5 3,919.8 479.2 3,440.6 10.8 34.26 31.64 -- = Not available. r = revised. p = preliminary. 1/ Source: USDA, National Agricultural Statistics Service except production and price data for 1985-91 are for California only as reported by the California County Agricultural Commissioners. 2/ Source: U.S. Department of Commerce, U.S. Census Bureau. 3/ Leaf and romaine crop value divided by leaf and romaine production. 4/ Constant-dollar prices calculated using the GDP implicit price deflator, 2009=100.Source: USDA, Economic Research Service.
----------- $/cwt -----------
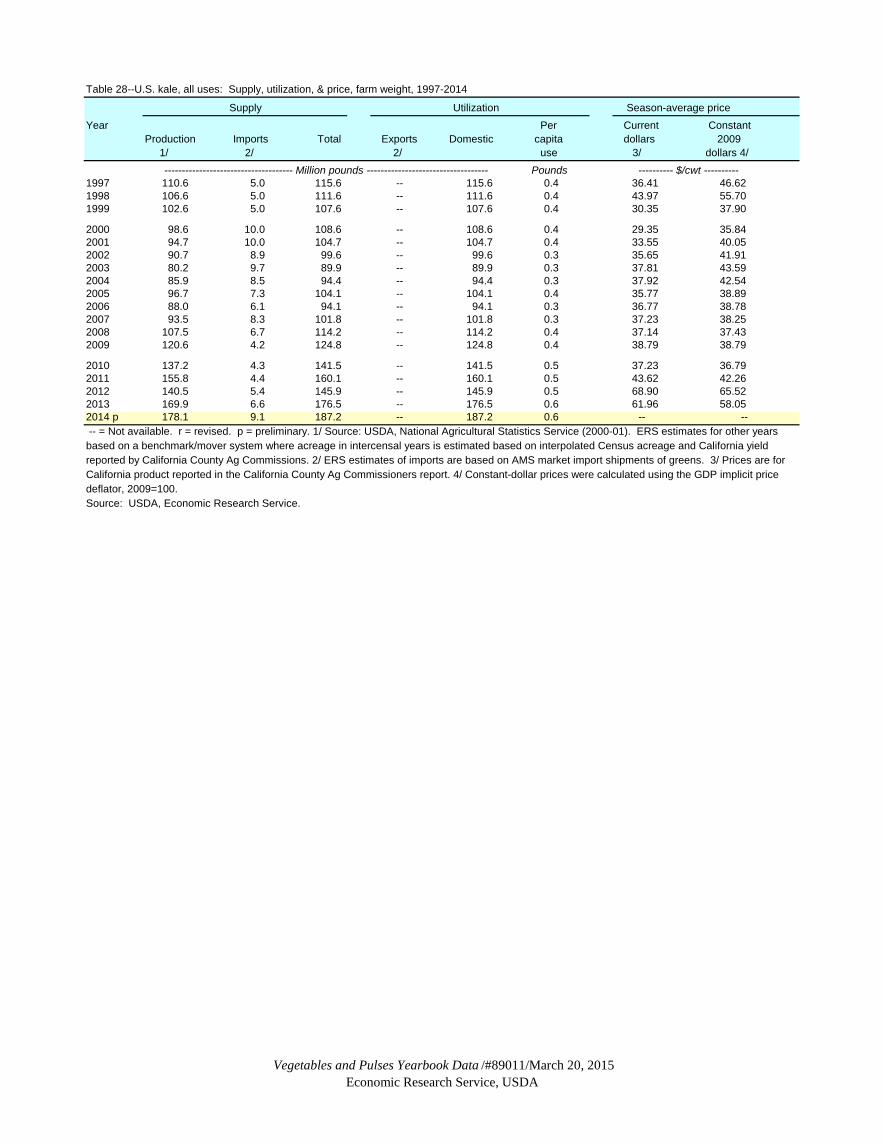
Vegetables and Pulses Yearbook Data /#89011/March 20, 2015Economic Research Service, USDA
Table 28--U.S. kale, all uses: Supply, utilization, & price, farm weight, 1997-2014
Supply Utilization Season-average priceYear Per Current Constant
Production Imports Total Exports Domestic capita dollars 2009 1/ 2/ 2/ use 3/ dollars 4/
------------------------------------- Million pounds ----------------------------------- Pounds ---------- $/cwt ----------1997 110.6 5.0 115.6 -- 115.6 0.4 36.41 46.621998 106.6 5.0 111.6 -- 111.6 0.4 43.97 55.701999 102.6 5.0 107.6 -- 107.6 0.4 30.35 37.90
2000 98.6 10.0 108.6 -- 108.6 0.4 29.35 35.84 2001 94.7 10.0 104.7 -- 104.7 0.4 33.55 40.052002 90.7 8.9 99.6 -- 99.6 0.3 35.65 41.912003 80.2 9.7 89.9 -- 89.9 0.3 37.81 43.592004 85.9 8.5 94.4 -- 94.4 0.3 37.92 42.542005 96.7 7.3 104.1 -- 104.1 0.4 35.77 38.892006 88.0 6.1 94.1 -- 94.1 0.3 36.77 38.782007 93.5 8.3 101.8 -- 101.8 0.3 37.23 38.252008 107.5 6.7 114.2 -- 114.2 0.4 37.14 37.432009 120.6 4.2 124.8 -- 124.8 0.4 38.79 38.79
2010 137.2 4.3 141.5 -- 141.5 0.5 37.23 36.792011 155.8 4.4 160.1 -- 160.1 0.5 43.62 42.262012 140.5 5.4 145.9 -- 145.9 0.5 68.90 65.522013 169.9 6.6 176.5 -- 176.5 0.6 61.96 58.052014 p 178.1 9.1 187.2 -- 187.2 0.6 -- -- -- = Not available. r = revised. p = preliminary. 1/ Source: USDA, National Agricultural Statistics Service (2000-01). ERS estimates for other years based on a benchmark/mover system where acreage in intercensal years is estimated based on interpolated Census acreage and California yield reported by California County Ag Commissions. 2/ ERS estimates of imports are based on AMS market import shipments of greens. 3/ Prices are forCalifornia product reported in the California County Ag Commissioners report. 4/ Constant-dollar prices were calculated using the GDP implicit price deflator, 2009=100. Source: USDA, Economic Research Service.

Vegetables and Pulses Yearbook Data /#89011/March 20, 2015Economic Research Service, USDA
Table 29--U.S. fresh-market mushrooms, all: Supply, disappearance, & price, farm weight, 1970/71-2013/14
Supply Disappearance Season-average priceCrop Produc- Per Current Constantyear tion Imports Total Exports Domestic capita dollars 20091/ 2/ 3/ 3/ use 4/ 1/ dollars 5/
------------------------------------ Million pounds -------------------------------------- Pounds ----------- $/cwt -----------
1970-71 58.3 0.3 58.6 0.0 58.6 0.28 54.40 238.541971-72 66.3 0.4 66.7 0.0 66.7 0.32 57.90 241.611972-73 76.7 0.1 76.8 0.0 76.8 0.36 55.50 221.961973-74 102.3 0.2 102.5 0.0 102.5 0.48 57.10 216.571974-75 126.1 0.0 126.1 0.0 126.1 0.59 60.70 211.251975-76 142.1 0.3 142.4 0.0 142.4 0.66 71.90 229.021976-77 151.2 0.0 151.2 0.0 151.2 0.69 82.40 248.801977-78 191.1 0.0 191.1 0.0 191.1 0.86 90.10 256.161978-79 229.5 0.4 229.9 0.6 229.3 1.02 94.90 252.111979-80 255.8 0.5 256.3 0.7 255.6 1.13 95.80 235.09
1980-81 275.1 0.7 275.8 0.6 275.2 1.20 94.70 213.171981-82 319.1 0.8 319.9 1.8 318.1 1.38 96.80 199.291982-83 337.2 1.1 338.3 1.6 336.7 1.44 100.00 193.851983-84 388.1 0.8 388.9 1.6 387.3 1.65 96.50 179.961984-85 419.9 1.0 420.9 1.4 419.5 1.77 93.50 168.391985-86 427.2 1.0 428.2 1.9 426.3 1.78 94.80 165.441986-87 454.8 1.4 456.2 2.9 453.3 1.88 96.90 165.761987-88 471.1 1.2 472.3 2.9 469.4 1.92 94.90 158.301988-89 488.2 1.9 490.1 3.2 486.9 1.98 97.90 157.781989-90 516.1 2.1 518.1 9.9 508.2 2.04 100.00 155.13
1990-91 516.1 3.5 519.5 17.7 501.8 1.99 98.10 146.761991-92 501.2 4.6 505.8 14.6 491.3 1.93 99.50 144.061992-93 527.0 3.8 530.8 17.4 513.3 1.98 99.80 141.271993-94 525.3 3.2 528.5 11.6 516.9 1.97 103.00 142.411994-95 540.5 5.0 545.4 9.9 535.6 2.02 105.00 142.151995-96 546.0 7.0 553.0 10.3 542.6 2.02 109.00 144.551996-97 564.5 11.3 575.8 11.7 564.1 2.08 109.00 141.961997-98 631.1 18.8 649.8 14.5 635.3 2.31 108.00 138.291998-99 670.8 23.2 694.0 13.8 680.2 2.45 108.00 136.811999-00 681.3 29.8 711.1 15.2 695.9 2.48 107.00 133.63
2000-01 706.5 38.2 744.7 13.0 731.7 2.58 106.00 129.442001-02 703.6 44.6 748.2 11.6 736.6 2.57 115.00 137.292002-03 709.2 54.0 763.1 8.3 754.9 2.61 112.00 131.682003-04 716.8 59.9 776.7 7.7 769.0 2.63 114.00 131.412004-05 711.4 62.4 773.8 8.3 765.5 2.60 114.00 127.902005-06 718.0 72.1 790.1 8.8 781.3 2.62 113.00 122.842006-07 710.9 68.9 779.8 11.6 768.2 2.56 121.00 127.612007-08 694.9 66.8 761.8 15.9 745.8 2.46 124.00 127.402008-09 696.2 69.1 765.3 18.0 747.3 2.44 124.00 124.952009-10 685.4 80.8 766.2 20.2 746.0 2.42 123.00 123.00
2010-11 736.3 88.8 825.1 21.5 803.5 2.58 124.00 122.522011-12 789.5 90.6 880.1 20.6 859.5 2.74 126.00 122.092012-13 777.6 96.9 874.4 15.7 858.7 2.72 128.00 121.712013-14 p 786.8 99.8 886.5 18.9 867.6 2.73 126.00 118.06
-- = Not available. r = revised. p = preliminary. 1/ Crop year begins July 1 and ends on June 30 of the following year. 2/ Sales volume for all fresh mushrooms. Source: USDA, National Agricultural Statistics Service. 3/ Source: U.S. Department of Commerce, U.S. Census Bureau and Statistics Canada. 4/ Total disappearance divided by total U.S. population on January 1. Represents volume available for consumption per person. 5/ Deflated by the GDP implicit price deflator, 2009=100.Source: USDA, Economic Research Service.
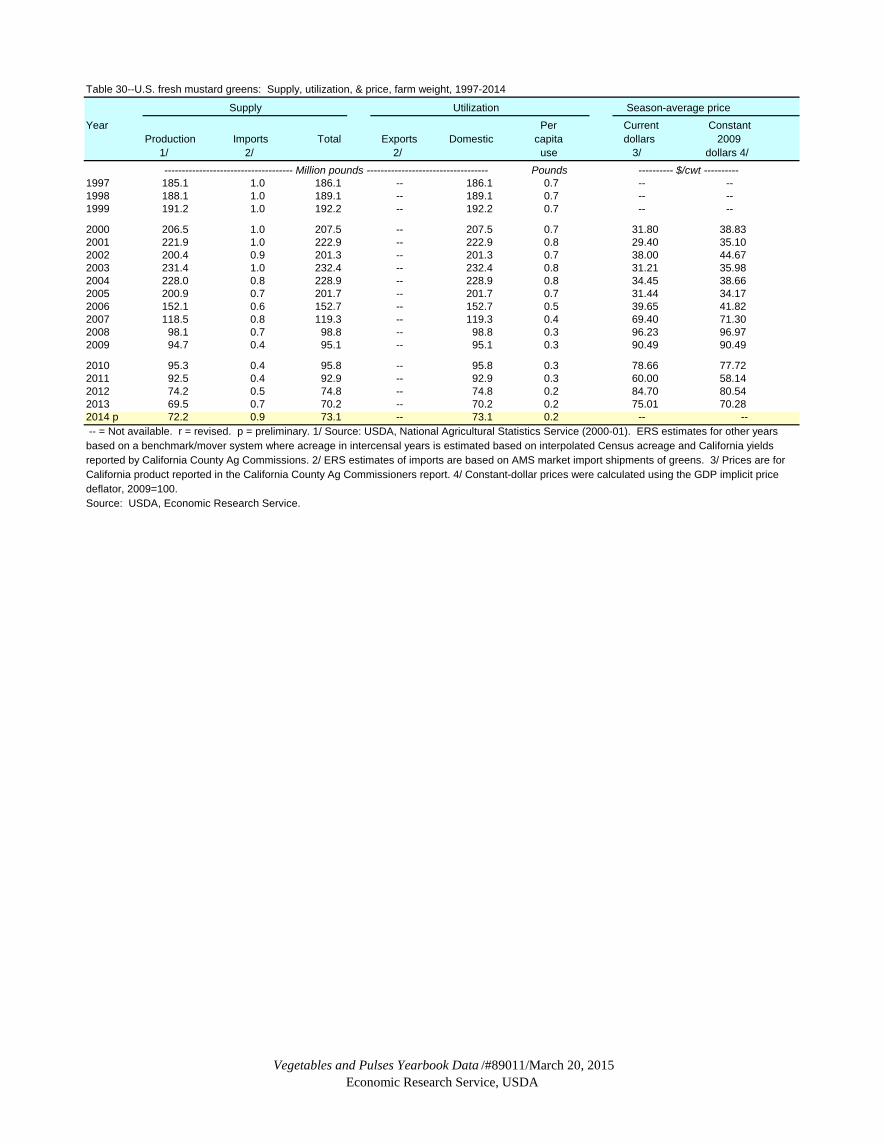
Vegetables and Pulses Yearbook Data /#89011/March 20, 2015Economic Research Service, USDA
Table 30--U.S. fresh mustard greens: Supply, utilization, & price, farm weight, 1997-2014
Supply Utilization Season-average priceYear Per Current Constant
Production Imports Total Exports Domestic capita dollars 2009 1/ 2/ 2/ use 3/ dollars 4/
------------------------------------- Million pounds ----------------------------------- Pounds ---------- $/cwt ----------1997 185.1 1.0 186.1 -- 186.1 0.7 -- --1998 188.1 1.0 189.1 -- 189.1 0.7 -- --1999 191.2 1.0 192.2 -- 192.2 0.7 -- --
2000 206.5 1.0 207.5 -- 207.5 0.7 31.80 38.83 2001 221.9 1.0 222.9 -- 222.9 0.8 29.40 35.102002 200.4 0.9 201.3 -- 201.3 0.7 38.00 44.672003 231.4 1.0 232.4 -- 232.4 0.8 31.21 35.982004 228.0 0.8 228.9 -- 228.9 0.8 34.45 38.662005 200.9 0.7 201.7 -- 201.7 0.7 31.44 34.172006 152.1 0.6 152.7 -- 152.7 0.5 39.65 41.822007 118.5 0.8 119.3 -- 119.3 0.4 69.40 71.302008 98.1 0.7 98.8 -- 98.8 0.3 96.23 96.972009 94.7 0.4 95.1 -- 95.1 0.3 90.49 90.49
2010 95.3 0.4 95.8 -- 95.8 0.3 78.66 77.722011 92.5 0.4 92.9 -- 92.9 0.3 60.00 58.142012 74.2 0.5 74.8 -- 74.8 0.2 84.70 80.542013 69.5 0.7 70.2 -- 70.2 0.2 75.01 70.282014 p 72.2 0.9 73.1 -- 73.1 0.2 -- -- -- = Not available. r = revised. p = preliminary. 1/ Source: USDA, National Agricultural Statistics Service (2000-01). ERS estimates for other years based on a benchmark/mover system where acreage in intercensal years is estimated based on interpolated Census acreage and California yieldsreported by California County Ag Commissions. 2/ ERS estimates of imports are based on AMS market import shipments of greens. 3/ Prices are forCalifornia product reported in the California County Ag Commissioners report. 4/ Constant-dollar prices were calculated using the GDP implicit price deflator, 2009=100. Source: USDA, Economic Research Service.
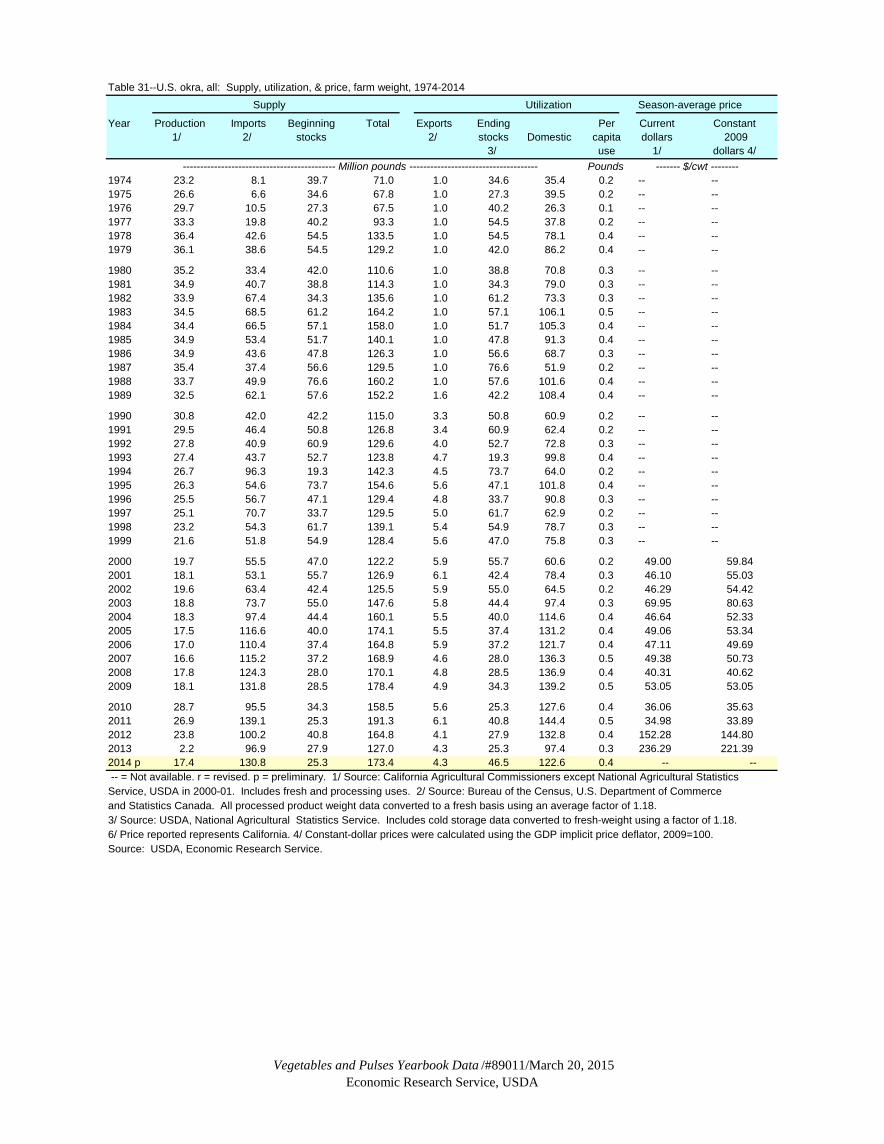
Vegetables and Pulses Yearbook Data /#89011/March 20, 2015Economic Research Service, USDA
Table 31--U.S. okra, all: Supply, utilization, & price, farm weight, 1974-2014 Supply Utilization Season-average price
Year Production Imports Beginning Total Exports Ending Per Current Constant1/ 2/ stocks 2/ stocks Domestic capita dollars 2009
3/ use 1/ dollars 4/ -------------------------------------------- Million pounds ------------------------------------- Pounds
1974 23.2 8.1 39.7 71.0 1.0 34.6 35.4 0.2 -- --1975 26.6 6.6 34.6 67.8 1.0 27.3 39.5 0.2 -- --1976 29.7 10.5 27.3 67.5 1.0 40.2 26.3 0.1 -- --1977 33.3 19.8 40.2 93.3 1.0 54.5 37.8 0.2 -- --1978 36.4 42.6 54.5 133.5 1.0 54.5 78.1 0.4 -- --1979 36.1 38.6 54.5 129.2 1.0 42.0 86.2 0.4 -- --
1980 35.2 33.4 42.0 110.6 1.0 38.8 70.8 0.3 -- --1981 34.9 40.7 38.8 114.3 1.0 34.3 79.0 0.3 -- --1982 33.9 67.4 34.3 135.6 1.0 61.2 73.3 0.3 -- --1983 34.5 68.5 61.2 164.2 1.0 57.1 106.1 0.5 -- --1984 34.4 66.5 57.1 158.0 1.0 51.7 105.3 0.4 -- --1985 34.9 53.4 51.7 140.1 1.0 47.8 91.3 0.4 -- --1986 34.9 43.6 47.8 126.3 1.0 56.6 68.7 0.3 -- --1987 35.4 37.4 56.6 129.5 1.0 76.6 51.9 0.2 -- --1988 33.7 49.9 76.6 160.2 1.0 57.6 101.6 0.4 -- --1989 32.5 62.1 57.6 152.2 1.6 42.2 108.4 0.4 -- --
1990 30.8 42.0 42.2 115.0 3.3 50.8 60.9 0.2 -- --1991 29.5 46.4 50.8 126.8 3.4 60.9 62.4 0.2 -- --1992 27.8 40.9 60.9 129.6 4.0 52.7 72.8 0.3 -- --1993 27.4 43.7 52.7 123.8 4.7 19.3 99.8 0.4 -- --1994 26.7 96.3 19.3 142.3 4.5 73.7 64.0 0.2 -- --1995 26.3 54.6 73.7 154.6 5.6 47.1 101.8 0.4 -- --1996 25.5 56.7 47.1 129.4 4.8 33.7 90.8 0.3 -- --1997 25.1 70.7 33.7 129.5 5.0 61.7 62.9 0.2 -- --1998 23.2 54.3 61.7 139.1 5.4 54.9 78.7 0.3 -- --1999 21.6 51.8 54.9 128.4 5.6 47.0 75.8 0.3 -- --
2000 19.7 55.5 47.0 122.2 5.9 55.7 60.6 0.2 49.00 59.842001 18.1 53.1 55.7 126.9 6.1 42.4 78.4 0.3 46.10 55.032002 19.6 63.4 42.4 125.5 5.9 55.0 64.5 0.2 46.29 54.422003 18.8 73.7 55.0 147.6 5.8 44.4 97.4 0.3 69.95 80.632004 18.3 97.4 44.4 160.1 5.5 40.0 114.6 0.4 46.64 52.332005 17.5 116.6 40.0 174.1 5.5 37.4 131.2 0.4 49.06 53.342006 17.0 110.4 37.4 164.8 5.9 37.2 121.7 0.4 47.11 49.692007 16.6 115.2 37.2 168.9 4.6 28.0 136.3 0.5 49.38 50.732008 17.8 124.3 28.0 170.1 4.8 28.5 136.9 0.4 40.31 40.622009 18.1 131.8 28.5 178.4 4.9 34.3 139.2 0.5 53.05 53.05
2010 28.7 95.5 34.3 158.5 5.6 25.3 127.6 0.4 36.06 35.632011 26.9 139.1 25.3 191.3 6.1 40.8 144.4 0.5 34.98 33.892012 23.8 100.2 40.8 164.8 4.1 27.9 132.8 0.4 152.28 144.802013 2.2 96.9 27.9 127.0 4.3 25.3 97.4 0.3 236.29 221.392014 p 17.4 130.8 25.3 173.4 4.3 46.5 122.6 0.4 -- -- -- = Not available. r = revised. p = preliminary. 1/ Source: California Agricultural Commissioners except National Agricultural Statistics Service, USDA in 2000-01. Includes fresh and processing uses. 2/ Source: Bureau of the Census, U.S. Department of Commerce and Statistics Canada. All processed product weight data converted to a fresh basis using an average factor of 1.18. 3/ Source: USDA, National Agricultural Statistics Service. Includes cold storage data converted to fresh-weight using a factor of 1.18.6/ Price reported represents California. 4/ Constant-dollar prices were calculated using the GDP implicit price deflator, 2009=100.Source: USDA, Economic Research Service.
------- $/cwt --------

Vegetables and Pulses Yearbook Data /#89011/March 20, 2015Economic Research Service, USDA
Table 32--U.S. fresh bulb onions: Supply, utilization, & price, farm weight, 1970-2014 Supply Utilization Season-average price
Year Production Imports Beginning Total Exports Ending Shrink Per Current Constant1/ 2/ 3/ stocks 2/ 3/ stocks and loss Domestic capita dollars 2009
4/ 1/ use 1/ dollars 5/ ---------------------------------------------------- Million pounds --------------------------------------------- Pounds
1970 2,602.3 83.4 445.5 3,131.2 147.2 553.9 350.1 2,080.0 10.1 3.67 16.091971 2,490.3 59.7 553.9 3,103.9 137.0 489.8 249.8 2,227.3 10.7 3.88 16.191972 2,449.5 69.8 489.8 3,009.1 128.8 398.2 236.7 2,245.4 10.7 6.48 25.911973 2,501.8 157.4 398.2 3,057.4 186.2 476.1 225.0 2,170.1 10.2 7.57 28.711974 2,747.9 108.6 476.1 3,332.6 147.6 511.9 281.0 2,392.1 11.2 4.87 16.951975 2,544.4 91.0 511.9 3,147.3 152.5 443.0 283.3 2,268.5 10.5 9.35 29.781976 3,085.5 88.4 443.0 3,616.9 326.6 510.0 380.6 2,399.7 11.0 6.93 20.921977 2,918.9 154.2 510.0 3,583.1 189.2 529.9 426.5 2,437.5 11.1 6.76 19.221978 3,052.9 149.2 529.9 3,732.0 281.5 641.0 379.5 2,430.0 10.9 7.81 20.751979 3,150.7 169.0 641.0 3,960.7 187.6 758.0 439.6 2,575.5 11.4 6.98 17.13
1980 2,902.1 143.1 758.0 3,803.2 296.6 617.5 297.0 2,592.1 11.4 11.40 25.661981 2,984.5 146.3 617.5 3,748.3 426.1 576.2 277.5 2,468.5 10.7 14.70 30.261982 3,396.1 177.1 576.2 4,149.4 163.5 698.7 444.3 2,842.9 12.2 8.24 15.971983 3,219.0 217.2 698.7 4,134.9 226.7 683.7 374.1 2,850.4 12.2 12.50 23.311984 3,605.3 263.6 683.7 4,552.6 312.9 766.3 382.8 3,090.6 13.1 10.60 19.091985 3,802.9 281.8 766.3 4,851.0 195.1 752.0 655.1 3,248.8 13.6 9.08 15.851986 3,605.1 263.5 752.0 4,620.6 261.1 652.1 401.8 3,305.6 13.7 11.10 18.991987 3,761.9 387.9 652.1 4,801.9 282.0 793.8 469.8 3,256.3 13.4 12.50 20.851988 3,874.4 425.1 793.8 5,093.3 322.9 792.5 413.2 3,564.7 14.5 9.75 15.711989 4,020.7 364.0 792.5 5,177.2 256.8 835.6 433.3 3,651.5 14.8 11.40 17.69
1990 4,397.3 381.8 835.6 5,614.7 378.3 866.9 602.4 3,767.1 15.1 10.50 15.711991 4,266.0 496.1 866.9 5,629.0 345.0 905.5 402.0 3,976.5 15.7 12.50 18.101992 4,689.3 421.7 905.5 6,016.5 359.9 913.6 606.9 4,136.2 16.1 13.00 18.401993 5,056.4 510.2 913.6 6,480.2 437.9 755.8 817.0 4,469.5 17.2 16.50 22.811994 5,599.3 544.7 755.8 6,899.8 802.1 1,040.4 600.5 4,456.8 16.9 10.80 14.621995 5,585.4 483.7 1,040.4 7,109.5 662.1 999.0 708.6 4,739.8 17.8 9.90 13.131996 5,564.6 625.2 999.0 7,188.8 586.3 1,008.2 653.2 4,941.1 18.3 10.50 13.671997 5,960.9 576.0 1,008.2 7,545.1 600.9 1,062.6 740.1 5,141.5 18.8 12.60 16.131998 5,841.9 598.4 1,062.6 7,502.9 628.8 1,163.3 630.3 5,080.6 18.4 13.00 16.471999 6,248.2 583.5 1,163.3 7,995.0 665.8 1,263.5 904.8 5,160.9 18.5 9.74 12.16
2000 6,236.8 482.6 1,263.5 7,982.9 768.1 1,184.5 700.6 5,329.7 18.9 11.20 13.682001 6,083.6 638.8 1,184.5 7,907.0 719.2 1,274.8 643.9 5,269.0 18.5 10.70 12.772002 6,124.2 605.0 1,274.8 8,004.0 639.0 1,167.9 630.0 5,567.1 19.3 12.10 14.232003 6,254.6 659.3 1,167.9 8,081.8 680.0 1,183.0 545.8 5,673.1 19.5 13.70 15.792004 7,468.5 702.8 1,183.0 9,354.3 632.3 1,420.5 869.6 6,431.9 21.9 8.93 10.022005 6,458.5 688.8 1,420.5 8,567.7 676.3 1,213.6 488.3 6,189.5 20.9 12.40 13.482006 6,370.1 668.6 1,213.6 8,252.3 661.0 1,096.2 540.4 5,954.7 19.9 16.10 16.982007 7,098.3 920.6 1,096.2 9,115.1 555.7 1,415.4 617.0 6,527.0 21.6 11.10 11.402008 6,524.8 739.6 1,415.4 8,679.8 614.4 1,418.2 494.7 6,152.5 20.2 11.90 11.992009 6,472.4 705.9 1,418.2 8,596.5 564.2 1,507.6 504.5 6,020.1 19.6 15.00 15.00
2010 6,421.0 891.9 1,507.6 8,820.6 717.1 1,439.1 598.7 6,065.7 19.6 15.60 15.412011 6,437.3 893.2 1,439.1 8,769.6 705.3 1,522.0 575.7 5,966.6 19.1 10.90 10.562012 6,299.0 876.8 1,522.0 8,697.8 651.5 1,292.0 479.8 6,274.4 20.0 14.20 13.502013 6,085.4 994.4 1,292.0 8,371.8 702.8 1,307.4 473.3 5,888.3 18.6 15.00 14.052014 p 6,090.4 1,134.0 1,307.4 8,531.8 657.0 1,557.7 402.2 5,915.0 18.5 13.60 12.56 -- = Not available. r = revised. p = preliminary. 1/ Source: USDA, National Agricultural Statistics Service. Production data were adjusted by ERS from 1970-81 to account for States not included in NASS estimates. 2/ Source: U.S. Department of Commerce, U.S. Census Bureau. From 1980-89exports were adjusted using Canadian import data. 3/ Includes green onions, onion sets, and canned onions, but excludes dehydrated onions.4/ Approximated from State marketings. 5/ Constant-dollar prices were calculated using the GDP implicit price deflator, 2009=100.Source: USDA, Economic Research Service.
------- $/cwt --------
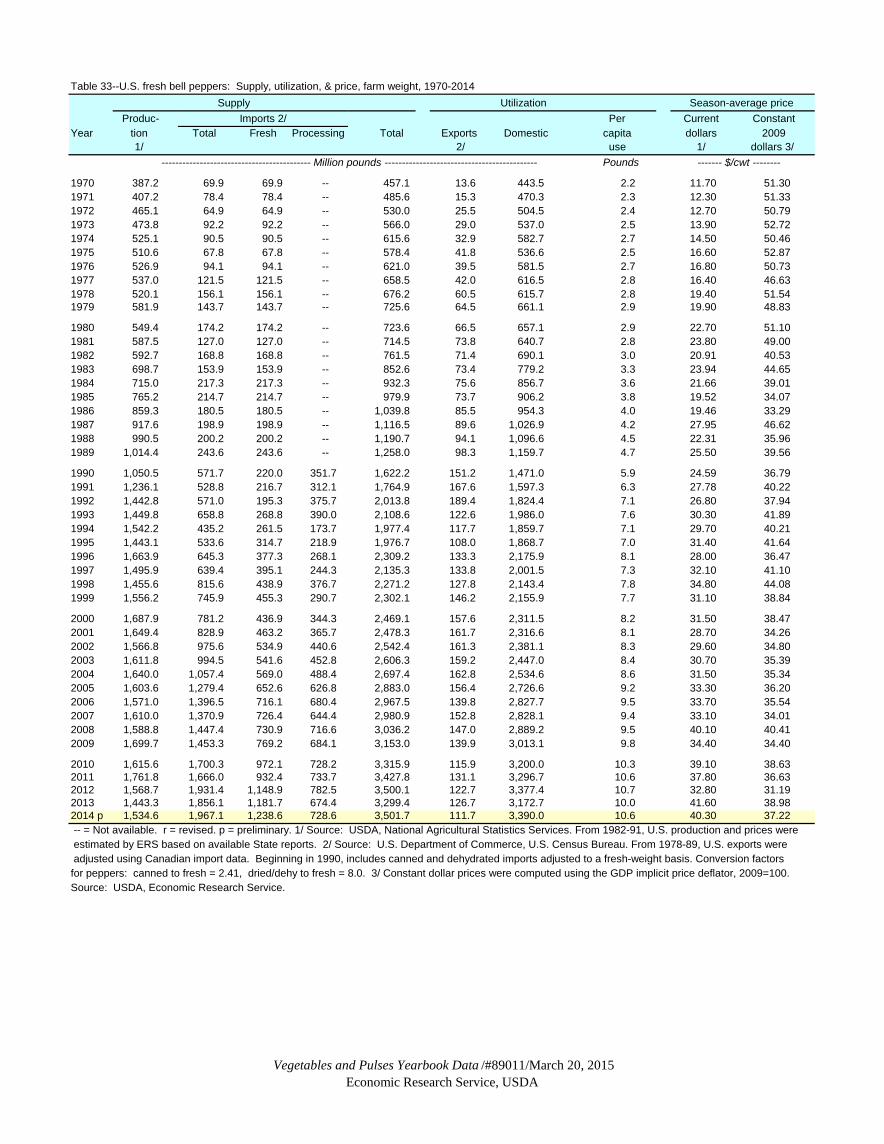
Vegetables and Pulses Yearbook Data /#89011/March 20, 2015Economic Research Service, USDA
Table 33--U.S. fresh bell peppers: Supply, utilization, & price, farm weight, 1970-2014Supply Utilization Season-average price
Produc- Imports 2/ Per Current ConstantYear tion Total Fresh Processing Total Exports Domestic capita dollars 2009
1/ 2/ use 1/ dollars 3/ ------------------------------------------- Million pounds -------------------------------------------- Pounds
1970 387.2 69.9 69.9 -- 457.1 13.6 443.5 2.2 11.70 51.301971 407.2 78.4 78.4 -- 485.6 15.3 470.3 2.3 12.30 51.331972 465.1 64.9 64.9 -- 530.0 25.5 504.5 2.4 12.70 50.791973 473.8 92.2 92.2 -- 566.0 29.0 537.0 2.5 13.90 52.721974 525.1 90.5 90.5 -- 615.6 32.9 582.7 2.7 14.50 50.461975 510.6 67.8 67.8 -- 578.4 41.8 536.6 2.5 16.60 52.871976 526.9 94.1 94.1 -- 621.0 39.5 581.5 2.7 16.80 50.731977 537.0 121.5 121.5 -- 658.5 42.0 616.5 2.8 16.40 46.631978 520.1 156.1 156.1 -- 676.2 60.5 615.7 2.8 19.40 51.541979 581.9 143.7 143.7 -- 725.6 64.5 661.1 2.9 19.90 48.83
1980 549.4 174.2 174.2 -- 723.6 66.5 657.1 2.9 22.70 51.101981 587.5 127.0 127.0 -- 714.5 73.8 640.7 2.8 23.80 49.001982 592.7 168.8 168.8 -- 761.5 71.4 690.1 3.0 20.91 40.531983 698.7 153.9 153.9 -- 852.6 73.4 779.2 3.3 23.94 44.651984 715.0 217.3 217.3 -- 932.3 75.6 856.7 3.6 21.66 39.011985 765.2 214.7 214.7 -- 979.9 73.7 906.2 3.8 19.52 34.071986 859.3 180.5 180.5 -- 1,039.8 85.5 954.3 4.0 19.46 33.291987 917.6 198.9 198.9 -- 1,116.5 89.6 1,026.9 4.2 27.95 46.621988 990.5 200.2 200.2 -- 1,190.7 94.1 1,096.6 4.5 22.31 35.961989 1,014.4 243.6 243.6 -- 1,258.0 98.3 1,159.7 4.7 25.50 39.56
1990 1,050.5 571.7 220.0 351.7 1,622.2 151.2 1,471.0 5.9 24.59 36.791991 1,236.1 528.8 216.7 312.1 1,764.9 167.6 1,597.3 6.3 27.78 40.221992 1,442.8 571.0 195.3 375.7 2,013.8 189.4 1,824.4 7.1 26.80 37.941993 1,449.8 658.8 268.8 390.0 2,108.6 122.6 1,986.0 7.6 30.30 41.891994 1,542.2 435.2 261.5 173.7 1,977.4 117.7 1,859.7 7.1 29.70 40.211995 1,443.1 533.6 314.7 218.9 1,976.7 108.0 1,868.7 7.0 31.40 41.641996 1,663.9 645.3 377.3 268.1 2,309.2 133.3 2,175.9 8.1 28.00 36.471997 1,495.9 639.4 395.1 244.3 2,135.3 133.8 2,001.5 7.3 32.10 41.101998 1,455.6 815.6 438.9 376.7 2,271.2 127.8 2,143.4 7.8 34.80 44.081999 1,556.2 745.9 455.3 290.7 2,302.1 146.2 2,155.9 7.7 31.10 38.84
2000 1,687.9 781.2 436.9 344.3 2,469.1 157.6 2,311.5 8.2 31.50 38.472001 1,649.4 828.9 463.2 365.7 2,478.3 161.7 2,316.6 8.1 28.70 34.262002 1,566.8 975.6 534.9 440.6 2,542.4 161.3 2,381.1 8.3 29.60 34.802003 1,611.8 994.5 541.6 452.8 2,606.3 159.2 2,447.0 8.4 30.70 35.392004 1,640.0 1,057.4 569.0 488.4 2,697.4 162.8 2,534.6 8.6 31.50 35.342005 1,603.6 1,279.4 652.6 626.8 2,883.0 156.4 2,726.6 9.2 33.30 36.202006 1,571.0 1,396.5 716.1 680.4 2,967.5 139.8 2,827.7 9.5 33.70 35.542007 1,610.0 1,370.9 726.4 644.4 2,980.9 152.8 2,828.1 9.4 33.10 34.012008 1,588.8 1,447.4 730.9 716.6 3,036.2 147.0 2,889.2 9.5 40.10 40.412009 1,699.7 1,453.3 769.2 684.1 3,153.0 139.9 3,013.1 9.8 34.40 34.40
2010 1,615.6 1,700.3 972.1 728.2 3,315.9 115.9 3,200.0 10.3 39.10 38.632011 1,761.8 1,666.0 932.4 733.7 3,427.8 131.1 3,296.7 10.6 37.80 36.632012 1,568.7 1,931.4 1,148.9 782.5 3,500.1 122.7 3,377.4 10.7 32.80 31.192013 1,443.3 1,856.1 1,181.7 674.4 3,299.4 126.7 3,172.7 10.0 41.60 38.982014 p 1,534.6 1,967.1 1,238.6 728.6 3,501.7 111.7 3,390.0 10.6 40.30 37.22 -- = Not available. r = revised. p = preliminary. 1/ Source: USDA, National Agricultural Statistics Services. From 1982-91, U.S. production and prices were estimated by ERS based on available State reports. 2/ Source: U.S. Department of Commerce, U.S. Census Bureau. From 1978-89, U.S. exports were adjusted using Canadian import data. Beginning in 1990, includes canned and dehydrated imports adjusted to a fresh-weight basis. Conversion factorsfor peppers: canned to fresh = 2.41, dried/dehy to fresh = 8.0. 3/ Constant dollar prices were computed using the GDP implicit price deflator, 2009=100. Source: USDA, Economic Research Service.
------- $/cwt --------
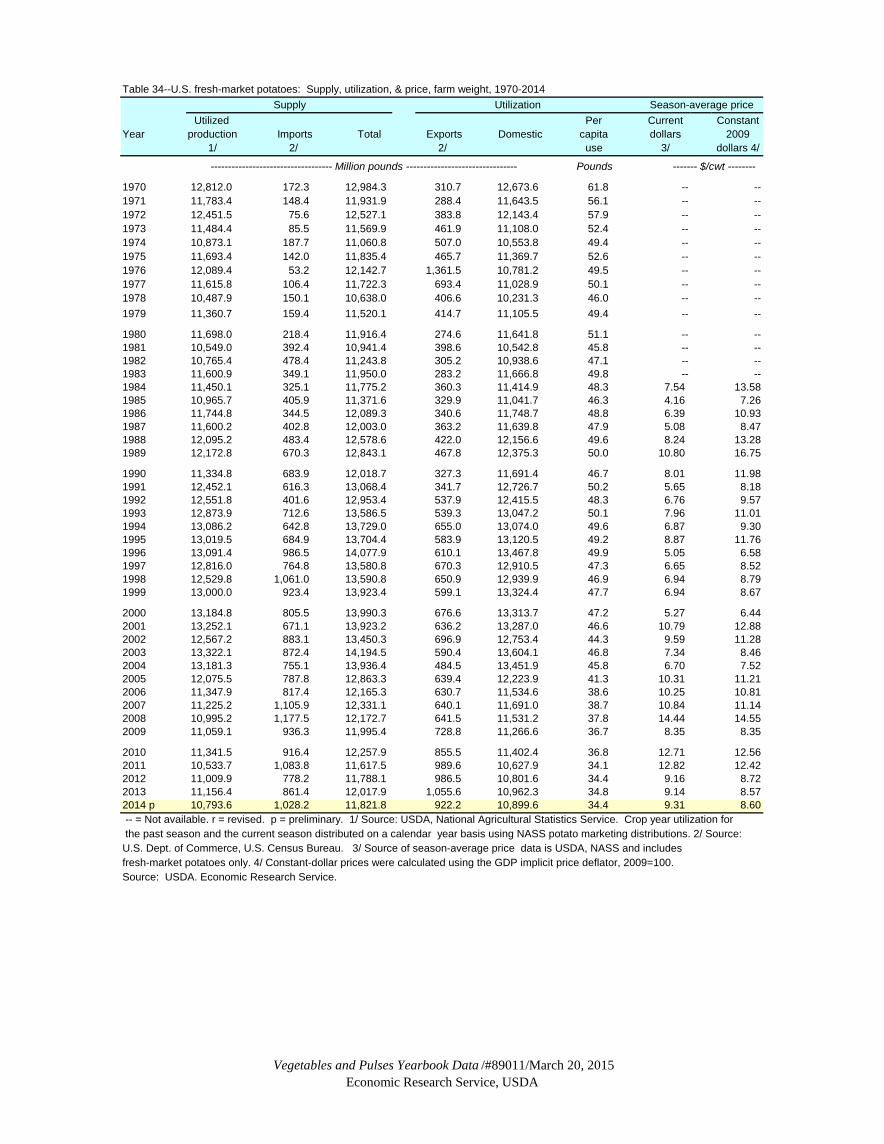
Vegetables and Pulses Yearbook Data /#89011/March 20, 2015Economic Research Service, USDA
Table 34--U.S. fresh-market potatoes: Supply, utilization, & price, farm weight, 1970-2014Supply Utilization Season-average price
Utilized Per Current ConstantYear production Imports Total Exports Domestic capita dollars 2009
1/ 2/ 2/ use 3/ dollars 4/
----------------------------------- Million pounds -------------------------------- Pounds
1970 12,812.0 172.3 12,984.3 310.7 12,673.6 61.8 -- --1971 11,783.4 148.4 11,931.9 288.4 11,643.5 56.1 -- --1972 12,451.5 75.6 12,527.1 383.8 12,143.4 57.9 -- --1973 11,484.4 85.5 11,569.9 461.9 11,108.0 52.4 -- --1974 10,873.1 187.7 11,060.8 507.0 10,553.8 49.4 -- --1975 11,693.4 142.0 11,835.4 465.7 11,369.7 52.6 -- --1976 12,089.4 53.2 12,142.7 1,361.5 10,781.2 49.5 -- --1977 11,615.8 106.4 11,722.3 693.4 11,028.9 50.1 -- --1978 10,487.9 150.1 10,638.0 406.6 10,231.3 46.0 -- --1979 11,360.7 159.4 11,520.1 414.7 11,105.5 49.4 -- --
1980 11,698.0 218.4 11,916.4 274.6 11,641.8 51.1 -- --1981 10,549.0 392.4 10,941.4 398.6 10,542.8 45.8 -- --1982 10,765.4 478.4 11,243.8 305.2 10,938.6 47.1 -- --1983 11,600.9 349.1 11,950.0 283.2 11,666.8 49.8 -- --1984 11,450.1 325.1 11,775.2 360.3 11,414.9 48.3 7.54 13.581985 10,965.7 405.9 11,371.6 329.9 11,041.7 46.3 4.16 7.261986 11,744.8 344.5 12,089.3 340.6 11,748.7 48.8 6.39 10.931987 11,600.2 402.8 12,003.0 363.2 11,639.8 47.9 5.08 8.471988 12,095.2 483.4 12,578.6 422.0 12,156.6 49.6 8.24 13.281989 12,172.8 670.3 12,843.1 467.8 12,375.3 50.0 10.80 16.75
1990 11,334.8 683.9 12,018.7 327.3 11,691.4 46.7 8.01 11.981991 12,452.1 616.3 13,068.4 341.7 12,726.7 50.2 5.65 8.181992 12,551.8 401.6 12,953.4 537.9 12,415.5 48.3 6.76 9.571993 12,873.9 712.6 13,586.5 539.3 13,047.2 50.1 7.96 11.011994 13,086.2 642.8 13,729.0 655.0 13,074.0 49.6 6.87 9.301995 13,019.5 684.9 13,704.4 583.9 13,120.5 49.2 8.87 11.761996 13,091.4 986.5 14,077.9 610.1 13,467.8 49.9 5.05 6.581997 12,816.0 764.8 13,580.8 670.3 12,910.5 47.3 6.65 8.521998 12,529.8 1,061.0 13,590.8 650.9 12,939.9 46.9 6.94 8.791999 13,000.0 923.4 13,923.4 599.1 13,324.4 47.7 6.94 8.67
2000 13,184.8 805.5 13,990.3 676.6 13,313.7 47.2 5.27 6.442001 13,252.1 671.1 13,923.2 636.2 13,287.0 46.6 10.79 12.882002 12,567.2 883.1 13,450.3 696.9 12,753.4 44.3 9.59 11.282003 13,322.1 872.4 14,194.5 590.4 13,604.1 46.8 7.34 8.462004 13,181.3 755.1 13,936.4 484.5 13,451.9 45.8 6.70 7.522005 12,075.5 787.8 12,863.3 639.4 12,223.9 41.3 10.31 11.212006 11,347.9 817.4 12,165.3 630.7 11,534.6 38.6 10.25 10.812007 11,225.2 1,105.9 12,331.1 640.1 11,691.0 38.7 10.84 11.142008 10,995.2 1,177.5 12,172.7 641.5 11,531.2 37.8 14.44 14.552009 11,059.1 936.3 11,995.4 728.8 11,266.6 36.7 8.35 8.35
2010 11,341.5 916.4 12,257.9 855.5 11,402.4 36.8 12.71 12.562011 10,533.7 1,083.8 11,617.5 989.6 10,627.9 34.1 12.82 12.422012 11,009.9 778.2 11,788.1 986.5 10,801.6 34.4 9.16 8.722013 11,156.4 861.4 12,017.9 1,055.6 10,962.3 34.8 9.14 8.572014 p 10,793.6 1,028.2 11,821.8 922.2 10,899.6 34.4 9.31 8.60 -- = Not available. r = revised. p = preliminary. 1/ Source: USDA, National Agricultural Statistics Service. Crop year utilization for the past season and the current season distributed on a calendar year basis using NASS potato marketing distributions. 2/ Source: U.S. Dept. of Commerce, U.S. Census Bureau. 3/ Source of season-average price data is USDA, NASS and includesfresh-market potatoes only. 4/ Constant-dollar prices were calculated using the GDP implicit price deflator, 2009=100. Source: USDA. Economic Research Service.
------- $/cwt --------
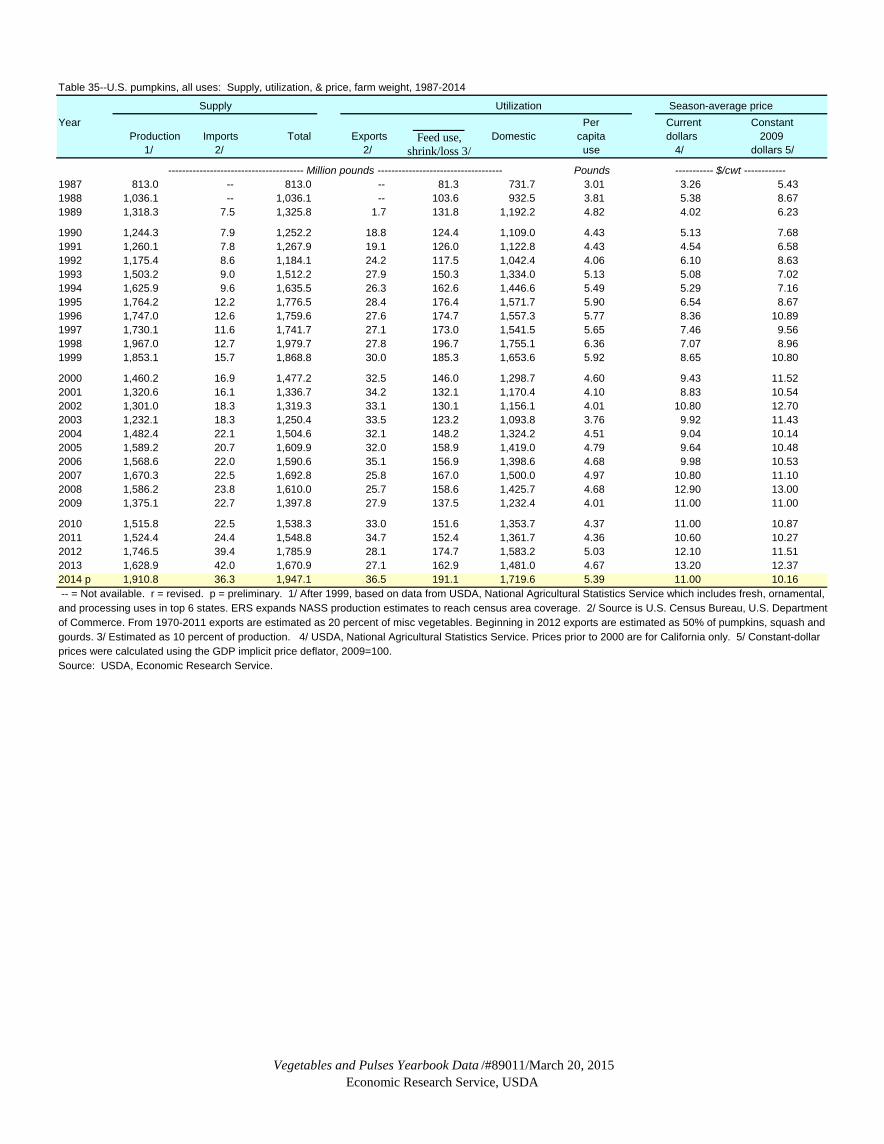
Vegetables and Pulses Yearbook Data /#89011/March 20, 2015Economic Research Service, USDA
Table 35--U.S. pumpkins, all uses: Supply, utilization, & price, farm weight, 1987-2014
Supply Utilization Season-average priceYear Per Current Constant
Production Imports Total Exports Feed use, Domestic capita dollars 2009 1/ 2/ 2/ shrink/loss 3/ use 4/ dollars 5/
--------------------------------------- Million pounds ------------------------------------ Pounds ----------- $/cwt ------------1987 813.0 -- 813.0 -- 81.3 731.7 3.01 3.26 5.431988 1,036.1 -- 1,036.1 -- 103.6 932.5 3.81 5.38 8.671989 1,318.3 7.5 1,325.8 1.7 131.8 1,192.2 4.82 4.02 6.23
1990 1,244.3 7.9 1,252.2 18.8 124.4 1,109.0 4.43 5.13 7.681991 1,260.1 7.8 1,267.9 19.1 126.0 1,122.8 4.43 4.54 6.581992 1,175.4 8.6 1,184.1 24.2 117.5 1,042.4 4.06 6.10 8.631993 1,503.2 9.0 1,512.2 27.9 150.3 1,334.0 5.13 5.08 7.021994 1,625.9 9.6 1,635.5 26.3 162.6 1,446.6 5.49 5.29 7.161995 1,764.2 12.2 1,776.5 28.4 176.4 1,571.7 5.90 6.54 8.671996 1,747.0 12.6 1,759.6 27.6 174.7 1,557.3 5.77 8.36 10.891997 1,730.1 11.6 1,741.7 27.1 173.0 1,541.5 5.65 7.46 9.561998 1,967.0 12.7 1,979.7 27.8 196.7 1,755.1 6.36 7.07 8.961999 1,853.1 15.7 1,868.8 30.0 185.3 1,653.6 5.92 8.65 10.80
2000 1,460.2 16.9 1,477.2 32.5 146.0 1,298.7 4.60 9.43 11.52 2001 1,320.6 16.1 1,336.7 34.2 132.1 1,170.4 4.10 8.83 10.542002 1,301.0 18.3 1,319.3 33.1 130.1 1,156.1 4.01 10.80 12.702003 1,232.1 18.3 1,250.4 33.5 123.2 1,093.8 3.76 9.92 11.432004 1,482.4 22.1 1,504.6 32.1 148.2 1,324.2 4.51 9.04 10.142005 1,589.2 20.7 1,609.9 32.0 158.9 1,419.0 4.79 9.64 10.482006 1,568.6 22.0 1,590.6 35.1 156.9 1,398.6 4.68 9.98 10.532007 1,670.3 22.5 1,692.8 25.8 167.0 1,500.0 4.97 10.80 11.102008 1,586.2 23.8 1,610.0 25.7 158.6 1,425.7 4.68 12.90 13.002009 1,375.1 22.7 1,397.8 27.9 137.5 1,232.4 4.01 11.00 11.00
2010 1,515.8 22.5 1,538.3 33.0 151.6 1,353.7 4.37 11.00 10.872011 1,524.4 24.4 1,548.8 34.7 152.4 1,361.7 4.36 10.60 10.272012 1,746.5 39.4 1,785.9 28.1 174.7 1,583.2 5.03 12.10 11.512013 1,628.9 42.0 1,670.9 27.1 162.9 1,481.0 4.67 13.20 12.372014 p 1,910.8 36.3 1,947.1 36.5 191.1 1,719.6 5.39 11.00 10.16 -- = Not available. r = revised. p = preliminary. 1/ After 1999, based on data from USDA, National Agricultural Statistics Service which includes fresh, ornamental, and processing uses in top 6 states. ERS expands NASS production estimates to reach census area coverage. 2/ Source is U.S. Census Bureau, U.S. Department of Commerce. From 1970-2011 exports are estimated as 20 percent of misc vegetables. Beginning in 2012 exports are estimated as 50% of pumpkins, squash and gourds. 3/ Estimated as 10 percent of production. 4/ USDA, National Agricultural Statistics Service. Prices prior to 2000 are for California only. 5/ Constant-dollarprices were calculated using the GDP implicit price deflator, 2009=100.Source: USDA, Economic Research Service.
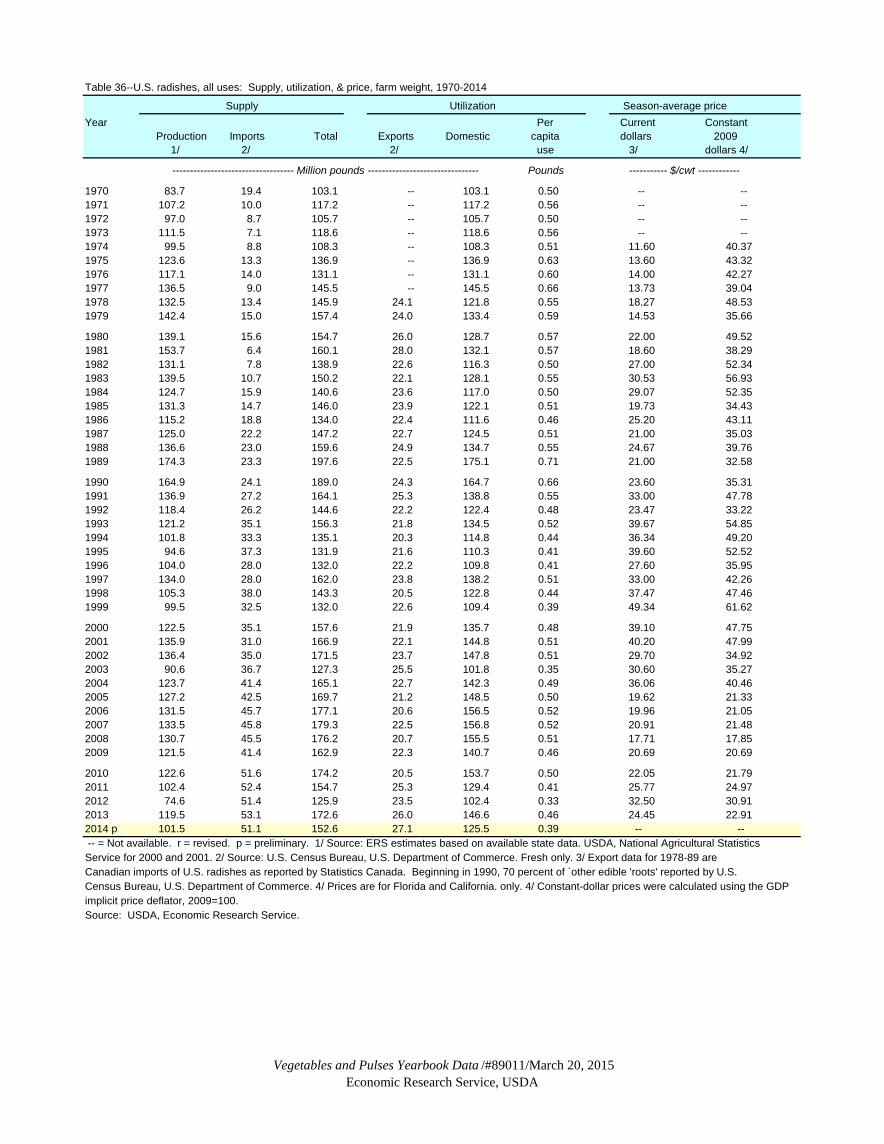
Vegetables and Pulses Yearbook Data /#89011/March 20, 2015Economic Research Service, USDA
Table 36--U.S. radishes, all uses: Supply, utilization, & price, farm weight, 1970-2014
Supply Utilization Season-average priceYear Per Current Constant
Production Imports Total Exports Domestic capita dollars 2009 1/ 2/ 2/ use 3/ dollars 4/
----------------------------------- Million pounds -------------------------------- Pounds ----------- $/cwt ------------
1970 83.7 19.4 103.1 -- 103.1 0.50 -- --1971 107.2 10.0 117.2 -- 117.2 0.56 -- --1972 97.0 8.7 105.7 -- 105.7 0.50 -- --1973 111.5 7.1 118.6 -- 118.6 0.56 -- --1974 99.5 8.8 108.3 -- 108.3 0.51 11.60 40.371975 123.6 13.3 136.9 -- 136.9 0.63 13.60 43.321976 117.1 14.0 131.1 -- 131.1 0.60 14.00 42.271977 136.5 9.0 145.5 -- 145.5 0.66 13.73 39.041978 132.5 13.4 145.9 24.1 121.8 0.55 18.27 48.531979 142.4 15.0 157.4 24.0 133.4 0.59 14.53 35.66
1980 139.1 15.6 154.7 26.0 128.7 0.57 22.00 49.521981 153.7 6.4 160.1 28.0 132.1 0.57 18.60 38.291982 131.1 7.8 138.9 22.6 116.3 0.50 27.00 52.341983 139.5 10.7 150.2 22.1 128.1 0.55 30.53 56.931984 124.7 15.9 140.6 23.6 117.0 0.50 29.07 52.351985 131.3 14.7 146.0 23.9 122.1 0.51 19.73 34.431986 115.2 18.8 134.0 22.4 111.6 0.46 25.20 43.111987 125.0 22.2 147.2 22.7 124.5 0.51 21.00 35.031988 136.6 23.0 159.6 24.9 134.7 0.55 24.67 39.761989 174.3 23.3 197.6 22.5 175.1 0.71 21.00 32.58
1990 164.9 24.1 189.0 24.3 164.7 0.66 23.60 35.311991 136.9 27.2 164.1 25.3 138.8 0.55 33.00 47.781992 118.4 26.2 144.6 22.2 122.4 0.48 23.47 33.221993 121.2 35.1 156.3 21.8 134.5 0.52 39.67 54.851994 101.8 33.3 135.1 20.3 114.8 0.44 36.34 49.201995 94.6 37.3 131.9 21.6 110.3 0.41 39.60 52.521996 104.0 28.0 132.0 22.2 109.8 0.41 27.60 35.951997 134.0 28.0 162.0 23.8 138.2 0.51 33.00 42.261998 105.3 38.0 143.3 20.5 122.8 0.44 37.47 47.461999 99.5 32.5 132.0 22.6 109.4 0.39 49.34 61.62
2000 122.5 35.1 157.6 21.9 135.7 0.48 39.10 47.75 2001 135.9 31.0 166.9 22.1 144.8 0.51 40.20 47.992002 136.4 35.0 171.5 23.7 147.8 0.51 29.70 34.922003 90.6 36.7 127.3 25.5 101.8 0.35 30.60 35.272004 123.7 41.4 165.1 22.7 142.3 0.49 36.06 40.462005 127.2 42.5 169.7 21.2 148.5 0.50 19.62 21.332006 131.5 45.7 177.1 20.6 156.5 0.52 19.96 21.052007 133.5 45.8 179.3 22.5 156.8 0.52 20.91 21.482008 130.7 45.5 176.2 20.7 155.5 0.51 17.71 17.852009 121.5 41.4 162.9 22.3 140.7 0.46 20.69 20.69
2010 122.6 51.6 174.2 20.5 153.7 0.50 22.05 21.792011 102.4 52.4 154.7 25.3 129.4 0.41 25.77 24.972012 74.6 51.4 125.9 23.5 102.4 0.33 32.50 30.912013 119.5 53.1 172.6 26.0 146.6 0.46 24.45 22.912014 p 101.5 51.1 152.6 27.1 125.5 0.39 -- -- -- = Not available. r = revised. p = preliminary. 1/ Source: ERS estimates based on available state data. USDA, National Agricultural StatisticsService for 2000 and 2001. 2/ Source: U.S. Census Bureau, U.S. Department of Commerce. Fresh only. 3/ Export data for 1978-89 are Canadian imports of U.S. radishes as reported by Statistics Canada. Beginning in 1990, 70 percent of `other edible 'roots' reported by U.S.Census Bureau, U.S. Department of Commerce. 4/ Prices are for Florida and California. only. 4/ Constant-dollar prices were calculated using the GDP implicit price deflator, 2009=100.Source: USDA, Economic Research Service.

Vegetables and Pulses Yearbook Data /#89011/March 20, 2015Economic Research Service, USDA
Table 37--U.S. fresh-market snap beans: Supply, utilization, & price, farm weight, 1970-2014Supply Utilization Season-average price
Year Per Current Constant Production Imports Total Exports Domestic capita dollars 2009 1/ 2/ 2/ use 1/ dollars 3/
----------------------------------- Million pounds -------------------------------- Pounds ---------- $/cwt -----------
1970 312.0 12.5 324.5 7.0 317.5 1.5 13.10 57.441971 309.6 12.3 321.9 7.8 314.1 1.5 14.40 60.091972 313.7 18.0 331.7 11.1 320.6 1.5 14.80 59.191973 303.3 14.9 318.2 15.6 302.6 1.4 17.90 67.891974 292.0 15.7 307.7 16.6 291.1 1.4 18.60 64.731975 317.9 10.5 328.4 16.0 312.4 1.4 19.60 62.431976 318.3 12.4 330.7 15.0 315.7 1.4 19.90 60.091977 296.3 17.5 313.8 17.6 296.2 1.3 21.10 59.991978 292.1 26.1 318.2 31.2 287.0 1.3 26.00 69.071979 292.8 24.4 317.2 23.1 294.1 1.3 27.10 66.50
1980 304.4 25.4 329.8 30.4 299.4 1.3 27.30 61.451981 292.6 19.9 312.5 23.4 289.1 1.3 29.70 61.151982 297.3 16.4 313.7 21.2 292.5 1.3 34.43 66.741983 288.2 23.7 311.9 21.6 290.3 1.2 35.33 65.891984 310.7 25.9 336.6 19.3 317.3 1.3 30.73 55.341985 298.1 25.5 323.6 23.2 300.4 1.3 29.96 52.281986 299.1 33.3 332.4 30.1 302.3 1.3 34.10 58.331987 295.7 27.4 323.1 27.7 295.4 1.2 38.20 63.721988 296.2 30.9 327.1 35.6 291.5 1.2 40.66 65.531989 293.8 30.8 324.6 29.3 295.3 1.2 49.50 76.79
1990 273.8 30.0 303.8 36.5 267.3 1.1 36.83 55.101991 300.0 24.9 324.9 40.1 284.8 1.1 45.13 65.341992 393.2 23.4 416.6 44.8 371.8 1.4 35.20 49.831993 410.2 25.3 435.5 41.2 394.3 1.5 37.40 51.711994 417.7 23.3 441.0 35.7 405.3 1.5 37.70 51.041995 444.1 37.7 481.8 45.8 436.0 1.6 36.50 48.401996 396.4 39.8 436.2 44.7 391.5 1.5 42.00 54.701997 380.5 46.0 426.5 58.1 368.4 1.3 40.60 51.991998 485.6 42.8 528.4 75.4 453.0 1.6 48.90 61.941999 558.0 43.8 601.8 72.5 529.3 1.9 46.50 58.07
2000 588.1 49.5 637.6 68.3 569.3 2.0 42.60 52.02 2001 619.3 54.4 673.7 55.8 617.8 2.2 45.00 53.722002 596.5 59.3 655.8 52.7 603.1 2.1 47.60 55.962003 566.3 56.7 623.0 51.0 572.0 2.0 49.20 56.712004 575.7 58.6 634.3 81.9 552.4 1.9 45.20 50.712005 551.1 60.5 611.6 78.2 533.4 1.8 54.10 58.812006 621.3 62.5 683.8 61.8 622.1 2.1 50.00 52.732007 650.2 70.2 720.4 56.6 663.8 2.2 61.20 62.882008 582.4 79.0 661.4 58.3 603.1 2.0 52.80 53.212009 522.5 83.6 606.1 68.2 537.8 1.7 54.10 54.10
2010 506.2 121.9 628.1 46.9 581.2 1.9 60.40 59.682011 459.1 120.4 579.5 40.6 538.9 1.7 59.50 57.662012 434.0 127.0 561.0 49.1 511.9 1.6 62.70 59.622013 425.2 132.2 557.4 44.7 512.6 1.6 68.90 64.562014 p 368.4 137.4 505.8 42.5 463.3 1.5 60.40 55.79 -- = Not available. r = revised. p = preliminary. 1/ Source: USDA, National Agricultural Statistics Service except for 1982-91 which was estimated by ERS based on available State data. 2/ Source: U.S. Dept. of Commerce, U.S. Census Bureau. From 1978-89, exports were adjusted using import data from Statistics Canada. 3/ Constant-dollar prices were calculated using the GDP implicit price deflator, 2009=100. Source: USDA, Economic Research Service.

Vegetables and Pulses Yearbook Data /#89011/March 20, 2015Economic Research Service, USDA
Table 38--U.S. fresh-market spinach: Supply, utilization, & price, farm weight, 1970-2014Supply Utilization Season-average price
Year Per Current Constant Production Imports Total Exports Domestic capita dollars 2009 1/ 2/ 2/ use 1/ dollars 3/
----------------------------------- Million pounds -------------------------------- Pounds ---------- $/cwt ----------
1970 61.1 -- 61.1 -- 61.1 0.3 11.40 49.991971 63.3 -- 63.3 -- 63.3 0.3 13.60 56.751972 59.4 -- 59.4 -- 59.4 0.3 14.80 59.191973 62.8 -- 62.8 -- 62.8 0.3 14.50 55.001974 60.7 -- 60.7 -- 60.7 0.3 15.00 52.201975 62.9 -- 62.9 -- 62.9 0.3 16.40 52.241976 68.5 -- 68.5 -- 68.5 0.3 17.80 53.751977 83.6 -- 83.6 -- 83.6 0.4 16.80 47.761978 91.5 -- 91.5 16.1 75.4 0.3 21.40 56.851979 106.4 -- 106.4 16.6 89.8 0.4 23.90 58.65
1980 118.7 -- 118.7 17.5 101.2 0.4 24.80 55.821981 142.6 -- 142.6 21.4 121.2 0.5 27.40 56.411982 146.7 -- 146.7 19.0 127.7 0.5 25.90 50.211983 140.8 -- 140.8 20.6 120.2 0.5 35.60 66.391984 146.4 -- 146.4 21.1 125.3 0.5 22.00 39.621985 181.7 -- 181.7 21.0 160.7 0.7 27.60 48.171986 166.4 -- 166.4 25.7 140.7 0.6 28.30 48.411987 166.2 -- 166.2 24.6 141.6 0.6 26.80 44.701988 174.8 -- 174.8 28.8 146.0 0.6 21.50 34.651989 182.6 6.7 189.3 30.6 158.7 0.6 34.20 53.06
1990 213.0 2.8 215.8 26.7 189.1 0.8 28.20 42.191991 228.5 2.3 230.8 27.0 203.8 0.8 31.00 44.881992 235.1 2.1 237.2 27.4 209.9 0.8 23.40 33.121993 197.6 2.7 200.3 27.2 173.0 0.7 30.30 41.891994 223.0 1.6 224.6 26.3 198.2 0.8 29.40 39.801995 203.6 3.3 206.9 28.0 178.9 0.7 32.20 42.701996 193.4 4.1 197.5 28.2 169.4 0.6 29.30 38.161997 326.5 5.7 332.2 30.0 302.2 1.1 31.30 40.081998 296.0 5.6 301.6 33.9 267.8 1.0 35.90 45.481999 305.7 3.6 309.3 37.9 271.4 1.0 32.10 40.09
2000 423.9 7.2 431.1 42.9 388.2 1.4 31.80 38.83 2001 345.8 15.4 361.2 55.1 306.1 1.1 32.40 38.682002 462.5 13.2 475.7 63.3 412.4 1.4 34.20 40.212003 508.9 20.3 529.2 61.9 467.3 1.6 36.90 42.532004 575.6 21.6 597.2 55.7 541.5 1.8 22.20 24.912005 709.6 27.6 737.2 47.4 689.9 2.3 22.80 24.792006 604.5 20.0 624.5 37.8 586.7 2.0 29.90 31.532007 507.9 19.1 527.0 39.4 487.6 1.6 32.30 33.182008 551.9 14.9 566.8 46.3 520.5 1.7 34.00 34.262009 669.9 10.4 680.3 57.5 622.9 2.0 39.50 39.50
2010 564.8 14.8 579.6 59.2 520.4 1.7 42.70 42.192011 601.0 13.5 614.5 56.3 558.2 1.8 40.40 39.152012 536.0 13.1 549.1 60.5 488.7 1.6 42.20 40.132013 561.9 14.2 576.1 72.6 503.5 1.6 43.20 40.482014 p 591.9 19.9 611.8 79.2 532.6 1.7 43.90 40.55 -- = Not available. r = revised. p = preliminary. 1/ Source: USDA, National Agricultural Statistics Service except for 1982-91, which was estimated by ERS based on available State data. 2/ Source: U.S. Department of Commerce, U.S. Census Bureau except for 1978-89 exports which are Canadian imports of U.S. spinach as reported by Statistics Canada. 3/ Constant-dollar prices were calculated using the GDP implicit price deflator, 2009=100. Source: USDA, Economic Research Service.
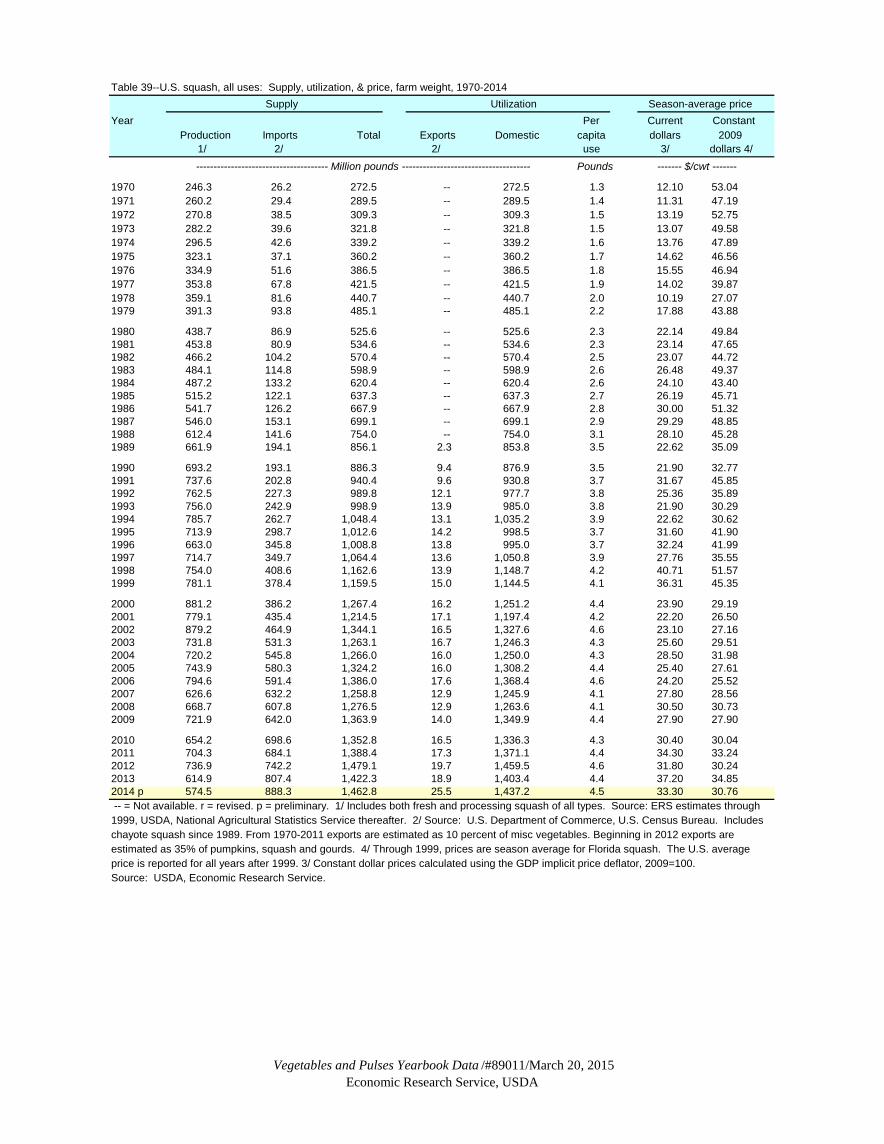
Vegetables and Pulses Yearbook Data /#89011/March 20, 2015Economic Research Service, USDA
Table 39--U.S. squash, all uses: Supply, utilization, & price, farm weight, 1970-2014 Supply Utilization Season-average price
Year Per Current Constant Production Imports Total Exports Domestic capita dollars 2009 1/ 2/ 2/ use 3/ dollars 4/
-------------------------------------- Million pounds ------------------------------------- Pounds ------- $/cwt -------
1970 246.3 26.2 272.5 -- 272.5 1.3 12.10 53.041971 260.2 29.4 289.5 -- 289.5 1.4 11.31 47.191972 270.8 38.5 309.3 -- 309.3 1.5 13.19 52.751973 282.2 39.6 321.8 -- 321.8 1.5 13.07 49.581974 296.5 42.6 339.2 -- 339.2 1.6 13.76 47.891975 323.1 37.1 360.2 -- 360.2 1.7 14.62 46.561976 334.9 51.6 386.5 -- 386.5 1.8 15.55 46.941977 353.8 67.8 421.5 -- 421.5 1.9 14.02 39.871978 359.1 81.6 440.7 -- 440.7 2.0 10.19 27.071979 391.3 93.8 485.1 -- 485.1 2.2 17.88 43.88
1980 438.7 86.9 525.6 -- 525.6 2.3 22.14 49.841981 453.8 80.9 534.6 -- 534.6 2.3 23.14 47.651982 466.2 104.2 570.4 -- 570.4 2.5 23.07 44.721983 484.1 114.8 598.9 -- 598.9 2.6 26.48 49.371984 487.2 133.2 620.4 -- 620.4 2.6 24.10 43.401985 515.2 122.1 637.3 -- 637.3 2.7 26.19 45.711986 541.7 126.2 667.9 -- 667.9 2.8 30.00 51.321987 546.0 153.1 699.1 -- 699.1 2.9 29.29 48.851988 612.4 141.6 754.0 -- 754.0 3.1 28.10 45.281989 661.9 194.1 856.1 2.3 853.8 3.5 22.62 35.09
1990 693.2 193.1 886.3 9.4 876.9 3.5 21.90 32.771991 737.6 202.8 940.4 9.6 930.8 3.7 31.67 45.851992 762.5 227.3 989.8 12.1 977.7 3.8 25.36 35.891993 756.0 242.9 998.9 13.9 985.0 3.8 21.90 30.291994 785.7 262.7 1,048.4 13.1 1,035.2 3.9 22.62 30.621995 713.9 298.7 1,012.6 14.2 998.5 3.7 31.60 41.901996 663.0 345.8 1,008.8 13.8 995.0 3.7 32.24 41.991997 714.7 349.7 1,064.4 13.6 1,050.8 3.9 27.76 35.551998 754.0 408.6 1,162.6 13.9 1,148.7 4.2 40.71 51.571999 781.1 378.4 1,159.5 15.0 1,144.5 4.1 36.31 45.35
2000 881.2 386.2 1,267.4 16.2 1,251.2 4.4 23.90 29.19 2001 779.1 435.4 1,214.5 17.1 1,197.4 4.2 22.20 26.502002 879.2 464.9 1,344.1 16.5 1,327.6 4.6 23.10 27.162003 731.8 531.3 1,263.1 16.7 1,246.3 4.3 25.60 29.512004 720.2 545.8 1,266.0 16.0 1,250.0 4.3 28.50 31.982005 743.9 580.3 1,324.2 16.0 1,308.2 4.4 25.40 27.612006 794.6 591.4 1,386.0 17.6 1,368.4 4.6 24.20 25.522007 626.6 632.2 1,258.8 12.9 1,245.9 4.1 27.80 28.562008 668.7 607.8 1,276.5 12.9 1,263.6 4.1 30.50 30.732009 721.9 642.0 1,363.9 14.0 1,349.9 4.4 27.90 27.90
2010 654.2 698.6 1,352.8 16.5 1,336.3 4.3 30.40 30.042011 704.3 684.1 1,388.4 17.3 1,371.1 4.4 34.30 33.242012 736.9 742.2 1,479.1 19.7 1,459.5 4.6 31.80 30.242013 614.9 807.4 1,422.3 18.9 1,403.4 4.4 37.20 34.852014 p 574.5 888.3 1,462.8 25.5 1,437.2 4.5 33.30 30.76 -- = Not available. r = revised. p = preliminary. 1/ Includes both fresh and processing squash of all types. Source: ERS estimates through 1999, USDA, National Agricultural Statistics Service thereafter. 2/ Source: U.S. Department of Commerce, U.S. Census Bureau. Includes chayote squash since 1989. From 1970-2011 exports are estimated as 10 percent of misc vegetables. Beginning in 2012 exports are estimated as 35% of pumpkins, squash and gourds. 4/ Through 1999, prices are season average for Florida squash. The U.S. average price is reported for all years after 1999. 3/ Constant dollar prices calculated using the GDP implicit price deflator, 2009=100. Source: USDA, Economic Research Service.

Vegetables and Pulses Yearbook Data /#89011/March 20, 2015Economic Research Service, USDA
Table 40--U.S. fresh sweet corn: Supply, utilization, & price, farm weight, 1970-2014Supply Utilization Season-average price
Year Produc- Per Current Constanttion Imports Total Exports Domestic capita dollars 20091/ 2/ 2/ use 1/ dollars 3/
-------------------------------------- Million pounds ----------------------------------- Pounds --------- $/cwt ----------
1970 1,594.2 1.2 1,595.4 -- 1,595.4 7.8 5.27 23.111971 1,547.4 0.8 1,548.2 -- 1,548.2 7.5 5.83 24.331972 1,630.4 0.7 1,631.1 -- 1,631.1 7.8 6.28 25.111973 1,675.8 0.4 1,676.2 -- 1,676.2 7.9 6.77 25.681974 1,652.9 0.7 1,653.6 -- 1,653.6 7.7 7.80 27.151975 1,678.5 0.7 1,679.2 -- 1,679.2 7.8 8.41 26.791976 1,746.7 0.4 1,747.1 -- 1,747.1 8.0 8.16 24.641977 1,663.8 0.4 1,664.2 -- 1,664.2 7.6 8.07 22.941978 1,511.6 0.6 1,512.2 45.4 1,466.8 6.6 8.84 23.481979 1,501.5 0.2 1,501.7 42.7 1,459.0 6.5 9.89 24.27
1980 1,524.5 1.0 1,525.5 45.6 1,479.8 6.5 10.70 24.091981 1,475.2 0.4 1,475.6 42.2 1,433.4 6.2 11.60 23.881982 1,443.5 0.3 1,443.8 46.6 1,397.2 6.0 12.20 23.651983 1,487.4 2.3 1,489.7 49.9 1,439.8 6.1 12.50 23.311984 1,560.7 8.6 1,569.3 48.1 1,521.2 6.4 13.10 23.591985 1,575.4 6.8 1,582.2 52.9 1,529.3 6.4 12.70 22.161986 1,505.0 7.7 1,512.7 54.2 1,458.5 6.1 13.90 23.781987 1,566.4 15.4 1,581.8 61.4 1,520.4 6.3 12.90 21.521988 1,457.4 11.9 1,469.3 43.4 1,425.9 5.8 14.80 23.851989 1,654.3 21.3 1,675.6 61.0 1,614.6 6.5 16.90 26.22
1990 1,745.5 14.7 1,760.2 73.7 1,686.5 6.7 15.00 22.441991 1,552.7 13.5 1,566.2 68.5 1,497.7 5.9 17.00 24.611992 1,847.3 11.4 1,858.7 94.2 1,764.5 6.9 14.40 20.381993 1,884.8 6.4 1,891.2 75.5 1,815.7 7.0 17.80 24.611994 2,212.1 10.6 2,222.7 74.5 2,148.3 8.2 17.20 23.291995 2,179.2 15.5 2,194.7 109.5 2,085.2 7.8 18.30 24.271996 2,312.7 23.5 2,336.2 91.0 2,245.3 8.3 16.90 22.011997 2,364.1 23.0 2,387.1 124.6 2,262.6 8.3 17.70 22.661998 2,630.7 40.0 2,670.7 93.6 2,577.1 9.3 17.20 21.791999 2,576.2 53.1 2,629.3 89.2 2,540.2 9.1 16.90 21.11
2000 2,602.7 51.7 2,654.4 101.7 2,552.7 9.0 18.50 22.592001 2,681.5 49.0 2,730.5 113.3 2,617.2 9.2 19.50 23.282002 2,648.0 52.1 2,700.1 114.7 2,585.4 9.0 19.20 22.572003 2,749.2 49.7 2,798.9 133.4 2,665.5 9.2 19.20 22.132004 2,712.6 51.0 2,763.6 133.5 2,630.1 9.0 19.20 21.542005 2,641.6 56.8 2,698.4 136.0 2,562.5 8.7 22.10 24.022006 2,574.5 59.8 2,634.3 144.8 2,489.5 8.3 23.00 24.262007 2,850.4 66.6 2,917.0 131.2 2,785.8 9.2 22.70 23.322008 2,889.9 77.4 2,967.3 180.7 2,786.6 9.1 25.90 26.102009 2,883.9 85.7 2,969.6 149.1 2,820.5 9.2 29.30 29.30
2010 2,914.9 122.4 3,037.3 172.7 2,864.6 9.2 25.90 25.592011 2,633.6 105.9 2,739.5 191.0 2,548.5 8.2 26.70 25.872012 2,791.0 108.5 2,899.5 172.2 2,727.3 8.7 26.30 25.012013 2,856.1 106.2 2,962.3 155.1 2,807.3 8.9 28.20 26.422014 p 2,534.6 108.1 2,642.7 136.8 2,506.0 7.9 28.90 26.69 -- = Not available. r = revised. p = preliminary. 1/ Source: USDA, National Agricultural Statistics Service. Production data were adjusted by ERS for 1970-81 to account for States not included in NASS estimates. 2/ Source: U.S. Department of Commerce, U.S. Census Bureau. From 1978-89,exports were adjusted using Canadian import data. 3/ Constant-dollar prices were calculated using the GDP implicit deflator, 2009=100. Source: USDA, Economic Research Service.

Vegetables and Pulses Yearbook Data /#89011/March 20, 2015Economic Research Service, USDA
Table 41--U.S. sweet potatoes, all uses: Supply, utilization, & price, farm weight, 1970-2014 Supply Utilization Season-average price
Year Seed Feed, Per Current ConstantProduction Imports Beginning Total Exports use shrink & Ending Domestic capita dollars 2009
1/ 2/ stocks 3/ 2/ 4/ loss 5/ stocks 3/ use 1/ dollars 6/
---------------------------------------------------- Million pounds ----------------------------------------------------- Pounds ------- $/cwt -------
1970 1,316.0 -- -- 1,316.0 -- 68.5 137.6 -- 1,109.9 5.4 4.38 19.211971 1,149.4 -- 158.6 1,308.0 -- 68.0 111.5 105.5 1,128.5 4.9 5.22 21.781972 1,217.0 -- 105.5 1,322.5 -- 70.7 91.4 141.3 1,160.4 4.9 5.73 22.921973 1,215.6 -- 141.3 1,356.9 -- 80.5 95.6 114.4 1,180.8 5.0 7.32 27.761974 1,333.9 -- 114.4 1,448.3 -- 79.2 102.1 219.7 1,267.0 4.9 7.34 25.541975 1,289.1 -- 219.7 1,508.8 -- 87.6 95.9 166.5 1,325.3 5.4 8.59 27.361976 1,327.3 -- 166.5 1,493.8 -- 76.9 114.1 129.1 1,302.8 5.4 7.50 22.651977 1,188.5 -- 129.1 1,317.6 -- 91.6 95.1 92.4 1,130.9 4.7 10.50 29.851978 1,311.5 14.2 92.4 1,418.1 17.5 101.7 76.4 131.2 1,222.5 4.9 10.60 28.161979 1,337.0 13.1 131.2 1,481.3 19.4 92.5 81.2 147.9 1,288.2 5.1 8.92 21.89
1980 1,095.3 2.5 147.9 1,245.8 17.4 92.4 67.8 69.2 1,068.2 4.4 13.60 30.611981 1,279.9 7.9 69.2 1,357.0 19.8 110.8 60.6 91.5 1,165.7 4.7 13.60 28.001982 1,483.3 10.3 91.5 1,585.1 13.6 98.9 107.6 112.9 1,364.9 5.4 8.03 15.571983 1,208.3 16.7 112.9 1,337.9 14.7 104.7 80.2 87.4 1,138.3 4.5 13.60 25.361984 1,290.2 17.4 87.4 1,395.0 16.7 105.0 71.3 60.0 1,202.0 4.8 14.00 25.211985 1,457.3 21.6 60.0 1,538.8 18.2 103.9 72.9 89.4 1,343.8 5.3 8.81 15.371986 1,236.8 17.0 89.4 1,343.3 19.4 100.2 61.8 136.2 1,161.9 4.3 10.90 18.651987 1,161.1 18.3 136.2 1,315.6 17.1 98.8 58.1 97.1 1,141.8 4.3 11.60 19.351988 1,094.5 18.4 97.1 1,210.0 14.7 95.3 54.7 82.1 1,045.3 3.9 12.90 20.791989 1,135.8 20.1 82.1 1,238.1 13.9 96.7 56.8 100.0 1,070.7 3.9 16.40 25.44
1990 1,259.4 19.1 -- 1,278.5 14.7 100.5 63.0 -- 1,100.4 4.4 9.70 14.511991 1,120.3 17.2 -- 1,137.5 16.1 85.3 56.0 -- 980.2 3.9 13.30 19.261992 1,200.5 17.4 -- 1,217.9 19.3 91.6 60.0 -- 1,047.0 4.1 12.20 17.271993 1,102.7 16.0 -- 1,118.7 23.0 88.1 55.1 -- 952.5 3.7 15.10 20.881994 1,338.0 17.8 -- 1,355.8 22.0 91.2 66.9 -- 1,175.6 4.5 14.00 18.951995 1,282.1 22.0 -- 1,304.1 26.0 92.4 64.1 -- 1,121.6 4.2 15.90 21.091996 1,321.6 21.3 -- 1,342.9 27.2 93.5 66.1 -- 1,156.2 4.3 14.40 18.751997 1,332.7 17.3 -- 1,350.0 29.7 90.9 66.6 -- 1,162.9 4.3 15.80 20.231998 1,236.5 17.9 -- 1,254.4 37.6 92.5 61.8 -- 1,062.4 3.8 15.30 19.381999 1,222.1 17.7 -- 1,239.8 40.7 99.5 61.1 -- 1,038.5 3.7 17.60 21.98
2000 1,378.0 15.3 -- 1,393.3 39.1 98.0 68.9 -- 1,187.3 4.2 15.30 18.682001 1,451.5 13.7 -- 1,465.2 47.7 98.4 72.6 -- 1,246.5 4.4 15.30 18.272002 1,279.9 14.7 -- 1,294.6 52.0 96.5 64.0 -- 1,082.1 3.8 16.80 19.752003 1,589.1 11.1 -- 1,600.2 59.3 95.9 79.5 -- 1,365.6 4.7 19.20 22.132004 1,611.2 11.5 -- 1,622.7 64.9 97.0 80.6 -- 1,380.2 4.7 17.50 19.632005 1,573.0 13.0 -- 1,586.0 71.5 91.1 78.7 -- 1,344.8 4.5 18.10 19.682006 1,640.1 15.5 -- 1,655.6 86.1 95.8 82.0 -- 1,391.7 4.7 18.20 19.192007 1,807.0 17.4 -- 1,824.4 96.2 100.6 90.4 -- 1,537.2 5.1 18.30 18.802008 1,844.3 17.0 -- 1,861.3 120.8 103.3 92.2 -- 1,545.0 5.1 21.20 21.362009 1,946.9 23.6 -- 1,970.5 148.4 110.0 97.3 -- 1,614.7 5.3 21.80 21.80
2010 2,384.5 22.3 -- 2,406.8 204.1 119.9 0.3 -- 2,082.4 6.7 19.80 19.562011 2,696.4 23.5 -- 2,719.9 233.4 133.7 0.4 -- 2,352.4 7.5 18.80 18.222012 2,648.2 26.8 -- 2,675.0 246.3 130.6 0.4 -- 2,297.7 7.3 17.40 16.552013 2,478.5 34.1 -- 2,512.6 280.7 115.8 0.3 -- 2,115.8 6.7 24.10 22.582014 p 2,958.4 36.1 -- 2,994.5 311.0 137.4 147.9 -- 2,398.2 7.5 23.60 21.80 -- = Not available. r = revised. p = preliminary. 1/ Source: USDA, National Agricultural Statistics Service. 2/ Source: U.S. Department of Commerce, U.S. Census Bureau. Excludes yams. 3/ Canned stocks estimates were discontinued in 1989. 4/ Seed use estimated byERS. 5/ Estimated by ERS as 5 percent of production. 6/ Deflated by the GDP implicit price deflator, 2009=100. Source: USDA, Economic Research Service.
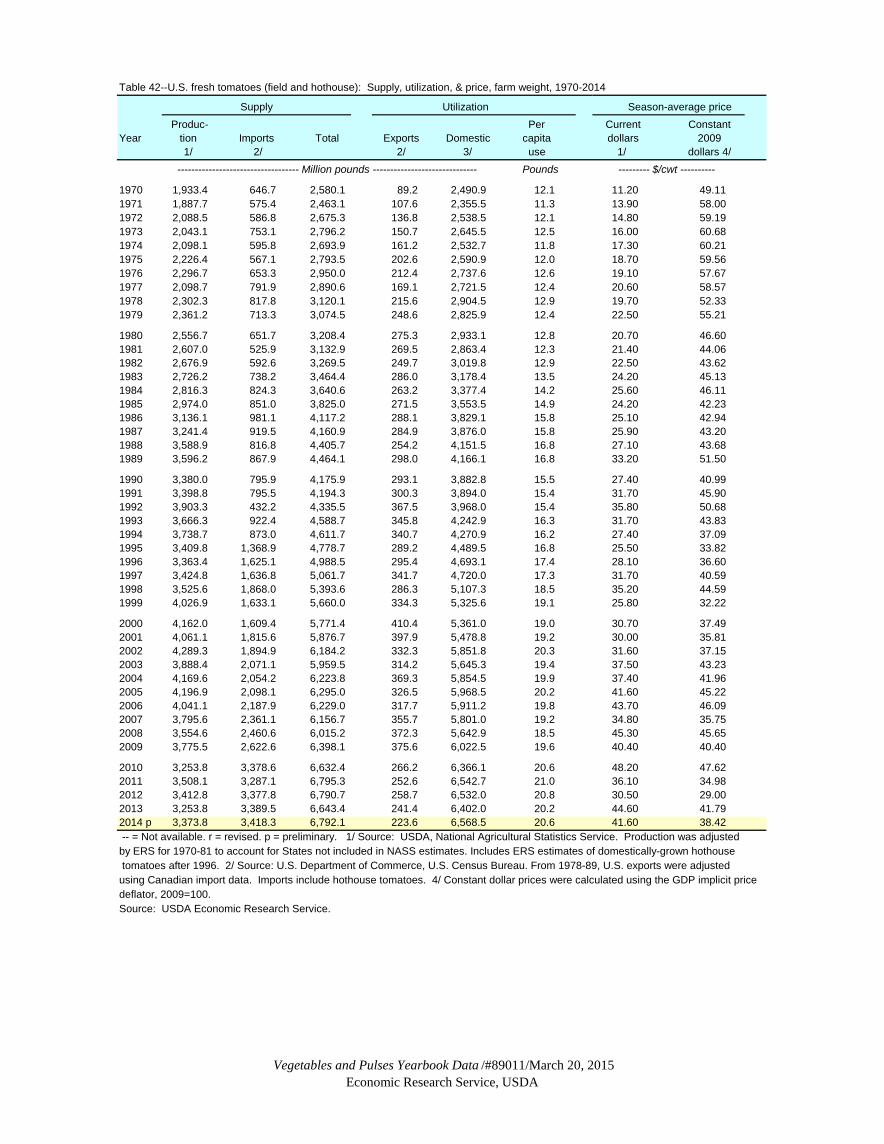
Vegetables and Pulses Yearbook Data /#89011/March 20, 2015Economic Research Service, USDA
Table 42--U.S. fresh tomatoes (field and hothouse): Supply, utilization, & price, farm weight, 1970-2014
Supply Utilization Season-average price Produc- Per Current Constant
Year tion Imports Total Exports Domestic capita dollars 20091/ 2/ 2/ 3/ use 1/ dollars 4/
----------------------------------- Million pounds ------------------------------ Pounds --------- $/cwt ----------
1970 1,933.4 646.7 2,580.1 89.2 2,490.9 12.1 11.20 49.111971 1,887.7 575.4 2,463.1 107.6 2,355.5 11.3 13.90 58.001972 2,088.5 586.8 2,675.3 136.8 2,538.5 12.1 14.80 59.191973 2,043.1 753.1 2,796.2 150.7 2,645.5 12.5 16.00 60.681974 2,098.1 595.8 2,693.9 161.2 2,532.7 11.8 17.30 60.211975 2,226.4 567.1 2,793.5 202.6 2,590.9 12.0 18.70 59.561976 2,296.7 653.3 2,950.0 212.4 2,737.6 12.6 19.10 57.671977 2,098.7 791.9 2,890.6 169.1 2,721.5 12.4 20.60 58.571978 2,302.3 817.8 3,120.1 215.6 2,904.5 12.9 19.70 52.331979 2,361.2 713.3 3,074.5 248.6 2,825.9 12.4 22.50 55.21
1980 2,556.7 651.7 3,208.4 275.3 2,933.1 12.8 20.70 46.601981 2,607.0 525.9 3,132.9 269.5 2,863.4 12.3 21.40 44.061982 2,676.9 592.6 3,269.5 249.7 3,019.8 12.9 22.50 43.621983 2,726.2 738.2 3,464.4 286.0 3,178.4 13.5 24.20 45.131984 2,816.3 824.3 3,640.6 263.2 3,377.4 14.2 25.60 46.111985 2,974.0 851.0 3,825.0 271.5 3,553.5 14.9 24.20 42.231986 3,136.1 981.1 4,117.2 288.1 3,829.1 15.8 25.10 42.941987 3,241.4 919.5 4,160.9 284.9 3,876.0 15.8 25.90 43.201988 3,588.9 816.8 4,405.7 254.2 4,151.5 16.8 27.10 43.681989 3,596.2 867.9 4,464.1 298.0 4,166.1 16.8 33.20 51.50
1990 3,380.0 795.9 4,175.9 293.1 3,882.8 15.5 27.40 40.991991 3,398.8 795.5 4,194.3 300.3 3,894.0 15.4 31.70 45.901992 3,903.3 432.2 4,335.5 367.5 3,968.0 15.4 35.80 50.681993 3,666.3 922.4 4,588.7 345.8 4,242.9 16.3 31.70 43.831994 3,738.7 873.0 4,611.7 340.7 4,270.9 16.2 27.40 37.091995 3,409.8 1,368.9 4,778.7 289.2 4,489.5 16.8 25.50 33.821996 3,363.4 1,625.1 4,988.5 295.4 4,693.1 17.4 28.10 36.601997 3,424.8 1,636.8 5,061.7 341.7 4,720.0 17.3 31.70 40.591998 3,525.6 1,868.0 5,393.6 286.3 5,107.3 18.5 35.20 44.591999 4,026.9 1,633.1 5,660.0 334.3 5,325.6 19.1 25.80 32.22
2000 4,162.0 1,609.4 5,771.4 410.4 5,361.0 19.0 30.70 37.492001 4,061.1 1,815.6 5,876.7 397.9 5,478.8 19.2 30.00 35.812002 4,289.3 1,894.9 6,184.2 332.3 5,851.8 20.3 31.60 37.152003 3,888.4 2,071.1 5,959.5 314.2 5,645.3 19.4 37.50 43.232004 4,169.6 2,054.2 6,223.8 369.3 5,854.5 19.9 37.40 41.962005 4,196.9 2,098.1 6,295.0 326.5 5,968.5 20.2 41.60 45.222006 4,041.1 2,187.9 6,229.0 317.7 5,911.2 19.8 43.70 46.092007 3,795.6 2,361.1 6,156.7 355.7 5,801.0 19.2 34.80 35.752008 3,554.6 2,460.6 6,015.2 372.3 5,642.9 18.5 45.30 45.652009 3,775.5 2,622.6 6,398.1 375.6 6,022.5 19.6 40.40 40.40
2010 3,253.8 3,378.6 6,632.4 266.2 6,366.1 20.6 48.20 47.622011 3,508.1 3,287.1 6,795.3 252.6 6,542.7 21.0 36.10 34.982012 3,412.8 3,377.8 6,790.7 258.7 6,532.0 20.8 30.50 29.002013 3,253.8 3,389.5 6,643.4 241.4 6,402.0 20.2 44.60 41.792014 p 3,373.8 3,418.3 6,792.1 223.6 6,568.5 20.6 41.60 38.42 -- = Not available. r = revised. p = preliminary. 1/ Source: USDA, National Agricultural Statistics Service. Production was adjusted by ERS for 1970-81 to account for States not included in NASS estimates. Includes ERS estimates of domestically-grown hothouse tomatoes after 1996. 2/ Source: U.S. Department of Commerce, U.S. Census Bureau. From 1978-89, U.S. exports were adjusted using Canadian import data. Imports include hothouse tomatoes. 4/ Constant dollar prices were calculated using the GDP implicit price deflator, 2009=100. Source: USDA Economic Research Service.
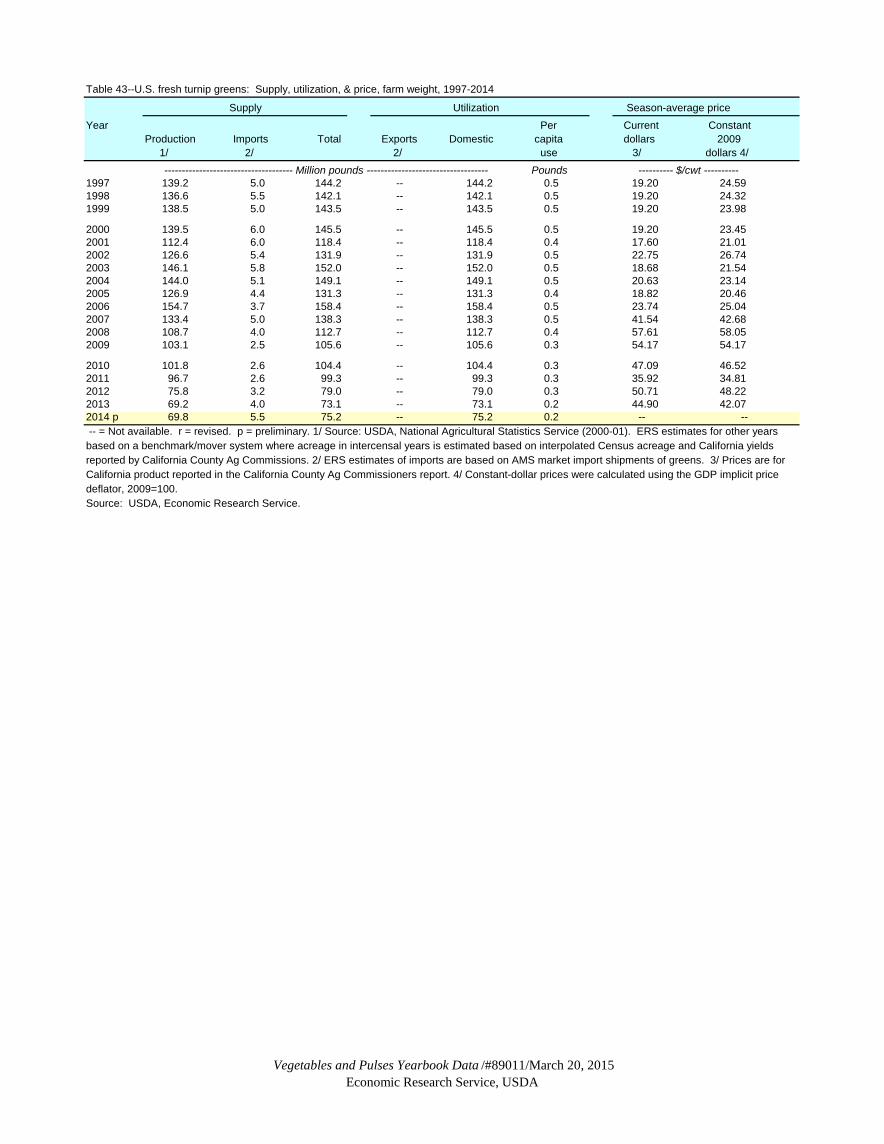
Vegetables and Pulses Yearbook Data /#89011/March 20, 2015Economic Research Service, USDA
Table 43--U.S. fresh turnip greens: Supply, utilization, & price, farm weight, 1997-2014
Supply Utilization Season-average priceYear Per Current Constant
Production Imports Total Exports Domestic capita dollars 2009 1/ 2/ 2/ use 3/ dollars 4/
------------------------------------- Million pounds ----------------------------------- Pounds ---------- $/cwt ----------1997 139.2 5.0 144.2 -- 144.2 0.5 19.20 24.591998 136.6 5.5 142.1 -- 142.1 0.5 19.20 24.321999 138.5 5.0 143.5 -- 143.5 0.5 19.20 23.98
2000 139.5 6.0 145.5 -- 145.5 0.5 19.20 23.45 2001 112.4 6.0 118.4 -- 118.4 0.4 17.60 21.012002 126.6 5.4 131.9 -- 131.9 0.5 22.75 26.742003 146.1 5.8 152.0 -- 152.0 0.5 18.68 21.542004 144.0 5.1 149.1 -- 149.1 0.5 20.63 23.142005 126.9 4.4 131.3 -- 131.3 0.4 18.82 20.462006 154.7 3.7 158.4 -- 158.4 0.5 23.74 25.042007 133.4 5.0 138.3 -- 138.3 0.5 41.54 42.682008 108.7 4.0 112.7 -- 112.7 0.4 57.61 58.052009 103.1 2.5 105.6 -- 105.6 0.3 54.17 54.17
2010 101.8 2.6 104.4 -- 104.4 0.3 47.09 46.522011 96.7 2.6 99.3 -- 99.3 0.3 35.92 34.812012 75.8 3.2 79.0 -- 79.0 0.3 50.71 48.222013 69.2 4.0 73.1 -- 73.1 0.2 44.90 42.072014 p 69.8 5.5 75.2 -- 75.2 0.2 -- -- -- = Not available. r = revised. p = preliminary. 1/ Source: USDA, National Agricultural Statistics Service (2000-01). ERS estimates for other years based on a benchmark/mover system where acreage in intercensal years is estimated based on interpolated Census acreage and California yieldsreported by California County Ag Commissions. 2/ ERS estimates of imports are based on AMS market import shipments of greens. 3/ Prices are forCalifornia product reported in the California County Ag Commissioners report. 4/ Constant-dollar prices were calculated using the GDP implicit price deflator, 2009=100. Source: USDA, Economic Research Service.
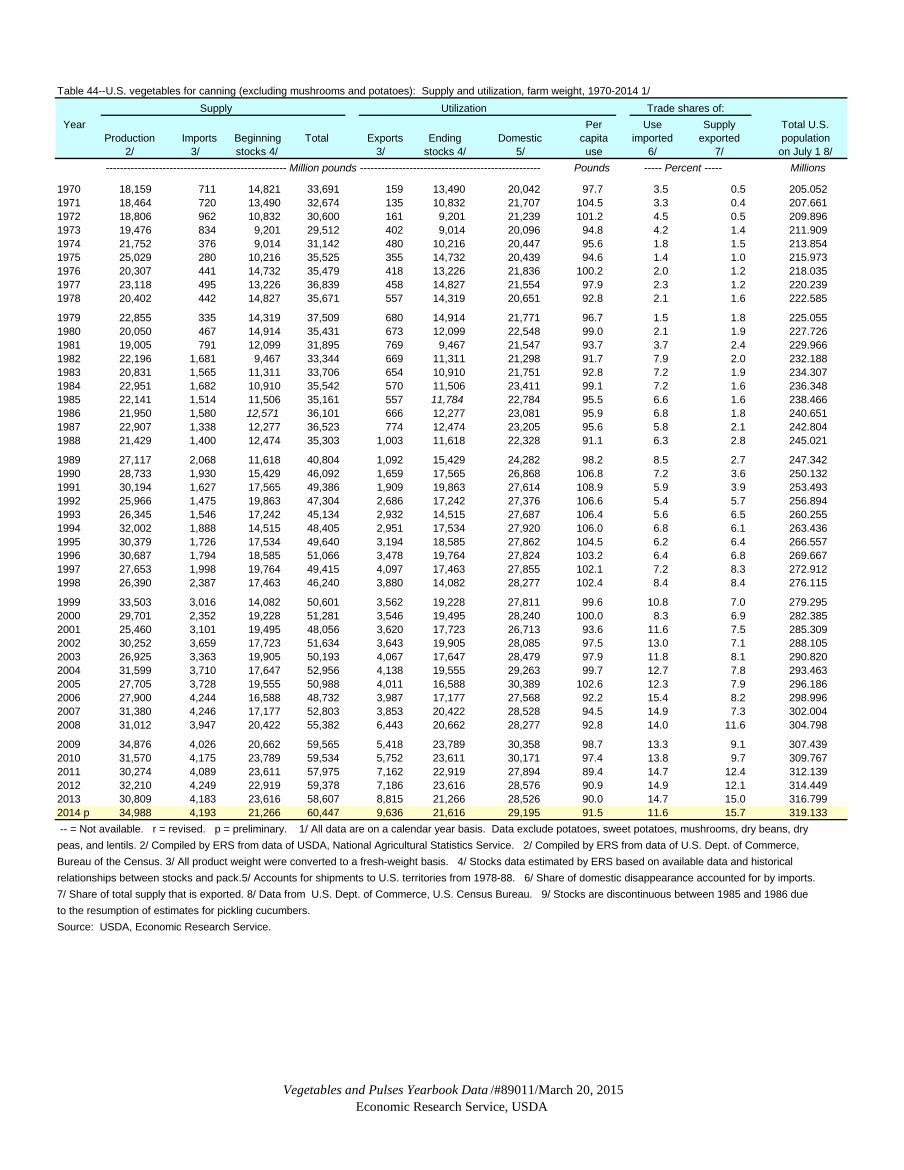
Vegetables and Pulses Yearbook Data /#89011/March 20, 2015Economic Research Service, USDA
Table 44--U.S. vegetables for canning (excluding mushrooms and potatoes): Supply and utilization, farm weight, 1970-2014 1/ Supply Utilization Trade shares of:
Year Per Use Supply Total U.S.Production Imports Beginning Total Exports Ending Domestic capita imported exported population
2/ 3/ stocks 4/ 3/ stocks 4/ 5/ use 6/ 7/ on July 1 8/ --------------------------------------------------- Million pounds --------------------------------------------------- Pounds ----- Percent ----- Millions
1970 18,159 711 14,821 33,691 159 13,490 20,042 97.7 3.5 0.5 205.0521971 18,464 720 13,490 32,674 135 10,832 21,707 104.5 3.3 0.4 207.6611972 18,806 962 10,832 30,600 161 9,201 21,239 101.2 4.5 0.5 209.8961973 19,476 834 9,201 29,512 402 9,014 20,096 94.8 4.2 1.4 211.9091974 21,752 376 9,014 31,142 480 10,216 20,447 95.6 1.8 1.5 213.8541975 25,029 280 10,216 35,525 355 14,732 20,439 94.6 1.4 1.0 215.9731976 20,307 441 14,732 35,479 418 13,226 21,836 100.2 2.0 1.2 218.0351977 23,118 495 13,226 36,839 458 14,827 21,554 97.9 2.3 1.2 220.2391978 20,402 442 14,827 35,671 557 14,319 20,651 92.8 2.1 1.6 222.585
1979 22,855 335 14,319 37,509 680 14,914 21,771 96.7 1.5 1.8 225.0551980 20,050 467 14,914 35,431 673 12,099 22,548 99.0 2.1 1.9 227.7261981 19,005 791 12,099 31,895 769 9,467 21,547 93.7 3.7 2.4 229.9661982 22,196 1,681 9,467 33,344 669 11,311 21,298 91.7 7.9 2.0 232.1881983 20,831 1,565 11,311 33,706 654 10,910 21,751 92.8 7.2 1.9 234.3071984 22,951 1,682 10,910 35,542 570 11,506 23,411 99.1 7.2 1.6 236.3481985 22,141 1,514 11,506 35,161 557 11,784 22,784 95.5 6.6 1.6 238.4661986 21,950 1,580 12,571 36,101 666 12,277 23,081 95.9 6.8 1.8 240.6511987 22,907 1,338 12,277 36,523 774 12,474 23,205 95.6 5.8 2.1 242.8041988 21,429 1,400 12,474 35,303 1,003 11,618 22,328 91.1 6.3 2.8 245.021
1989 27,117 2,068 11,618 40,804 1,092 15,429 24,282 98.2 8.5 2.7 247.3421990 28,733 1,930 15,429 46,092 1,659 17,565 26,868 106.8 7.2 3.6 250.1321991 30,194 1,627 17,565 49,386 1,909 19,863 27,614 108.9 5.9 3.9 253.4931992 25,966 1,475 19,863 47,304 2,686 17,242 27,376 106.6 5.4 5.7 256.8941993 26,345 1,546 17,242 45,134 2,932 14,515 27,687 106.4 5.6 6.5 260.2551994 32,002 1,888 14,515 48,405 2,951 17,534 27,920 106.0 6.8 6.1 263.4361995 30,379 1,726 17,534 49,640 3,194 18,585 27,862 104.5 6.2 6.4 266.5571996 30,687 1,794 18,585 51,066 3,478 19,764 27,824 103.2 6.4 6.8 269.6671997 27,653 1,998 19,764 49,415 4,097 17,463 27,855 102.1 7.2 8.3 272.9121998 26,390 2,387 17,463 46,240 3,880 14,082 28,277 102.4 8.4 8.4 276.115
1999 33,503 3,016 14,082 50,601 3,562 19,228 27,811 99.6 10.8 7.0 279.2952000 29,701 2,352 19,228 51,281 3,546 19,495 28,240 100.0 8.3 6.9 282.3852001 25,460 3,101 19,495 48,056 3,620 17,723 26,713 93.6 11.6 7.5 285.3092002 30,252 3,659 17,723 51,634 3,643 19,905 28,085 97.5 13.0 7.1 288.1052003 26,925 3,363 19,905 50,193 4,067 17,647 28,479 97.9 11.8 8.1 290.8202004 31,599 3,710 17,647 52,956 4,138 19,555 29,263 99.7 12.7 7.8 293.4632005 27,705 3,728 19,555 50,988 4,011 16,588 30,389 102.6 12.3 7.9 296.1862006 27,900 4,244 16,588 48,732 3,987 17,177 27,568 92.2 15.4 8.2 298.9962007 31,380 4,246 17,177 52,803 3,853 20,422 28,528 94.5 14.9 7.3 302.0042008 31,012 3,947 20,422 55,382 6,443 20,662 28,277 92.8 14.0 11.6 304.798
2009 34,876 4,026 20,662 59,565 5,418 23,789 30,358 98.7 13.3 9.1 307.4392010 31,570 4,175 23,789 59,534 5,752 23,611 30,171 97.4 13.8 9.7 309.7672011 30,274 4,089 23,611 57,975 7,162 22,919 27,894 89.4 14.7 12.4 312.1392012 32,210 4,249 22,919 59,378 7,186 23,616 28,576 90.9 14.9 12.1 314.4492013 30,809 4,183 23,616 58,607 8,815 21,266 28,526 90.0 14.7 15.0 316.7992014 p 34,988 4,193 21,266 60,447 9,636 21,616 29,195 91.5 11.6 15.7 319.133 -- = Not available. r = revised. p = preliminary. 1/ All data are on a calendar year basis. Data exclude potatoes, sweet potatoes, mushrooms, dry beans, dry peas, and lentils. 2/ Compiled by ERS from data of USDA, National Agricultural Statistics Service. 2/ Compiled by ERS from data of U.S. Dept. of Commerce, Bureau of the Census. 3/ All product weight were converted to a fresh-weight basis. 4/ Stocks data estimated by ERS based on available data and historical relationships between stocks and pack.5/ Accounts for shipments to U.S. territories from 1978-88. 6/ Share of domestic disappearance accounted for by imports. 7/ Share of total supply that is exported. 8/ Data from U.S. Dept. of Commerce, U.S. Census Bureau. 9/ Stocks are discontinuous between 1985 and 1986 due to the resumption of estimates for pickling cucumbers.Source: USDA, Economic Research Service.
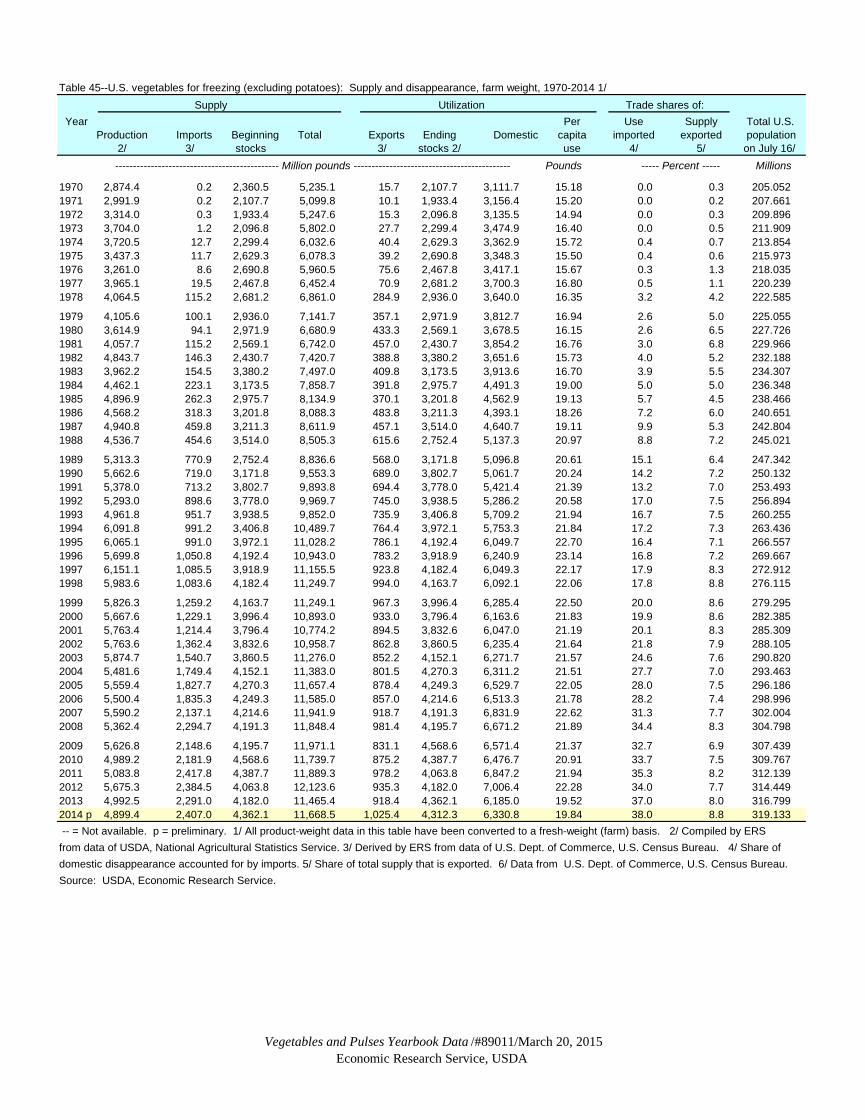
Vegetables and Pulses Yearbook Data /#89011/March 20, 2015Economic Research Service, USDA
Table 45--U.S. vegetables for freezing (excluding potatoes): Supply and disappearance, farm weight, 1970-2014 1/ Supply Utilization Trade shares of:
Year Per Use Supply Total U.S.Production Imports Beginning Total Exports Ending Domestic capita imported exported population
2/ 3/ stocks 3/ stocks 2/ use 4/ 5/ on July 16/ ---------------------------------------------- Million pounds -------------------------------------------- Pounds ----- Percent ----- Millions
1970 2,874.4 0.2 2,360.5 5,235.1 15.7 2,107.7 3,111.7 15.18 0.0 0.3 205.0521971 2,991.9 0.2 2,107.7 5,099.8 10.1 1,933.4 3,156.4 15.20 0.0 0.2 207.6611972 3,314.0 0.3 1,933.4 5,247.6 15.3 2,096.8 3,135.5 14.94 0.0 0.3 209.8961973 3,704.0 1.2 2,096.8 5,802.0 27.7 2,299.4 3,474.9 16.40 0.0 0.5 211.9091974 3,720.5 12.7 2,299.4 6,032.6 40.4 2,629.3 3,362.9 15.72 0.4 0.7 213.8541975 3,437.3 11.7 2,629.3 6,078.3 39.2 2,690.8 3,348.3 15.50 0.4 0.6 215.9731976 3,261.0 8.6 2,690.8 5,960.5 75.6 2,467.8 3,417.1 15.67 0.3 1.3 218.0351977 3,965.1 19.5 2,467.8 6,452.4 70.9 2,681.2 3,700.3 16.80 0.5 1.1 220.2391978 4,064.5 115.2 2,681.2 6,861.0 284.9 2,936.0 3,640.0 16.35 3.2 4.2 222.585
1979 4,105.6 100.1 2,936.0 7,141.7 357.1 2,971.9 3,812.7 16.94 2.6 5.0 225.0551980 3,614.9 94.1 2,971.9 6,680.9 433.3 2,569.1 3,678.5 16.15 2.6 6.5 227.7261981 4,057.7 115.2 2,569.1 6,742.0 457.0 2,430.7 3,854.2 16.76 3.0 6.8 229.9661982 4,843.7 146.3 2,430.7 7,420.7 388.8 3,380.2 3,651.6 15.73 4.0 5.2 232.1881983 3,962.2 154.5 3,380.2 7,497.0 409.8 3,173.5 3,913.6 16.70 3.9 5.5 234.3071984 4,462.1 223.1 3,173.5 7,858.7 391.8 2,975.7 4,491.3 19.00 5.0 5.0 236.3481985 4,896.9 262.3 2,975.7 8,134.9 370.1 3,201.8 4,562.9 19.13 5.7 4.5 238.4661986 4,568.2 318.3 3,201.8 8,088.3 483.8 3,211.3 4,393.1 18.26 7.2 6.0 240.6511987 4,940.8 459.8 3,211.3 8,611.9 457.1 3,514.0 4,640.7 19.11 9.9 5.3 242.8041988 4,536.7 454.6 3,514.0 8,505.3 615.6 2,752.4 5,137.3 20.97 8.8 7.2 245.021
1989 5,313.3 770.9 2,752.4 8,836.6 568.0 3,171.8 5,096.8 20.61 15.1 6.4 247.3421990 5,662.6 719.0 3,171.8 9,553.3 689.0 3,802.7 5,061.7 20.24 14.2 7.2 250.1321991 5,378.0 713.2 3,802.7 9,893.8 694.4 3,778.0 5,421.4 21.39 13.2 7.0 253.4931992 5,293.0 898.6 3,778.0 9,969.7 745.0 3,938.5 5,286.2 20.58 17.0 7.5 256.8941993 4,961.8 951.7 3,938.5 9,852.0 735.9 3,406.8 5,709.2 21.94 16.7 7.5 260.2551994 6,091.8 991.2 3,406.8 10,489.7 764.4 3,972.1 5,753.3 21.84 17.2 7.3 263.4361995 6,065.1 991.0 3,972.1 11,028.2 786.1 4,192.4 6,049.7 22.70 16.4 7.1 266.5571996 5,699.8 1,050.8 4,192.4 10,943.0 783.2 3,918.9 6,240.9 23.14 16.8 7.2 269.6671997 6,151.1 1,085.5 3,918.9 11,155.5 923.8 4,182.4 6,049.3 22.17 17.9 8.3 272.9121998 5,983.6 1,083.6 4,182.4 11,249.7 994.0 4,163.7 6,092.1 22.06 17.8 8.8 276.115
1999 5,826.3 1,259.2 4,163.7 11,249.1 967.3 3,996.4 6,285.4 22.50 20.0 8.6 279.2952000 5,667.6 1,229.1 3,996.4 10,893.0 933.0 3,796.4 6,163.6 21.83 19.9 8.6 282.3852001 5,763.4 1,214.4 3,796.4 10,774.2 894.5 3,832.6 6,047.0 21.19 20.1 8.3 285.3092002 5,763.6 1,362.4 3,832.6 10,958.7 862.8 3,860.5 6,235.4 21.64 21.8 7.9 288.1052003 5,874.7 1,540.7 3,860.5 11,276.0 852.2 4,152.1 6,271.7 21.57 24.6 7.6 290.8202004 5,481.6 1,749.4 4,152.1 11,383.0 801.5 4,270.3 6,311.2 21.51 27.7 7.0 293.4632005 5,559.4 1,827.7 4,270.3 11,657.4 878.4 4,249.3 6,529.7 22.05 28.0 7.5 296.1862006 5,500.4 1,835.3 4,249.3 11,585.0 857.0 4,214.6 6,513.3 21.78 28.2 7.4 298.9962007 5,590.2 2,137.1 4,214.6 11,941.9 918.7 4,191.3 6,831.9 22.62 31.3 7.7 302.0042008 5,362.4 2,294.7 4,191.3 11,848.4 981.4 4,195.7 6,671.2 21.89 34.4 8.3 304.798
2009 5,626.8 2,148.6 4,195.7 11,971.1 831.1 4,568.6 6,571.4 21.37 32.7 6.9 307.4392010 4,989.2 2,181.9 4,568.6 11,739.7 875.2 4,387.7 6,476.7 20.91 33.7 7.5 309.7672011 5,083.8 2,417.8 4,387.7 11,889.3 978.2 4,063.8 6,847.2 21.94 35.3 8.2 312.1392012 5,675.3 2,384.5 4,063.8 12,123.6 935.3 4,182.0 7,006.4 22.28 34.0 7.7 314.4492013 4,992.5 2,291.0 4,182.0 11,465.4 918.4 4,362.1 6,185.0 19.52 37.0 8.0 316.7992014 p 4,899.4 2,407.0 4,362.1 11,668.5 1,025.4 4,312.3 6,330.8 19.84 38.0 8.8 319.133 -- = Not available. p = preliminary. 1/ All product-weight data in this table have been converted to a fresh-weight (farm) basis. 2/ Compiled by ERS from data of USDA, National Agricultural Statistics Service. 3/ Derived by ERS from data of U.S. Dept. of Commerce, U.S. Census Bureau. 4/ Share of domestic disappearance accounted for by imports. 5/ Share of total supply that is exported. 6/ Data from U.S. Dept. of Commerce, U.S. Census Bureau. Source: USDA, Economic Research Service.

Vegetables and Pulses Yearbook Data /#89011/March 20, 2015Economic Research Service, USDA
Table 46--U.S. asparagus for canning: Supply, utilization, and price, farm weight, 1970-2014 Supply Utilization Season-average price
Year Ending Per Current Constant Production Imports Beginning Total Exports stocks Domestic capita dollars 2009
1/ 2/ stocks 2/ 1/ use 1/ dollars 3/ ---------------------------------------------- Million pounds -------------------------------------------- Pounds ---------- $/ton ----------
1970 129.8 3.1 54.9 187.8 8.9 56.9 122.0 0.59 381.00 1,670.691971 134.4 6.6 56.9 197.9 8.9 58.4 130.6 0.63 419.00 1,748.461972 123.4 12.0 58.4 193.8 5.3 59.9 128.6 0.61 457.00 1,827.631973 123.6 15.3 59.9 198.8 4.5 57.6 136.7 0.64 486.00 1,843.281974 149.4 10.8 57.6 217.8 4.8 100.3 112.6 0.53 532.00 1,851.471975 86.4 9.8 100.3 196.5 6.1 64.3 126.1 0.58 516.00 1,643.571976 82.5 7.4 64.3 154.2 3.4 34.5 116.2 0.53 560.00 1,690.871977 96.9 12.9 34.5 144.3 3.2 41.7 99.4 0.45 650.00 1,848.011978 86.5 7.0 41.7 135.1 4.1 46.6 84.4 0.38 755.00 2,005.68
1979 78.9 6.3 9.9 95.1 5.0 54.4 37.6 0.32 893.00 2,191.411980 69.1 9.8 22.0 100.9 5.5 44.8 50.6 0.36 816.00 1,836.801981 69.9 5.0 44.8 119.7 6.0 26.8 86.8 0.38 941.00 1,937.331982 68.9 5.6 26.8 101.3 3.3 31.9 66.1 0.28 -- --1983 67.9 3.6 31.9 103.4 2.9 31.2 69.3 0.30 -- --1984 66.9 8.0 31.2 106.2 2.6 28.4 75.2 0.32 927.00 1,669.521985 67.7 6.4 28.4 102.5 1.9 31.4 25.5 0.29 951.00 1,659.631986 58.7 6.2 31.4 96.2 1.7 24.2 70.3 0.29 925.00 1,582.331987 66.3 7.2 24.2 51.7 3.2 30.3 28.3 0.26 944.00 1,574.671988 65.9 6.7 30.3 102.9 4.4 17.3 81.2 0.33 997.00 1,606.82
1989 77.7 4.1 17.3 99.1 3.8 20.4 19.2 0.30 937.00 1,453.611990 76.7 2.4 20.4 99.5 4.7 20.2 74.7 0.30 991.00 1,482.531991 70.8 2.2 20.2 93.1 3.8 18.6 70.7 0.28 951.00 1,376.881992 77.3 2.0 18.6 42.2 3.9 20.3 18.0 0.29 936.00 1,324.951993 70.8 4.1 20.3 95.2 4.0 18.6 72.6 0.28 991.00 1,370.201994 67.7 2.2 18.6 88.6 5.7 17.8 65.1 0.25 1,040.00 1,407.971995 75.1 1.8 17.8 94.7 5.6 19.8 69.4 0.26 1,120.00 1,485.291996 70.1 3.0 19.8 92.9 8.7 18.4 65.7 0.24 1,220.00 1,588.891997 56.8 2.6 18.4 77.8 10.9 14.9 52.0 0.19 1,210.00 1,549.381998 58.0 3.2 14.9 76.2 8.5 15.2 52.5 0.19 1,190.00 1,507.40
1999 61.1 2.6 15.2 79.0 3.9 16.1 59.0 0.21 1,170.00 1,461.202000 63.0 4.5 16.1 83.5 4.7 16.6 62.3 0.22 1,170.00 1,428.732001 59.4 3.4 16.6 79.4 1.6 15.6 62.2 0.22 1,060.00 1,265.432002 52.3 4.7 15.6 72.6 1.6 13.8 57.2 0.20 1,120.00 1,316.812003 57.3 12.6 13.8 83.7 1.7 15.1 66.9 0.23 1,160.00 1,337.112004 42.6 14.8 15.1 72.5 1.4 11.2 59.9 0.20 1,160.00 1,301.442005 32.2 22.6 11.2 66.0 1.0 8.5 56.5 0.19 1,070.00 1,163.162006 16.0 32.9 8.5 57.3 0.9 4.2 52.2 0.17 1,150.00 1,212.852007 11.8 31.1 4.2 47.1 0.7 3.1 43.3 0.14 1,250.00 1,284.222008 14.2 49.7 3.1 67.1 0.4 3.7 62.9 0.21 1,350.00 1,360.39
2009 10.2 38.3 3.7 52.3 0.7 2.7 48.9 0.16 1,360.00 1,360.002010 4.2 28.1 2.7 35.0 0.6 1.1 33.2 0.11 1,280.00 1,264.682011 6.2 36.2 1.1 43.6 0.2 1.6 41.7 0.13 1,620.00 1,569.782012 4.4 37.6 1.6 43.6 0.7 1.2 41.7 0.13 1,720.00 1,635.542013 4.4 30.7 1.2 36.2 0.3 1.2 34.8 0.11 1,720.00 1,611.562014 p 4.0 18.5 1.2 23.7 0.2 1.1 22.4 0.07 1,680.00 1,551.71 -- = Not available. p = preliminary. 1/ Source: USDA, National Agricultural Statistics Service. Data for 1982-83 estimated by ERS. 2/ Source: U.S. Dept. of Commerce, U.S. Census Bureau. All product-weight data in this table have been converted to a fresh-weight basis using a factor of 1.22. 3/ Constant-dollar prices were calculated using the GDP implicit price deflator, 2009=100. Source: USDA, Economic Research Service.
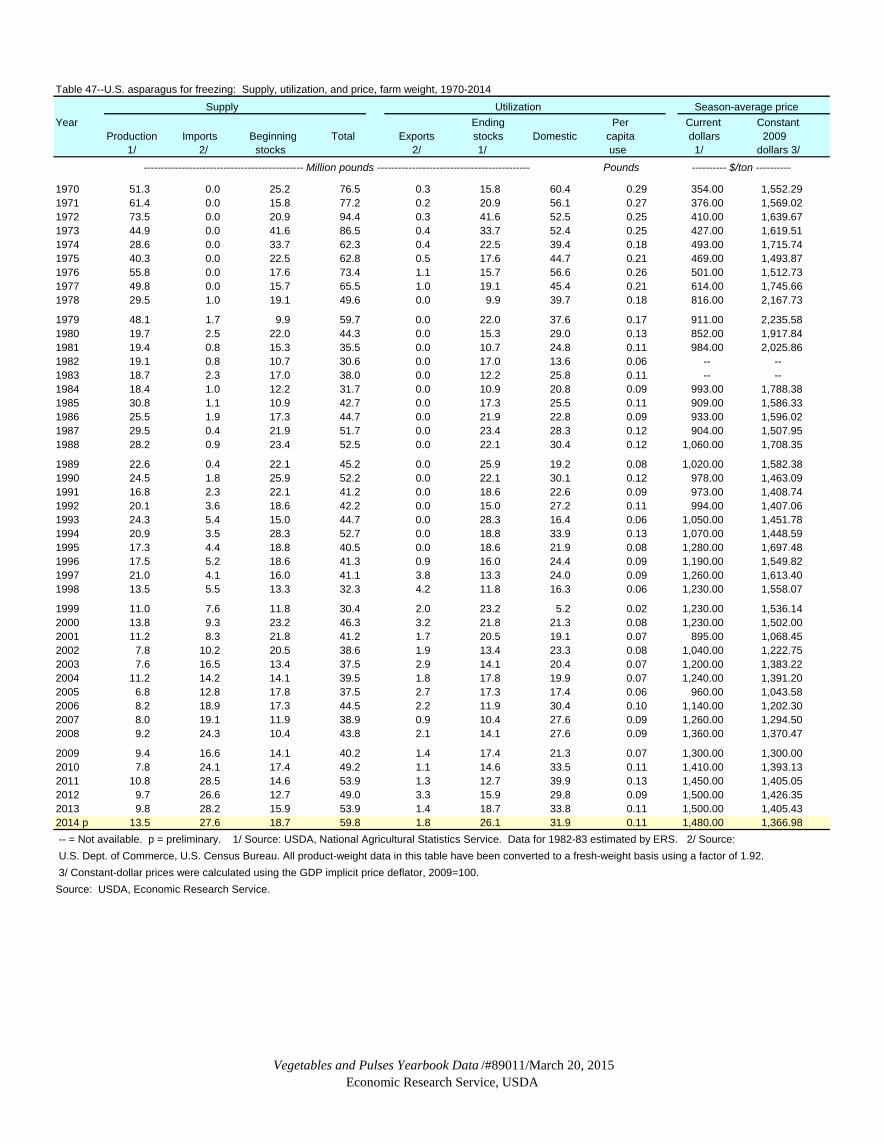
Vegetables and Pulses Yearbook Data /#89011/March 20, 2015Economic Research Service, USDA
Table 47--U.S. asparagus for freezing: Supply, utilization, and price, farm weight, 1970-2014 Supply Utilization Season-average price
Year Ending Per Current Constant Production Imports Beginning Total Exports stocks Domestic capita dollars 2009
1/ 2/ stocks 2/ 1/ use 1/ dollars 3/ ---------------------------------------------- Million pounds -------------------------------------------- Pounds ---------- $/ton ----------
1970 51.3 0.0 25.2 76.5 0.3 15.8 60.4 0.29 354.00 1,552.291971 61.4 0.0 15.8 77.2 0.2 20.9 56.1 0.27 376.00 1,569.021972 73.5 0.0 20.9 94.4 0.3 41.6 52.5 0.25 410.00 1,639.671973 44.9 0.0 41.6 86.5 0.4 33.7 52.4 0.25 427.00 1,619.511974 28.6 0.0 33.7 62.3 0.4 22.5 39.4 0.18 493.00 1,715.741975 40.3 0.0 22.5 62.8 0.5 17.6 44.7 0.21 469.00 1,493.871976 55.8 0.0 17.6 73.4 1.1 15.7 56.6 0.26 501.00 1,512.731977 49.8 0.0 15.7 65.5 1.0 19.1 45.4 0.21 614.00 1,745.661978 29.5 1.0 19.1 49.6 0.0 9.9 39.7 0.18 816.00 2,167.73
1979 48.1 1.7 9.9 59.7 0.0 22.0 37.6 0.17 911.00 2,235.581980 19.7 2.5 22.0 44.3 0.0 15.3 29.0 0.13 852.00 1,917.841981 19.4 0.8 15.3 35.5 0.0 10.7 24.8 0.11 984.00 2,025.861982 19.1 0.8 10.7 30.6 0.0 17.0 13.6 0.06 -- --1983 18.7 2.3 17.0 38.0 0.0 12.2 25.8 0.11 -- --1984 18.4 1.0 12.2 31.7 0.0 10.9 20.8 0.09 993.00 1,788.381985 30.8 1.1 10.9 42.7 0.0 17.3 25.5 0.11 909.00 1,586.331986 25.5 1.9 17.3 44.7 0.0 21.9 22.8 0.09 933.00 1,596.021987 29.5 0.4 21.9 51.7 0.0 23.4 28.3 0.12 904.00 1,507.951988 28.2 0.9 23.4 52.5 0.0 22.1 30.4 0.12 1,060.00 1,708.35
1989 22.6 0.4 22.1 45.2 0.0 25.9 19.2 0.08 1,020.00 1,582.381990 24.5 1.8 25.9 52.2 0.0 22.1 30.1 0.12 978.00 1,463.091991 16.8 2.3 22.1 41.2 0.0 18.6 22.6 0.09 973.00 1,408.741992 20.1 3.6 18.6 42.2 0.0 15.0 27.2 0.11 994.00 1,407.061993 24.3 5.4 15.0 44.7 0.0 28.3 16.4 0.06 1,050.00 1,451.781994 20.9 3.5 28.3 52.7 0.0 18.8 33.9 0.13 1,070.00 1,448.591995 17.3 4.4 18.8 40.5 0.0 18.6 21.9 0.08 1,280.00 1,697.481996 17.5 5.2 18.6 41.3 0.9 16.0 24.4 0.09 1,190.00 1,549.821997 21.0 4.1 16.0 41.1 3.8 13.3 24.0 0.09 1,260.00 1,613.401998 13.5 5.5 13.3 32.3 4.2 11.8 16.3 0.06 1,230.00 1,558.07
1999 11.0 7.6 11.8 30.4 2.0 23.2 5.2 0.02 1,230.00 1,536.142000 13.8 9.3 23.2 46.3 3.2 21.8 21.3 0.08 1,230.00 1,502.002001 11.2 8.3 21.8 41.2 1.7 20.5 19.1 0.07 895.00 1,068.452002 7.8 10.2 20.5 38.6 1.9 13.4 23.3 0.08 1,040.00 1,222.752003 7.6 16.5 13.4 37.5 2.9 14.1 20.4 0.07 1,200.00 1,383.222004 11.2 14.2 14.1 39.5 1.8 17.8 19.9 0.07 1,240.00 1,391.202005 6.8 12.8 17.8 37.5 2.7 17.3 17.4 0.06 960.00 1,043.582006 8.2 18.9 17.3 44.5 2.2 11.9 30.4 0.10 1,140.00 1,202.302007 8.0 19.1 11.9 38.9 0.9 10.4 27.6 0.09 1,260.00 1,294.502008 9.2 24.3 10.4 43.8 2.1 14.1 27.6 0.09 1,360.00 1,370.47
2009 9.4 16.6 14.1 40.2 1.4 17.4 21.3 0.07 1,300.00 1,300.002010 7.8 24.1 17.4 49.2 1.1 14.6 33.5 0.11 1,410.00 1,393.132011 10.8 28.5 14.6 53.9 1.3 12.7 39.9 0.13 1,450.00 1,405.052012 9.7 26.6 12.7 49.0 3.3 15.9 29.8 0.09 1,500.00 1,426.352013 9.8 28.2 15.9 53.9 1.4 18.7 33.8 0.11 1,500.00 1,405.432014 p 13.5 27.6 18.7 59.8 1.8 26.1 31.9 0.11 1,480.00 1,366.98 -- = Not available. p = preliminary. 1/ Source: USDA, National Agricultural Statistics Service. Data for 1982-83 estimated by ERS. 2/ Source: U.S. Dept. of Commerce, U.S. Census Bureau. All product-weight data in this table have been converted to a fresh-weight basis using a factor of 1.92. 3/ Constant-dollar prices were calculated using the GDP implicit price deflator, 2009=100. Source: USDA, Economic Research Service.
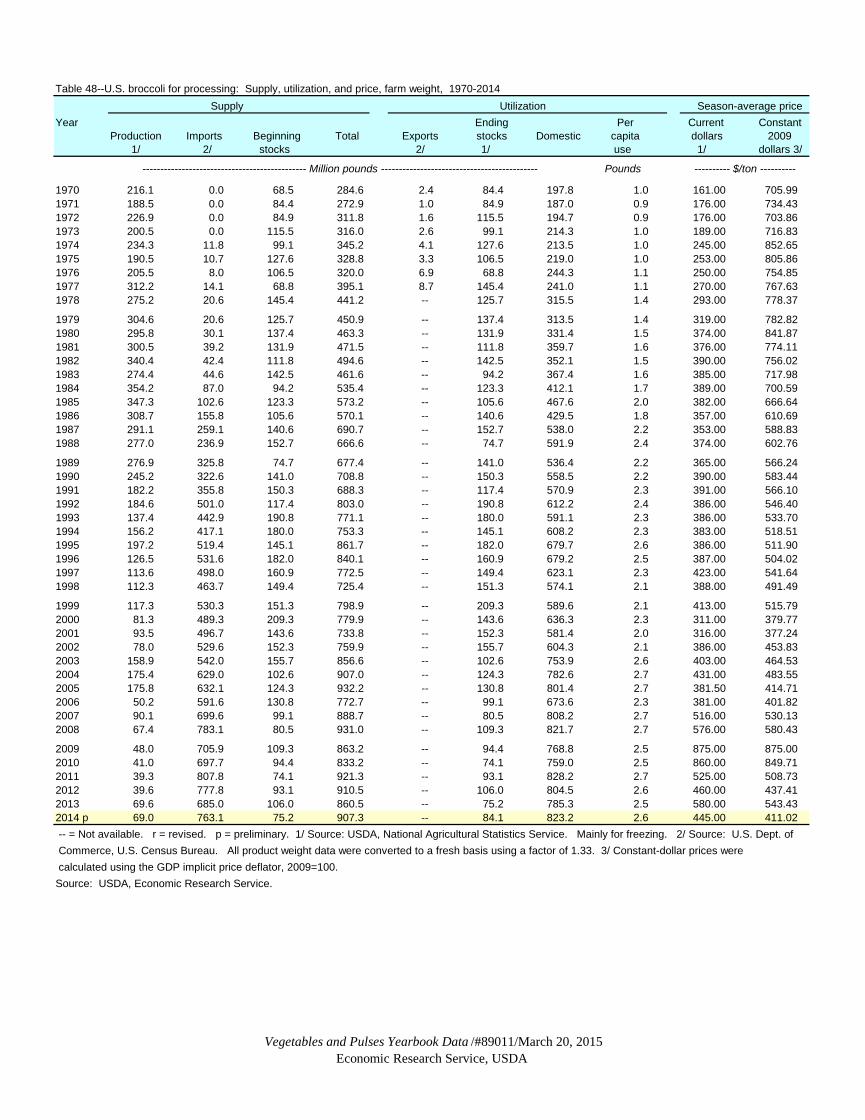
Vegetables and Pulses Yearbook Data /#89011/March 20, 2015Economic Research Service, USDA
Table 48--U.S. broccoli for processing: Supply, utilization, and price, farm weight, 1970-2014 Supply Utilization Season-average price
Year Ending Per Current Constant Production Imports Beginning Total Exports stocks Domestic capita dollars 2009
1/ 2/ stocks 2/ 1/ use 1/ dollars 3/
---------------------------------------------- Million pounds -------------------------------------------- Pounds ---------- $/ton ----------
1970 216.1 0.0 68.5 284.6 2.4 84.4 197.8 1.0 161.00 705.991971 188.5 0.0 84.4 272.9 1.0 84.9 187.0 0.9 176.00 734.431972 226.9 0.0 84.9 311.8 1.6 115.5 194.7 0.9 176.00 703.861973 200.5 0.0 115.5 316.0 2.6 99.1 214.3 1.0 189.00 716.831974 234.3 11.8 99.1 345.2 4.1 127.6 213.5 1.0 245.00 852.651975 190.5 10.7 127.6 328.8 3.3 106.5 219.0 1.0 253.00 805.861976 205.5 8.0 106.5 320.0 6.9 68.8 244.3 1.1 250.00 754.851977 312.2 14.1 68.8 395.1 8.7 145.4 241.0 1.1 270.00 767.631978 275.2 20.6 145.4 441.2 -- 125.7 315.5 1.4 293.00 778.37
1979 304.6 20.6 125.7 450.9 -- 137.4 313.5 1.4 319.00 782.821980 295.8 30.1 137.4 463.3 -- 131.9 331.4 1.5 374.00 841.871981 300.5 39.2 131.9 471.5 -- 111.8 359.7 1.6 376.00 774.111982 340.4 42.4 111.8 494.6 -- 142.5 352.1 1.5 390.00 756.021983 274.4 44.6 142.5 461.6 -- 94.2 367.4 1.6 385.00 717.981984 354.2 87.0 94.2 535.4 -- 123.3 412.1 1.7 389.00 700.591985 347.3 102.6 123.3 573.2 -- 105.6 467.6 2.0 382.00 666.641986 308.7 155.8 105.6 570.1 -- 140.6 429.5 1.8 357.00 610.691987 291.1 259.1 140.6 690.7 -- 152.7 538.0 2.2 353.00 588.831988 277.0 236.9 152.7 666.6 -- 74.7 591.9 2.4 374.00 602.76
1989 276.9 325.8 74.7 677.4 -- 141.0 536.4 2.2 365.00 566.241990 245.2 322.6 141.0 708.8 -- 150.3 558.5 2.2 390.00 583.441991 182.2 355.8 150.3 688.3 -- 117.4 570.9 2.3 391.00 566.101992 184.6 501.0 117.4 803.0 -- 190.8 612.2 2.4 386.00 546.401993 137.4 442.9 190.8 771.1 -- 180.0 591.1 2.3 386.00 533.701994 156.2 417.1 180.0 753.3 -- 145.1 608.2 2.3 383.00 518.511995 197.2 519.4 145.1 861.7 -- 182.0 679.7 2.6 386.00 511.901996 126.5 531.6 182.0 840.1 -- 160.9 679.2 2.5 387.00 504.021997 113.6 498.0 160.9 772.5 -- 149.4 623.1 2.3 423.00 541.641998 112.3 463.7 149.4 725.4 -- 151.3 574.1 2.1 388.00 491.49
1999 117.3 530.3 151.3 798.9 -- 209.3 589.6 2.1 413.00 515.792000 81.3 489.3 209.3 779.9 -- 143.6 636.3 2.3 311.00 379.772001 93.5 496.7 143.6 733.8 -- 152.3 581.4 2.0 316.00 377.242002 78.0 529.6 152.3 759.9 -- 155.7 604.3 2.1 386.00 453.832003 158.9 542.0 155.7 856.6 -- 102.6 753.9 2.6 403.00 464.532004 175.4 629.0 102.6 907.0 -- 124.3 782.6 2.7 431.00 483.552005 175.8 632.1 124.3 932.2 -- 130.8 801.4 2.7 381.50 414.712006 50.2 591.6 130.8 772.7 -- 99.1 673.6 2.3 381.00 401.822007 90.1 699.6 99.1 888.7 -- 80.5 808.2 2.7 516.00 530.132008 67.4 783.1 80.5 931.0 -- 109.3 821.7 2.7 576.00 580.43
2009 48.0 705.9 109.3 863.2 -- 94.4 768.8 2.5 875.00 875.002010 41.0 697.7 94.4 833.2 -- 74.1 759.0 2.5 860.00 849.712011 39.3 807.8 74.1 921.3 -- 93.1 828.2 2.7 525.00 508.732012 39.6 777.8 93.1 910.5 -- 106.0 804.5 2.6 460.00 437.412013 69.6 685.0 106.0 860.5 -- 75.2 785.3 2.5 580.00 543.432014 p 69.0 763.1 75.2 907.3 -- 84.1 823.2 2.6 445.00 411.02 -- = Not available. r = revised. p = preliminary. 1/ Source: USDA, National Agricultural Statistics Service. Mainly for freezing. 2/ Source: U.S. Dept. of Commerce, U.S. Census Bureau. All product weight data were converted to a fresh basis using a factor of 1.33. 3/ Constant-dollar prices were calculated using the GDP implicit price deflator, 2009=100. Source: USDA, Economic Research Service.

Vegetables and Pulses Yearbook Data /#89011/March 20, 2015Economic Research Service, USDA
Table 49--U.S. cabbage for sauerkraut: Supply, utilization, and price, farm weight, 1970-2014 1/
Supply Utilization Season-average price Year Per Current Constant
Production Imports Beginning Total Exports Ending Domestic capita dollars 2009 2/ 3/ stocks 4/ 3/ stocks 4/ use 1/ dollars 5/
----------------------------------------------------- Million pounds ----------------------------------------------------- Pounds ------- $/ton -------
1970 532.2 0.1 0.0 532.3 -- 422.7 109.6 2.3 17.70 77.611971 469.9 0.2 422.7 892.8 -- 380.3 512.5 2.5 17.50 73.031972 396.2 0.3 380.3 776.8 -- 317.9 458.9 2.2 21.40 85.581973 438.3 0.3 317.9 756.5 -- 305.2 451.3 2.1 24.80 94.061974 562.9 0.4 305.2 868.5 -- 383.9 484.6 2.3 31.00 107.891975 479.5 0.2 383.9 863.6 -- 420.2 443.4 2.1 31.40 100.021976 464.1 0.4 420.2 884.7 -- 400.9 483.8 2.2 31.20 94.211977 469.5 0.5 400.9 870.9 -- 389.1 481.8 2.2 30.50 86.711978 435.6 0.2 389.1 824.9 -- 359.8 465.1 2.1 31.50 83.68
1979 475.6 0.4 359.8 835.8 -- 372.6 463.2 2.1 31.60 77.551980 418.0 0.3 372.6 790.9 -- 338.8 452.1 2.0 34.10 76.761981 492.2 0.3 338.8 831.3 -- 365.2 466.1 2.0 36.80 75.761982 440.2 0.8 365.2 806.2 -- 412.1 394.1 1.7 35.10 68.041983 302.7 1.8 412.1 716.6 -- 229.6 487.0 2.1 35.00 65.271984 433.6 2.7 229.6 665.9 -- 264.7 401.2 1.7 36.30 65.381985 426.8 3.1 264.7 694.6 -- 314.8 379.8 1.6 36.70 64.051986 315.4 3.2 314.8 633.4 -- 260.3 373.1 1.6 35.20 60.211987 379.0 2.8 260.3 642.1 -- 250.9 391.2 1.6 34.10 56.881988 324.5 2.2 250.9 577.6 -- 226.3 351.3 1.4 34.70 55.92
1989 374.5 7.9 226.3 608.7 2.2 289.2 317.3 1.3 38.10 59.111990 315.4 3.6 289.2 608.2 5.1 304.5 298.6 1.2 40.80 61.041991 324.5 1.6 304.5 630.6 6.7 260.0 363.9 1.4 38.00 55.021992 331.0 2.0 260.0 593.0 14.3 284.1 294.6 1.2 37.00 52.381993 269.0 3.9 284.1 557.0 15.5 189.4 352.1 1.4 46.60 64.431994 369.9 12.0 189.4 571.3 16.1 232.4 322.8 1.2 39.90 54.021995 347.7 3.5 232.4 583.6 14.7 203.1 365.8 1.4 43.40 57.561996 283.8 2.9 203.1 489.8 20.4 202.8 266.6 1.0 42.50 55.351997 367.3 3.7 202.8 573.8 36.0 145.8 392.0 1.4 45.20 57.881998 345.1 4.9 145.8 495.8 14.6 99.7 381.5 1.4 44.70 56.62
1999 355.8 5.9 99.7 461.4 13.6 102.8 345.0 1.2 43.70 54.582000 416.5 5.8 102.8 525.2 17.0 120.3 387.8 1.4 47.40 57.882001 348.7 5.8 120.3 474.8 18.6 95.7 360.5 1.3 48.70 58.142002 350.2 8.8 95.7 454.7 19.2 96.1 339.4 1.2 46.90 55.142003 315.9 8.2 96.1 420.3 16.1 86.7 317.5 1.1 48.00 55.332004 329.2 10.1 86.7 425.9 17.4 90.3 318.2 1.1 50.50 56.662005 381.8 9.2 90.3 481.4 17.4 104.8 359.3 1.2 50.80 55.222006 363.4 10.5 104.8 478.7 17.7 99.7 361.3 1.2 55.10 58.112007 294.0 8.7 99.7 402.5 17.9 80.7 303.8 1.0 61.60 63.292008 295.2 8.3 80.7 384.2 17.7 81.0 285.5 0.9 88.66 89.34
2009 306.8 7.8 81.0 395.7 19.6 84.2 291.9 0.9 68.45 68.452010 320.4 10.8 84.2 415.5 18.4 87.9 309.1 1.0 72.90 72.032011 331.4 15.4 87.9 434.8 25.2 91.0 318.6 1.0 76.67 74.302012 340.5 55.1 91.0 486.6 30.8 93.5 362.3 1.2 72.68 69.112013 324.8 17.1 93.5 435.3 33.0 89.1 313.2 1.0 74.09 69.412014 p 329.3 16.1 89.1 434.5 30.2 90.4 313.9 1.0 74.48 68.79 -- = Not available. p = preliminary. 1/ Cabbage produced for processing into sauerkraut. 2/ Data from USDA, National Agricultural Statistics Service except estimated by ERS after 2001 and for 1981-91 based on available State reports or Census data. Prices for 1982-91 and after 2004 are for New York. Between 2001 and 2003, prices based on changes in fresh-market. 3/ Source: Bureau of the Census, U.S. Dept. of Commerce. All product weight data are converted to a fresh weight using a factor of 1.859. 4/ Based on data from the National Kraut Packers Association through 1998. Estimated by ERS after 1998. 5/ Deflated by the GDP implicit price deflator, 2009=100.Source: USDA, Economic Research Service.

Vegetables and Pulses Yearbook Data /#89011/March 20, 2015Economic Research Service, USDA
Table 50--U.S. carrots for freezing: Supply, utilization, and price, farm weight, 1970-2014
Supply Utilization Season-average priceYear Ending Per Current Constant
Production Imports Beginning Total Exports stocks Domestic capita dollars 2009 1/ 2/ stocks 2/ 3/ use 1/ dollars 4/
----------------------------------------------------- Million pounds ----------------------------------------------------- Pounds ------- $/ton -------
1970 315.0 -- 173.9 488.9 1.8 199.8 287.3 1.4 28.20 123.661971 261.5 -- 199.8 461.3 1.0 181.3 279.0 1.3 30.50 127.271972 301.9 -- 181.3 483.2 1.6 176.4 305.2 1.5 28.70 114.781973 421.7 -- 176.4 598.1 3.8 218.9 375.4 1.8 28.60 108.471974 451.5 -- 218.9 670.4 5.5 284.1 380.8 1.8 40.10 139.561975 301.9 -- 284.1 586.0 4.0 237.2 344.8 1.6 43.60 138.881976 329.9 -- 237.2 567.1 8.7 201.6 356.8 1.6 39.20 118.361977 480.1 -- 201.6 681.7 10.1 282.5 389.1 1.8 43.70 124.241978 433.9 -- 282.5 716.4 24.1 297.9 394.4 1.8 45.70 121.40
1979 478.8 -- 297.9 776.7 32.5 320.9 423.3 1.9 46.50 114.111980 347.9 -- 320.9 668.8 34.1 250.6 384.1 1.7 53.00 119.301981 491.1 -- 250.6 741.7 34.4 273.6 433.7 1.9 55.20 113.651982 540.0 -- 273.6 813.6 22.0 386.3 405.3 1.8 55.00 106.621983 386.8 -- 386.3 773.1 12.1 339.3 421.7 1.8 59.80 111.521984 465.2 -- 339.3 804.5 15.0 298.0 491.5 2.1 63.90 115.081985 463.3 -- 298.0 761.3 10.1 329.1 422.1 1.8 64.40 112.391986 492.1 -- 329.1 821.2 11.0 379.9 430.3 1.8 62.40 106.741987 536.2 -- 379.9 916.1 15.2 390.2 510.7 2.1 58.90 98.251988 536.3 -- 390.2 926.5 32.9 333.3 560.3 2.3 66.10 106.53
1989 653.1 7.3 333.3 993.7 2.8 379.5 611.4 2.5 60.30 93.551990 598.4 8.3 379.5 986.2 7.2 408.7 570.3 2.3 64.90 97.091991 578.8 5.3 408.7 992.8 9.3 370.6 612.9 2.4 64.20 92.951992 675.6 13.3 370.6 1,059.5 4.5 462.4 592.6 2.3 68.90 97.531993 733.8 11.2 462.4 1,207.4 7.3 475.0 725.1 2.8 75.60 104.531994 751.1 10.8 475.0 1,236.9 9.6 493.5 733.8 2.8 77.20 104.511995 762.2 5.3 493.5 1,261.0 12.7 559.9 688.4 2.6 79.00 104.771996 724.3 5.3 559.9 1,289.5 12.2 512.9 764.4 2.8 66.90 87.131997 744.5 14.9 512.9 1,272.3 22.6 547.6 702.1 2.6 67.40 86.301998 706.3 11.3 547.6 1,265.2 36.3 467.1 761.8 2.8 68.30 86.52
1999 772.9 10.8 467.1 1,250.8 11.5 559.1 680.2 2.4 67.30 84.052000 751.2 18.0 559.1 1,328.3 19.2 537.6 771.4 2.7 70.30 85.852001 597.0 16.9 537.6 1,151.4 11.5 502.7 637.3 2.2 74.50 88.942002 529.7 18.9 502.7 1,051.2 3.6 441.5 606.1 2.1 70.00 82.302003 593.4 17.4 441.5 1,052.3 3.1 460.1 589.1 2.0 75.10 86.572004 570.8 29.6 460.1 1,060.5 6.2 469.9 584.3 2.0 80.20 89.982005 605.5 24.3 469.9 1,099.7 4.2 508.1 587.4 2.0 72.90 79.252006 532.7 24.9 508.1 1,065.7 3.0 445.2 617.5 2.1 69.30 73.092007 497.8 20.0 445.2 963.1 15.2 491.7 456.2 1.5 72.00 73.972008 530.3 15.0 491.7 1,037.0 8.8 558.5 469.7 1.5 84.10 84.75
2009 479.1 14.2 558.5 1,051.8 2.2 583.2 466.4 1.5 93.80 93.802010 426.5 11.0 583.2 1,020.7 1.0 564.8 454.9 1.5 91.70 90.602011 465.4 14.8 564.8 1,045.0 2.5 552.5 490.0 1.6 84.60 81.982012 440.0 15.7 552.5 1,008.2 1.5 626.4 380.4 1.2 103.00 97.942013 464.6 13.3 626.4 1,104.2 2.4 578.4 523.4 1.7 122.00 114.312014 p 424.8 14.4 578.4 1,017.6 1.8 636.2 379.5 1.2 116.00 107.14 -- = Not available. r = revised. p = preliminary. 1/ Derived from pack data published by the American Frozen Food Institute through 2004. After 2004, AFFI ceased reporting frozen pack, so the share of processing carrots use for freezing was set at 66 percent, which was the average share packed based on AFFI data from 1994-2003. 2/ Source: U.S. Dept. of Commerce, U.S. Census Bureau. All product weight data were converted to a fresh-weight basis using a factor of 1.82. 3/ End of Dec. stocks (converted to fresh-weight basis) reported by National Agricultural Statistics Service, USDA. 4/ Deflated using the GDP implicit price deflator, 2009=100. Source: USDA, Economic Research Service.
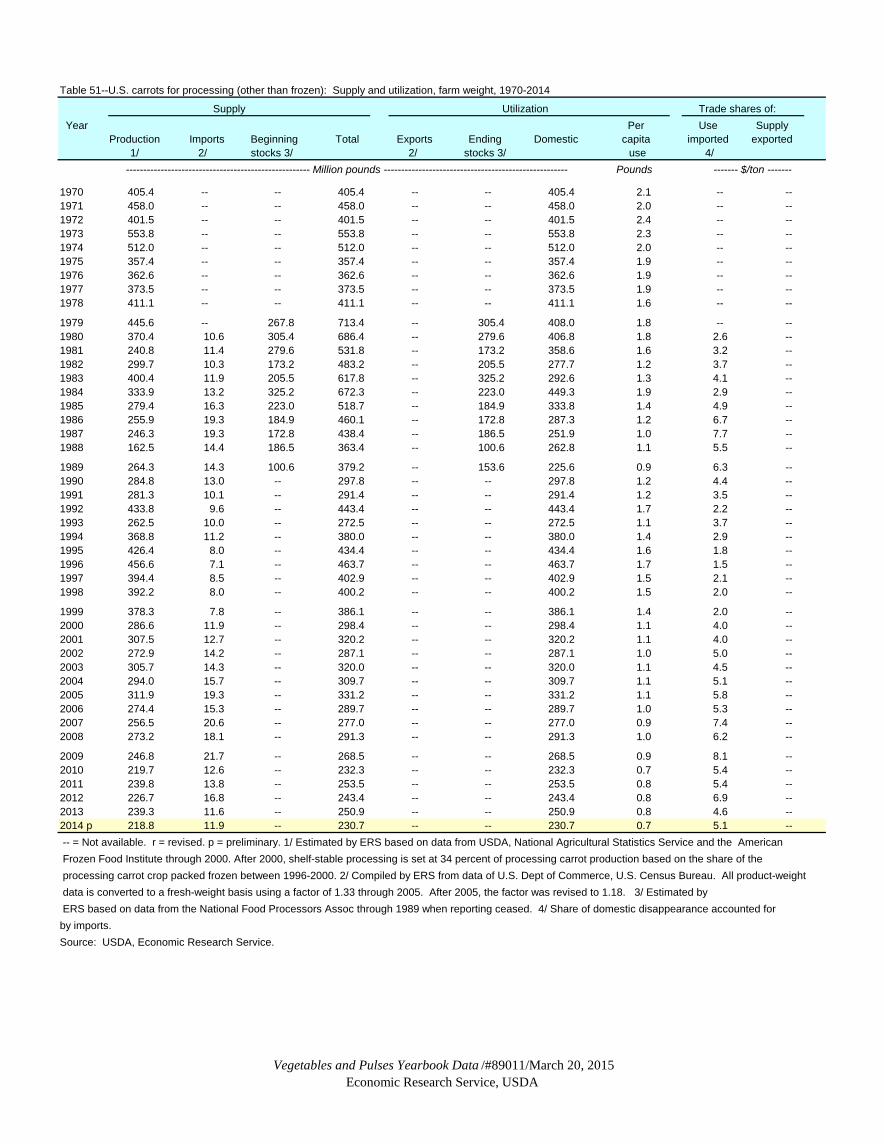
Vegetables and Pulses Yearbook Data /#89011/March 20, 2015Economic Research Service, USDA
Table 51--U.S. carrots for processing (other than frozen): Supply and utilization, farm weight, 1970-2014
Supply Utilization Trade shares of: Year Per Use Supply
Production Imports Beginning Total Exports Ending Domestic capita imported exported 1/ 2/ stocks 3/ 2/ stocks 3/ use 4/
----------------------------------------------------- Million pounds ----------------------------------------------------- Pounds ------- $/ton -------
1970 405.4 -- -- 405.4 -- -- 405.4 2.1 -- --1971 458.0 -- -- 458.0 -- -- 458.0 2.0 -- --1972 401.5 -- -- 401.5 -- -- 401.5 2.4 -- --1973 553.8 -- -- 553.8 -- -- 553.8 2.3 -- --1974 512.0 -- -- 512.0 -- -- 512.0 2.0 -- --1975 357.4 -- -- 357.4 -- -- 357.4 1.9 -- --1976 362.6 -- -- 362.6 -- -- 362.6 1.9 -- --1977 373.5 -- -- 373.5 -- -- 373.5 1.9 -- --1978 411.1 -- -- 411.1 -- -- 411.1 1.6 -- --
1979 445.6 -- 267.8 713.4 -- 305.4 408.0 1.8 -- --1980 370.4 10.6 305.4 686.4 -- 279.6 406.8 1.8 2.6 --1981 240.8 11.4 279.6 531.8 -- 173.2 358.6 1.6 3.2 --1982 299.7 10.3 173.2 483.2 -- 205.5 277.7 1.2 3.7 --1983 400.4 11.9 205.5 617.8 -- 325.2 292.6 1.3 4.1 --1984 333.9 13.2 325.2 672.3 -- 223.0 449.3 1.9 2.9 --1985 279.4 16.3 223.0 518.7 -- 184.9 333.8 1.4 4.9 --1986 255.9 19.3 184.9 460.1 -- 172.8 287.3 1.2 6.7 --1987 246.3 19.3 172.8 438.4 -- 186.5 251.9 1.0 7.7 --1988 162.5 14.4 186.5 363.4 -- 100.6 262.8 1.1 5.5 --
1989 264.3 14.3 100.6 379.2 -- 153.6 225.6 0.9 6.3 --1990 284.8 13.0 -- 297.8 -- -- 297.8 1.2 4.4 --1991 281.3 10.1 -- 291.4 -- -- 291.4 1.2 3.5 --1992 433.8 9.6 -- 443.4 -- -- 443.4 1.7 2.2 --1993 262.5 10.0 -- 272.5 -- -- 272.5 1.1 3.7 --1994 368.8 11.2 -- 380.0 -- -- 380.0 1.4 2.9 --1995 426.4 8.0 -- 434.4 -- -- 434.4 1.6 1.8 --1996 456.6 7.1 -- 463.7 -- -- 463.7 1.7 1.5 --1997 394.4 8.5 -- 402.9 -- -- 402.9 1.5 2.1 --1998 392.2 8.0 -- 400.2 -- -- 400.2 1.5 2.0 --
1999 378.3 7.8 -- 386.1 -- -- 386.1 1.4 2.0 --2000 286.6 11.9 -- 298.4 -- -- 298.4 1.1 4.0 --2001 307.5 12.7 -- 320.2 -- -- 320.2 1.1 4.0 --2002 272.9 14.2 -- 287.1 -- -- 287.1 1.0 5.0 --2003 305.7 14.3 -- 320.0 -- -- 320.0 1.1 4.5 --2004 294.0 15.7 -- 309.7 -- -- 309.7 1.1 5.1 --2005 311.9 19.3 -- 331.2 -- -- 331.2 1.1 5.8 --2006 274.4 15.3 -- 289.7 -- -- 289.7 1.0 5.3 --2007 256.5 20.6 -- 277.0 -- -- 277.0 0.9 7.4 --2008 273.2 18.1 -- 291.3 -- -- 291.3 1.0 6.2 --
2009 246.8 21.7 -- 268.5 -- -- 268.5 0.9 8.1 --2010 219.7 12.6 -- 232.3 -- -- 232.3 0.7 5.4 --2011 239.8 13.8 -- 253.5 -- -- 253.5 0.8 5.4 --2012 226.7 16.8 -- 243.4 -- -- 243.4 0.8 6.9 --2013 239.3 11.6 -- 250.9 -- -- 250.9 0.8 4.6 --2014 p 218.8 11.9 -- 230.7 -- -- 230.7 0.7 5.1 -- -- = Not available. r = revised. p = preliminary. 1/ Estimated by ERS based on data from USDA, National Agricultural Statistics Service and the American Frozen Food Institute through 2000. After 2000, shelf-stable processing is set at 34 percent of processing carrot production based on the share of the processing carrot crop packed frozen between 1996-2000. 2/ Compiled by ERS from data of U.S. Dept of Commerce, U.S. Census Bureau. All product-weight data is converted to a fresh-weight basis using a factor of 1.33 through 2005. After 2005, the factor was revised to 1.18. 3/ Estimated by ERS based on data from the National Food Processors Assoc through 1989 when reporting ceased. 4/ Share of domestic disappearance accounted for by imports. Source: USDA, Economic Research Service.
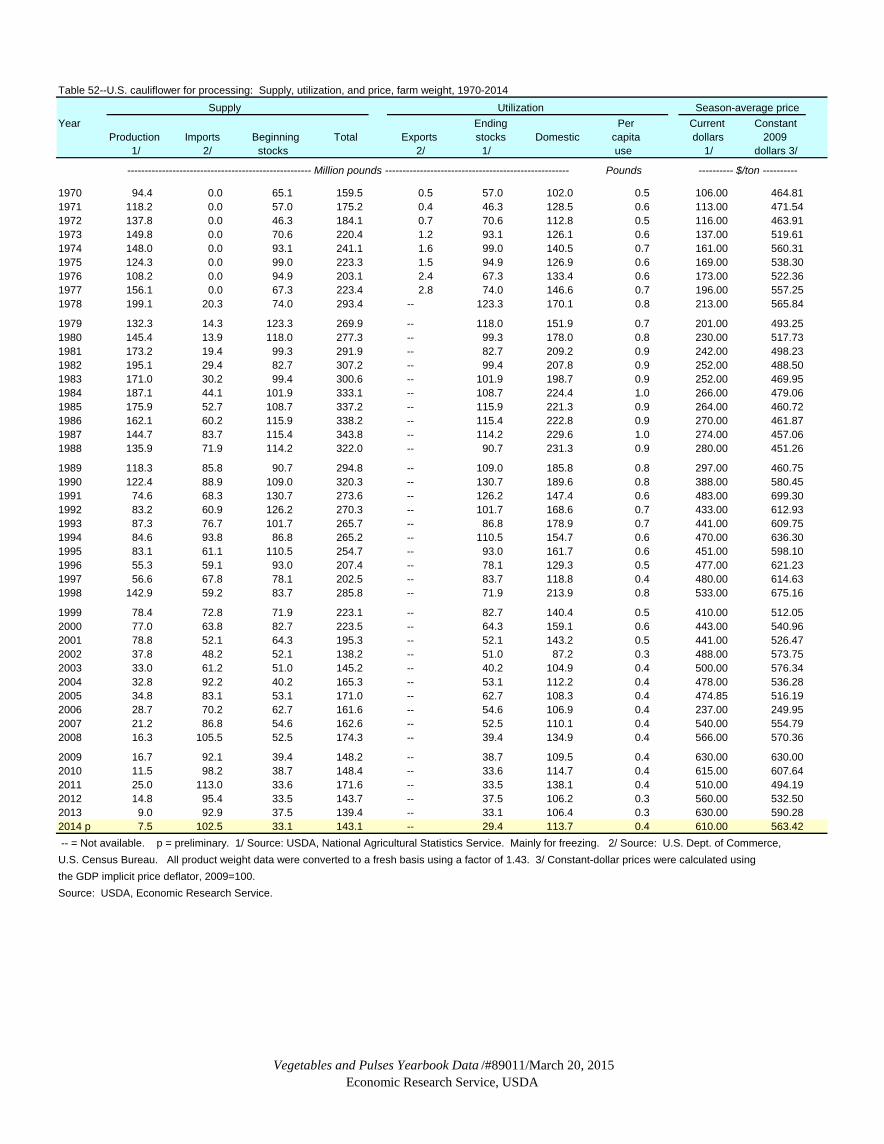
Vegetables and Pulses Yearbook Data /#89011/March 20, 2015Economic Research Service, USDA
Table 52--U.S. cauliflower for processing: Supply, utilization, and price, farm weight, 1970-2014 Supply Utilization Season-average price
Year Ending Per Current Constant Production Imports Beginning Total Exports stocks Domestic capita dollars 2009
1/ 2/ stocks 2/ 1/ use 1/ dollars 3/
----------------------------------------------------- Million pounds ----------------------------------------------------- Pounds ---------- $/ton ----------
1970 94.4 0.0 65.1 159.5 0.5 57.0 102.0 0.5 106.00 464.811971 118.2 0.0 57.0 175.2 0.4 46.3 128.5 0.6 113.00 471.541972 137.8 0.0 46.3 184.1 0.7 70.6 112.8 0.5 116.00 463.911973 149.8 0.0 70.6 220.4 1.2 93.1 126.1 0.6 137.00 519.611974 148.0 0.0 93.1 241.1 1.6 99.0 140.5 0.7 161.00 560.311975 124.3 0.0 99.0 223.3 1.5 94.9 126.9 0.6 169.00 538.301976 108.2 0.0 94.9 203.1 2.4 67.3 133.4 0.6 173.00 522.361977 156.1 0.0 67.3 223.4 2.8 74.0 146.6 0.7 196.00 557.251978 199.1 20.3 74.0 293.4 -- 123.3 170.1 0.8 213.00 565.84
1979 132.3 14.3 123.3 269.9 -- 118.0 151.9 0.7 201.00 493.251980 145.4 13.9 118.0 277.3 -- 99.3 178.0 0.8 230.00 517.731981 173.2 19.4 99.3 291.9 -- 82.7 209.2 0.9 242.00 498.231982 195.1 29.4 82.7 307.2 -- 99.4 207.8 0.9 252.00 488.501983 171.0 30.2 99.4 300.6 -- 101.9 198.7 0.9 252.00 469.951984 187.1 44.1 101.9 333.1 -- 108.7 224.4 1.0 266.00 479.061985 175.9 52.7 108.7 337.2 -- 115.9 221.3 0.9 264.00 460.721986 162.1 60.2 115.9 338.2 -- 115.4 222.8 0.9 270.00 461.871987 144.7 83.7 115.4 343.8 -- 114.2 229.6 1.0 274.00 457.061988 135.9 71.9 114.2 322.0 -- 90.7 231.3 0.9 280.00 451.26
1989 118.3 85.8 90.7 294.8 -- 109.0 185.8 0.8 297.00 460.751990 122.4 88.9 109.0 320.3 -- 130.7 189.6 0.8 388.00 580.451991 74.6 68.3 130.7 273.6 -- 126.2 147.4 0.6 483.00 699.301992 83.2 60.9 126.2 270.3 -- 101.7 168.6 0.7 433.00 612.931993 87.3 76.7 101.7 265.7 -- 86.8 178.9 0.7 441.00 609.751994 84.6 93.8 86.8 265.2 -- 110.5 154.7 0.6 470.00 636.301995 83.1 61.1 110.5 254.7 -- 93.0 161.7 0.6 451.00 598.101996 55.3 59.1 93.0 207.4 -- 78.1 129.3 0.5 477.00 621.231997 56.6 67.8 78.1 202.5 -- 83.7 118.8 0.4 480.00 614.631998 142.9 59.2 83.7 285.8 -- 71.9 213.9 0.8 533.00 675.16
1999 78.4 72.8 71.9 223.1 -- 82.7 140.4 0.5 410.00 512.052000 77.0 63.8 82.7 223.5 -- 64.3 159.1 0.6 443.00 540.962001 78.8 52.1 64.3 195.3 -- 52.1 143.2 0.5 441.00 526.472002 37.8 48.2 52.1 138.2 -- 51.0 87.2 0.3 488.00 573.752003 33.0 61.2 51.0 145.2 -- 40.2 104.9 0.4 500.00 576.342004 32.8 92.2 40.2 165.3 -- 53.1 112.2 0.4 478.00 536.282005 34.8 83.1 53.1 171.0 -- 62.7 108.3 0.4 474.85 516.192006 28.7 70.2 62.7 161.6 -- 54.6 106.9 0.4 237.00 249.952007 21.2 86.8 54.6 162.6 -- 52.5 110.1 0.4 540.00 554.792008 16.3 105.5 52.5 174.3 -- 39.4 134.9 0.4 566.00 570.36
2009 16.7 92.1 39.4 148.2 -- 38.7 109.5 0.4 630.00 630.002010 11.5 98.2 38.7 148.4 -- 33.6 114.7 0.4 615.00 607.642011 25.0 113.0 33.6 171.6 -- 33.5 138.1 0.4 510.00 494.192012 14.8 95.4 33.5 143.7 -- 37.5 106.2 0.3 560.00 532.502013 9.0 92.9 37.5 139.4 -- 33.1 106.4 0.3 630.00 590.282014 p 7.5 102.5 33.1 143.1 -- 29.4 113.7 0.4 610.00 563.42 -- = Not available. p = preliminary. 1/ Source: USDA, National Agricultural Statistics Service. Mainly for freezing. 2/ Source: U.S. Dept. of Commerce, U.S. Census Bureau. All product weight data were converted to a fresh basis using a factor of 1.43. 3/ Constant-dollar prices were calculated using the GDP implicit price deflator, 2009=100. Source: USDA, Economic Research Service.

Vegetables and Pulses Yearbook Data /#89011/March 20, 2015Economic Research Service, USDA
Table 53--U.S. cucumbers for pickles: Supply, utilization, and price, farm weight, 1970-2014
Supply Utilization Season-average price Year Per Current Constant
Production Imports Beginning Total Exports Ending Domestic capita dollars 2009 1/ 2/ stocks 3/ 2/ stocks use 1/ dollars 4/
----------------------------------------------------- Million pounds ----------------------------------------------------- Pounds ------- $/ton --------
1970 1,177.6 3.6 402.0 1,583.2 0.9 421.1 1,161.2 5.7 94.10 412.631971 1,126.2 4.2 421.1 1,551.5 0.8 401.7 1,149.0 5.5 93.20 388.921972 1,142.3 5.0 401.7 1,549.0 3.4 410.1 1,135.5 5.4 94.00 375.921973 1,197.6 5.2 410.1 1,612.9 4.7 409.4 1,198.8 5.7 99.30 376.621974 1,194.0 6.0 409.4 1,609.4 3.4 378.4 1,227.6 5.7 131.00 455.911975 1,348.5 4.5 378.4 1,731.4 3.4 406.5 1,321.5 6.1 129.00 410.891976 1,267.6 5.8 406.5 1,679.9 4.3 339.6 1,336.0 6.1 126.00 380.451977 1,247.7 6.8 339.6 1,594.1 5.8 316.3 1,272.0 5.8 126.00 358.231978 1,370.9 9.7 316.3 1,696.9 6.6 343.9 1,346.4 6.1 130.00 345.35
1979 1,337.9 8.0 343.9 1,689.8 6.3 367.3 1,316.2 5.9 145.00 355.831980 1,218.3 7.0 367.3 1,592.6 6.8 356.8 1,229.0 5.4 166.00 373.661981 1,150.8 5.0 356.8 1,512.6 7.2 276.5 1,228.9 5.3 175.00 360.291982 1,179.3 7.1 276.5 1,462.9 6.7 270.4 1,185.8 5.1 -- --1983 1,207.9 6.7 -- 1,214.6 6.6 -- 1,208.0 5.2 -- --1984 1,236.5 7.2 -- 1,243.7 8.2 -- 1,235.5 5.2 168.00 302.571985 1,388.9 9.8 -- 1,398.7 9.4 -- 1,389.3 5.8 178.00 310.631986 1,279.1 11.0 787.0 2,077.1 17.5 778.0 1,281.6 5.3 177.00 302.781987 1,270.9 9.6 778.0 2,058.5 25.8 688.8 1,343.9 5.5 180.00 300.261988 1,303.2 10.3 688.8 2,002.3 22.7 686.1 1,293.5 5.3 200.00 322.33
1989 1,285.4 11.2 686.1 1,982.7 16.1 682.8 1,283.8 5.2 204.00 316.481990 1,307.0 11.4 682.8 2,001.2 19.6 732.4 1,249.2 5.0 209.00 312.661991 1,246.1 10.6 732.4 1,989.1 20.4 686.9 1,281.8 5.1 210.00 304.041992 1,116.1 12.1 686.9 1,815.1 20.5 627.0 1,167.6 4.6 211.00 298.681993 1,174.0 16.7 627.0 1,817.7 19.4 671.9 1,126.4 4.3 215.00 297.271994 1,267.0 24.7 671.9 1,963.6 22.9 681.7 1,259.0 4.8 220.00 297.841995 1,222.4 25.3 681.7 1,929.4 29.9 554.4 1,345.1 5.1 222.00 294.411996 1,127.4 35.2 554.4 1,717.0 33.0 584.7 1,099.3 4.1 248.00 322.991997 1,240.2 60.5 584.7 1,885.4 36.7 419.9 1,428.8 5.2 234.00 299.631998 1,187.4 66.2 419.9 1,673.5 30.6 535.0 1,107.9 4.0 237.00 300.21
1999 1,256.7 85.3 535.0 1,877.0 30.1 673.2 1,173.7 4.2 238.00 297.242000 1,226.3 82.7 673.2 1,982.2 24.1 576.7 1,381.4 4.9 269.00 328.492001 1,163.1 65.3 576.7 1,805.0 18.0 721.8 1,065.2 3.7 291.00 347.402002 1,238.6 57.5 721.8 2,017.9 13.7 447.3 1,556.9 5.4 273.00 320.972003 1,296.9 87.9 447.3 1,832.0 13.3 526.1 1,292.6 4.4 275.00 316.992004 1,187.8 94.0 526.1 1,807.8 16.7 358.1 1,433.1 4.9 269.00 301.802005 1,080.2 92.5 358.1 1,530.7 20.2 372.7 1,137.8 3.8 256.00 278.292006 1,010.4 95.9 372.7 1,479.0 23.8 561.1 894.0 3.0 305.00 321.672007 1,082.5 82.4 561.1 1,726.0 37.9 560.6 1,127.5 3.7 325.00 333.902008 1,134.2 79.8 560.6 1,774.6 27.8 666.6 1,080.2 3.5 316.00 318.43
2009 1,097.3 112.8 666.6 1,876.7 38.8 282.0 1,555.9 5.1 328.00 328.002010 1,102.7 89.7 282.0 1,474.4 42.1 273.0 1,159.4 3.7 337.00 332.972011 964.1 93.3 273.0 1,330.3 61.8 386.2 882.3 2.8 360.00 348.842012 960.1 95.0 386.2 1,441.3 97.3 409.2 934.7 3.0 342.00 325.212013 946.3 77.8 409.2 1,433.3 98.8 316.7 1,017.8 3.2 313.00 293.272014 p 963.48 73.1 316.7 1,353.2 99.3 130.7 1,123.2 3.5 365.00 337.13 -- = Not available. p = preliminary. 1/ Source: USDA, National Agricultural Statistics Service (1970-81, 1984-90). ERS estimates 1982-83. 2/ Source: U.S. Department of Commerce, U.S. Census Bureau. All product weight data were converted to a fresh weight basis using a factor of 0.744. Data are on a calendar year. Imports for 1970-76 were estimated as 15 percent of a misc. pickled vegetable category. 3/ Brine stocks on Oct. 1 from 1970-82 as reported by the Pickle Packers International, Inc. Stocks in tanks, barrels, & fresh pack on Dec. 1 as reported by USDA, NASS. All stocks converted to a fresh weight basis (factor=0.744). Stocks not available 1983-85. 4/ Deflated by the GDP implicit price deflator, 2009=100. Source: USDA, Economic Research Service.
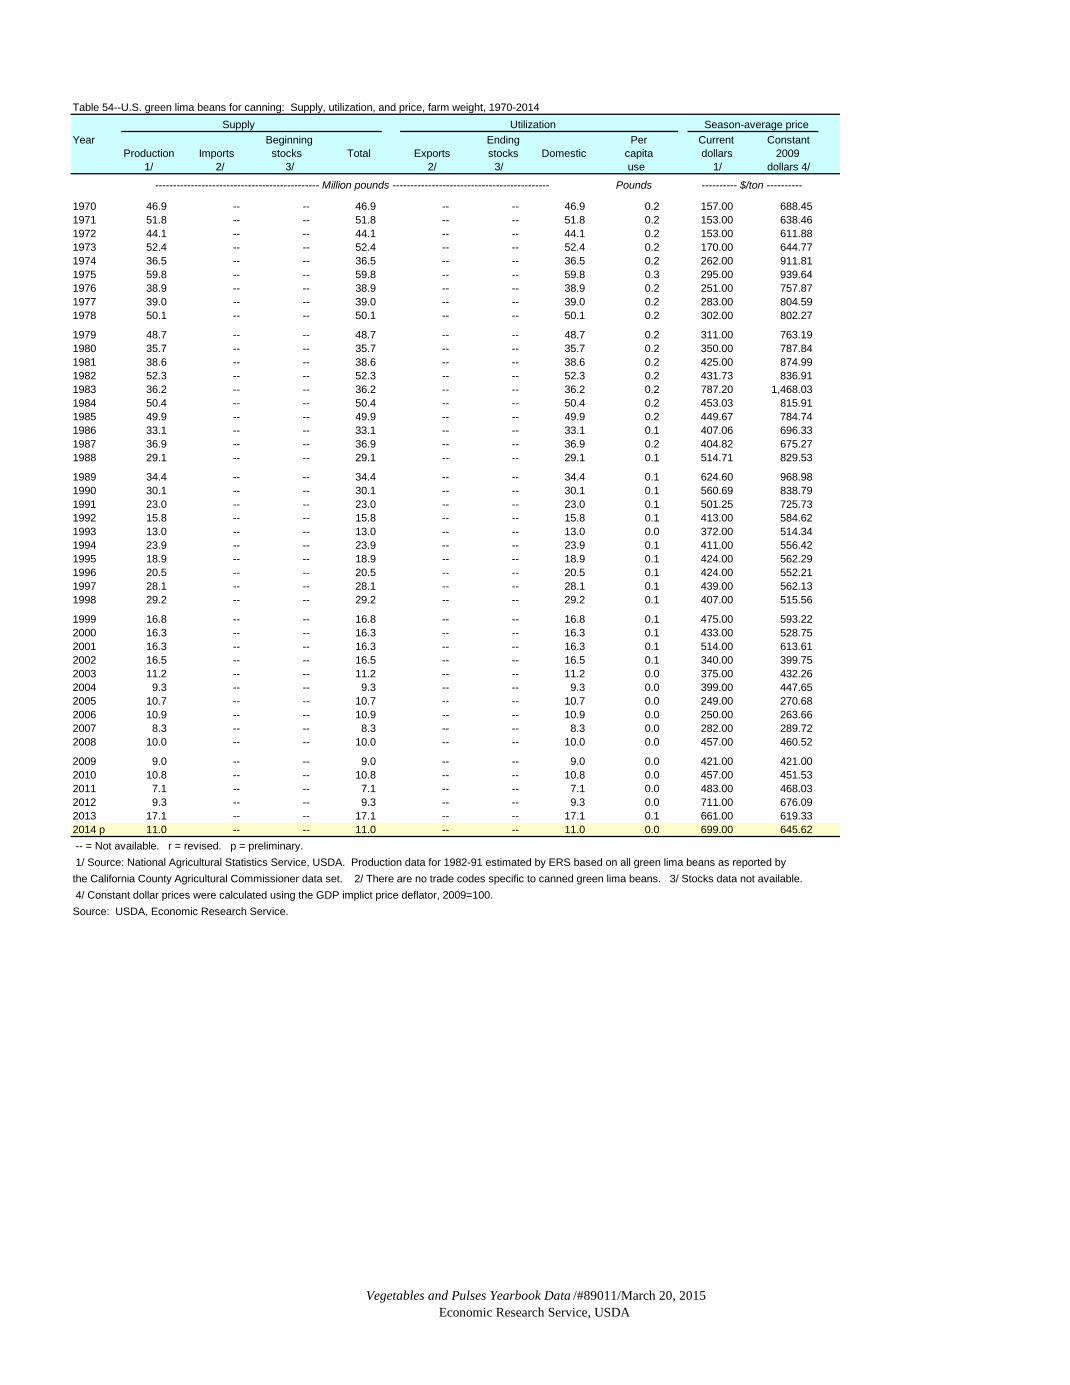
Vegetables and Pulses Yearbook Data /#89011/March 20, 2015Economic Research Service, USDA
Table 54--U.S. green lima beans for canning: Supply, utilization, and price, farm weight, 1970-2014 Supply Utilization Season-average price
Year Beginning Ending Per Current Constant Production Imports stocks Total Exports stocks Domestic capita dollars 2009
1/ 2/ 3/ 2/ 3/ use 1/ dollars 4/
---------------------------------------------- Million pounds -------------------------------------------- Pounds ---------- $/ton ----------
1970 46.9 -- -- 46.9 -- -- 46.9 0.2 157.00 688.451971 51.8 -- -- 51.8 -- -- 51.8 0.2 153.00 638.461972 44.1 -- -- 44.1 -- -- 44.1 0.2 153.00 611.881973 52.4 -- -- 52.4 -- -- 52.4 0.2 170.00 644.771974 36.5 -- -- 36.5 -- -- 36.5 0.2 262.00 911.811975 59.8 -- -- 59.8 -- -- 59.8 0.3 295.00 939.641976 38.9 -- -- 38.9 -- -- 38.9 0.2 251.00 757.871977 39.0 -- -- 39.0 -- -- 39.0 0.2 283.00 804.591978 50.1 -- -- 50.1 -- -- 50.1 0.2 302.00 802.27
1979 48.7 -- -- 48.7 -- -- 48.7 0.2 311.00 763.191980 35.7 -- -- 35.7 -- -- 35.7 0.2 350.00 787.841981 38.6 -- -- 38.6 -- -- 38.6 0.2 425.00 874.991982 52.3 -- -- 52.3 -- -- 52.3 0.2 431.73 836.911983 36.2 -- -- 36.2 -- -- 36.2 0.2 787.20 1,468.031984 50.4 -- -- 50.4 -- -- 50.4 0.2 453.03 815.911985 49.9 -- -- 49.9 -- -- 49.9 0.2 449.67 784.741986 33.1 -- -- 33.1 -- -- 33.1 0.1 407.06 696.331987 36.9 -- -- 36.9 -- -- 36.9 0.2 404.82 675.271988 29.1 -- -- 29.1 -- -- 29.1 0.1 514.71 829.53
1989 34.4 -- -- 34.4 -- -- 34.4 0.1 624.60 968.981990 30.1 -- -- 30.1 -- -- 30.1 0.1 560.69 838.791991 23.0 -- -- 23.0 -- -- 23.0 0.1 501.25 725.731992 15.8 -- -- 15.8 -- -- 15.8 0.1 413.00 584.621993 13.0 -- -- 13.0 -- -- 13.0 0.0 372.00 514.341994 23.9 -- -- 23.9 -- -- 23.9 0.1 411.00 556.421995 18.9 -- -- 18.9 -- -- 18.9 0.1 424.00 562.291996 20.5 -- -- 20.5 -- -- 20.5 0.1 424.00 552.211997 28.1 -- -- 28.1 -- -- 28.1 0.1 439.00 562.131998 29.2 -- -- 29.2 -- -- 29.2 0.1 407.00 515.56
1999 16.8 -- -- 16.8 -- -- 16.8 0.1 475.00 593.222000 16.3 -- -- 16.3 -- -- 16.3 0.1 433.00 528.752001 16.3 -- -- 16.3 -- -- 16.3 0.1 514.00 613.612002 16.5 -- -- 16.5 -- -- 16.5 0.1 340.00 399.752003 11.2 -- -- 11.2 -- -- 11.2 0.0 375.00 432.262004 9.3 -- -- 9.3 -- -- 9.3 0.0 399.00 447.652005 10.7 -- -- 10.7 -- -- 10.7 0.0 249.00 270.682006 10.9 -- -- 10.9 -- -- 10.9 0.0 250.00 263.662007 8.3 -- -- 8.3 -- -- 8.3 0.0 282.00 289.722008 10.0 -- -- 10.0 -- -- 10.0 0.0 457.00 460.52
2009 9.0 -- -- 9.0 -- -- 9.0 0.0 421.00 421.002010 10.8 -- -- 10.8 -- -- 10.8 0.0 457.00 451.532011 7.1 -- -- 7.1 -- -- 7.1 0.0 483.00 468.032012 9.3 -- -- 9.3 -- -- 9.3 0.0 711.00 676.092013 17.1 -- -- 17.1 -- -- 17.1 0.1 661.00 619.332014 p 11.0 -- -- 11.0 -- -- 11.0 0.0 699.00 645.62 -- = Not available. r = revised. p = preliminary. 1/ Source: National Agricultural Statistics Service, USDA. Production data for 1982-91 estimated by ERS based on all green lima beans as reported by the California County Agricultural Commissioner data set. 2/ There are no trade codes specific to canned green lima beans. 3/ Stocks data not available. 4/ Constant dollar prices were calculated using the GDP implict price deflator, 2009=100. Source: USDA, Economic Research Service.
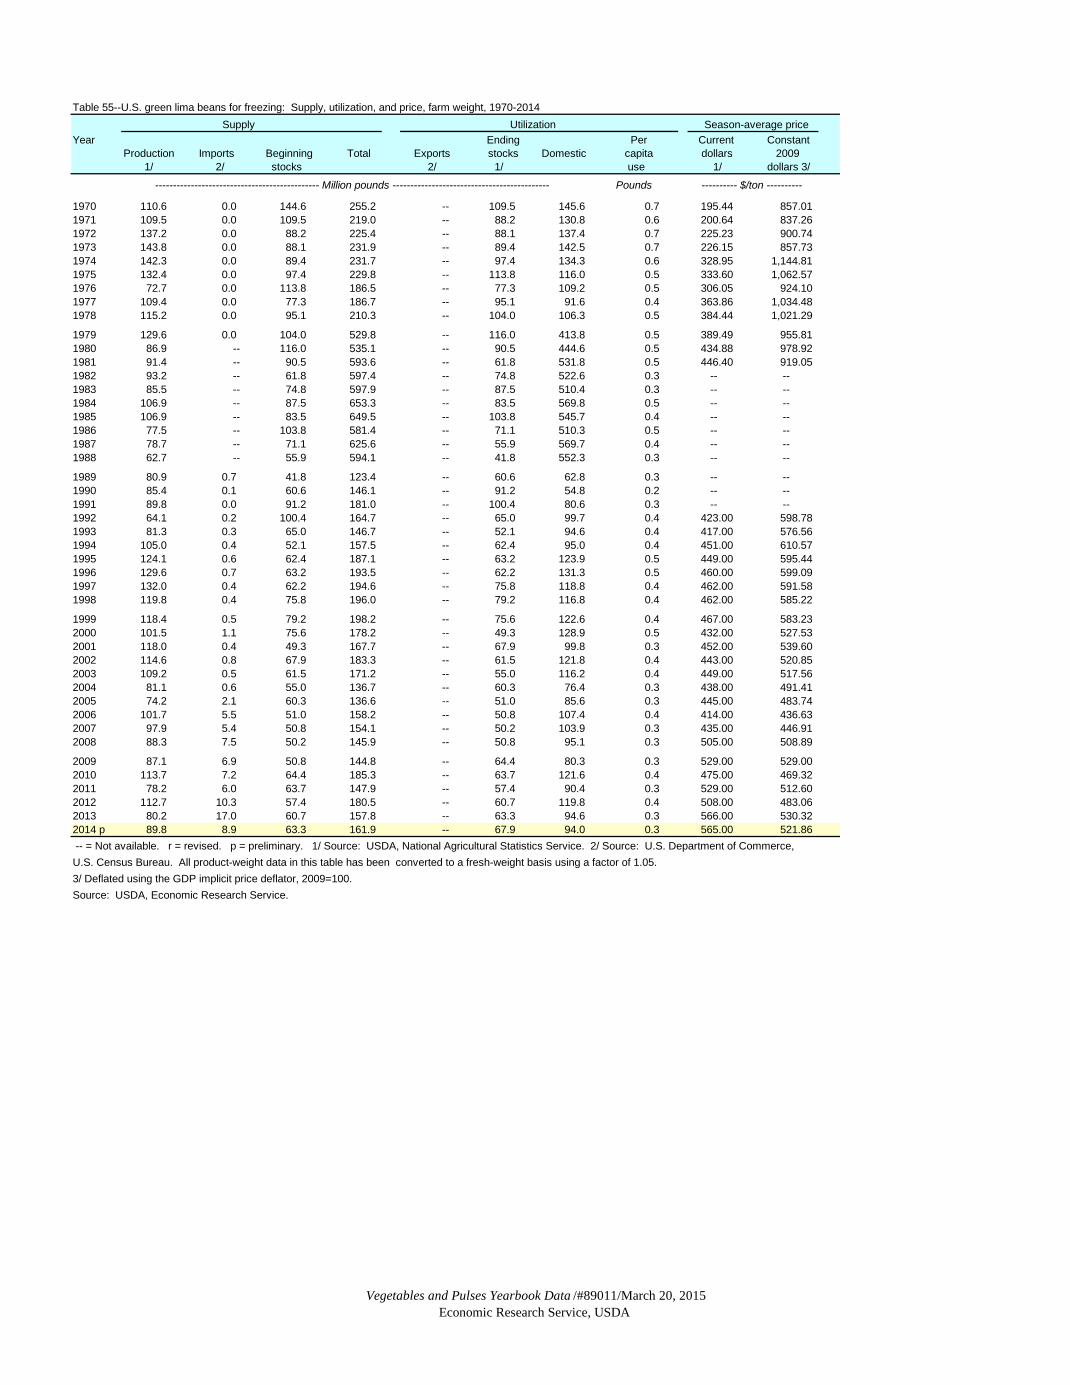
Vegetables and Pulses Yearbook Data /#89011/March 20, 2015Economic Research Service, USDA
Table 55--U.S. green lima beans for freezing: Supply, utilization, and price, farm weight, 1970-2014 Supply Utilization Season-average price
Year Ending Per Current Constant Production Imports Beginning Total Exports stocks Domestic capita dollars 2009
1/ 2/ stocks 2/ 1/ use 1/ dollars 3/
---------------------------------------------- Million pounds -------------------------------------------- Pounds ---------- $/ton ----------
1970 110.6 0.0 144.6 255.2 -- 109.5 145.6 0.7 195.44 857.011971 109.5 0.0 109.5 219.0 -- 88.2 130.8 0.6 200.64 837.261972 137.2 0.0 88.2 225.4 -- 88.1 137.4 0.7 225.23 900.741973 143.8 0.0 88.1 231.9 -- 89.4 142.5 0.7 226.15 857.731974 142.3 0.0 89.4 231.7 -- 97.4 134.3 0.6 328.95 1,144.811975 132.4 0.0 97.4 229.8 -- 113.8 116.0 0.5 333.60 1,062.571976 72.7 0.0 113.8 186.5 -- 77.3 109.2 0.5 306.05 924.101977 109.4 0.0 77.3 186.7 -- 95.1 91.6 0.4 363.86 1,034.481978 115.2 0.0 95.1 210.3 -- 104.0 106.3 0.5 384.44 1,021.29
1979 129.6 0.0 104.0 529.8 -- 116.0 413.8 0.5 389.49 955.811980 86.9 -- 116.0 535.1 -- 90.5 444.6 0.5 434.88 978.921981 91.4 -- 90.5 593.6 -- 61.8 531.8 0.5 446.40 919.051982 93.2 -- 61.8 597.4 -- 74.8 522.6 0.3 -- --1983 85.5 -- 74.8 597.9 -- 87.5 510.4 0.3 -- --1984 106.9 -- 87.5 653.3 -- 83.5 569.8 0.5 -- --1985 106.9 -- 83.5 649.5 -- 103.8 545.7 0.4 -- --1986 77.5 -- 103.8 581.4 -- 71.1 510.3 0.5 -- --1987 78.7 -- 71.1 625.6 -- 55.9 569.7 0.4 -- --1988 62.7 -- 55.9 594.1 -- 41.8 552.3 0.3 -- --
1989 80.9 0.7 41.8 123.4 -- 60.6 62.8 0.3 -- --1990 85.4 0.1 60.6 146.1 -- 91.2 54.8 0.2 -- --1991 89.8 0.0 91.2 181.0 -- 100.4 80.6 0.3 -- --1992 64.1 0.2 100.4 164.7 -- 65.0 99.7 0.4 423.00 598.781993 81.3 0.3 65.0 146.7 -- 52.1 94.6 0.4 417.00 576.561994 105.0 0.4 52.1 157.5 -- 62.4 95.0 0.4 451.00 610.571995 124.1 0.6 62.4 187.1 -- 63.2 123.9 0.5 449.00 595.441996 129.6 0.7 63.2 193.5 -- 62.2 131.3 0.5 460.00 599.091997 132.0 0.4 62.2 194.6 -- 75.8 118.8 0.4 462.00 591.581998 119.8 0.4 75.8 196.0 -- 79.2 116.8 0.4 462.00 585.22
1999 118.4 0.5 79.2 198.2 -- 75.6 122.6 0.4 467.00 583.232000 101.5 1.1 75.6 178.2 -- 49.3 128.9 0.5 432.00 527.532001 118.0 0.4 49.3 167.7 -- 67.9 99.8 0.3 452.00 539.602002 114.6 0.8 67.9 183.3 -- 61.5 121.8 0.4 443.00 520.852003 109.2 0.5 61.5 171.2 -- 55.0 116.2 0.4 449.00 517.562004 81.1 0.6 55.0 136.7 -- 60.3 76.4 0.3 438.00 491.412005 74.2 2.1 60.3 136.6 -- 51.0 85.6 0.3 445.00 483.742006 101.7 5.5 51.0 158.2 -- 50.8 107.4 0.4 414.00 436.632007 97.9 5.4 50.8 154.1 -- 50.2 103.9 0.3 435.00 446.912008 88.3 7.5 50.2 145.9 -- 50.8 95.1 0.3 505.00 508.89
2009 87.1 6.9 50.8 144.8 -- 64.4 80.3 0.3 529.00 529.002010 113.7 7.2 64.4 185.3 -- 63.7 121.6 0.4 475.00 469.322011 78.2 6.0 63.7 147.9 -- 57.4 90.4 0.3 529.00 512.602012 112.7 10.3 57.4 180.5 -- 60.7 119.8 0.4 508.00 483.062013 80.2 17.0 60.7 157.8 -- 63.3 94.6 0.3 566.00 530.322014 p 89.8 8.9 63.3 161.9 -- 67.9 94.0 0.3 565.00 521.86 -- = Not available. r = revised. p = preliminary. 1/ Source: USDA, National Agricultural Statistics Service. 2/ Source: U.S. Department of Commerce, U.S. Census Bureau. All product-weight data in this table has been converted to a fresh-weight basis using a factor of 1.05.3/ Deflated using the GDP implicit price deflator, 2009=100. Source: USDA, Economic Research Service.

Vegetables and Pulses Yearbook Data /#89011/March 20, 2015Economic Research Service, USDA
Table 56--U.S. mushrooms for processing, all: Supply, disappearance, and price, farm weight, 1970/71-2013/14
Supply Disappearance Season-average priceCrop Produc- Per Current Constantyear tion Imports Total Exports Domestic capita dollars 20091/ 2/ 3/ 3/ use 4/ dollars 5/
--------------------------------- Million pounds -------------------------------------- Pounds ------------ $/cwt ------------
1970/71 148.5 54.0 202.5 0.0 202.5 0.98 39.00 171.021971/72 165.1 71.8 236.8 0.0 236.8 1.13 41.50 173.181972/73 177.3 85.8 263.0 0.0 263.0 1.25 38.00 151.971973/74 177.2 82.0 259.2 0.0 259.2 1.22 36.70 139.191974/75 173.0 88.6 261.5 0.0 261.5 1.22 40.90 142.341975/76 167.7 100.1 267.7 0.0 267.7 1.23 53.00 168.821976/77 195.9 121.0 316.9 0.0 316.9 1.45 66.90 202.001977/78 207.6 150.8 358.4 0.0 358.4 1.62 65.20 185.371978/79 224.5 148.3 372.7 0.9 371.9 1.66 64.20 170.55
1979/80 214.2 179.3 393.5 1.0 392.5 1.73 57.60 141.351980/81 194.5 155.7 350.3 0.5 349.7 1.53 58.60 131.911981/82 198.0 157.2 355.2 0.7 354.5 1.53 55.50 114.261982/83 153.6 199.5 353.1 0.4 352.7 1.51 60.80 117.861983/84 173.5 252.2 425.7 0.7 425.0 1.81 64.60 120.471984/85 175.8 243.3 419.1 1.0 418.1 1.76 57.40 103.381985/86 160.8 273.9 434.6 1.0 433.6 1.81 54.90 95.811986/87 157.1 297.9 455.0 0.4 454.6 1.88 56.40 96.481987/88 162.9 239.0 401.9 1.1 400.9 1.64 61.00 101.751988/89 183.1 198.7 381.8 1.7 380.1 1.54 66.50 107.181989/90 203.1 189.9 392.9 12.7 380.2 1.53 65.30 101.30
1990/91 237.2 205.2 442.4 14.6 427.8 1.70 61.50 92.00
1991/92 249.9 210.4 460.3 18.4 441.9 1.73 63.80 92.371992/93 254.0 203.5 457.5 22.5 434.9 1.68 58.20 82.381993/94 234.0 233.8 467.8 14.9 452.9 1.73 66.20 91.531994/95 250.1 293.1 543.2 8.9 534.3 2.02 68.40 92.601995/96 240.7 234.2 475.0 9.5 465.5 1.74 57.90 76.781996/97 222.9 279.8 502.7 7.6 495.1 1.82 55.90 72.801997/98 187.1 276.2 463.4 9.3 454.1 1.65 55.30 70.811998/99 189.9 206.5 396.4 8.5 387.9 1.40 61.10 77.401999/00 185.9 269.7 455.5 14.2 441.3 1.57 60.60 75.68
2000/01 153.6 280.1 433.7 12.7 421.0 1.48 57.90 70.70
2001/02 141.1 257.2 398.4 12.8 385.6 1.34 52.50 62.67
2002/03 139.2 304.3 443.4 13.3 430.2 1.49 55.80 65.612003/04 137.7 326.4 464.1 22.1 442.0 1.51 53.20 61.322004/05 141.8 326.5 468.3 10.3 457.9 1.55 46.30 51.952005/06 129.1 268.3 397.4 9.2 388.2 1.30 42.80 46.532006/07 117.1 336.5 453.7 11.0 442.7 1.47 64.03 67.532007/08 117.7 335.4 453.1 18.9 434.2 1.43 65.12 66.902008/09 123.6 254.0 377.6 16.7 360.9 1.18 56.36 56.792009/10 107.1 258.2 365.3 14.1 351.2 1.14 58.74 58.74
2010/11 127.5 275.4 402.9 13.5 389.3 1.25 59.90 59.182011/12 110.4 294.7 405.1 13.3 391.8 1.25 62.80 60.852012/13 110.7 248.6 359.3 17.1 342.1 1.08 62.40 59.342013/14p 112.8 232.3 345.1 15.8 329.3 1.04 63.40 59.40and ends on June 30 of the following year. 2/ Source: USDA, National Agricultural Statistics Service. 3/ Source: U.S. Dept. of Commerce, U.S.Census Bureau. Includes canned, frozen, and dried mushrooms. Canned converted to fresh-weight basis using a factor of 1.538, frozen factor is 1.5, and dried factor is 10.0. Dried exports adjusted using Canadian data from 1979-88. 4/ Total disappearance divided by total U.S. population on January 1. Represents volume available for consumption per person. 5/ Deflated by the GDP implicit price deflator, 2009=100.Note: Due to lack of data, this table excludes changes in processed mushroom product inventories.Source: USDA, Economic Research Service.

Vegetables and Pulses Yearbook Data /#89011/March 20, 2015Economic Research Service, USDA
Table 57--U.S. onions for dehydrating: Supply, utilization, and price, farm weight, 1970-2014 1/ Supply Utilization Season-average price
Year Shrink Per Current ConstantProduction Imports Beginning Total Exports and Ending Domestic capita dollars 2009
2/ 3/ 4/ stocks 5/ 3/ 4/ loss 6/ stocks 5/ use 7/ dollars 8/
-------------------------------------------------- Million pounds ------------------------------------------------- Pounds ------- $/cwt -------
1970 470.0 0.7 0.0 470.7 219.9 5.7 11.1 234.0 1.2 -- --1971 510.0 0.5 11.1 521.6 190.7 13.0 8.2 309.7 1.5 -- --1972 409.2 3.0 8.2 420.4 221.8 9.1 5.6 183.9 0.9 -- --1973 499.1 1.9 5.6 506.6 246.7 7.8 7.4 244.7 1.2 -- --1974 594.0 11.0 7.4 612.4 262.9 12.4 7.0 330.1 1.5 -- --1975 639.0 0.9 7.0 646.9 202.6 11.2 8.9 424.2 2.0 -- --1976 490.0 0.3 8.9 499.2 305.3 13.0 15.4 165.5 0.8 -- --1977 585.2 0.4 15.4 601.0 282.8 10.0 13.8 294.4 1.3 -- --1978 588.4 1.2 13.8 603.4 275.2 16.4 21.2 290.6 1.3 -- --
1979 722.3 0.5 21.2 744.0 265.2 18.0 27.1 433.7 1.9 -- --1980 456.0 0.8 27.1 484.0 284.2 10.5 13.8 175.5 0.8 -- --1981 533.9 2.1 13.8 549.7 335.0 11.1 14.8 188.9 0.8 -- --1982 790.0 0.1 14.8 804.9 310.6 11.0 17.9 465.4 2.0 -- --1983 697.6 0.3 17.9 715.8 299.1 11.0 17.5 388.2 1.7 -- --1984 701.5 2.2 17.5 721.3 341.2 9.8 19.6 350.6 1.5 -- --1985 703.0 1.2 19.6 723.9 304.6 24.9 19.3 375.2 1.6 -- --1986 756.4 0.8 19.3 776.5 294.8 10.0 16.7 455.0 1.9 -- --1987 749.4 0.2 16.7 766.3 361.1 16.0 20.4 368.8 1.5 -- --1988 798.9 2.9 20.4 822.2 379.2 14.0 20.3 408.7 1.7 -- --
1989 769.5 48.1 20.3 838.0 407.7 10.0 21.4 398.8 1.6 -- --1990 880.8 95.7 21.4 997.9 463.2 11.7 22.2 500.8 2.0 -- --1991 804.2 46.9 22.2 873.4 443.0 8.7 23.2 398.5 1.6 -- --1992 783.8 43.8 23.2 850.8 444.7 13.8 23.4 368.9 1.4 -- --1993 956.0 59.4 23.4 1,038.8 483.5 17.3 19.4 518.6 2.0 6.10 8.431994 932.0 13.5 19.4 964.9 675.9 13.3 26.7 249.0 0.9 4.97 6.731995 952.0 4.6 26.7 983.3 592.2 13.3 25.6 352.1 1.3 5.65 7.491996 846.0 2.1 25.6 873.7 606.1 14.6 25.9 227.1 0.8 5.60 7.291997 916.0 8.1 25.9 950.0 665.1 13.9 27.2 243.8 0.9 5.74 7.351998 932.7 5.3 27.2 965.2 624.6 12.5 26.0 302.1 1.1 6.55 8.30
1999 1,255.0 10.3 26.0 1,291.3 609.8 12.5 32.4 636.6 2.3 6.55 8.182000 1,058.0 10.7 32.4 1,101.1 616.7 12.5 30.4 441.6 1.6 6.30 7.692001 912.5 19.5 30.4 962.4 620.6 12.5 32.7 296.6 1.0 5.50 6.572002 860.2 42.8 32.7 935.7 581.9 12.5 29.9 311.4 1.1 5.30 6.232003 1,080.0 48.1 29.9 1,158.0 579.1 12.5 30.3 536.1 1.8 5.18 5.972004 909.0 58.5 30.3 997.9 515.2 12.5 36.4 433.7 1.5 5.13 5.762005 829.0 92.2 36.4 957.7 579.7 12.5 31.1 334.3 1.1 7.14 7.762006 936.5 121.4 31.1 1,089.1 521.7 12.5 28.1 526.7 1.8 7.80 8.232007 865.5 60.3 28.1 953.9 596.0 12.5 36.3 309.1 1.0 8.30 8.532008 987.2 112.4 36.3 1,135.9 629.7 12.5 36.4 457.4 1.5 9.14 9.21
2009 1,087.5 121.3 36.4 1,245.1 605.7 12.5 38.7 588.2 1.9 10.00 10.002010 938.9 102.2 38.7 1,079.8 616.2 12.5 36.9 414.2 1.3 8.30 8.202011 972.4 79.7 36.9 1,089.0 629.6 12.5 39.0 407.9 1.3 7.50 7.272012 926.6 92.1 39.0 1,057.7 607.1 12.5 33.1 405.0 1.3 9.66 9.192013 880.0 102.8 33.1 1,015.9 668.8 12.5 33.5 301.1 1.0 8.32 7.802014 p 1,190.2 108.1 33.5 1,331.8 635.5 12.5 39.9 643.9 2.0 13.33 12.31 -- = Not available. p = preliminary. 1/ Excludes onions for fresh, canning, and freezing. 2/ From 1979-92, estimated by ERS as 76 percent of California summer crop. After 1992, production for processing estimated by USDA, National Agricultural Statistics Service. Price data also estimated by USDA/NASS starting in 1993. 3/ Product-weight data was converted to fresh basis using factor of 9.0. 4/ Source: U.S. Dept. of Commerce, U.S. Census Bureau. 5/ Stocks are for raw product to be processed and do not include finished inventory. Estimated by ERS as 80 percent of California summer onion stocks from 1970-80. Since 1980, estimated by ERS as 2.5 percent of U.S. Jan 1 onion inventory. 6/ Estimated by ERS as 50 percent of California's summer crop shrinkage and loss (assumes lower shrink in processing). 7/ Unit value of California onions destined for processing. 8/ Deflated by the GDP implicit price deflator, 2009=100.Source: USDA, Economic Research Service.
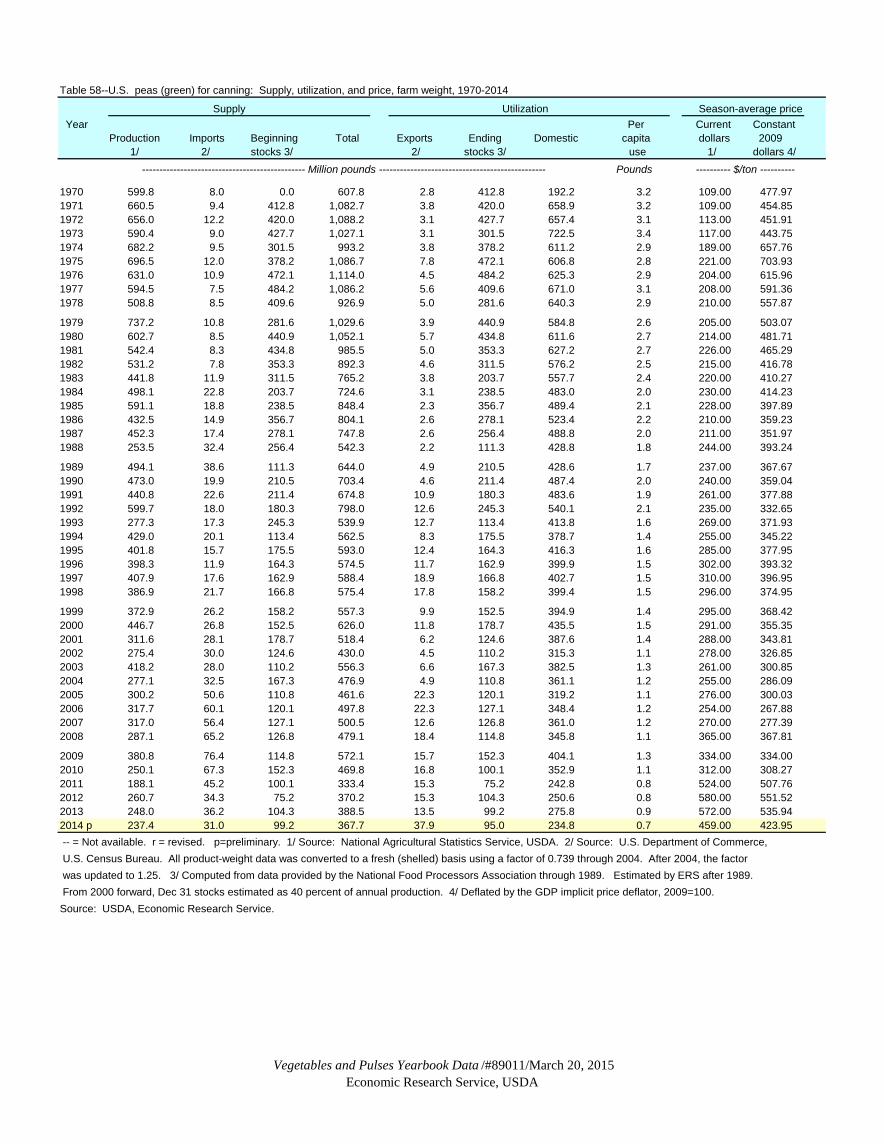
Vegetables and Pulses Yearbook Data /#89011/March 20, 2015Economic Research Service, USDA
Table 58--U.S. peas (green) for canning: Supply, utilization, and price, farm weight, 1970-2014
Supply Utilization Season-average price Year Per Current Constant
Production Imports Beginning Total Exports Ending Domestic capita dollars 2009 1/ 2/ stocks 3/ 2/ stocks 3/ use 1/ dollars 4/ ----------------------------------------------- Million pounds ------------------------------------------------ Pounds ---------- $/ton ----------
1970 599.8 8.0 0.0 607.8 2.8 412.8 192.2 3.2 109.00 477.971971 660.5 9.4 412.8 1,082.7 3.8 420.0 658.9 3.2 109.00 454.851972 656.0 12.2 420.0 1,088.2 3.1 427.7 657.4 3.1 113.00 451.911973 590.4 9.0 427.7 1,027.1 3.1 301.5 722.5 3.4 117.00 443.751974 682.2 9.5 301.5 993.2 3.8 378.2 611.2 2.9 189.00 657.761975 696.5 12.0 378.2 1,086.7 7.8 472.1 606.8 2.8 221.00 703.931976 631.0 10.9 472.1 1,114.0 4.5 484.2 625.3 2.9 204.00 615.961977 594.5 7.5 484.2 1,086.2 5.6 409.6 671.0 3.1 208.00 591.361978 508.8 8.5 409.6 926.9 5.0 281.6 640.3 2.9 210.00 557.87
1979 737.2 10.8 281.6 1,029.6 3.9 440.9 584.8 2.6 205.00 503.071980 602.7 8.5 440.9 1,052.1 5.7 434.8 611.6 2.7 214.00 481.711981 542.4 8.3 434.8 985.5 5.0 353.3 627.2 2.7 226.00 465.291982 531.2 7.8 353.3 892.3 4.6 311.5 576.2 2.5 215.00 416.781983 441.8 11.9 311.5 765.2 3.8 203.7 557.7 2.4 220.00 410.271984 498.1 22.8 203.7 724.6 3.1 238.5 483.0 2.0 230.00 414.231985 591.1 18.8 238.5 848.4 2.3 356.7 489.4 2.1 228.00 397.891986 432.5 14.9 356.7 804.1 2.6 278.1 523.4 2.2 210.00 359.231987 452.3 17.4 278.1 747.8 2.6 256.4 488.8 2.0 211.00 351.971988 253.5 32.4 256.4 542.3 2.2 111.3 428.8 1.8 244.00 393.24
1989 494.1 38.6 111.3 644.0 4.9 210.5 428.6 1.7 237.00 367.671990 473.0 19.9 210.5 703.4 4.6 211.4 487.4 2.0 240.00 359.041991 440.8 22.6 211.4 674.8 10.9 180.3 483.6 1.9 261.00 377.881992 599.7 18.0 180.3 798.0 12.6 245.3 540.1 2.1 235.00 332.651993 277.3 17.3 245.3 539.9 12.7 113.4 413.8 1.6 269.00 371.931994 429.0 20.1 113.4 562.5 8.3 175.5 378.7 1.4 255.00 345.221995 401.8 15.7 175.5 593.0 12.4 164.3 416.3 1.6 285.00 377.951996 398.3 11.9 164.3 574.5 11.7 162.9 399.9 1.5 302.00 393.321997 407.9 17.6 162.9 588.4 18.9 166.8 402.7 1.5 310.00 396.951998 386.9 21.7 166.8 575.4 17.8 158.2 399.4 1.5 296.00 374.95
1999 372.9 26.2 158.2 557.3 9.9 152.5 394.9 1.4 295.00 368.422000 446.7 26.8 152.5 626.0 11.8 178.7 435.5 1.5 291.00 355.352001 311.6 28.1 178.7 518.4 6.2 124.6 387.6 1.4 288.00 343.812002 275.4 30.0 124.6 430.0 4.5 110.2 315.3 1.1 278.00 326.852003 418.2 28.0 110.2 556.3 6.6 167.3 382.5 1.3 261.00 300.852004 277.1 32.5 167.3 476.9 4.9 110.8 361.1 1.2 255.00 286.092005 300.2 50.6 110.8 461.6 22.3 120.1 319.2 1.1 276.00 300.032006 317.7 60.1 120.1 497.8 22.3 127.1 348.4 1.2 254.00 267.882007 317.0 56.4 127.1 500.5 12.6 126.8 361.0 1.2 270.00 277.392008 287.1 65.2 126.8 479.1 18.4 114.8 345.8 1.1 365.00 367.81
2009 380.8 76.4 114.8 572.1 15.7 152.3 404.1 1.3 334.00 334.002010 250.1 67.3 152.3 469.8 16.8 100.1 352.9 1.1 312.00 308.272011 188.1 45.2 100.1 333.4 15.3 75.2 242.8 0.8 524.00 507.762012 260.7 34.3 75.2 370.2 15.3 104.3 250.6 0.8 580.00 551.522013 248.0 36.2 104.3 388.5 13.5 99.2 275.8 0.9 572.00 535.942014 p 237.4 31.0 99.2 367.7 37.9 95.0 234.8 0.7 459.00 423.95 -- = Not available. r = revised. p=preliminary. 1/ Source: National Agricultural Statistics Service, USDA. 2/ Source: U.S. Department of Commerce, U.S. Census Bureau. All product-weight data was converted to a fresh (shelled) basis using a factor of 0.739 through 2004. After 2004, the factor was updated to 1.25. 3/ Computed from data provided by the National Food Processors Association through 1989. Estimated by ERS after 1989. From 2000 forward, Dec 31 stocks estimated as 40 percent of annual production. 4/ Deflated by the GDP implicit price deflator, 2009=100. Source: USDA, Economic Research Service.

Vegetables and Pulses Yearbook Data /#89011/March 20, 2015Economic Research Service, USDA
Table 59--U.S. peas (green) for freezing: Supply, utilization, and price, farm weight, 1970-2014 Supply Utilization Season-average price
Year Ending Per Current Constant Production Imports Beginning Total Exports stocks Domestic capita dollars 2009
1/ 2/ stocks 2/ 1/ 3/ use 1/ dollars 4/
---------------------------------------------- Million pounds -------------------------------------------- Pounds ---------- $/ton ----------
1970 352.7 0.2 303.1 656.0 2.2 260.3 393.5 1.9 109.00 477.971971 394.8 0.2 260.3 655.3 1.5 228.5 425.3 2.1 105.00 438.161972 376.1 0.3 228.5 604.9 1.9 183.8 419.2 2.0 111.00 443.911973 424.9 1.2 183.8 609.9 3.8 196.9 409.2 1.9 122.00 462.721974 464.1 0.9 196.9 661.9 5.6 241.2 415.1 1.9 206.00 716.921975 445.0 1.0 241.2 687.2 5.8 272.9 408.5 1.9 214.00 681.641976 395.4 0.6 272.9 668.9 9.6 251.2 408.1 1.9 190.00 573.691977 383.4 5.4 251.2 640.0 7.6 246.1 386.3 1.8 202.00 574.301978 413.4 10.4 246.1 669.9 25.6 248.5 395.8 1.8 200.00 531.31
1979 489.5 9.6 248.5 747.6 17.6 305.9 424.2 1.9 218.00 534.971980 365.8 9.5 305.9 681.2 28.6 246.9 405.7 1.8 202.00 454.701981 367.7 10.8 246.9 625.5 36.4 196.5 394.6 1.7 206.00 424.111982 461.4 17.8 196.5 675.7 21.7 269.3 384.6 1.7 240.00 465.241983 409.7 21.2 269.3 700.3 21.5 249.6 429.2 1.8 212.00 395.351984 492.6 24.3 249.6 766.5 22.0 275.6 468.9 2.0 244.00 439.441985 564.5 19.3 275.6 859.5 17.4 343.3 498.7 2.1 252.00 439.781986 397.3 19.1 343.3 759.7 28.9 272.4 458.4 1.9 244.00 417.391987 426.8 22.0 272.4 721.1 30.1 273.8 417.2 1.7 238.00 397.001988 372.8 40.8 273.8 687.4 38.5 181.8 467.1 1.9 226.00 364.23
1989 515.2 62.8 181.8 759.9 17.8 253.0 489.1 2.0 238.00 369.221990 583.3 42.1 253.0 878.4 17.1 307.5 553.7 2.2 256.00 382.981991 541.4 36.6 307.5 885.5 18.7 297.2 569.6 2.3 260.00 376.441992 539.1 31.9 297.2 868.2 24.5 332.6 511.1 2.0 242.00 342.561993 424.8 37.5 332.6 794.9 26.0 284.9 484.0 1.9 239.00 330.451994 548.2 38.4 284.9 871.5 25.3 283.9 562.3 2.1 253.00 342.521995 583.4 31.9 283.9 899.2 39.2 306.7 553.3 2.1 256.00 339.501996 437.0 36.1 306.7 779.8 36.7 227.1 516.0 1.9 268.00 349.041997 552.1 41.0 227.1 820.2 28.8 239.3 552.1 2.0 272.00 348.291998 580.9 34.5 239.3 854.7 28.9 302.9 522.9 1.9 273.00 345.81
1999 550.3 49.1 302.9 902.3 32.7 301.0 568.6 2.0 261.00 325.962000 614.4 42.9 301.0 958.3 33.7 322.4 602.1 2.1 217.00 264.992001 470.4 42.6 322.4 835.4 26.5 244.9 563.9 2.0 249.00 297.262002 424.3 44.2 244.9 713.5 36.7 186.6 490.2 1.7 236.00 277.472003 506.3 68.4 186.6 761.3 35.0 197.1 529.2 1.8 243.00 280.102004 489.7 61.0 197.1 747.8 30.2 251.1 466.6 1.6 255.00 286.092005 439.9 53.3 251.1 744.3 31.4 237.5 475.5 1.6 266.00 289.162006 467.2 59.8 237.5 764.5 34.0 255.7 474.8 1.6 241.00 254.172007 521.2 62.9 255.7 839.8 27.4 258.2 554.2 1.8 253.00 259.932008 536.4 77.3 258.2 872.0 40.5 283.6 547.9 1.8 357.00 359.75
2009 502.6 72.3 283.6 858.4 34.1 305.9 518.4 1.7 307.00 307.002010 441.1 66.1 305.9 813.2 38.8 307.0 467.4 1.5 273.00 269.732011 440.2 57.8 307.0 805.0 47.9 265.2 491.8 1.6 370.00 358.532012 553.8 61.4 265.2 880.3 42.9 243.7 593.7 1.9 366.00 348.032013 464.1 66.6 243.7 774.4 42.1 253.7 478.6 1.5 349.00 327.002014 p 488.3 69.2 253.7 811.2 40.6 267.3 503.4 1.6 323.00 298.34 -- = Not available. r = revised. p = preliminary. 1/ Source: USDA, National Agricultural Statistics Service. 2/ Source: U.S. Department of Commerce, U.S. Census Bureau. All product weight data were converted to a fresh-weight (shelled) basis using a factor of 1.09 through 2004. Beginning in 2005, the factor was updated to 1.11. 3/ Excludes green pea stocks used in mixed pea/carrot products. 4/ Constant-dollar prices were calculated using the GDP implicit price deflator, 2009=100.Source: USDA, Economic Research Service.
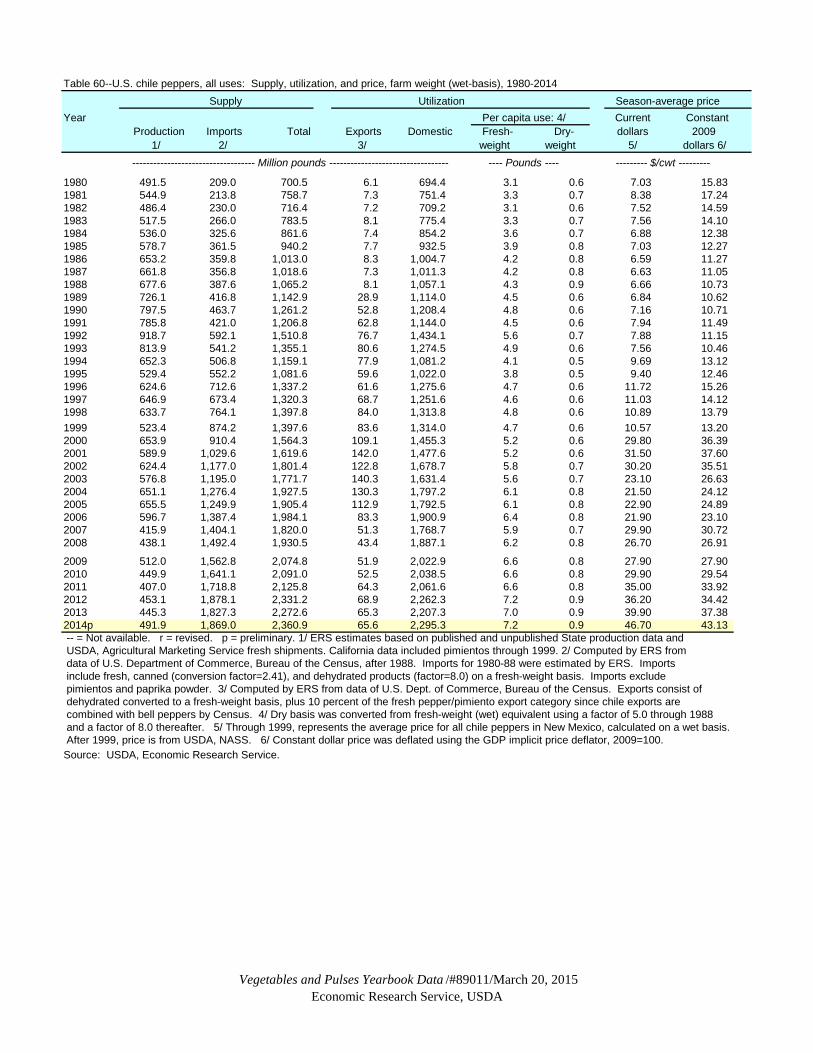
Vegetables and Pulses Yearbook Data /#89011/March 20, 2015Economic Research Service, USDA
Table 60--U.S. chile peppers, all uses: Supply, utilization, and price, farm weight (wet-basis), 1980-2014 Supply Utilization Season-average price
Year Per capita use: 4/ Current Constant Production Imports Total Exports Domestic Fresh- Dry- dollars 2009 1/ 2/ 3/ weight weight 5/ dollars 6/ ----------------------------------- Million pounds ---------------------------------- ---- Pounds ---- --------- $/cwt ---------
1980 491.5 209.0 700.5 6.1 694.4 3.1 0.6 7.03 15.831981 544.9 213.8 758.7 7.3 751.4 3.3 0.7 8.38 17.241982 486.4 230.0 716.4 7.2 709.2 3.1 0.6 7.52 14.591983 517.5 266.0 783.5 8.1 775.4 3.3 0.7 7.56 14.101984 536.0 325.6 861.6 7.4 854.2 3.6 0.7 6.88 12.381985 578.7 361.5 940.2 7.7 932.5 3.9 0.8 7.03 12.271986 653.2 359.8 1,013.0 8.3 1,004.7 4.2 0.8 6.59 11.271987 661.8 356.8 1,018.6 7.3 1,011.3 4.2 0.8 6.63 11.051988 677.6 387.6 1,065.2 8.1 1,057.1 4.3 0.9 6.66 10.731989 726.1 416.8 1,142.9 28.9 1,114.0 4.5 0.6 6.84 10.621990 797.5 463.7 1,261.2 52.8 1,208.4 4.8 0.6 7.16 10.711991 785.8 421.0 1,206.8 62.8 1,144.0 4.5 0.6 7.94 11.491992 918.7 592.1 1,510.8 76.7 1,434.1 5.6 0.7 7.88 11.151993 813.9 541.2 1,355.1 80.6 1,274.5 4.9 0.6 7.56 10.461994 652.3 506.8 1,159.1 77.9 1,081.2 4.1 0.5 9.69 13.121995 529.4 552.2 1,081.6 59.6 1,022.0 3.8 0.5 9.40 12.461996 624.6 712.6 1,337.2 61.6 1,275.6 4.7 0.6 11.72 15.261997 646.9 673.4 1,320.3 68.7 1,251.6 4.6 0.6 11.03 14.121998 633.7 764.1 1,397.8 84.0 1,313.8 4.8 0.6 10.89 13.791999 523.4 874.2 1,397.6 83.6 1,314.0 4.7 0.6 10.57 13.202000 653.9 910.4 1,564.3 109.1 1,455.3 5.2 0.6 29.80 36.39 2001 589.9 1,029.6 1,619.6 142.0 1,477.6 5.2 0.6 31.50 37.602002 624.4 1,177.0 1,801.4 122.8 1,678.7 5.8 0.7 30.20 35.512003 576.8 1,195.0 1,771.7 140.3 1,631.4 5.6 0.7 23.10 26.632004 651.1 1,276.4 1,927.5 130.3 1,797.2 6.1 0.8 21.50 24.122005 655.5 1,249.9 1,905.4 112.9 1,792.5 6.1 0.8 22.90 24.892006 596.7 1,387.4 1,984.1 83.3 1,900.9 6.4 0.8 21.90 23.102007 415.9 1,404.1 1,820.0 51.3 1,768.7 5.9 0.7 29.90 30.722008 438.1 1,492.4 1,930.5 43.4 1,887.1 6.2 0.8 26.70 26.91
2009 512.0 1,562.8 2,074.8 51.9 2,022.9 6.6 0.8 27.90 27.902010 449.9 1,641.1 2,091.0 52.5 2,038.5 6.6 0.8 29.90 29.542011 407.0 1,718.8 2,125.8 64.3 2,061.6 6.6 0.8 35.00 33.922012 453.1 1,878.1 2,331.2 68.9 2,262.3 7.2 0.9 36.20 34.422013 445.3 1,827.3 2,272.6 65.3 2,207.3 7.0 0.9 39.90 37.382014p 491.9 1,869.0 2,360.9 65.6 2,295.3 7.2 0.9 46.70 43.13 -- = Not available. r = revised. p = preliminary. 1/ ERS estimates based on published and unpublished State production data and USDA, Agricultural Marketing Service fresh shipments. California data included pimientos through 1999. 2/ Computed by ERS from data of U.S. Department of Commerce, Bureau of the Census, after 1988. Imports for 1980-88 were estimated by ERS. Imports include fresh, canned (conversion factor=2.41), and dehydrated products (factor=8.0) on a fresh-weight basis. Imports exclude pimientos and paprika powder. 3/ Computed by ERS from data of U.S. Dept. of Commerce, Bureau of the Census. Exports consist of dehydrated converted to a fresh-weight basis, plus 10 percent of the fresh pepper/pimiento export category since chile exports are combined with bell peppers by Census. 4/ Dry basis was converted from fresh-weight (wet) equivalent using a factor of 5.0 through 1988 and a factor of 8.0 thereafter. 5/ Through 1999, represents the average price for all chile peppers in New Mexico, calculated on a wet basis. After 1999, price is from USDA, NASS. 6/ Constant dollar price was deflated using the GDP implicit price deflator, 2009=100.Source: USDA, Economic Research Service.
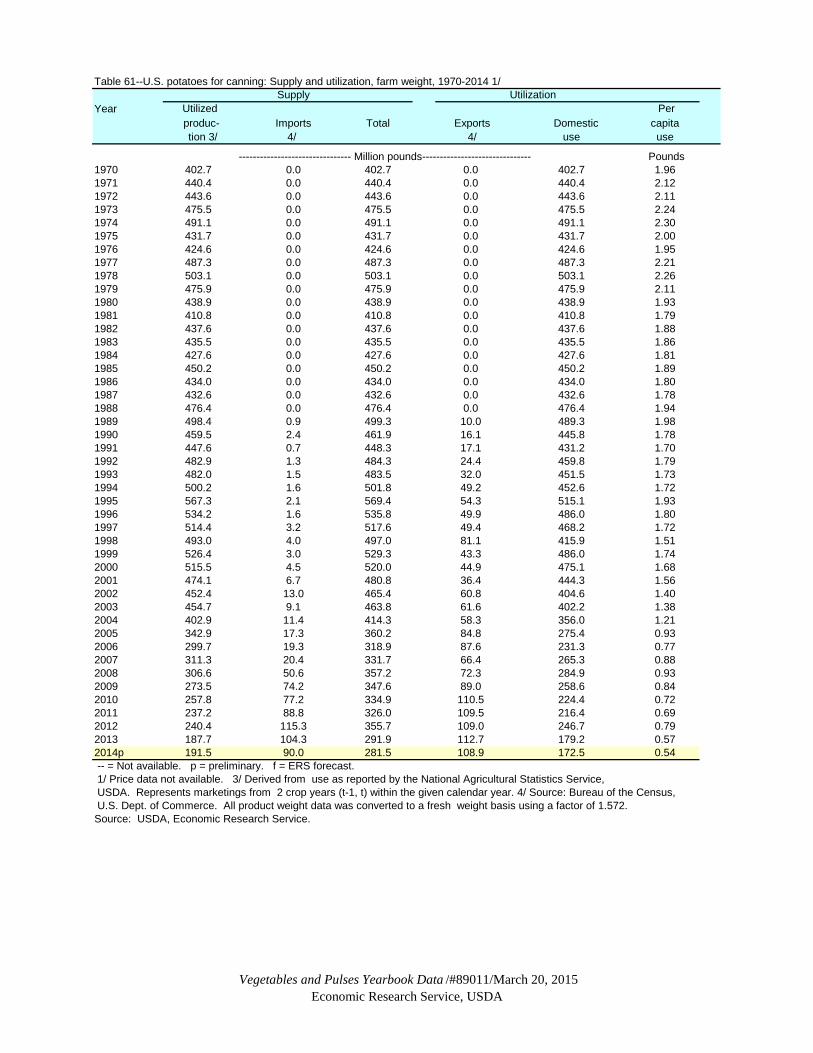
Vegetables and Pulses Yearbook Data /#89011/March 20, 2015Economic Research Service, USDA
Table 61--U.S. potatoes for canning: Supply and utilization, farm weight, 1970-2014 1/Supply
Year Utilized Per produc- Imports Total Exports Domestic capita tion 3/ 4/ 4/ use use
Pounds1970 402.7 0.0 402.7 0.0 402.7 1.961971 440.4 0.0 440.4 0.0 440.4 2.121972 443.6 0.0 443.6 0.0 443.6 2.111973 475.5 0.0 475.5 0.0 475.5 2.241974 491.1 0.0 491.1 0.0 491.1 2.301975 431.7 0.0 431.7 0.0 431.7 2.001976 424.6 0.0 424.6 0.0 424.6 1.951977 487.3 0.0 487.3 0.0 487.3 2.211978 503.1 0.0 503.1 0.0 503.1 2.261979 475.9 0.0 475.9 0.0 475.9 2.111980 438.9 0.0 438.9 0.0 438.9 1.931981 410.8 0.0 410.8 0.0 410.8 1.791982 437.6 0.0 437.6 0.0 437.6 1.881983 435.5 0.0 435.5 0.0 435.5 1.861984 427.6 0.0 427.6 0.0 427.6 1.811985 450.2 0.0 450.2 0.0 450.2 1.891986 434.0 0.0 434.0 0.0 434.0 1.801987 432.6 0.0 432.6 0.0 432.6 1.781988 476.4 0.0 476.4 0.0 476.4 1.941989 498.4 0.9 499.3 10.0 489.3 1.981990 459.5 2.4 461.9 16.1 445.8 1.781991 447.6 0.7 448.3 17.1 431.2 1.701992 482.9 1.3 484.3 24.4 459.8 1.791993 482.0 1.5 483.5 32.0 451.5 1.731994 500.2 1.6 501.8 49.2 452.6 1.721995 567.3 2.1 569.4 54.3 515.1 1.931996 534.2 1.6 535.8 49.9 486.0 1.801997 514.4 3.2 517.6 49.4 468.2 1.721998 493.0 4.0 497.0 81.1 415.9 1.511999 526.4 3.0 529.3 43.3 486.0 1.742000 515.5 4.5 520.0 44.9 475.1 1.682001 474.1 6.7 480.8 36.4 444.3 1.562002 452.4 13.0 465.4 60.8 404.6 1.402003 454.7 9.1 463.8 61.6 402.2 1.382004 402.9 11.4 414.3 58.3 356.0 1.212005 342.9 17.3 360.2 84.8 275.4 0.932006 299.7 19.3 318.9 87.6 231.3 0.772007 311.3 20.4 331.7 66.4 265.3 0.882008 306.6 50.6 357.2 72.3 284.9 0.932009 273.5 74.2 347.6 89.0 258.6 0.842010 257.8 77.2 334.9 110.5 224.4 0.722011 237.2 88.8 326.0 109.5 216.4 0.692012 240.4 115.3 355.7 109.0 246.7 0.792013 187.7 104.3 291.9 112.7 179.2 0.572014p 191.5 90.0 281.5 108.9 172.5 0.54 -- = Not available. p = preliminary. f = ERS forecast. 1/ Price data not available. 3/ Derived from use as reported by the National Agricultural Statistics Service, USDA. Represents marketings from 2 crop years (t-1, t) within the given calendar year. 4/ Source: Bureau of the Census, U.S. Dept. of Commerce. All product weight data was converted to a fresh weight basis using a factor of 1.572.Source: USDA, Economic Research Service.
-------------------------------- Million pounds-------------------------------
Utilization

Vegetables and Pulses Yearbook Data /#89011/March 20, 2015Economic Research Service, USDA
Table 62--U.S. potatoes for chips and shoestrings: Supply and utilization, farm weight, 1970-2014 1/Supply
Year Utilized Per produc- Imports Total Exports Domestic capita tion 3/ 4/ 4/ use use
Pounds1970 3,566.0 0.0 3,566.0 0.0 3,566.0 17.401971 3,561.9 0.0 3,561.9 0.0 3,561.9 17.201972 3,497.7 0.0 3,497.7 0.0 3,497.7 16.701973 3,453.2 0.0 3,453.2 0.0 3,453.2 16.301974 3,363.1 0.0 3,363.1 0.0 3,363.1 15.701975 3,344.2 0.0 3,344.2 0.0 3,344.2 15.501976 3,434.5 0.0 3,434.5 0.0 3,434.5 15.801977 3,576.5 0.0 3,576.5 0.0 3,576.5 16.201978 3,739.3 0.0 3,739.3 63.1 3,676.2 16.501979 3,805.8 0.0 3,805.8 57.0 3,748.7 16.701980 3,808.5 0.0 3,808.5 54.0 3,754.5 16.501981 3,861.9 0.0 3,861.9 46.8 3,815.1 16.601982 3,999.7 0.0 3,999.7 54.4 3,945.3 17.001983 4,198.1 0.0 4,198.1 37.3 4,160.8 17.801984 4,282.5 0.0 4,282.5 35.1 4,247.4 18.001985 4,227.8 0.0 4,227.8 32.0 4,195.8 17.601986 4,402.0 0.0 4,402.0 35.9 4,366.1 18.141987 4,320.4 0.0 4,320.4 50.6 4,269.7 17.591988 4,256.6 0.0 4,256.6 67.7 4,188.9 17.101989 4,380.5 0.6 4,381.1 84.3 4,296.8 17.371990 4,243.8 15.2 4,259.0 176.9 4,082.1 16.321991 4,551.6 14.5 4,566.1 218.3 4,347.8 17.151992 4,680.8 16.6 4,697.4 337.5 4,359.9 16.971993 4,979.2 10.0 4,989.2 441.0 4,548.2 17.481994 4,882.9 4.0 4,886.9 620.4 4,266.5 16.201995 4,838.8 0.0 4,838.8 543.0 4,295.7 16.121996 4,866.8 7.9 4,874.7 515.0 4,359.7 16.171997 4,694.6 4.2 4,698.8 545.1 4,153.7 15.221998 4,908.7 20.6 4,929.3 982.1 3,947.2 14.301999 5,226.9 42.4 5,269.2 949.5 4,319.7 15.472000 5,064.5 152.1 5,216.6 806.2 4,410.4 15.622001 5,415.8 165.0 5,580.8 620.6 4,960.3 17.392002 5,197.3 147.7 5,345.0 655.0 4,690.0 16.282003 5,251.5 246.0 5,497.4 501.9 4,995.5 17.182004 5,138.1 304.7 5,442.8 618.5 4,824.3 16.442005 5,084.5 286.7 5,371.2 617.7 4,753.5 16.052006 5,855.7 247.3 6,103.0 536.8 5,566.2 18.622007 5,919.8 195.6 6,115.4 503.7 5,611.7 18.582008 5,251.7 93.1 5,344.8 564.3 4,780.5 15.682009 4,563.8 124.3 4,688.2 490.4 4,197.8 13.672010 4,942.9 129.8 5,072.7 427.1 4,645.6 15.002011 5,693.3 94.8 5,788.0 556.3 5,231.7 16.772012 5,856.4 91.7 5,948.2 449.3 5,498.9 17.502013 6,000.1 94.1 6,094.2 383.6 5,710.6 18.102014p 5,693.6 108.3 5,801.8 409.3 5,392.5 17.03 -- = Not available. p = preliminary. f = ERS forecast. 1/ Price data not available. 3/ Derived from use as reported by the National Agricultural Statistics Service, USDA. Represents marketings from 2 crop years (t-1, t) within the given calendar year. 4/ Source: Bureau of the Census, U.S. Dept. of Commerce. Prior to 1978, potato chip exports included corn chips. Includes chips produced from reconstituted potatoes. 5/ Converted to a fresh-weight basis using a factor of 4. The conversion factor was changed from 4.08 to 4 beginning with 1990. 6/ Source is Bureau of the Census, USDC.Source: USDA, Economic Research Service.
-------------------------------- Million pounds-------------------------------
Utilization

Vegetables and Pulses Yearbook Data /#89011/March 20, 2015Economic Research Service, USDA
Table 63--U.S. potatoes for dehydration: Supply and utilization, farm weight, 1970-2014 1/Supply
Year Utilized Per produc- Imports Total Exports Domestic capita tion 3/ 4/ 4/ use use
Pounds1970 2,576.8 3.8 2,580.6 123.1 2,457.5 12.001971 2,653.7 4.8 2,658.5 100.3 2,558.2 12.301972 2,723.6 7.0 2,730.5 119.8 2,610.8 12.401973 2,942.9 8.0 2,950.9 176.3 2,774.5 13.101974 3,303.4 8.1 3,311.4 206.1 3,105.3 14.501975 3,424.1 11.3 3,435.4 259.4 3,176.0 14.701976 3,708.8 1.1 3,709.9 146.8 3,563.1 16.301977 3,656.9 1.6 3,658.4 1,150.6 2,507.8 11.401978 3,301.3 21.2 3,322.5 632.9 2,689.6 12.101979 3,201.4 14.0 3,215.3 697.3 2,518.0 11.201980 2,950.3 6.2 2,956.5 731.3 2,225.1 9.801981 2,904.9 20.2 2,925.1 433.8 2,491.3 10.801982 2,879.8 14.7 2,894.4 484.1 2,410.3 10.401983 2,723.7 8.6 2,732.3 394.2 2,338.1 10.001984 2,730.0 29.5 2,759.5 327.4 2,432.2 10.301985 2,890.2 42.5 2,932.7 259.8 2,672.9 11.201986 2,920.2 43.7 2,963.9 332.6 2,631.3 10.901987 2,963.5 37.0 3,000.5 388.9 2,611.6 10.801988 2,980.5 37.7 3,018.1 463.6 2,554.5 10.431989 3,048.7 33.0 3,081.6 413.1 2,668.6 10.791990 3,499.0 18.0 3,517.0 330.5 3,186.5 12.741991 3,995.2 21.6 4,016.8 511.3 3,505.5 13.831992 3,856.9 13.0 3,869.9 574.2 3,295.7 12.831993 4,050.8 17.3 4,068.1 511.2 3,556.8 13.671994 4,085.7 17.2 4,102.9 619.4 3,483.5 13.221995 4,383.6 30.5 4,414.1 893.0 3,521.1 13.211996 5,144.2 24.9 5,169.1 670.6 4,498.5 16.681997 4,939.2 21.9 4,961.0 731.9 4,229.1 15.501998 5,147.9 43.8 5,191.8 630.5 4,561.3 16.521999 5,280.1 77.5 5,357.6 1,906.2 3,451.5 12.362000 5,075.5 141.2 5,216.6 775.7 4,440.9 15.732001 4,779.0 165.3 4,944.3 728.6 4,215.8 14.782002 4,577.5 195.4 4,772.9 531.7 4,241.2 14.722003 5,003.8 234.4 5,238.3 743.2 4,495.0 15.462004 4,853.2 145.5 4,998.7 954.3 4,044.5 13.782005 4,542.6 153.4 4,696.0 909.8 3,786.2 12.782006 4,615.8 106.8 4,722.6 1,004.4 3,718.2 12.442007 4,901.9 137.9 5,039.8 1,105.2 3,934.6 13.032008 4,455.0 253.9 4,708.9 935.2 3,773.6 12.382009 4,173.5 337.8 4,511.3 876.5 3,634.7 11.842010 3,976.1 472.3 4,448.4 976.1 3,472.2 11.212011 4,026.9 469.0 4,495.9 1,200.6 3,295.3 10.562012 4,743.4 845.9 5,589.3 1,264.7 4,324.5 13.762013 4,900.3 539.4 5,439.7 1,255.7 4,184.0 13.262014p 4,595.8 520.9 5,116.7 1,427.7 3,689.1 11.65 -- = Not available. f = ERS forecast. 1/ Price data not available. 3/ Derived from use as reported by the National Agricultural Statistics Service, USDA. Represents marketings from 2 crop years (t-1, t) within the given calendar year. 4/ Source: Bureau of the Census, U.S. Dept. of Commerce. 5/ Converted to a fresh weight basis using a factor of 6.5 after 1978. Prior to 1978, factors were 7.1 for flakes/granules and 8.0 for other dried. Excludes starch.Source: USDA, Economic Research Service.
-------------------------------- Million pounds-------------------------------
Utilization

Vegetables and Pulses Yearbook Data /#89011/March 20, 2015Economic Research Service, USDA
Table 64--U.S. potatoes for freezing: Supply and disappearance, farm weight, 1970-2014 1/
Supply Utilization Year Per
Production Imports Beginning Total Exports Ending Domestic capita 1/ 2/ 3/ stocks 4/ 2/ 3/ stocks 5/ use
--Pounds--1970 6,185.9 0.0 880.9 7,066.8 0.0 1,217.3 5,849.5 28.51971 6,355.1 0.0 1,217.3 7,572.4 0.0 1,317.3 6,255.1 30.11972 6,402.7 0.0 1,317.3 7,720.0 0.0 1,354.5 6,365.5 30.31973 6,991.3 0.0 1,354.5 8,345.8 0.0 1,098.6 7,247.2 34.21974 7,842.4 0.0 1,098.6 8,941.0 0.0 1,386.9 7,554.1 35.31975 7,997.5 0.0 1,386.9 9,384.4 0.0 1,364.4 8,020.0 37.11976 9,252.6 0.0 1,364.4 10,617.0 0.0 1,500.8 9,116.2 41.81977 9,454.6 0.0 1,500.8 10,955.4 0.0 1,659.5 9,295.9 42.21978 9,494.5 12.6 1,659.5 11,166.6 106.2 1,554.9 9,474.4 42.61979 8,874.0 32.9 1,554.9 10,461.8 133.5 1,624.4 8,665.5 38.51980 8,088.1 21.8 1,624.4 9,734.3 168.7 1,459.8 8,062.6 35.41981 9,664.1 30.0 1,459.8 11,153.9 192.8 1,377.4 9,540.3 41.51982 9,330.3 44.3 1,377.4 10,752.0 219.4 1,534.6 8,968.8 38.61983 9,400.5 53.1 1,534.6 10,988.2 242.7 1,545.9 9,182.0 39.21984 10,767.2 99.5 1,545.9 12,412.6 280.9 1,784.6 10,325.9 43.71985 11,259.7 138.2 1,784.6 13,182.4 291.7 2,024.6 10,829.1 45.41986 11,195.2 147.1 2,024.6 13,366.9 393.1 1,788.1 11,137.2 46.31987 11,968.2 187.8 1,788.1 13,944.1 492.0 1,765.1 11,620.1 47.91988 11,302.4 203.8 1,765.1 13,271.3 618.2 1,977.4 10,611.5 43.31989 11,957.4 208.4 1,977.4 14,143.2 726.6 1,834.7 11,581.9 46.81990 12,300.7 269.8 1,834.7 14,405.2 843.2 1,951.5 11,610.5 46.41991 13,412.8 340.8 1,951.5 15,705.1 819.6 1,940.0 12,945.6 51.11992 13,335.9 391.2 1,940.0 15,667.2 927.7 1,926.3 12,813.2 49.91993 14,481.7 578.7 1,926.3 16,986.7 1,055.5 2,012.8 13,918.3 53.51994 15,510.6 618.0 2,012.8 18,141.4 1,276.1 2,193.2 14,672.2 55.71995 15,980.3 708.2 2,193.2 18,881.6 1,668.4 2,247.5 14,965.7 56.11996 16,989.0 935.2 2,247.5 20,171.8 1,715.1 2,196.8 16,259.8 60.31997 16,436.7 1,433.8 2,196.8 20,067.4 1,918.9 2,327.1 15,821.4 58.01998 16,347.1 1,819.4 2,327.1 20,493.7 2,075.6 2,302.6 16,115.5 58.41999 16,548.1 2,076.4 2,302.6 20,927.0 2,149.9 2,330.8 16,446.4 58.92000 16,276.0 2,398.4 2,330.8 21,005.2 2,294.8 2,379.3 16,331.1 57.82001 16,365.7 2,674.4 2,379.3 21,419.4 2,265.8 2,479.5 16,674.1 58.42002 14,992.2 2,886.0 2,479.5 20,357.7 2,201.8 2,262.4 15,893.5 55.22003 15,275.1 3,277.8 2,262.4 20,815.3 1,981.5 2,240.8 16,592.9 57.12004 15,279.6 3,693.8 2,240.8 21,214.3 2,237.9 2,149.6 16,826.8 57.32005 15,188.2 3,284.9 2,149.6 20,622.8 2,426.7 2,102.2 16,093.9 54.32006 15,071.5 3,433.3 2,102.2 20,606.9 2,776.4 1,909.6 15,920.9 53.22007 15,901.5 3,399.1 1,909.6 21,210.3 3,134.1 2,024.7 16,051.4 53.12008 15,940.1 3,427.6 2,024.7 21,392.4 3,512.5 2,197.2 15,682.8 51.52009 15,343.3 3,315.3 2,197.2 20,855.7 3,284.8 2,087.7 15,483.3 50.42010 15,649.8 3,065.6 2,087.7 20,803.0 3,252.8 1,999.8 15,550.4 50.22011 15,532.1 3,228.3 1,999.8 20,760.2 3,734.5 1,979.9 15,045.9 48.22012 16,056.6 3,308.0 1,979.9 21,344.4 4,127.8 1,993.9 15,222.7 48.42013 16,140.3 3,511.1 1,993.9 21,645.4 4,138.2 1,941.1 15,566.1 49.32014p 15,781.4 3,428.7 1,941.1 21,151.1 4,242.8 1,855.7 15,052.5 47.5 -- = Not available. p = preliminary. f = ERS forecast. 1/ Price data not available. 3/ Based on frozen utilization reported by the National Agricultural Statistics Service, USDA. Utilization was converted to a calendar year basis by ERS using NASS potato marketing data. 4/ Source: Bureau of the Census, U.S. Dept. of Commerce, USDC. 5/ All product-weight data was converted to a fresh weight basis using a factor of 2.0. 6/ Source: National Agricultural Statistic Service, USDA. 7/ From 1978 to 1988 shipments toU.S. territories were also subtracted from the total available for domestic use. 8/ Source is Bureau of the Census, USDC.Source: USDA, Economic Research Service.
--------------------------------------------------- Million pounds ---------------------------------------------------
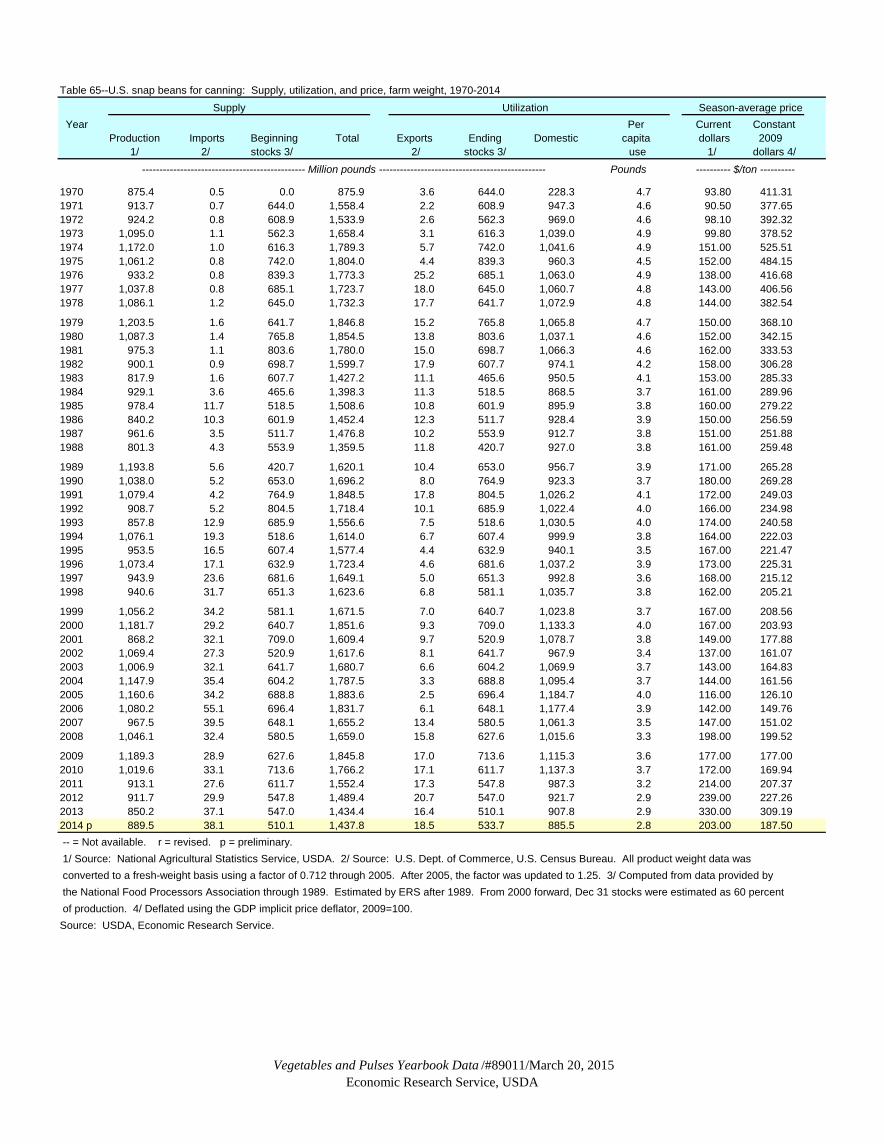
Vegetables and Pulses Yearbook Data /#89011/March 20, 2015Economic Research Service, USDA
Table 65--U.S. snap beans for canning: Supply, utilization, and price, farm weight, 1970-2014 Supply Utilization Season-average price
Year Per Current ConstantProduction Imports Beginning Total Exports Ending Domestic capita dollars 2009
1/ 2/ stocks 3/ 2/ stocks 3/ use 1/ dollars 4/ ----------------------------------------------- Million pounds ------------------------------------------------ Pounds ---------- $/ton ----------
1970 875.4 0.5 0.0 875.9 3.6 644.0 228.3 4.7 93.80 411.311971 913.7 0.7 644.0 1,558.4 2.2 608.9 947.3 4.6 90.50 377.651972 924.2 0.8 608.9 1,533.9 2.6 562.3 969.0 4.6 98.10 392.321973 1,095.0 1.1 562.3 1,658.4 3.1 616.3 1,039.0 4.9 99.80 378.521974 1,172.0 1.0 616.3 1,789.3 5.7 742.0 1,041.6 4.9 151.00 525.511975 1,061.2 0.8 742.0 1,804.0 4.4 839.3 960.3 4.5 152.00 484.151976 933.2 0.8 839.3 1,773.3 25.2 685.1 1,063.0 4.9 138.00 416.681977 1,037.8 0.8 685.1 1,723.7 18.0 645.0 1,060.7 4.8 143.00 406.561978 1,086.1 1.2 645.0 1,732.3 17.7 641.7 1,072.9 4.8 144.00 382.54
1979 1,203.5 1.6 641.7 1,846.8 15.2 765.8 1,065.8 4.7 150.00 368.101980 1,087.3 1.4 765.8 1,854.5 13.8 803.6 1,037.1 4.6 152.00 342.151981 975.3 1.1 803.6 1,780.0 15.0 698.7 1,066.3 4.6 162.00 333.531982 900.1 0.9 698.7 1,599.7 17.9 607.7 974.1 4.2 158.00 306.281983 817.9 1.6 607.7 1,427.2 11.1 465.6 950.5 4.1 153.00 285.331984 929.1 3.6 465.6 1,398.3 11.3 518.5 868.5 3.7 161.00 289.961985 978.4 11.7 518.5 1,508.6 10.8 601.9 895.9 3.8 160.00 279.221986 840.2 10.3 601.9 1,452.4 12.3 511.7 928.4 3.9 150.00 256.591987 961.6 3.5 511.7 1,476.8 10.2 553.9 912.7 3.8 151.00 251.881988 801.3 4.3 553.9 1,359.5 11.8 420.7 927.0 3.8 161.00 259.48
1989 1,193.8 5.6 420.7 1,620.1 10.4 653.0 956.7 3.9 171.00 265.281990 1,038.0 5.2 653.0 1,696.2 8.0 764.9 923.3 3.7 180.00 269.281991 1,079.4 4.2 764.9 1,848.5 17.8 804.5 1,026.2 4.1 172.00 249.031992 908.7 5.2 804.5 1,718.4 10.1 685.9 1,022.4 4.0 166.00 234.981993 857.8 12.9 685.9 1,556.6 7.5 518.6 1,030.5 4.0 174.00 240.581994 1,076.1 19.3 518.6 1,614.0 6.7 607.4 999.9 3.8 164.00 222.031995 953.5 16.5 607.4 1,577.4 4.4 632.9 940.1 3.5 167.00 221.471996 1,073.4 17.1 632.9 1,723.4 4.6 681.6 1,037.2 3.9 173.00 225.311997 943.9 23.6 681.6 1,649.1 5.0 651.3 992.8 3.6 168.00 215.121998 940.6 31.7 651.3 1,623.6 6.8 581.1 1,035.7 3.8 162.00 205.21
1999 1,056.2 34.2 581.1 1,671.5 7.0 640.7 1,023.8 3.7 167.00 208.562000 1,181.7 29.2 640.7 1,851.6 9.3 709.0 1,133.3 4.0 167.00 203.932001 868.2 32.1 709.0 1,609.4 9.7 520.9 1,078.7 3.8 149.00 177.882002 1,069.4 27.3 520.9 1,617.6 8.1 641.7 967.9 3.4 137.00 161.072003 1,006.9 32.1 641.7 1,680.7 6.6 604.2 1,069.9 3.7 143.00 164.832004 1,147.9 35.4 604.2 1,787.5 3.3 688.8 1,095.4 3.7 144.00 161.562005 1,160.6 34.2 688.8 1,883.6 2.5 696.4 1,184.7 4.0 116.00 126.102006 1,080.2 55.1 696.4 1,831.7 6.1 648.1 1,177.4 3.9 142.00 149.762007 967.5 39.5 648.1 1,655.2 13.4 580.5 1,061.3 3.5 147.00 151.022008 1,046.1 32.4 580.5 1,659.0 15.8 627.6 1,015.6 3.3 198.00 199.52
2009 1,189.3 28.9 627.6 1,845.8 17.0 713.6 1,115.3 3.6 177.00 177.002010 1,019.6 33.1 713.6 1,766.2 17.1 611.7 1,137.3 3.7 172.00 169.942011 913.1 27.6 611.7 1,552.4 17.3 547.8 987.3 3.2 214.00 207.372012 911.7 29.9 547.8 1,489.4 20.7 547.0 921.7 2.9 239.00 227.262013 850.2 37.1 547.0 1,434.4 16.4 510.1 907.8 2.9 330.00 309.192014 p 889.5 38.1 510.1 1,437.8 18.5 533.7 885.5 2.8 203.00 187.50 -- = Not available. r = revised. p = preliminary. 1/ Source: National Agricultural Statistics Service, USDA. 2/ Source: U.S. Dept. of Commerce, U.S. Census Bureau. All product weight data was converted to a fresh-weight basis using a factor of 0.712 through 2005. After 2005, the factor was updated to 1.25. 3/ Computed from data provided by the National Food Processors Association through 1989. Estimated by ERS after 1989. From 2000 forward, Dec 31 stocks were estimated as 60 percent of production. 4/ Deflated using the GDP implicit price deflator, 2009=100.Source: USDA, Economic Research Service.

Vegetables and Pulses Yearbook Data /#89011/March 20, 2015Economic Research Service, USDA
Table 66--U.S. snap beans for freezing: Supply, utilization, and price, farm weight, 1970-2014 Supply Utilization Season-average price
Year Ending Per Current Constant Production Imports Beginning Total Exports stocks Domestic capita dollars 2009
1/ 2/ stocks 2/ 1/ 3/ use 1/ dollars 4/
---------------------------------------------- Million pounds -------------------------------------------- Pounds ---------- $/ton ----------
1970 264.9 -- 190.6 455.5 1.7 168.2 285.6 1.4 101.00 442.891971 279.6 -- 168.2 447.8 1.0 158.3 288.5 1.4 99.60 415.621972 302.6 -- 158.3 460.9 1.5 175.8 283.6 1.4 107.00 427.911973 388.3 -- 175.8 564.1 2.9 204.8 356.4 1.7 111.00 421.001974 324.7 -- 204.8 529.5 3.4 211.4 314.7 1.5 180.00 626.441975 269.2 -- 211.4 480.6 3.3 230.9 246.4 1.1 161.00 512.821976 248.2 -- 230.9 479.1 5.6 145.7 327.8 1.5 141.00 425.741977 313.1 -- 145.7 458.8 5.8 153.1 299.9 1.4 154.00 437.841978 347.1 -- 153.1 500.2 0.0 195.0 305.2 1.4 152.00 403.79
1979 334.8 -- 195.0 529.8 0.0 213.9 315.9 1.4 163.00 400.001980 321.2 -- 213.9 535.1 -- 224.6 310.5 1.4 169.00 380.421981 369.0 -- 224.6 593.6 -- 209.8 383.9 1.7 176.00 362.351982 387.6 -- 209.8 597.4 -- 241.0 356.4 1.5 184.00 356.691983 356.9 -- 241.0 597.9 -- 250.2 347.7 1.5 178.00 331.951984 403.2 -- 250.2 653.3 -- 223.9 429.4 1.8 194.00 349.391985 425.6 -- 223.9 649.5 -- 202.8 446.7 1.9 190.00 331.581986 378.6 -- 202.8 581.4 -- 215.5 365.9 1.5 182.00 311.331987 410.1 -- 215.5 625.6 -- 218.8 406.8 1.7 181.00 301.921988 375.3 -- 218.8 594.1 -- 172.8 421.3 1.7 183.00 294.93
1989 545.6 30.3 172.8 748.7 5.8 245.1 497.8 2.0 182.00 282.351990 537.0 15.0 245.1 797.1 12.8 298.8 485.5 1.9 189.00 282.741991 456.2 10.4 298.8 765.4 11.1 293.5 460.8 1.8 186.00 269.301992 383.1 6.0 293.5 682.7 11.8 224.7 446.1 1.7 191.00 270.371993 445.6 12.3 224.7 682.6 12.1 218.4 452.1 1.7 184.00 254.411994 557.6 10.9 218.4 786.9 12.0 265.1 509.8 1.9 169.00 228.801995 457.5 6.7 265.1 729.3 20.6 264.7 444.0 1.7 187.00 247.991996 496.4 10.4 264.7 771.5 18.1 239.1 514.3 1.9 189.00 246.151997 514.6 14.2 239.1 767.9 17.7 272.2 478.0 1.8 190.00 243.291998 521.4 18.4 272.2 812.0 22.2 251.8 538.0 2.0 189.00 239.41
1999 500.6 35.7 251.8 788.1 19.1 219.9 549.1 2.0 185.00 231.042000 485.2 42.6 219.9 747.7 22.4 207.6 517.7 1.8 181.00 221.032001 508.0 39.9 207.6 755.6 28.1 189.8 537.7 1.9 182.00 217.272002 518.0 56.8 189.8 764.6 36.7 221.1 506.8 1.8 181.00 212.812003 448.3 73.0 221.1 742.5 25.2 176.2 541.0 1.9 190.00 219.012004 523.8 103.6 176.2 803.7 27.7 205.5 570.4 1.9 189.00 212.052005 477.9 92.7 205.5 776.1 15.2 228.5 532.4 1.8 198.00 215.242006 491.7 100.4 228.5 820.6 16.8 234.3 569.6 1.9 189.00 199.332007 539.9 116.6 234.3 890.8 17.3 239.7 633.8 2.1 206.00 211.642008 558.0 117.3 239.7 915.1 16.9 267.8 630.4 2.1 258.00 259.99
2009 443.6 106.2 267.8 817.6 18.1 223.9 575.6 1.9 229.00 229.002010 504.6 109.2 223.9 837.7 19.7 205.4 612.6 2.0 232.00 229.222011 418.7 118.7 205.4 742.7 22.9 238.4 481.4 1.5 282.00 273.262012 549.7 125.3 238.4 913.4 19.5 297.6 596.3 1.9 323.00 307.142013 483.3 119.1 297.6 900.0 20.1 216.8 663.1 2.1 301.00 282.022014 p 473.0 117.6 216.8 807.4 27.0 218.2 562.2 1.8 337.00 311.27 -- = Not available. r = revised. p = preliminary. 1/ Source: USDA, National Agricultural Statistics Service. 2/ Source: U.S. Department of Commerce, U.S. Census Bureau. All product weight data were converted to a fresh-weight basis using a factor of 1.18 through 2005. Beginning with 2006, the factor was updated to 1.11. 3/ Dec. 31 stocks. 4/ Deflated using the GDP implicit price deflator, 2009=100. Source: USDA, Economic Research Service.
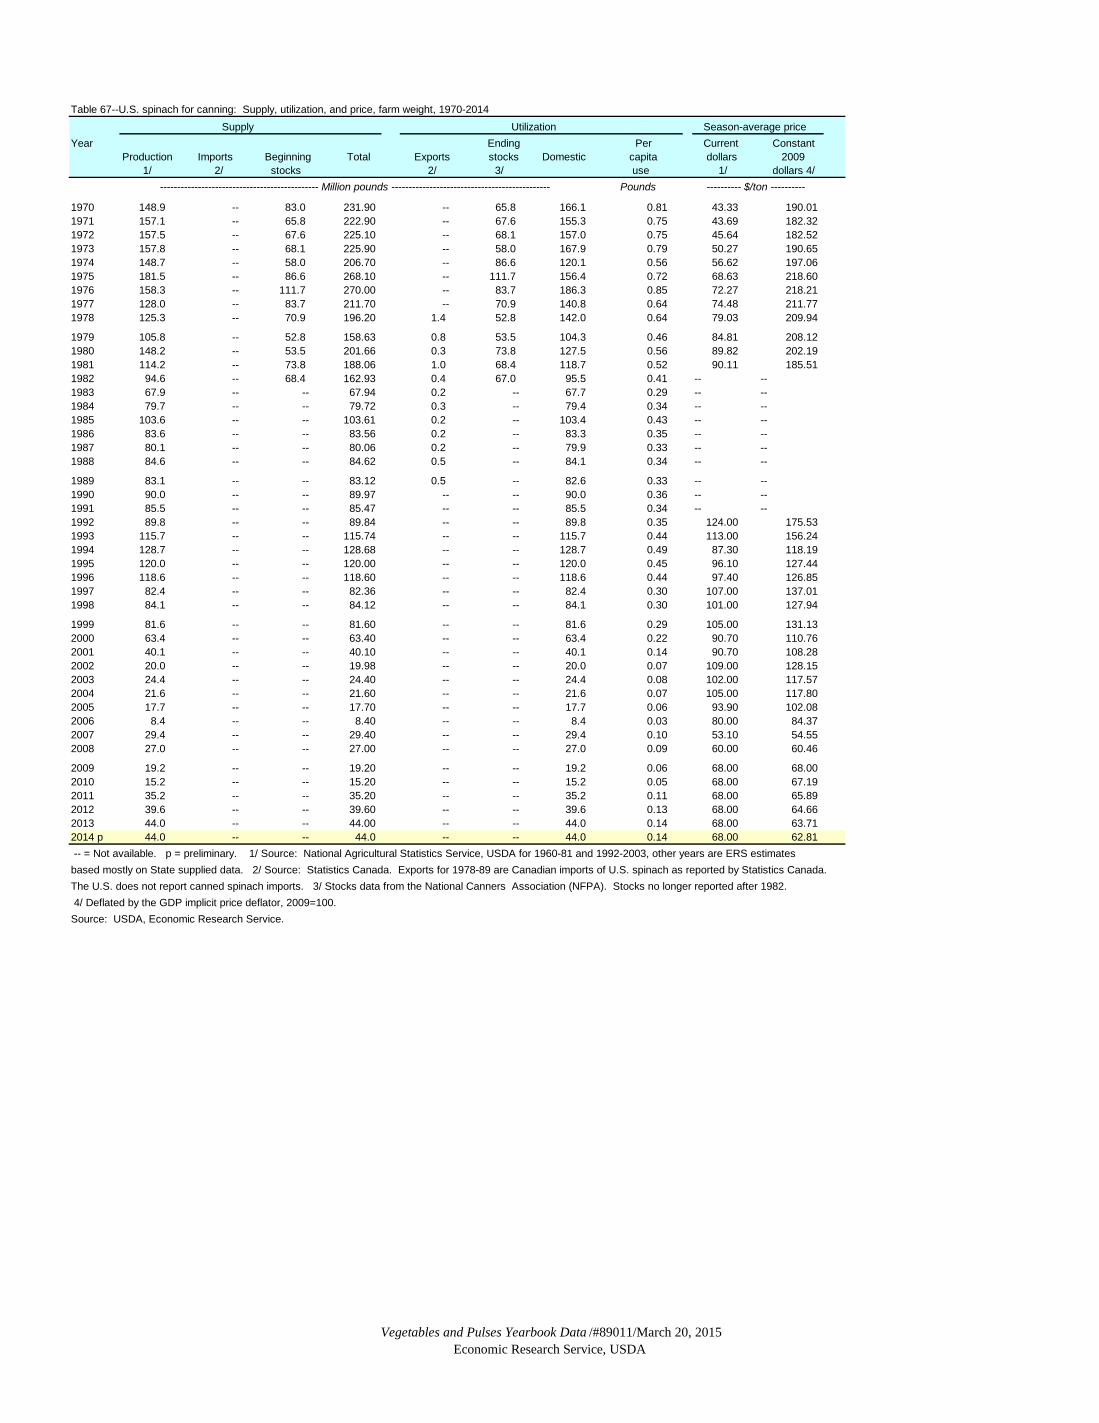
Vegetables and Pulses Yearbook Data /#89011/March 20, 2015Economic Research Service, USDA
Table 67--U.S. spinach for canning: Supply, utilization, and price, farm weight, 1970-2014 Supply Utilization Season-average price
Year Ending Per Current Constant Production Imports Beginning Total Exports stocks Domestic capita dollars 2009
1/ 2/ stocks 2/ 3/ use 1/ dollars 4/ ---------------------------------------------- Million pounds ---------------------------------------------- Pounds ---------- $/ton ----------
1970 148.9 -- 83.0 231.90 -- 65.8 166.1 0.81 43.33 190.011971 157.1 -- 65.8 222.90 -- 67.6 155.3 0.75 43.69 182.321972 157.5 -- 67.6 225.10 -- 68.1 157.0 0.75 45.64 182.521973 157.8 -- 68.1 225.90 -- 58.0 167.9 0.79 50.27 190.651974 148.7 -- 58.0 206.70 -- 86.6 120.1 0.56 56.62 197.061975 181.5 -- 86.6 268.10 -- 111.7 156.4 0.72 68.63 218.601976 158.3 -- 111.7 270.00 -- 83.7 186.3 0.85 72.27 218.211977 128.0 -- 83.7 211.70 -- 70.9 140.8 0.64 74.48 211.771978 125.3 -- 70.9 196.20 1.4 52.8 142.0 0.64 79.03 209.94
1979 105.8 -- 52.8 158.63 0.8 53.5 104.3 0.46 84.81 208.121980 148.2 -- 53.5 201.66 0.3 73.8 127.5 0.56 89.82 202.191981 114.2 -- 73.8 188.06 1.0 68.4 118.7 0.52 90.11 185.511982 94.6 -- 68.4 162.93 0.4 67.0 95.5 0.41 -- --1983 67.9 -- -- 67.94 0.2 -- 67.7 0.29 -- --1984 79.7 -- -- 79.72 0.3 -- 79.4 0.34 -- --1985 103.6 -- -- 103.61 0.2 -- 103.4 0.43 -- --1986 83.6 -- -- 83.56 0.2 -- 83.3 0.35 -- --1987 80.1 -- -- 80.06 0.2 -- 79.9 0.33 -- --1988 84.6 -- -- 84.62 0.5 -- 84.1 0.34 -- --
1989 83.1 -- -- 83.12 0.5 -- 82.6 0.33 -- --1990 90.0 -- -- 89.97 -- -- 90.0 0.36 -- --1991 85.5 -- -- 85.47 -- -- 85.5 0.34 -- --1992 89.8 -- -- 89.84 -- -- 89.8 0.35 124.00 175.531993 115.7 -- -- 115.74 -- -- 115.7 0.44 113.00 156.241994 128.7 -- -- 128.68 -- -- 128.7 0.49 87.30 118.191995 120.0 -- -- 120.00 -- -- 120.0 0.45 96.10 127.441996 118.6 -- -- 118.60 -- -- 118.6 0.44 97.40 126.851997 82.4 -- -- 82.36 -- -- 82.4 0.30 107.00 137.011998 84.1 -- -- 84.12 -- -- 84.1 0.30 101.00 127.94
1999 81.6 -- -- 81.60 -- -- 81.6 0.29 105.00 131.132000 63.4 -- -- 63.40 -- -- 63.4 0.22 90.70 110.762001 40.1 -- -- 40.10 -- -- 40.1 0.14 90.70 108.282002 20.0 -- -- 19.98 -- -- 20.0 0.07 109.00 128.152003 24.4 -- -- 24.40 -- -- 24.4 0.08 102.00 117.572004 21.6 -- -- 21.60 -- -- 21.6 0.07 105.00 117.802005 17.7 -- -- 17.70 -- -- 17.7 0.06 93.90 102.082006 8.4 -- -- 8.40 -- -- 8.4 0.03 80.00 84.372007 29.4 -- -- 29.40 -- -- 29.4 0.10 53.10 54.552008 27.0 -- -- 27.00 -- -- 27.0 0.09 60.00 60.46
2009 19.2 -- -- 19.20 -- -- 19.2 0.06 68.00 68.002010 15.2 -- -- 15.20 -- -- 15.2 0.05 68.00 67.192011 35.2 -- -- 35.20 -- -- 35.2 0.11 68.00 65.892012 39.6 -- -- 39.60 -- -- 39.6 0.13 68.00 64.662013 44.0 -- -- 44.00 -- -- 44.0 0.14 68.00 63.712014 p 44.0 -- -- 44.0 -- -- 44.0 0.14 68.00 62.81 -- = Not available. p = preliminary. 1/ Source: National Agricultural Statistics Service, USDA for 1960-81 and 1992-2003, other years are ERS estimates based mostly on State supplied data. 2/ Source: Statistics Canada. Exports for 1978-89 are Canadian imports of U.S. spinach as reported by Statistics Canada. The U.S. does not report canned spinach imports. 3/ Stocks data from the National Canners Association (NFPA). Stocks no longer reported after 1982. 4/ Deflated by the GDP implicit price deflator, 2009=100. Source: USDA, Economic Research Service.

Vegetables and Pulses Yearbook Data /#89011/March 20, 2015Economic Research Service, USDA
Table 68--U.S. spinach for freezing: Supply, utilization, and price, farm weight, 1970-2014 Supply Utilization Season-average price
Year Ending Per Current Constant Production Imports Beginning Total Exports stocks Domestic capita dollars 2009
1/ 2/ stocks 2/ 3/ use 1/ dollars 4/ ---------------------------------------------- Million pounds ---------------------------------------------- Pounds ---------- $/ton ----------
1970 153.2 -- 52.7 205.9 1.2 57.5 147.3 0.72 41.95 183.931971 163.0 -- 57.5 220.5 1.0 62.4 157.1 0.76 42.92 179.101972 170.8 -- 62.4 233.2 1.2 70.6 161.4 0.77 44.13 176.501973 157.8 -- 70.6 228.4 2.0 90.3 136.1 0.64 49.60 188.131974 199.9 -- 90.3 290.2 3.1 99.0 188.0 0.88 56.90 198.021975 137.0 -- 99.0 236.0 2.4 78.8 154.8 0.72 59.23 188.651976 163.9 -- 78.8 242.7 6.0 79.6 157.1 0.72 59.18 178.701977 179.4 -- 79.6 259.0 5.0 83.7 170.3 0.77 65.03 184.881978 146.5 -- 83.7 230.2 5.4 56.6 168.2 0.76 78.78 209.30
1979 203.0 -- 56.6 259.6 6.4 84.1 169.1 0.75 86.71 212.781980 181.3 -- 84.1 265.4 5.5 77.1 182.8 0.80 93.61 210.721981 191.4 -- 77.1 268.5 5.9 90.2 172.3 0.75 83.56 172.031982 156.0 -- 90.2 246.2 5.2 75.1 165.9 0.71 -- --1983 110.4 -- 75.1 185.5 5.3 60.5 119.8 0.51 -- --1984 127.6 -- 60.5 188.1 5.8 64.8 117.5 0.50 -- --1985 163.3 -- 64.8 228.1 5.9 75.3 146.9 0.62 -- --1986 129.7 -- 75.3 205.0 6.3 65.7 133.0 0.55 -- --1987 122.4 -- 65.7 188.1 7.2 72.7 108.2 0.45 -- --1988 127.4 -- 72.7 200.1 6.8 50.1 143.2 0.58 -- --
1989 123.2 -- 50.1 173.3 5.4 59.8 108.1 0.44 -- --1990 131.4 -- 59.8 191.2 9.8 130.0 51.4 0.21 -- --1991 123.0 -- 130.0 253.0 10.2 76.2 166.7 0.66 -- --1992 131.6 -- 76.2 207.8 9.2 80.3 118.2 0.46 113.00 159.961993 142.8 -- 80.3 223.1 10.2 67.4 145.6 0.56 108.00 149.331994 167.1 -- 67.4 234.5 10.4 100.1 124.1 0.47 105.00 142.151995 150.0 -- 100.1 250.1 8.4 98.6 143.1 0.54 103.00 136.591996 169.1 -- 98.6 267.7 10.3 68.5 188.9 0.70 103.00 134.141997 173.0 8.7 68.5 250.2 13.4 95.9 140.8 0.52 103.00 131.891998 136.3 8.6 95.9 240.8 11.3 99.0 130.5 0.47 145.00 183.67
1999 164.3 9.9 99.0 273.2 12.0 104.9 156.3 0.56 146.00 182.342000 209.9 10.4 104.9 325.1 12.9 72.6 239.6 0.85 131.00 159.972001 214.1 17.4 72.6 304.1 11.9 91.0 201.2 0.71 120.00 143.262002 192.4 13.5 91.0 296.8 13.5 80.4 202.9 0.70 115.00 135.212003 215.9 17.9 80.4 314.1 12.5 66.5 235.1 0.81 107.00 123.342004 238.8 31.3 66.5 336.7 12.3 49.7 274.7 0.94 117.00 131.272005 178.8 41.8 49.7 270.3 13.7 60.7 195.8 0.66 110.00 119.582006 130.7 46.4 60.7 237.8 14.6 75.3 147.9 0.49 130.00 137.102007 166.2 54.8 75.3 296.4 13.5 67.9 215.0 0.71 112.00 115.072008 180.1 59.7 67.9 307.6 14.6 60.8 232.3 0.76 134.00 135.03
2009 172.1 69.3 60.8 302.2 13.5 68.6 220.1 0.72 134.00 134.002010 154.9 78.3 68.6 301.8 15.0 74.5 212.3 0.69 150.00 148.212011 125.2 86.6 74.5 286.3 17.5 70.2 198.6 0.64 148.00 143.412012 111.0 97.8 70.2 279.0 19.2 69.8 190.1 0.60 162.00 154.052013 133.4 97.5 69.8 300.7 15.5 55.8 229.3 0.72 149.00 139.612014 p 136.6 122.0 55.8 314.5 8.2 54.4 251.9 0.79 144.00 133.00 -- = Not available. p = preliminary. 1/ Source: National Agricultural Statistics Service, USDA for 1977-81 and 1992 to the present; other years are ERS estimates. 2/ Source: U.S. Dept. of Commerce, U.S. Census Bureau. All product weight data were converted to a fresh-weight basis using a factor of 1.43. 3/ Source: NASS. Dec. 31 stocks on a fresh-weight basis. 4/ Deflated using the GDP implicit price deflator, 2009=100. Source: USDA, Economic Research Service.

Vegetables and Pulses Yearbook Data /#89011/March 20, 2015Economic Research Service, USDA
Table 69--U.S. sweet corn for canning: Supply, utilization, and price, farm weight, 1970-2014 Supply Utilization Season-average price
Year Per Current ConstantProduction Imports Beginning Total Exports Ending Domestic capita dollars 2009
1/ 2/ 3/ stocks 4/ 2/ 3/ stocks 4/ use 1/ dollars 5/ ----------------------------------------------- Million pounds ------------------------------------------------ Pounds ---------- $/ton ----------
1970 2,813.4 -- 2,532.8 5,346.2 38.4 2,382.8 2,925.0 14.3 23.30 102.171971 3,082.2 -- 2,382.8 5,465.0 36.3 2,357.4 3,071.3 14.8 23.70 98.901972 3,023.5 -- 2,357.4 5,380.9 50.2 2,187.3 3,143.4 15.0 25.00 99.981973 2,996.6 -- 2,187.3 5,183.9 114.9 2,001.2 3,067.8 14.5 27.40 103.921974 2,772.7 -- 2,001.2 4,773.9 126.7 1,755.4 2,891.8 13.5 48.20 167.751975 3,288.6 -- 1,755.4 5,044.0 123.0 2,320.4 2,600.6 12.0 49.40 157.351976 3,110.8 -- 2,320.4 5,431.2 130.7 2,446.4 2,854.1 13.1 45.40 137.081977 3,160.5 -- 2,446.4 5,606.9 169.7 2,326.9 3,110.3 14.1 46.00 130.781978 3,149.0 -- 2,326.9 5,475.9 209.1 2,292.0 2,974.8 13.4 46.80 124.33
1979 3,263.0 -- 2,292.0 5,555.0 259.7 2,447.0 2,848.3 12.7 47.10 115.581980 2,777.3 14.4 2,447.0 5,238.7 301.8 1,967.1 2,969.8 13.0 51.80 116.601981 3,092.4 11.0 1,967.1 5,070.5 386.8 1,891.9 2,791.8 12.1 63.20 130.121982 3,227.1 12.8 1,891.9 5,131.8 337.9 2,102.8 2,691.1 11.6 57.10 110.691983 2,652.6 21.2 2,102.8 4,776.6 358.5 1,694.6 2,723.5 11.6 58.30 108.721984 3,164.9 24.5 1,694.6 4,884.0 310.7 2,158.7 2,414.6 10.2 61.90 111.481985 3,058.7 30.2 2,158.7 5,247.6 331.5 2,080.4 2,835.7 11.9 61.00 106.451986 2,951.9 36.7 2,080.4 5,069.0 416.0 1,744.6 2,908.4 12.1 56.20 96.141987 3,276.7 38.3 1,744.6 5,059.6 493.7 1,985.7 2,580.2 10.6 56.70 94.581988 2,656.8 49.4 1,985.7 4,691.9 626.6 1,519.7 2,545.6 10.4 58.90 94.93
1989 3,376.1 70.8 1,519.7 4,966.6 537.0 2,069.6 2,360.0 9.5 65.20 101.151990 3,353.6 48.3 2,069.6 5,471.5 704.2 2,028.7 2,738.6 11.0 68.00 101.731991 3,871.2 43.9 2,028.7 5,943.8 713.1 2,424.1 2,806.6 11.1 68.00 98.451992 3,684.4 39.8 2,424.1 6,148.3 811.5 2,291.4 3,045.4 11.9 61.60 87.201993 2,921.6 39.1 2,291.4 5,252.1 941.4 1,427.1 2,883.6 11.1 71.90 99.411994 4,239.7 52.7 1,427.1 5,719.5 808.8 2,257.1 2,653.6 10.1 67.50 91.381995 3,414.1 49.4 2,257.1 5,720.6 883.5 2,065.5 2,771.6 10.4 77.50 102.781996 3,447.2 21.1 2,065.5 5,533.8 964.3 1,775.5 2,794.0 10.4 81.10 105.621997 3,294.5 28.7 1,775.5 5,098.7 1,052.0 1,550.1 2,496.6 9.2 74.80 95.781998 3,321.6 46.3 1,550.1 4,918.0 1,019.4 1,361.4 2,537.2 9.2 70.80 89.68
1999 3,493.6 61.7 1,361.4 4,916.7 1,002.8 1,381.5 2,532.4 9.1 69.50 86.802000 3,403.9 65.6 1,381.5 4,851.0 952.7 1,361.6 2,536.7 9.0 74.10 90.492001 3,035.1 95.7 1,361.6 4,492.4 796.3 1,214.1 2,482.0 8.7 73.90 88.222002 2,856.0 103.5 1,214.1 4,173.5 771.9 1,142.4 2,259.3 7.8 65.60 77.132003 3,112.6 132.6 1,142.4 4,387.7 720.8 1,245.0 2,421.8 8.3 68.60 79.072004 2,916.5 182.2 1,245.0 4,343.8 766.8 1,166.6 2,410.3 8.2 71.20 79.882005 3,199.4 120.7 1,166.6 4,486.7 665.0 1,279.8 2,541.9 8.6 64.50 70.122006 2,878.1 105.0 1,279.8 4,262.9 614.3 1,151.2 2,497.3 8.4 62.40 65.812007 2,550.9 93.7 1,151.2 3,795.8 707.7 1,020.4 2,067.8 6.8 82.80 85.072008 2,711.5 94.1 1,020.4 3,826.0 686.7 1,084.6 2,054.6 6.7 116.00 116.89
2009 3,020.8 63.8 1,084.6 4,169.1 625.0 1,208.3 2,335.9 7.6 95.20 95.202010 2,488.6 60.3 1,208.3 3,757.2 638.8 995.4 2,122.9 6.9 81.50 80.522011 2,252.0 44.4 995.4 3,291.8 576.0 900.8 1,815.0 5.8 118.00 114.342012 2,471.8 59.9 900.8 3,432.5 604.3 988.7 1,839.5 5.8 131.00 124.572013 2,245.3 45.3 988.7 3,279.3 557.0 898.1 1,824.2 5.8 150.00 140.542014 p 2,343.2 45.6 898.1 3,287.0 511.9 937.3 1,837.8 5.8 108.00 99.75-- = Not available. f = ERS forecast.1/ Source: USDA, National Agricultural Statistics Service. 2/ Source: U.S. Dept. of Commerce, U.S. Census Bureau. 3/ All product-weight data was converted to a fresh-weight basis using a factor of 2.463. 4/ Computed from data provided by the National Food Processors Association through 1989. Estimated by ERS after 1989. From 2000 forward, Dec 31 stocks were estimated by ERS as 40 percent of production. 5/ Constant dollar prices were calculated using the GDP implicit price deflator, 2009=100. Source: USDA, Economic Research Service.

Vegetables and Pulses Yearbook Data /#89011/March 20, 2015Economic Research Service, USDA
Table 70--U.S. sweet corn for freezing: Supply, utilization, and price, farm weight, 1970-2014 Supply Utilization Season-average price
Year Ending Per Current Constant Production Imports Beginning Total Exports stocks Domestic capita dollars 2009
1/ 2/ stocks 2/ 1/ 3/ use 1/ dollars 4/
---------------------------------------------- Million pounds -------------------------------------------- Pounds ---------- $/ton ----------
1970 963.0 -- 1,006.9 1,969.9 5.5 785.4 1,179.0 5.8 25.80 113.131971 1,026.2 -- 785.4 1,811.6 4.0 672.5 1,135.1 5.5 25.90 108.081972 1,215.5 -- 672.5 1,888.0 6.5 763.2 1,118.3 5.3 27.90 111.581973 1,384.3 -- 763.2 2,147.5 11.0 881.3 1,255.2 5.9 34.90 132.371974 1,366.2 -- 881.3 2,247.5 16.7 992.4 1,238.4 5.8 66.70 232.131975 1,497.6 -- 992.4 2,490.0 18.4 1,126.8 1,344.8 6.2 62.70 199.711976 1,355.4 -- 1,126.8 2,482.2 35.3 1,204.2 1,242.7 5.7 54.70 165.161977 1,591.9 -- 1,204.2 2,796.1 30.0 1,171.1 1,595.0 7.2 56.80 161.491978 1,720.3 -- 1,171.1 2,891.4 171.3 1,312.2 1,407.9 6.3 55.40 147.17
1979 1,664.8 -- 1,312.2 2,977.0 235.0 1,200.8 1,541.2 6.9 59.50 146.011980 1,538.8 -- 1,200.8 2,739.6 283.5 1,000.5 1,455.6 6.4 57.10 128.531981 1,663.9 -- 1,000.5 2,664.4 289.9 931.4 1,443.2 6.3 62.90 129.501982 2,253.8 -- 931.4 3,185.2 271.9 1,576.3 1,337.0 5.8 67.40 130.661983 1,801.5 -- 1,576.3 3,377.8 304.7 1,515.2 1,557.9 6.7 62.10 115.811984 1,939.4 -- 1,515.2 3,454.6 286.3 1,280.8 1,887.5 8.0 66.60 119.951985 2,221.3 -- 1,280.8 3,502.1 281.1 1,336.3 1,884.6 7.9 66.70 116.401986 2,167.0 -- 1,336.3 3,503.3 366.0 1,318.0 1,819.3 7.6 62.60 107.091987 2,456.6 -- 1,318.0 3,774.6 328.3 1,542.0 1,904.3 7.8 62.80 104.761988 2,184.0 -- 1,542.0 3,726.0 420.7 1,171.0 2,134.3 8.7 63.00 101.53
1989 2,522.6 109.9 1,171.0 3,803.5 448.5 1,286.0 2,069.0 8.4 69.10 107.201990 2,887.6 74.0 1,286.0 4,247.6 480.6 1,616.1 2,150.9 8.6 71.40 106.811991 2,921.0 47.4 1,616.1 4,584.5 471.5 1,742.0 2,371.0 9.4 74.90 108.441992 2,818.8 58.0 1,742.0 4,618.7 507.1 1,814.6 2,297.0 8.9 68.20 96.541993 2,520.8 74.8 1,814.6 4,410.2 508.2 1,373.3 2,528.7 9.7 73.10 101.071994 3,222.4 123.4 1,373.3 4,719.1 525.3 1,795.8 2,398.0 9.1 70.10 94.901995 3,234.2 71.5 1,795.8 5,101.5 500.4 1,844.9 2,756.2 10.3 73.40 97.341996 3,145.4 82.5 1,844.9 5,072.8 467.6 1,814.1 2,791.1 10.4 75.70 98.591997 3,390.2 100.9 1,814.1 5,305.2 589.2 1,970.8 2,745.2 10.1 74.80 95.781998 3,189.5 114.1 1,970.8 5,274.4 600.4 1,963.2 2,710.8 9.8 76.00 96.27
1999 3,101.2 90.1 1,963.2 5,154.5 599.5 1,740.9 2,814.1 10.1 72.80 90.922000 2,916.1 76.9 1,740.9 4,733.9 561.8 1,611.7 2,560.5 9.1 72.60 88.652001 3,259.9 80.2 1,611.7 4,951.8 542.6 1,760.5 2,648.8 9.3 72.10 86.072002 3,279.4 109.6 1,760.5 5,149.5 517.4 1,944.8 2,687.3 9.3 70.20 82.542003 3,419.5 152.0 1,944.8 5,516.3 564.9 2,332.8 2,618.6 9.0 72.00 82.992004 3,019.8 128.3 2,332.8 5,480.8 540.7 2,279.3 2,660.8 9.1 73.00 81.902005 3,150.2 130.7 2,279.3 5,560.2 585.3 2,176.8 2,798.1 9.4 72.30 78.592006 3,293.0 141.4 2,176.8 5,611.2 539.4 2,250.5 2,821.4 9.4 70.60 74.462007 3,243.9 185.7 2,250.5 5,680.1 511.3 2,154.1 3,014.6 10.0 80.90 83.122008 2,953.4 146.4 2,154.1 5,254.0 477.2 1,958.8 2,818.0 9.2 124.00 124.95
2009 3,447.4 163.6 1,958.8 5,569.8 443.0 2,340.0 2,786.8 9.1 111.00 111.002010 2,899.8 167.5 2,340.0 5,407.3 467.1 2,292.3 2,647.9 8.5 88.60 87.542011 3,077.7 161.9 2,292.3 5,531.9 569.3 1,918.7 3,043.9 9.8 115.00 111.442012 3,446.9 162.7 1,918.7 5,528.3 532.8 1,920.7 3,074.8 9.8 125.00 118.862013 2,858.4 163.2 1,920.7 4,942.3 514.1 2,207.7 2,220.4 7.0 133.00 124.612014 p 2,792.4 171.5 2,207.7 5,171.7 613.2 2,107.3 2,451.2 7.7 116.00 107.14 -- = Not available. r = revised. p = preliminary. 1/ Source: USDA, National Agricultural Statistics Service. 2/ Source: U.S. Dept. of Commerce, U.S. Census Bureau. All product weight data were converted to a fresh weight basis using a factor of 3.7 through 2007. In 2008, the factor was updated to 3.33. 3/ Dec. 31 stocks. 4/ Constant-dollar prices were calculated using the GDP implicit price deflator, 2009=100. Source: USDA, Economic Research Service.
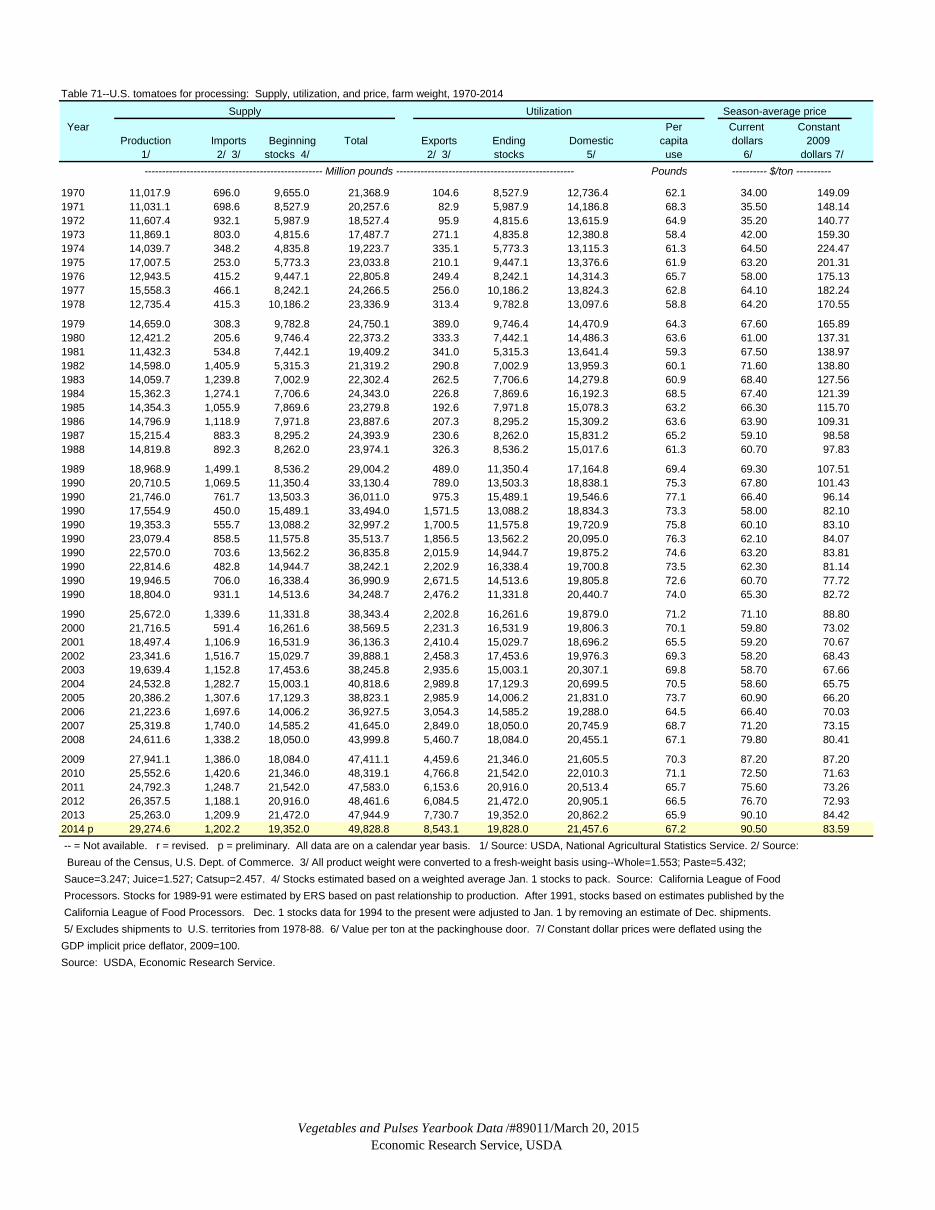
Vegetables and Pulses Yearbook Data /#89011/March 20, 2015Economic Research Service, USDA
Table 71--U.S. tomatoes for processing: Supply, utilization, and price, farm weight, 1970-2014 Supply Utilization Season-average price
Year Per Current ConstantProduction Imports Beginning Total Exports Ending Domestic capita dollars 2009
1/ 2/ 3/ stocks 4/ 2/ 3/ stocks 5/ use 6/ dollars 7/ --------------------------------------------------- Million pounds --------------------------------------------------- Pounds ---------- $/ton ----------
1970 11,017.9 696.0 9,655.0 21,368.9 104.6 8,527.9 12,736.4 62.1 34.00 149.091971 11,031.1 698.6 8,527.9 20,257.6 82.9 5,987.9 14,186.8 68.3 35.50 148.141972 11,607.4 932.1 5,987.9 18,527.4 95.9 4,815.6 13,615.9 64.9 35.20 140.771973 11,869.1 803.0 4,815.6 17,487.7 271.1 4,835.8 12,380.8 58.4 42.00 159.301974 14,039.7 348.2 4,835.8 19,223.7 335.1 5,773.3 13,115.3 61.3 64.50 224.471975 17,007.5 253.0 5,773.3 23,033.8 210.1 9,447.1 13,376.6 61.9 63.20 201.311976 12,943.5 415.2 9,447.1 22,805.8 249.4 8,242.1 14,314.3 65.7 58.00 175.131977 15,558.3 466.1 8,242.1 24,266.5 256.0 10,186.2 13,824.3 62.8 64.10 182.241978 12,735.4 415.3 10,186.2 23,336.9 313.4 9,782.8 13,097.6 58.8 64.20 170.55
1979 14,659.0 308.3 9,782.8 24,750.1 389.0 9,746.4 14,470.9 64.3 67.60 165.891980 12,421.2 205.6 9,746.4 22,373.2 333.3 7,442.1 14,486.3 63.6 61.00 137.311981 11,432.3 534.8 7,442.1 19,409.2 341.0 5,315.3 13,641.4 59.3 67.50 138.971982 14,598.0 1,405.9 5,315.3 21,319.2 290.8 7,002.9 13,959.3 60.1 71.60 138.801983 14,059.7 1,239.8 7,002.9 22,302.4 262.5 7,706.6 14,279.8 60.9 68.40 127.561984 15,362.3 1,274.1 7,706.6 24,343.0 226.8 7,869.6 16,192.3 68.5 67.40 121.391985 14,354.3 1,055.9 7,869.6 23,279.8 192.6 7,971.8 15,078.3 63.2 66.30 115.701986 14,796.9 1,118.9 7,971.8 23,887.6 207.3 8,295.2 15,309.2 63.6 63.90 109.311987 15,215.4 883.3 8,295.2 24,393.9 230.6 8,262.0 15,831.2 65.2 59.10 98.581988 14,819.8 892.3 8,262.0 23,974.1 326.3 8,536.2 15,017.6 61.3 60.70 97.83
1989 18,968.9 1,499.1 8,536.2 29,004.2 489.0 11,350.4 17,164.8 69.4 69.30 107.511990 20,710.5 1,069.5 11,350.4 33,130.4 789.0 13,503.3 18,838.1 75.3 67.80 101.431990 21,746.0 761.7 13,503.3 36,011.0 975.3 15,489.1 19,546.6 77.1 66.40 96.141990 17,554.9 450.0 15,489.1 33,494.0 1,571.5 13,088.2 18,834.3 73.3 58.00 82.101990 19,353.3 555.7 13,088.2 32,997.2 1,700.5 11,575.8 19,720.9 75.8 60.10 83.101990 23,079.4 858.5 11,575.8 35,513.7 1,856.5 13,562.2 20,095.0 76.3 62.10 84.071990 22,570.0 703.6 13,562.2 36,835.8 2,015.9 14,944.7 19,875.2 74.6 63.20 83.811990 22,814.6 482.8 14,944.7 38,242.1 2,202.9 16,338.4 19,700.8 73.5 62.30 81.141990 19,946.5 706.0 16,338.4 36,990.9 2,671.5 14,513.6 19,805.8 72.6 60.70 77.721990 18,804.0 931.1 14,513.6 34,248.7 2,476.2 11,331.8 20,440.7 74.0 65.30 82.72
1990 25,672.0 1,339.6 11,331.8 38,343.4 2,202.8 16,261.6 19,879.0 71.2 71.10 88.802000 21,716.5 591.4 16,261.6 38,569.5 2,231.3 16,531.9 19,806.3 70.1 59.80 73.022001 18,497.4 1,106.9 16,531.9 36,136.3 2,410.4 15,029.7 18,696.2 65.5 59.20 70.672002 23,341.6 1,516.7 15,029.7 39,888.1 2,458.3 17,453.6 19,976.3 69.3 58.20 68.432003 19,639.4 1,152.8 17,453.6 38,245.8 2,935.6 15,003.1 20,307.1 69.8 58.70 67.662004 24,532.8 1,282.7 15,003.1 40,818.6 2,989.8 17,129.3 20,699.5 70.5 58.60 65.752005 20,386.2 1,307.6 17,129.3 38,823.1 2,985.9 14,006.2 21,831.0 73.7 60.90 66.202006 21,223.6 1,697.6 14,006.2 36,927.5 3,054.3 14,585.2 19,288.0 64.5 66.40 70.032007 25,319.8 1,740.0 14,585.2 41,645.0 2,849.0 18,050.0 20,745.9 68.7 71.20 73.152008 24,611.6 1,338.2 18,050.0 43,999.8 5,460.7 18,084.0 20,455.1 67.1 79.80 80.41
2009 27,941.1 1,386.0 18,084.0 47,411.1 4,459.6 21,346.0 21,605.5 70.3 87.20 87.202010 25,552.6 1,420.6 21,346.0 48,319.1 4,766.8 21,542.0 22,010.3 71.1 72.50 71.632011 24,792.3 1,248.7 21,542.0 47,583.0 6,153.6 20,916.0 20,513.4 65.7 75.60 73.262012 26,357.5 1,188.1 20,916.0 48,461.6 6,084.5 21,472.0 20,905.1 66.5 76.70 72.932013 25,263.0 1,209.9 21,472.0 47,944.9 7,730.7 19,352.0 20,862.2 65.9 90.10 84.422014 p 29,274.6 1,202.2 19,352.0 49,828.8 8,543.1 19,828.0 21,457.6 67.2 90.50 83.59 -- = Not available. r = revised. p = preliminary. All data are on a calendar year basis. 1/ Source: USDA, National Agricultural Statistics Service. 2/ Source: Bureau of the Census, U.S. Dept. of Commerce. 3/ All product weight were converted to a fresh-weight basis using--Whole=1.553; Paste=5.432; Sauce=3.247; Juice=1.527; Catsup=2.457. 4/ Stocks estimated based on a weighted average Jan. 1 stocks to pack. Source: California League of Food Processors. Stocks for 1989-91 were estimated by ERS based on past relationship to production. After 1991, stocks based on estimates published by the California League of Food Processors. Dec. 1 stocks data for 1994 to the present were adjusted to Jan. 1 by removing an estimate of Dec. shipments. 5/ Excludes shipments to U.S. territories from 1978-88. 6/ Value per ton at the packinghouse door. 7/ Constant dollar prices were deflated using the GDP implicit price deflator, 2009=100. Source: USDA, Economic Research Service.
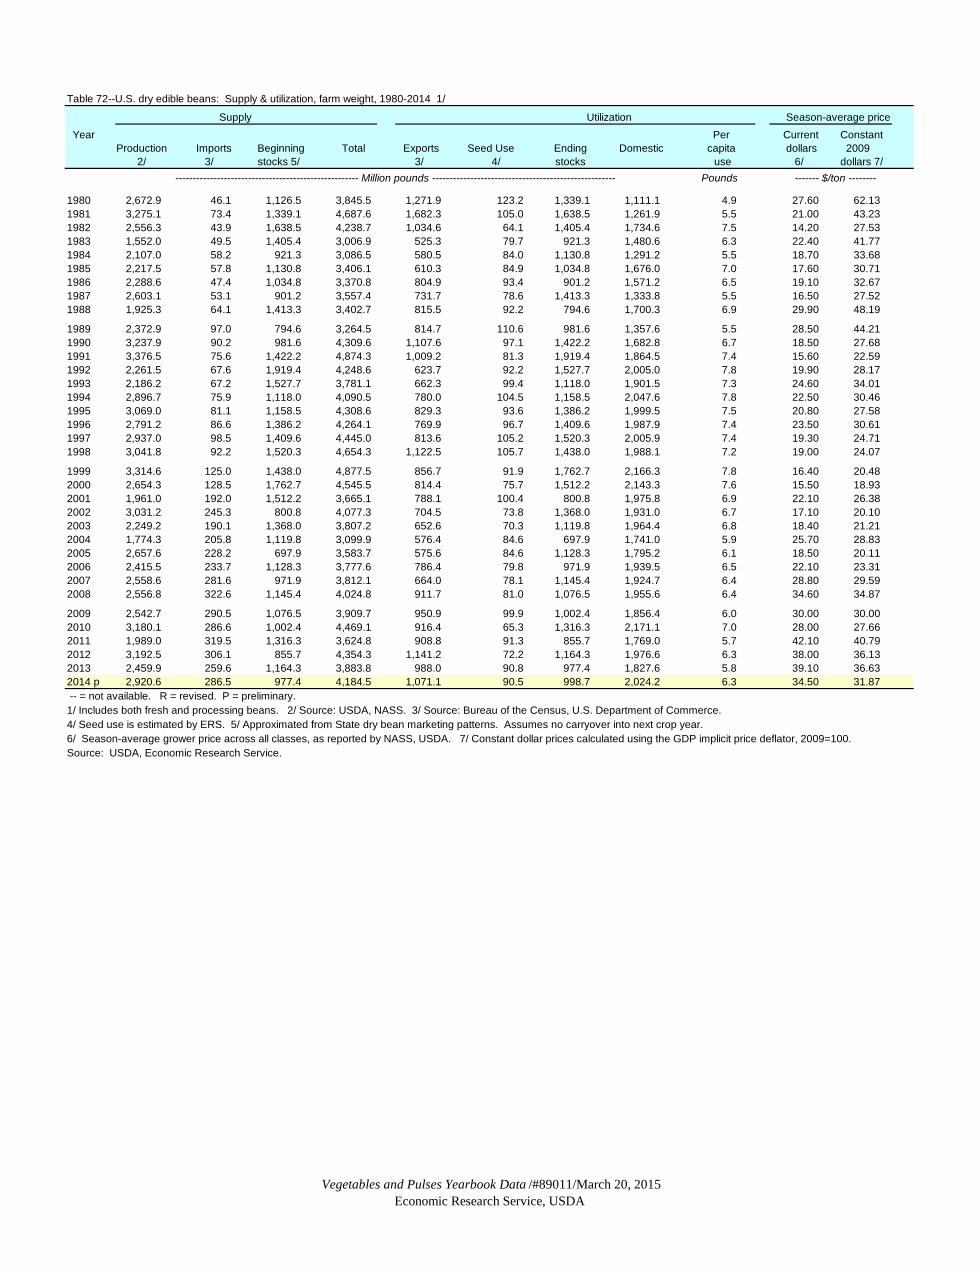
Vegetables and Pulses Yearbook Data /#89011/March 20, 2015Economic Research Service, USDA
Table 72--U.S. dry edible beans: Supply & utilization, farm weight, 1980-2014 1/
Supply Utilization Season-average price Year Per Current Constant
Production Imports Beginning Total Exports Seed Use Ending Domestic capita dollars 2009 2/ 3/ stocks 5/ 3/ 4/ stocks use 6/ dollars 7/
----------------------------------------------------- Million pounds ----------------------------------------------------- Pounds ------- $/ton --------
1980 2,672.9 46.1 1,126.5 3,845.5 1,271.9 123.2 1,339.1 1,111.1 4.9 27.60 62.131981 3,275.1 73.4 1,339.1 4,687.6 1,682.3 105.0 1,638.5 1,261.9 5.5 21.00 43.231982 2,556.3 43.9 1,638.5 4,238.7 1,034.6 64.1 1,405.4 1,734.6 7.5 14.20 27.531983 1,552.0 49.5 1,405.4 3,006.9 525.3 79.7 921.3 1,480.6 6.3 22.40 41.771984 2,107.0 58.2 921.3 3,086.5 580.5 84.0 1,130.8 1,291.2 5.5 18.70 33.681985 2,217.5 57.8 1,130.8 3,406.1 610.3 84.9 1,034.8 1,676.0 7.0 17.60 30.711986 2,288.6 47.4 1,034.8 3,370.8 804.9 93.4 901.2 1,571.2 6.5 19.10 32.671987 2,603.1 53.1 901.2 3,557.4 731.7 78.6 1,413.3 1,333.8 5.5 16.50 27.521988 1,925.3 64.1 1,413.3 3,402.7 815.5 92.2 794.6 1,700.3 6.9 29.90 48.19
1989 2,372.9 97.0 794.6 3,264.5 814.7 110.6 981.6 1,357.6 5.5 28.50 44.211990 3,237.9 90.2 981.6 4,309.6 1,107.6 97.1 1,422.2 1,682.8 6.7 18.50 27.681991 3,376.5 75.6 1,422.2 4,874.3 1,009.2 81.3 1,919.4 1,864.5 7.4 15.60 22.591992 2,261.5 67.6 1,919.4 4,248.6 623.7 92.2 1,527.7 2,005.0 7.8 19.90 28.171993 2,186.2 67.2 1,527.7 3,781.1 662.3 99.4 1,118.0 1,901.5 7.3 24.60 34.011994 2,896.7 75.9 1,118.0 4,090.5 780.0 104.5 1,158.5 2,047.6 7.8 22.50 30.461995 3,069.0 81.1 1,158.5 4,308.6 829.3 93.6 1,386.2 1,999.5 7.5 20.80 27.581996 2,791.2 86.6 1,386.2 4,264.1 769.9 96.7 1,409.6 1,987.9 7.4 23.50 30.611997 2,937.0 98.5 1,409.6 4,445.0 813.6 105.2 1,520.3 2,005.9 7.4 19.30 24.711998 3,041.8 92.2 1,520.3 4,654.3 1,122.5 105.7 1,438.0 1,988.1 7.2 19.00 24.07
1999 3,314.6 125.0 1,438.0 4,877.5 856.7 91.9 1,762.7 2,166.3 7.8 16.40 20.482000 2,654.3 128.5 1,762.7 4,545.5 814.4 75.7 1,512.2 2,143.3 7.6 15.50 18.932001 1,961.0 192.0 1,512.2 3,665.1 788.1 100.4 800.8 1,975.8 6.9 22.10 26.382002 3,031.2 245.3 800.8 4,077.3 704.5 73.8 1,368.0 1,931.0 6.7 17.10 20.102003 2,249.2 190.1 1,368.0 3,807.2 652.6 70.3 1,119.8 1,964.4 6.8 18.40 21.212004 1,774.3 205.8 1,119.8 3,099.9 576.4 84.6 697.9 1,741.0 5.9 25.70 28.832005 2,657.6 228.2 697.9 3,583.7 575.6 84.6 1,128.3 1,795.2 6.1 18.50 20.112006 2,415.5 233.7 1,128.3 3,777.6 786.4 79.8 971.9 1,939.5 6.5 22.10 23.312007 2,558.6 281.6 971.9 3,812.1 664.0 78.1 1,145.4 1,924.7 6.4 28.80 29.592008 2,556.8 322.6 1,145.4 4,024.8 911.7 81.0 1,076.5 1,955.6 6.4 34.60 34.87
2009 2,542.7 290.5 1,076.5 3,909.7 950.9 99.9 1,002.4 1,856.4 6.0 30.00 30.002010 3,180.1 286.6 1,002.4 4,469.1 916.4 65.3 1,316.3 2,171.1 7.0 28.00 27.662011 1,989.0 319.5 1,316.3 3,624.8 908.8 91.3 855.7 1,769.0 5.7 42.10 40.792012 3,192.5 306.1 855.7 4,354.3 1,141.2 72.2 1,164.3 1,976.6 6.3 38.00 36.132013 2,459.9 259.6 1,164.3 3,883.8 988.0 90.8 977.4 1,827.6 5.8 39.10 36.632014 p 2,920.6 286.5 977.4 4,184.5 1,071.1 90.5 998.7 2,024.2 6.3 34.50 31.87 -- = not available. R = revised. P = preliminary. 1/ Includes both fresh and processing beans. 2/ Source: USDA, NASS. 3/ Source: Bureau of the Census, U.S. Department of Commerce.4/ Seed use is estimated by ERS. 5/ Approximated from State dry bean marketing patterns. Assumes no carryover into next crop year. 6/ Season-average grower price across all classes, as reported by NASS, USDA. 7/ Constant dollar prices calculated using the GDP implicit price deflator, 2009=100.Source: USDA, Economic Research Service.
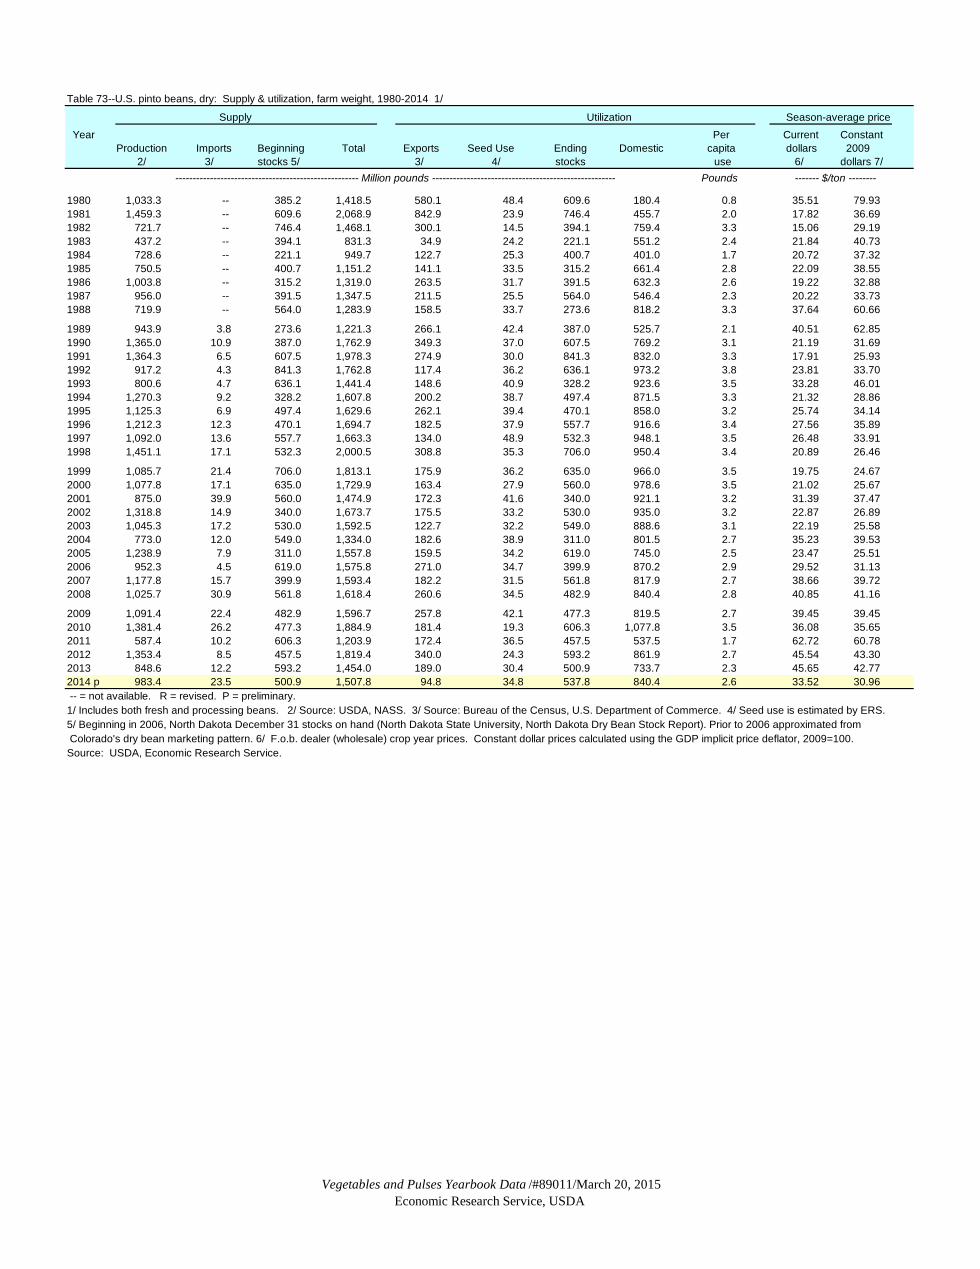
Vegetables and Pulses Yearbook Data /#89011/March 20, 2015Economic Research Service, USDA
Table 73--U.S. pinto beans, dry: Supply & utilization, farm weight, 1980-2014 1/
Supply Utilization Season-average price Year Per Current Constant
Production Imports Beginning Total Exports Seed Use Ending Domestic capita dollars 2009 2/ 3/ stocks 5/ 3/ 4/ stocks use 6/ dollars 7/
----------------------------------------------------- Million pounds ----------------------------------------------------- Pounds ------- $/ton --------
1980 1,033.3 -- 385.2 1,418.5 580.1 48.4 609.6 180.4 0.8 35.51 79.931981 1,459.3 -- 609.6 2,068.9 842.9 23.9 746.4 455.7 2.0 17.82 36.691982 721.7 -- 746.4 1,468.1 300.1 14.5 394.1 759.4 3.3 15.06 29.191983 437.2 -- 394.1 831.3 34.9 24.2 221.1 551.2 2.4 21.84 40.731984 728.6 -- 221.1 949.7 122.7 25.3 400.7 401.0 1.7 20.72 37.321985 750.5 -- 400.7 1,151.2 141.1 33.5 315.2 661.4 2.8 22.09 38.551986 1,003.8 -- 315.2 1,319.0 263.5 31.7 391.5 632.3 2.6 19.22 32.881987 956.0 -- 391.5 1,347.5 211.5 25.5 564.0 546.4 2.3 20.22 33.731988 719.9 -- 564.0 1,283.9 158.5 33.7 273.6 818.2 3.3 37.64 60.66
1989 943.9 3.8 273.6 1,221.3 266.1 42.4 387.0 525.7 2.1 40.51 62.851990 1,365.0 10.9 387.0 1,762.9 349.3 37.0 607.5 769.2 3.1 21.19 31.691991 1,364.3 6.5 607.5 1,978.3 274.9 30.0 841.3 832.0 3.3 17.91 25.931992 917.2 4.3 841.3 1,762.8 117.4 36.2 636.1 973.2 3.8 23.81 33.701993 800.6 4.7 636.1 1,441.4 148.6 40.9 328.2 923.6 3.5 33.28 46.011994 1,270.3 9.2 328.2 1,607.8 200.2 38.7 497.4 871.5 3.3 21.32 28.861995 1,125.3 6.9 497.4 1,629.6 262.1 39.4 470.1 858.0 3.2 25.74 34.141996 1,212.3 12.3 470.1 1,694.7 182.5 37.9 557.7 916.6 3.4 27.56 35.891997 1,092.0 13.6 557.7 1,663.3 134.0 48.9 532.3 948.1 3.5 26.48 33.911998 1,451.1 17.1 532.3 2,000.5 308.8 35.3 706.0 950.4 3.4 20.89 26.46
1999 1,085.7 21.4 706.0 1,813.1 175.9 36.2 635.0 966.0 3.5 19.75 24.672000 1,077.8 17.1 635.0 1,729.9 163.4 27.9 560.0 978.6 3.5 21.02 25.672001 875.0 39.9 560.0 1,474.9 172.3 41.6 340.0 921.1 3.2 31.39 37.472002 1,318.8 14.9 340.0 1,673.7 175.5 33.2 530.0 935.0 3.2 22.87 26.892003 1,045.3 17.2 530.0 1,592.5 122.7 32.2 549.0 888.6 3.1 22.19 25.582004 773.0 12.0 549.0 1,334.0 182.6 38.9 311.0 801.5 2.7 35.23 39.532005 1,238.9 7.9 311.0 1,557.8 159.5 34.2 619.0 745.0 2.5 23.47 25.512006 952.3 4.5 619.0 1,575.8 271.0 34.7 399.9 870.2 2.9 29.52 31.132007 1,177.8 15.7 399.9 1,593.4 182.2 31.5 561.8 817.9 2.7 38.66 39.722008 1,025.7 30.9 561.8 1,618.4 260.6 34.5 482.9 840.4 2.8 40.85 41.16
2009 1,091.4 22.4 482.9 1,596.7 257.8 42.1 477.3 819.5 2.7 39.45 39.452010 1,381.4 26.2 477.3 1,884.9 181.4 19.3 606.3 1,077.8 3.5 36.08 35.652011 587.4 10.2 606.3 1,203.9 172.4 36.5 457.5 537.5 1.7 62.72 60.782012 1,353.4 8.5 457.5 1,819.4 340.0 24.3 593.2 861.9 2.7 45.54 43.302013 848.6 12.2 593.2 1,454.0 189.0 30.4 500.9 733.7 2.3 45.65 42.772014 p 983.4 23.5 500.9 1,507.8 94.8 34.8 537.8 840.4 2.6 33.52 30.96 -- = not available. R = revised. P = preliminary. 1/ Includes both fresh and processing beans. 2/ Source: USDA, NASS. 3/ Source: Bureau of the Census, U.S. Department of Commerce. 4/ Seed use is estimated by ERS. 5/ Beginning in 2006, North Dakota December 31 stocks on hand (North Dakota State University, North Dakota Dry Bean Stock Report). Prior to 2006 approximated from Colorado's dry bean marketing pattern. 6/ F.o.b. dealer (wholesale) crop year prices. Constant dollar prices calculated using the GDP implicit price deflator, 2009=100.Source: USDA, Economic Research Service.

Vegetables and Pulses Yearbook Data /#89011/March 20, 2015Economic Research Service, USDA
Table 74--U.S. navy beans, dry: Supply & utilization, farm weight, 1980-2014 1/
Supply Utilization Season-average price Year Per Current Constant
Production Imports Beginning Total Exports Seed Use Ending Domestic capita dollars 2009 2/ 3/ stocks 5/ 3/ 4/ stocks use 6/ dollars 7/
----------------------------------------------------- Million pounds ----------------------------------------------------- Pounds ------- $/ton --------
1980 571.7 -- 251.9 823.6 160.6 23.1 182.9 457.0 2.0 33.47 75.341981 555.0 -- 182.9 737.9 234.2 34.7 205.4 263.6 1.1 31.88 65.631982 793.7 -- 205.4 999.1 204.3 20.4 412.7 361.7 1.6 17.20 33.341983 461.8 -- 412.7 874.5 139.1 19.9 340.0 375.5 1.6 26.49 49.401984 497.9 -- 340.0 837.9 150.8 25.2 255.0 406.9 1.7 22.77 41.011985 627.3 -- 255.0 882.3 146.9 13.9 280.0 441.5 1.9 18.56 32.391986 351.5 -- 280.0 631.5 197.8 27.6 120.0 286.1 1.2 43.22 73.931987 719.9 -- 120.0 839.9 166.0 24.1 300.0 349.8 1.4 20.93 34.911988 337.9 -- 300.0 637.9 192.3 22.7 148.7 274.2 1.1 37.65 60.68
1989 445.7 2.2 148.7 596.6 146.3 24.5 163.4 262.4 1.1 29.82 46.261990 659.3 5.6 163.4 828.3 249.9 23.5 240.0 314.9 1.3 20.41 30.531991 826.8 2.0 240.0 1,068.8 276.9 20.1 400.0 371.8 1.5 17.71 25.641992 501.8 5.3 400.0 907.1 131.2 21.3 360.0 394.6 1.5 21.15 29.941993 527.5 2.7 360.0 890.2 202.0 20.6 355.0 312.6 1.2 23.73 32.811994 528.9 0.2 355.0 884.1 162.0 23.4 215.0 483.7 1.8 31.63 42.821995 731.4 4.4 215.0 950.8 211.7 19.7 280.0 439.5 1.6 23.88 31.671996 598.4 2.1 280.0 880.5 181.1 17.8 340.0 341.6 1.3 23.11 30.101997 552.4 5.4 340.0 897.8 226.5 11.5 285.0 374.8 1.4 20.82 26.661998 388.7 0.9 285.0 674.6 208.2 19.8 140.0 306.6 1.1 25.82 32.71
1999 729.4 1.5 140.0 870.9 223.7 15.6 290.0 341.6 1.2 19.16 23.932000 477.1 14.3 290.0 781.4 163.4 9.6 280.0 328.4 1.2 16.43 20.062001 231.1 20.6 280.0 531.7 151.6 15.5 79.0 285.6 1.0 25.65 30.622002 538.9 17.1 79.0 635.0 129.9 7.1 237.9 260.1 0.9 18.00 21.162003 251.4 16.3 237.9 505.6 136.9 8.3 113.0 247.5 0.9 23.53 27.122004 214.2 14.2 113.0 341.4 133.0 10.6 35.7 162.0 0.6 29.64 33.252005 399.5 14.6 35.7 449.8 109.7 12.6 131.8 195.7 0.7 24.44 26.572006 435.3 15.9 131.8 583.1 116.9 10.0 174.1 282.0 0.9 29.07 30.662007 383.2 17.8 174.1 575.1 102.7 11.3 164.1 297.1 1.0 44.48 45.702008 454.2 21.4 164.1 639.7 192.5 8.8 135.4 303.0 1.0 36.63 36.91
2009 333.2 13.2 135.4 481.9 153.7 12.6 119.0 196.5 0.6 40.37 40.372010 476.6 5.3 119.0 601.0 165.5 9.2 167.6 258.7 0.8 41.94 41.442011 324.8 11.2 167.6 503.6 208.1 11.8 101.5 182.2 0.6 58.17 56.372012 490.6 18.7 101.5 610.8 228.3 7.8 164.8 209.8 0.7 45.72 43.482013 340.2 9.0 164.8 514.0 266.6 10.9 122.9 113.5 0.4 55.17 51.692014 p 442.1 9.9 122.9 574.9 411.2 11.7 131.6 20.4 0.1 39.37 36.36 -- = not available. R = revised. P = preliminary. 1/ Includes both fresh and processing beans. 2/ Source: USDA, NASS. 3/ Source: Bureau of the Census, U.S. Department of Commerce. 4/ Seed use is estimated by ERS.5/ Beginning in 2006, North Dakota December 31 stocks on hand (North Dakota State University, North Dakota Dry Bean Stock Report). Prior to 2006 approximated fromColorado's dry bean marketing pattern. 6/ F.o.b. dealer (wholesale) crop year prices. Constant dollar prices calculated using the GDP implicit price deflator, 2009=100.Source: USDA, Economic Research Service.
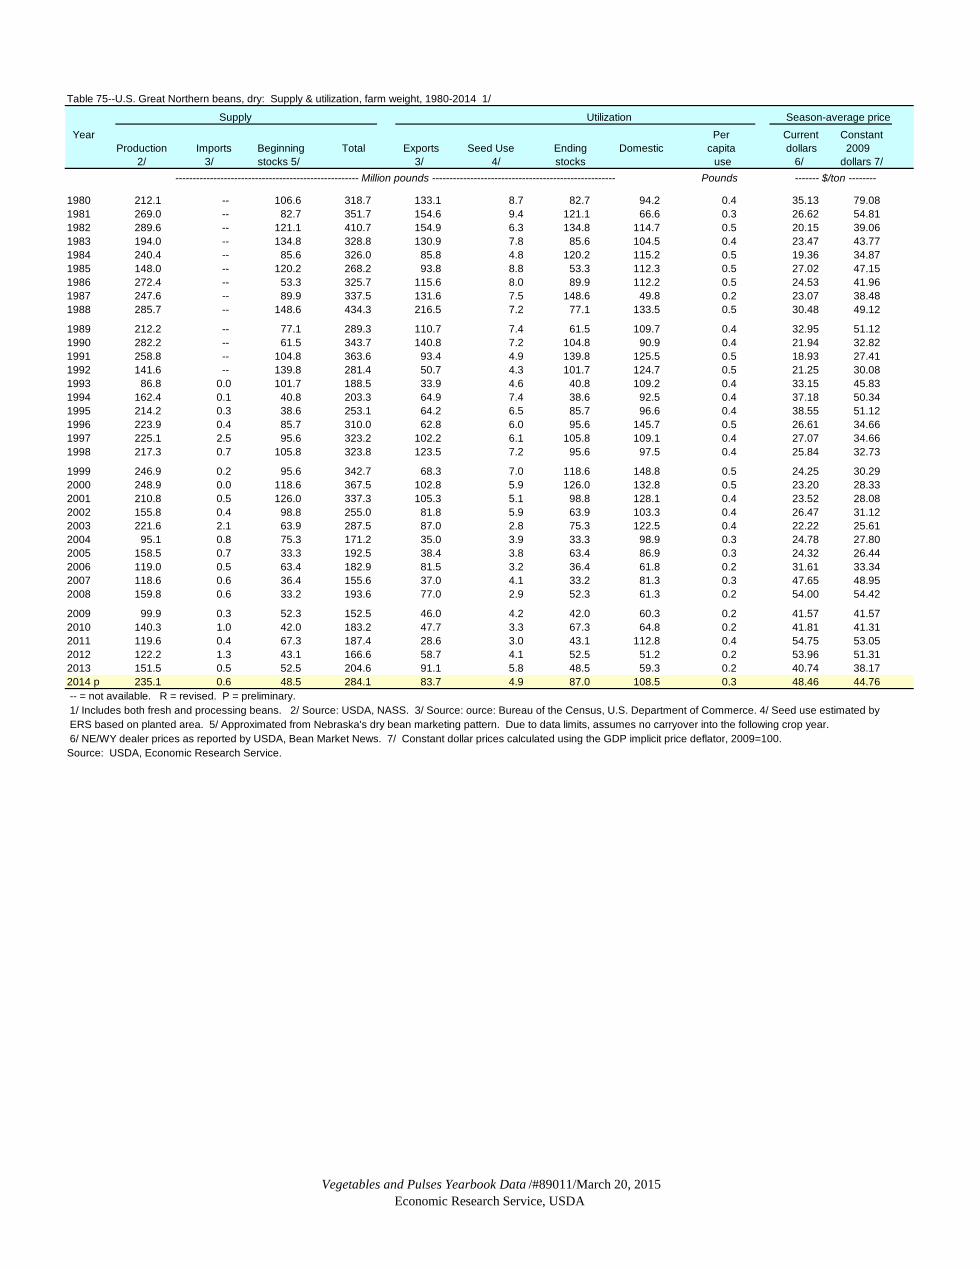
Vegetables and Pulses Yearbook Data /#89011/March 20, 2015Economic Research Service, USDA
Table 75--U.S. Great Northern beans, dry: Supply & utilization, farm weight, 1980-2014 1/
Supply Utilization Season-average price Year Per Current Constant
Production Imports Beginning Total Exports Seed Use Ending Domestic capita dollars 2009 2/ 3/ stocks 5/ 3/ 4/ stocks use 6/ dollars 7/
----------------------------------------------------- Million pounds ----------------------------------------------------- Pounds ------- $/ton --------
1980 212.1 -- 106.6 318.7 133.1 8.7 82.7 94.2 0.4 35.13 79.081981 269.0 -- 82.7 351.7 154.6 9.4 121.1 66.6 0.3 26.62 54.811982 289.6 -- 121.1 410.7 154.9 6.3 134.8 114.7 0.5 20.15 39.061983 194.0 -- 134.8 328.8 130.9 7.8 85.6 104.5 0.4 23.47 43.771984 240.4 -- 85.6 326.0 85.8 4.8 120.2 115.2 0.5 19.36 34.871985 148.0 -- 120.2 268.2 93.8 8.8 53.3 112.3 0.5 27.02 47.151986 272.4 -- 53.3 325.7 115.6 8.0 89.9 112.2 0.5 24.53 41.961987 247.6 -- 89.9 337.5 131.6 7.5 148.6 49.8 0.2 23.07 38.481988 285.7 -- 148.6 434.3 216.5 7.2 77.1 133.5 0.5 30.48 49.12
1989 212.2 -- 77.1 289.3 110.7 7.4 61.5 109.7 0.4 32.95 51.121990 282.2 -- 61.5 343.7 140.8 7.2 104.8 90.9 0.4 21.94 32.821991 258.8 -- 104.8 363.6 93.4 4.9 139.8 125.5 0.5 18.93 27.411992 141.6 -- 139.8 281.4 50.7 4.3 101.7 124.7 0.5 21.25 30.081993 86.8 0.0 101.7 188.5 33.9 4.6 40.8 109.2 0.4 33.15 45.831994 162.4 0.1 40.8 203.3 64.9 7.4 38.6 92.5 0.4 37.18 50.341995 214.2 0.3 38.6 253.1 64.2 6.5 85.7 96.6 0.4 38.55 51.121996 223.9 0.4 85.7 310.0 62.8 6.0 95.6 145.7 0.5 26.61 34.661997 225.1 2.5 95.6 323.2 102.2 6.1 105.8 109.1 0.4 27.07 34.661998 217.3 0.7 105.8 323.8 123.5 7.2 95.6 97.5 0.4 25.84 32.73
1999 246.9 0.2 95.6 342.7 68.3 7.0 118.6 148.8 0.5 24.25 30.292000 248.9 0.0 118.6 367.5 102.8 5.9 126.0 132.8 0.5 23.20 28.332001 210.8 0.5 126.0 337.3 105.3 5.1 98.8 128.1 0.4 23.52 28.082002 155.8 0.4 98.8 255.0 81.8 5.9 63.9 103.3 0.4 26.47 31.122003 221.6 2.1 63.9 287.5 87.0 2.8 75.3 122.5 0.4 22.22 25.612004 95.1 0.8 75.3 171.2 35.0 3.9 33.3 98.9 0.3 24.78 27.802005 158.5 0.7 33.3 192.5 38.4 3.8 63.4 86.9 0.3 24.32 26.442006 119.0 0.5 63.4 182.9 81.5 3.2 36.4 61.8 0.2 31.61 33.342007 118.6 0.6 36.4 155.6 37.0 4.1 33.2 81.3 0.3 47.65 48.952008 159.8 0.6 33.2 193.6 77.0 2.9 52.3 61.3 0.2 54.00 54.42
2009 99.9 0.3 52.3 152.5 46.0 4.2 42.0 60.3 0.2 41.57 41.572010 140.3 1.0 42.0 183.2 47.7 3.3 67.3 64.8 0.2 41.81 41.312011 119.6 0.4 67.3 187.4 28.6 3.0 43.1 112.8 0.4 54.75 53.052012 122.2 1.3 43.1 166.6 58.7 4.1 52.5 51.2 0.2 53.96 51.312013 151.5 0.5 52.5 204.6 91.1 5.8 48.5 59.3 0.2 40.74 38.172014 p 235.1 0.6 48.5 284.1 83.7 4.9 87.0 108.5 0.3 48.46 44.76 -- = not available. R = revised. P = preliminary. 1/ Includes both fresh and processing beans. 2/ Source: USDA, NASS. 3/ Source: ource: Bureau of the Census, U.S. Department of Commerce. 4/ Seed use estimated by ERS based on planted area. 5/ Approximated from Nebraska's dry bean marketing pattern. Due to data limits, assumes no carryover into the following crop year. 6/ NE/WY dealer prices as reported by USDA, Bean Market News. 7/ Constant dollar prices calculated using the GDP implicit price deflator, 2009=100.Source: USDA, Economic Research Service.

Vegetables and Pulses Yearbook Data /#89011/March 20, 2015Economic Research Service, USDA
Table 76--U.S. black beans, dry: Supply & utilization, farm weight, 1980-2014 1/
Supply Utilization Season-average price Year Per Current Constant
Production Imports Beginning Total Exports Seed Use Ending Domestic capita dollars 2009 2/ 3/ stocks 5/ 3/ 4/ stocks use 6/ dollars 7/
----------------------------------------------------- Million pounds ----------------------------------------------------- Pounds ------- $/ton --------
1980 145.1 -- 22.4 167.5 119.6 10.1 36.4 1.4 0.0 -- --1981 224.4 -- 36.4 260.8 165.3 1.2 78.0 16.3 0.1 -- --1982 25.9 -- 78.0 103.9 65.1 0.2 28.5 10.1 0.0 -- --1983 4.8 -- 28.5 33.3 18.0 0.5 7.1 7.7 0.0 -- --1984 11.0 -- 7.1 18.1 7.7 0.8 4.8 4.8 0.0 -- --1985 18.2 -- 4.8 23.0 9.3 3.1 7.5 3.1 0.0 -- --1986 71.7 -- 7.5 79.2 57.0 0.9 13.8 7.5 0.0 -- --1987 22.1 -- 13.8 35.9 13.8 0.4 9.7 12.0 0.0 -- --1988 10.0 -- 9.7 19.7 12.9 2.0 2.4 2.4 0.0 -- --
1989 46.6 2.3 2.4 51.3 24.7 3.6 7.1 15.8 0.1 40.50 62.831990 109.2 2.9 7.1 119.2 46.3 2.4 45.4 25.1 0.1 23.85 35.681991 74.1 2.4 45.4 121.9 41.6 3.4 40.0 36.9 0.1 19.90 28.811992 75.8 2.8 40.0 118.6 50.3 4.7 28.0 35.6 0.1 24.25 34.331993 127.0 1.8 28.0 156.8 39.5 6.1 57.2 54.0 0.2 27.95 38.651994 146.2 1.7 57.2 205.1 72.6 7.5 45.9 79.2 0.3 32.60 44.131995 230.5 2.7 45.9 279.1 52.2 5.0 108.3 113.6 0.4 23.20 30.771996 135.0 3.2 108.3 246.5 78.0 7.7 64.8 96.0 0.4 27.30 35.551997 212.2 2.6 64.8 279.6 68.8 13.7 105.3 91.8 0.3 33.19 42.501998 356.4 5.2 105.3 466.9 161.5 10.6 149.7 145.1 0.5 28.56 36.18
1999 337.1 7.6 149.7 494.4 71.7 5.4 244.4 172.9 0.6 18.37 22.942000 133.6 9.6 244.4 387.6 63.8 5.4 158.4 160.0 0.6 18.33 22.382001 78.3 24.5 158.4 261.2 77.1 11.2 32.1 140.8 0.5 37.44 44.702002 312.0 64.8 32.1 408.9 79.5 4.8 192.7 132.0 0.5 19.24 22.622003 126.3 19.9 192.7 338.9 101.1 7.9 95.0 134.9 0.5 24.64 28.402004 189.2 20.6 95.0 304.8 54.6 6.4 85.7 158.1 0.5 26.51 29.742005 181.1 19.3 85.7 286.1 64.9 9.5 65.2 146.5 0.5 29.54 32.112006 267.3 31.7 65.2 364.2 85.4 10.0 106.9 161.9 0.5 30.94 32.632007 280.3 51.8 106.9 439.1 103.9 9.8 158.1 167.2 0.6 43.47 44.662008 292.3 44.3 158.1 494.7 129.2 10.7 191.8 163.0 0.5 46.70 47.06
2009 301.0 34.4 191.8 527.2 266.2 16.2 78.3 166.6 0.5 46.04 46.042010 466.1 40.8 78.3 585.1 265.5 10.5 195.1 114.0 0.4 43.05 42.532011 301.8 59.9 195.1 556.8 213.6 12.4 54.3 276.5 0.9 52.09 50.482012 373.9 37.0 54.3 465.2 113.1 8.2 119.6 224.4 0.7 46.36 44.082013 254.5 32.2 119.6 406.3 94.8 12.9 38.2 260.5 0.8 52.50 49.192014 p 399.7 35.8 38.2 473.7 100.3 12.8 86.6 274.0 0.9 44.61 41.20 -- = not available. R = revised. P = preliminary. 1/ Includes both fresh and processing beans. 2/ Source: National Agricultural Statistics Service, USDA. 3/ Source: Bureau of the Census, U.S. Department of Commerce. 4/ Seed use calculated as acres planted times estimated seeding rate per acre. 5/ Estimated by ERS using marketing patterns for all Michigan dry beans. 6/ Michigan dealer prices as reported by USDA, Bean Market News. 7/ Constant dollar prices calculated using the GDP implicit price deflator, 2009=100.Source: USDA, Economic Research Service.
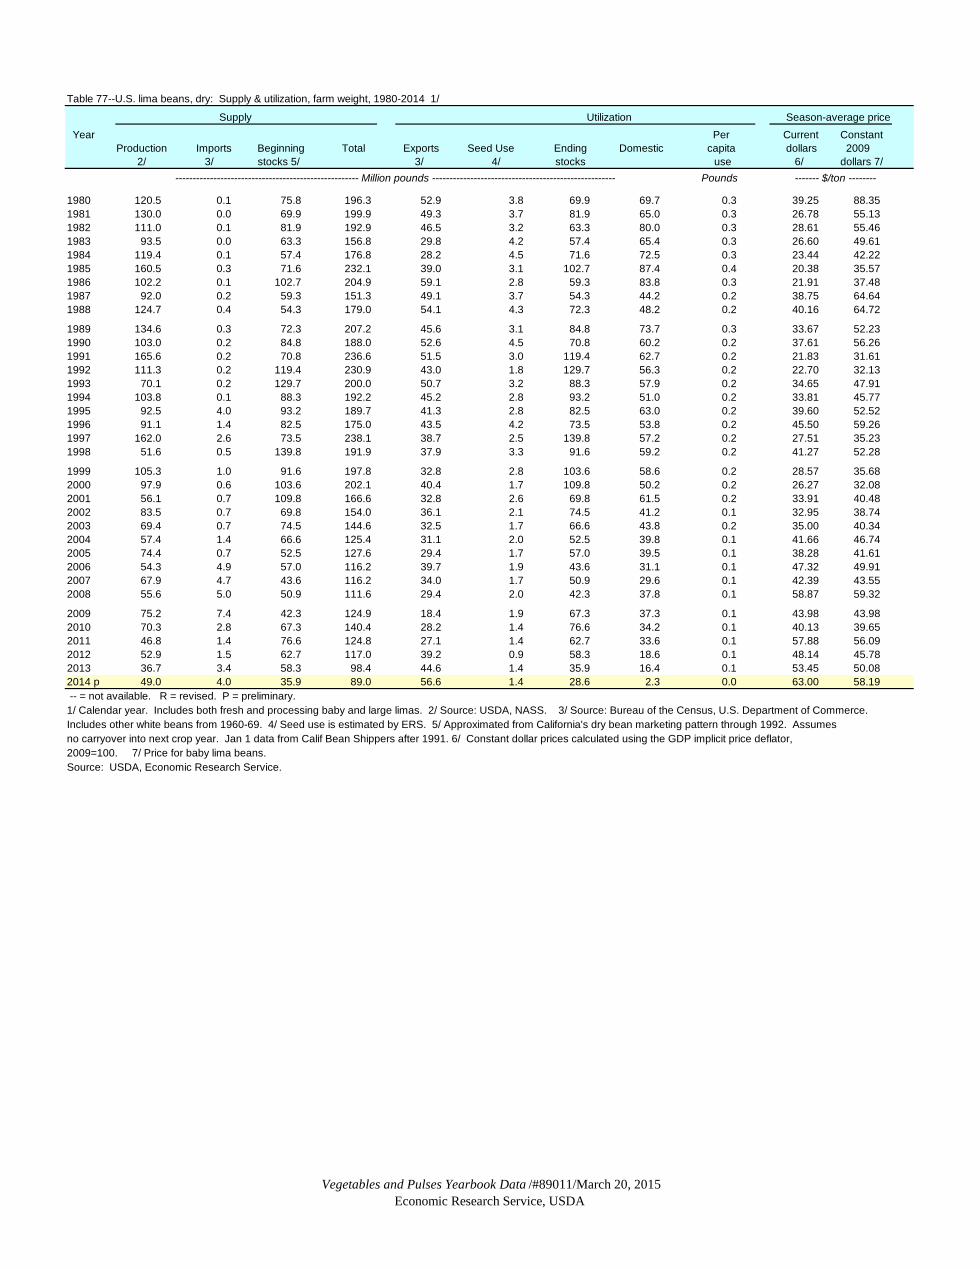
Vegetables and Pulses Yearbook Data /#89011/March 20, 2015Economic Research Service, USDA
Table 77--U.S. lima beans, dry: Supply & utilization, farm weight, 1980-2014 1/
Supply Utilization Season-average price Year Per Current Constant
Production Imports Beginning Total Exports Seed Use Ending Domestic capita dollars 2009 2/ 3/ stocks 5/ 3/ 4/ stocks use 6/ dollars 7/
----------------------------------------------------- Million pounds ----------------------------------------------------- Pounds ------- $/ton --------
1980 120.5 0.1 75.8 196.3 52.9 3.8 69.9 69.7 0.3 39.25 88.351981 130.0 0.0 69.9 199.9 49.3 3.7 81.9 65.0 0.3 26.78 55.131982 111.0 0.1 81.9 192.9 46.5 3.2 63.3 80.0 0.3 28.61 55.461983 93.5 0.0 63.3 156.8 29.8 4.2 57.4 65.4 0.3 26.60 49.611984 119.4 0.1 57.4 176.8 28.2 4.5 71.6 72.5 0.3 23.44 42.221985 160.5 0.3 71.6 232.1 39.0 3.1 102.7 87.4 0.4 20.38 35.571986 102.2 0.1 102.7 204.9 59.1 2.8 59.3 83.8 0.3 21.91 37.481987 92.0 0.2 59.3 151.3 49.1 3.7 54.3 44.2 0.2 38.75 64.641988 124.7 0.4 54.3 179.0 54.1 4.3 72.3 48.2 0.2 40.16 64.72
1989 134.6 0.3 72.3 207.2 45.6 3.1 84.8 73.7 0.3 33.67 52.231990 103.0 0.2 84.8 188.0 52.6 4.5 70.8 60.2 0.2 37.61 56.261991 165.6 0.2 70.8 236.6 51.5 3.0 119.4 62.7 0.2 21.83 31.611992 111.3 0.2 119.4 230.9 43.0 1.8 129.7 56.3 0.2 22.70 32.131993 70.1 0.2 129.7 200.0 50.7 3.2 88.3 57.9 0.2 34.65 47.911994 103.8 0.1 88.3 192.2 45.2 2.8 93.2 51.0 0.2 33.81 45.771995 92.5 4.0 93.2 189.7 41.3 2.8 82.5 63.0 0.2 39.60 52.521996 91.1 1.4 82.5 175.0 43.5 4.2 73.5 53.8 0.2 45.50 59.261997 162.0 2.6 73.5 238.1 38.7 2.5 139.8 57.2 0.2 27.51 35.231998 51.6 0.5 139.8 191.9 37.9 3.3 91.6 59.2 0.2 41.27 52.28
1999 105.3 1.0 91.6 197.8 32.8 2.8 103.6 58.6 0.2 28.57 35.682000 97.9 0.6 103.6 202.1 40.4 1.7 109.8 50.2 0.2 26.27 32.082001 56.1 0.7 109.8 166.6 32.8 2.6 69.8 61.5 0.2 33.91 40.482002 83.5 0.7 69.8 154.0 36.1 2.1 74.5 41.2 0.1 32.95 38.742003 69.4 0.7 74.5 144.6 32.5 1.7 66.6 43.8 0.2 35.00 40.342004 57.4 1.4 66.6 125.4 31.1 2.0 52.5 39.8 0.1 41.66 46.742005 74.4 0.7 52.5 127.6 29.4 1.7 57.0 39.5 0.1 38.28 41.612006 54.3 4.9 57.0 116.2 39.7 1.9 43.6 31.1 0.1 47.32 49.912007 67.9 4.7 43.6 116.2 34.0 1.7 50.9 29.6 0.1 42.39 43.552008 55.6 5.0 50.9 111.6 29.4 2.0 42.3 37.8 0.1 58.87 59.32
2009 75.2 7.4 42.3 124.9 18.4 1.9 67.3 37.3 0.1 43.98 43.982010 70.3 2.8 67.3 140.4 28.2 1.4 76.6 34.2 0.1 40.13 39.652011 46.8 1.4 76.6 124.8 27.1 1.4 62.7 33.6 0.1 57.88 56.092012 52.9 1.5 62.7 117.0 39.2 0.9 58.3 18.6 0.1 48.14 45.782013 36.7 3.4 58.3 98.4 44.6 1.4 35.9 16.4 0.1 53.45 50.082014 p 49.0 4.0 35.9 89.0 56.6 1.4 28.6 2.3 0.0 63.00 58.19 -- = not available. R = revised. P = preliminary. 1/ Calendar year. Includes both fresh and processing baby and large limas. 2/ Source: USDA, NASS. 3/ Source: Bureau of the Census, U.S. Department of Commerce. Includes other white beans from 1960-69. 4/ Seed use is estimated by ERS. 5/ Approximated from California's dry bean marketing pattern through 1992. Assumes no carryover into next crop year. Jan 1 data from Calif Bean Shippers after 1991. 6/ Constant dollar prices calculated using the GDP implicit price deflator, 2009=100. 7/ Price for baby lima beans.Source: USDA, Economic Research Service.
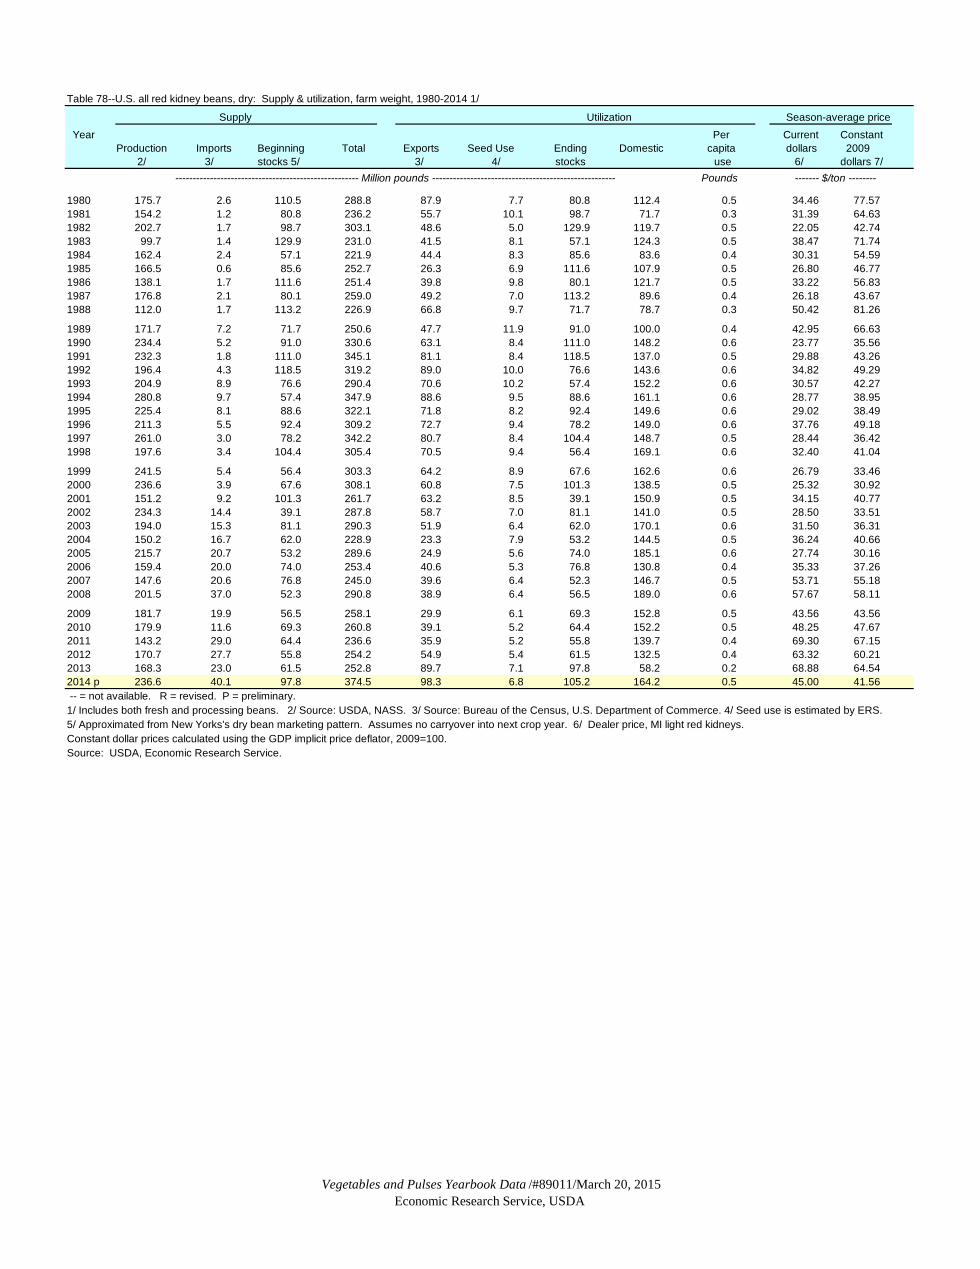
Vegetables and Pulses Yearbook Data /#89011/March 20, 2015Economic Research Service, USDA
Table 78--U.S. all red kidney beans, dry: Supply & utilization, farm weight, 1980-2014 1/
Supply Utilization Season-average price Year Per Current Constant
Production Imports Beginning Total Exports Seed Use Ending Domestic capita dollars 2009 2/ 3/ stocks 5/ 3/ 4/ stocks use 6/ dollars 7/
----------------------------------------------------- Million pounds ----------------------------------------------------- Pounds ------- $/ton --------
1980 175.7 2.6 110.5 288.8 87.9 7.7 80.8 112.4 0.5 34.46 77.571981 154.2 1.2 80.8 236.2 55.7 10.1 98.7 71.7 0.3 31.39 64.631982 202.7 1.7 98.7 303.1 48.6 5.0 129.9 119.7 0.5 22.05 42.741983 99.7 1.4 129.9 231.0 41.5 8.1 57.1 124.3 0.5 38.47 71.741984 162.4 2.4 57.1 221.9 44.4 8.3 85.6 83.6 0.4 30.31 54.591985 166.5 0.6 85.6 252.7 26.3 6.9 111.6 107.9 0.5 26.80 46.771986 138.1 1.7 111.6 251.4 39.8 9.8 80.1 121.7 0.5 33.22 56.831987 176.8 2.1 80.1 259.0 49.2 7.0 113.2 89.6 0.4 26.18 43.671988 112.0 1.7 113.2 226.9 66.8 9.7 71.7 78.7 0.3 50.42 81.26
1989 171.7 7.2 71.7 250.6 47.7 11.9 91.0 100.0 0.4 42.95 66.631990 234.4 5.2 91.0 330.6 63.1 8.4 111.0 148.2 0.6 23.77 35.561991 232.3 1.8 111.0 345.1 81.1 8.4 118.5 137.0 0.5 29.88 43.261992 196.4 4.3 118.5 319.2 89.0 10.0 76.6 143.6 0.6 34.82 49.291993 204.9 8.9 76.6 290.4 70.6 10.2 57.4 152.2 0.6 30.57 42.271994 280.8 9.7 57.4 347.9 88.6 9.5 88.6 161.1 0.6 28.77 38.951995 225.4 8.1 88.6 322.1 71.8 8.2 92.4 149.6 0.6 29.02 38.491996 211.3 5.5 92.4 309.2 72.7 9.4 78.2 149.0 0.6 37.76 49.181997 261.0 3.0 78.2 342.2 80.7 8.4 104.4 148.7 0.5 28.44 36.421998 197.6 3.4 104.4 305.4 70.5 9.4 56.4 169.1 0.6 32.40 41.04
1999 241.5 5.4 56.4 303.3 64.2 8.9 67.6 162.6 0.6 26.79 33.462000 236.6 3.9 67.6 308.1 60.8 7.5 101.3 138.5 0.5 25.32 30.922001 151.2 9.2 101.3 261.7 63.2 8.5 39.1 150.9 0.5 34.15 40.772002 234.3 14.4 39.1 287.8 58.7 7.0 81.1 141.0 0.5 28.50 33.512003 194.0 15.3 81.1 290.3 51.9 6.4 62.0 170.1 0.6 31.50 36.312004 150.2 16.7 62.0 228.9 23.3 7.9 53.2 144.5 0.5 36.24 40.662005 215.7 20.7 53.2 289.6 24.9 5.6 74.0 185.1 0.6 27.74 30.162006 159.4 20.0 74.0 253.4 40.6 5.3 76.8 130.8 0.4 35.33 37.262007 147.6 20.6 76.8 245.0 39.6 6.4 52.3 146.7 0.5 53.71 55.182008 201.5 37.0 52.3 290.8 38.9 6.4 56.5 189.0 0.6 57.67 58.11
2009 181.7 19.9 56.5 258.1 29.9 6.1 69.3 152.8 0.5 43.56 43.562010 179.9 11.6 69.3 260.8 39.1 5.2 64.4 152.2 0.5 48.25 47.672011 143.2 29.0 64.4 236.6 35.9 5.2 55.8 139.7 0.4 69.30 67.152012 170.7 27.7 55.8 254.2 54.9 5.4 61.5 132.5 0.4 63.32 60.212013 168.3 23.0 61.5 252.8 89.7 7.1 97.8 58.2 0.2 68.88 64.542014 p 236.6 40.1 97.8 374.5 98.3 6.8 105.2 164.2 0.5 45.00 41.56 -- = not available. R = revised. P = preliminary. 1/ Includes both fresh and processing beans. 2/ Source: USDA, NASS. 3/ Source: Bureau of the Census, U.S. Department of Commerce. 4/ Seed use is estimated by ERS. 5/ Approximated from New Yorks's dry bean marketing pattern. Assumes no carryover into next crop year. 6/ Dealer price, MI light red kidneys. Constant dollar prices calculated using the GDP implicit price deflator, 2009=100.Source: USDA, Economic Research Service.
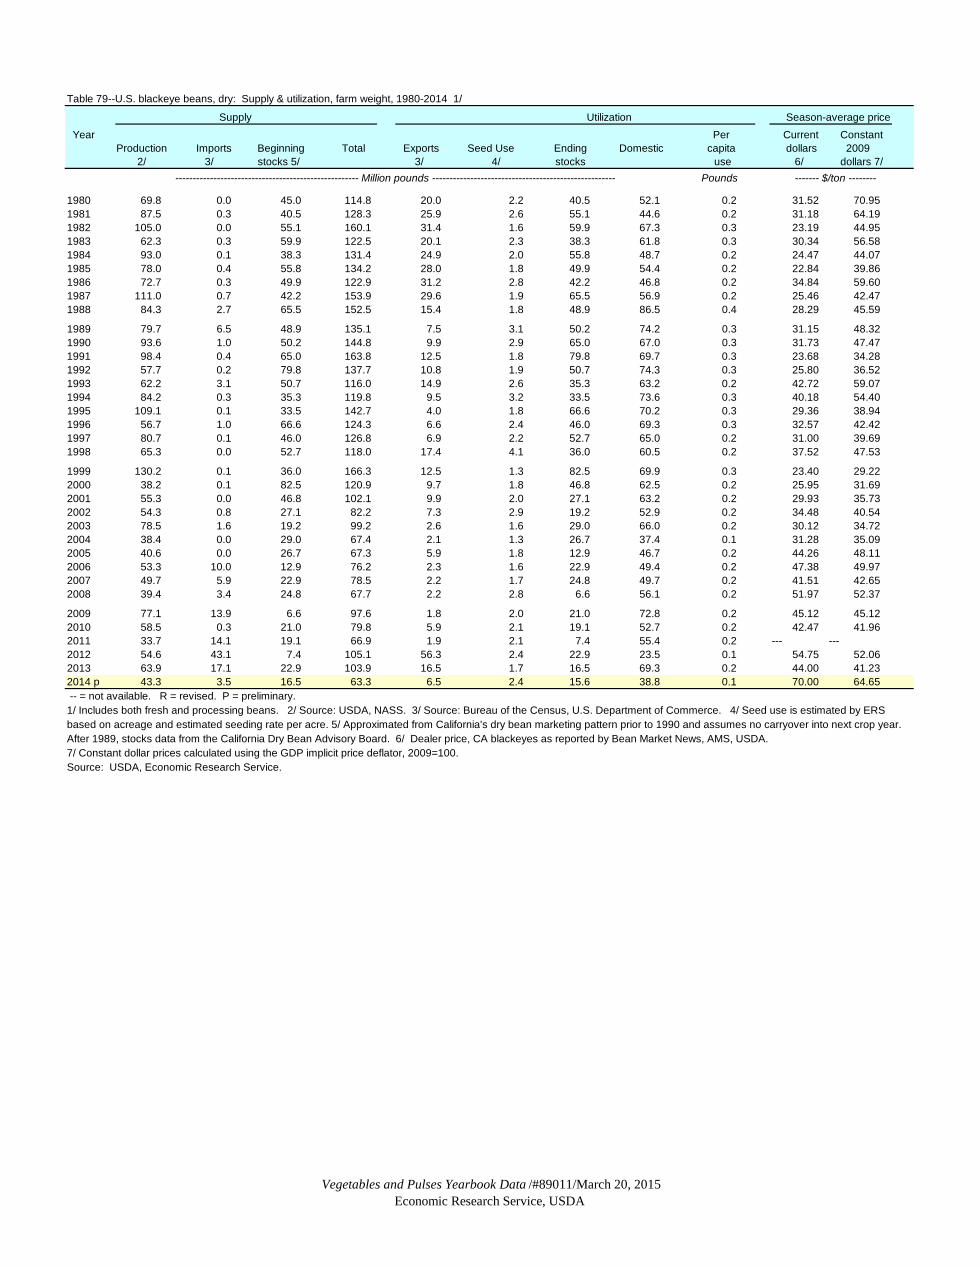
Vegetables and Pulses Yearbook Data /#89011/March 20, 2015Economic Research Service, USDA
Table 79--U.S. blackeye beans, dry: Supply & utilization, farm weight, 1980-2014 1/
Supply Utilization Season-average price Year Per Current Constant
Production Imports Beginning Total Exports Seed Use Ending Domestic capita dollars 2009 2/ 3/ stocks 5/ 3/ 4/ stocks use 6/ dollars 7/
----------------------------------------------------- Million pounds ----------------------------------------------------- Pounds ------- $/ton --------
1980 69.8 0.0 45.0 114.8 20.0 2.2 40.5 52.1 0.2 31.52 70.951981 87.5 0.3 40.5 128.3 25.9 2.6 55.1 44.6 0.2 31.18 64.191982 105.0 0.0 55.1 160.1 31.4 1.6 59.9 67.3 0.3 23.19 44.951983 62.3 0.3 59.9 122.5 20.1 2.3 38.3 61.8 0.3 30.34 56.581984 93.0 0.1 38.3 131.4 24.9 2.0 55.8 48.7 0.2 24.47 44.071985 78.0 0.4 55.8 134.2 28.0 1.8 49.9 54.4 0.2 22.84 39.861986 72.7 0.3 49.9 122.9 31.2 2.8 42.2 46.8 0.2 34.84 59.601987 111.0 0.7 42.2 153.9 29.6 1.9 65.5 56.9 0.2 25.46 42.471988 84.3 2.7 65.5 152.5 15.4 1.8 48.9 86.5 0.4 28.29 45.59
1989 79.7 6.5 48.9 135.1 7.5 3.1 50.2 74.2 0.3 31.15 48.321990 93.6 1.0 50.2 144.8 9.9 2.9 65.0 67.0 0.3 31.73 47.471991 98.4 0.4 65.0 163.8 12.5 1.8 79.8 69.7 0.3 23.68 34.281992 57.7 0.2 79.8 137.7 10.8 1.9 50.7 74.3 0.3 25.80 36.521993 62.2 3.1 50.7 116.0 14.9 2.6 35.3 63.2 0.2 42.72 59.071994 84.2 0.3 35.3 119.8 9.5 3.2 33.5 73.6 0.3 40.18 54.401995 109.1 0.1 33.5 142.7 4.0 1.8 66.6 70.2 0.3 29.36 38.941996 56.7 1.0 66.6 124.3 6.6 2.4 46.0 69.3 0.3 32.57 42.421997 80.7 0.1 46.0 126.8 6.9 2.2 52.7 65.0 0.2 31.00 39.691998 65.3 0.0 52.7 118.0 17.4 4.1 36.0 60.5 0.2 37.52 47.53
1999 130.2 0.1 36.0 166.3 12.5 1.3 82.5 69.9 0.3 23.40 29.222000 38.2 0.1 82.5 120.9 9.7 1.8 46.8 62.5 0.2 25.95 31.692001 55.3 0.0 46.8 102.1 9.9 2.0 27.1 63.2 0.2 29.93 35.732002 54.3 0.8 27.1 82.2 7.3 2.9 19.2 52.9 0.2 34.48 40.542003 78.5 1.6 19.2 99.2 2.6 1.6 29.0 66.0 0.2 30.12 34.722004 38.4 0.0 29.0 67.4 2.1 1.3 26.7 37.4 0.1 31.28 35.092005 40.6 0.0 26.7 67.3 5.9 1.8 12.9 46.7 0.2 44.26 48.112006 53.3 10.0 12.9 76.2 2.3 1.6 22.9 49.4 0.2 47.38 49.972007 49.7 5.9 22.9 78.5 2.2 1.7 24.8 49.7 0.2 41.51 42.652008 39.4 3.4 24.8 67.7 2.2 2.8 6.6 56.1 0.2 51.97 52.37
2009 77.1 13.9 6.6 97.6 1.8 2.0 21.0 72.8 0.2 45.12 45.122010 58.5 0.3 21.0 79.8 5.9 2.1 19.1 52.7 0.2 42.47 41.962011 33.7 14.1 19.1 66.9 1.9 2.1 7.4 55.4 0.2 --- ---2012 54.6 43.1 7.4 105.1 56.3 2.4 22.9 23.5 0.1 54.75 52.062013 63.9 17.1 22.9 103.9 16.5 1.7 16.5 69.3 0.2 44.00 41.232014 p 43.3 3.5 16.5 63.3 6.5 2.4 15.6 38.8 0.1 70.00 64.65 -- = not available. R = revised. P = preliminary. 1/ Includes both fresh and processing beans. 2/ Source: USDA, NASS. 3/ Source: Bureau of the Census, U.S. Department of Commerce. 4/ Seed use is estimated by ERS based on acreage and estimated seeding rate per acre. 5/ Approximated from California's dry bean marketing pattern prior to 1990 and assumes no carryover into next crop year. After 1989, stocks data from the California Dry Bean Advisory Board. 6/ Dealer price, CA blackeyes as reported by Bean Market News, AMS, USDA. 7/ Constant dollar prices calculated using the GDP implicit price deflator, 2009=100.Source: USDA, Economic Research Service.

Vegetables and Pulses Yearbook Data /#89011/March 20, 2015Economic Research Service, USDA
Table 80--U.S. garbanzo beans, dry: Supply & utilization, farm weight, 1980-2014 1/
Supply Utilization Season-average price Year Per Current Constant
Production Imports Beginning Total Exports Seed Use Ending Domestic capita dollars 2009 2/ 3/ stocks 5/ 3/ 4/ stocks use 6/ dollars 7/
----------------------------------------------------- Million pounds ----------------------------------------------------- Pounds ------- $/ton --------
1980 6.7 28.2 2.0 36.9 0.0 0.5 3.9 32.5 0.1 -- --1981 5.0 28.6 3.9 37.5 0.0 0.6 3.2 33.8 0.1 -- --1982 6.0 20.4 3.2 29.6 0.0 0.4 3.4 25.7 0.1 -- --1983 4.7 30.5 3.4 38.6 2.8 0.2 2.9 32.7 0.1 -- --1984 1.9 26.6 2.9 31.4 6.2 0.4 1.1 23.7 0.1 -- --1985 3.9 21.1 1.1 26.1 6.1 0.5 2.5 17.1 0.1 -- --1986 4.8 25.6 2.5 32.9 6.9 0.9 2.8 22.4 0.1 -- --1987 9.2 27.1 2.8 39.1 8.9 0.3 5.4 24.4 0.1 -- --1988 4.8 29.2 5.4 39.4 3.8 0.2 2.8 32.7 0.1 -- --
1989 3.5 30.8 2.8 37.1 3.6 0.3 2.2 30.9 0.1 -- --1990 2.7 30.8 2.2 35.7 7.8 0.2 1.6 26.1 0.1 34.62 51.791991 2.6 34.9 1.6 39.1 9.4 1.3 1.5 26.9 0.1 39.83 57.671992 26.4 26.9 1.5 54.8 10.4 1.6 16.6 26.2 0.1 41.60 58.891993 30.1 24.1 16.6 70.8 4.9 1.2 16.9 47.8 0.2 32.44 44.851994 32.8 24.0 16.9 73.7 8.5 1.7 20.3 43.1 0.2 42.33 57.311995 47.3 22.4 20.3 90.0 22.2 2.4 29.8 35.6 0.1 46.19 61.251996 50.4 28.7 29.8 108.9 7.9 1.4 29.7 69.9 0.3 32.26 42.021997 39.2 31.2 29.7 100.1 7.8 1.6 24.0 66.6 0.2 33.97 43.501998 41.8 24.5 24.0 90.3 15.9 3.5 25.9 45.0 0.2 34.75 44.02
1999 77.8 25.9 25.9 129.6 28.7 6.6 49.8 44.5 0.2 30.15 37.652000 133.4 24.4 49.8 207.6 64.0 8.5 18.7 116.5 0.4 28.24 34.482001 161.2 21.6 18.7 201.5 51.0 4.9 44.2 101.3 0.4 21.95 26.202002 86.1 21.9 44.2 152.2 37.8 2.5 31.8 80.2 0.3 24.77 29.122003 41.7 20.5 31.8 94.0 23.0 2.6 18.4 50.0 0.2 29.66 34.192004 59.3 26.5 18.4 104.2 20.7 5.1 6.2 72.1 0.2 38.64 43.352005 106.1 20.3 6.2 132.6 31.0 7.8 8.3 85.5 0.3 39.47 42.912006 153.9 27.8 8.3 190.0 41.1 7.1 8.9 132.8 0.4 37.25 39.292007 151.5 31.5 8.9 191.8 43.7 4.8 8.6 134.8 0.4 43.86 45.062008 111.8 39.4 8.6 159.8 43.4 5.5 7.6 103.2 0.3 38.57 38.87
2009 144.4 47.2 7.6 199.2 53.7 8.3 19.7 117.5 0.4 39.18 39.182010 193.9 39.5 19.7 253.1 91.6 7.7 19.0 134.7 0.4 49.69 49.102011 220.2 40.3 19.0 279.5 127.4 11.9 9.1 131.1 0.4 58.42 56.612012 333.2 33.6 9.1 375.9 159.8 12.6 6.9 196.6 0.6 52.32 49.752013 355.9 50.5 6.9 413.3 114.2 12.5 17.2 269.3 0.9 40.72 38.152014 p 280.8 64.4 17.2 362.4 106.9 14.1 17.3 224.1 0.7 38.81 35.85 -- = not available. R = revised. P = preliminary. 1/ Includes both small and large sieve beans. 2/ Source: USDA, NASS. 3/ Source: Bureau of the Census, U.S. Department of Commerce. 4/ Seed use is estimated by ERS based on acreage and estimated seeding rate per acre. 5/ Approximated from California's dry bean marketing pattern prior to 1999 and assumes no carryover into next crop year. After 1999, stocks data from the California Dry Bean Advisory Board. 6/ Dealer price, CA garbanzos as reported by Bean Market News, AMS, USDA. 7/ Constant dollar prices calculated using the GDP implicit price deflator, 2009=100.Source: USDA, Economic Research Service.
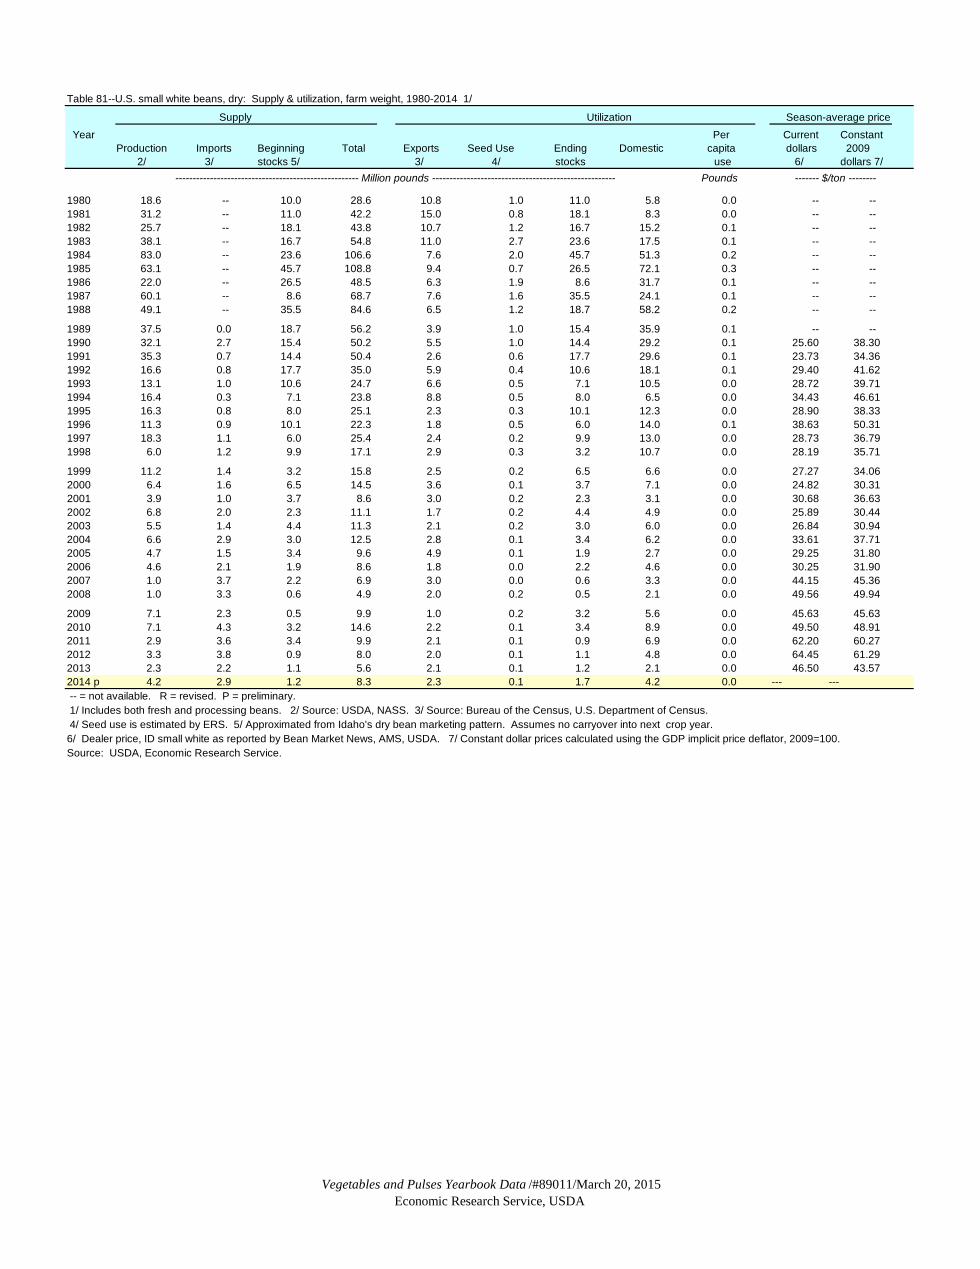
Vegetables and Pulses Yearbook Data /#89011/March 20, 2015Economic Research Service, USDA
Table 81--U.S. small white beans, dry: Supply & utilization, farm weight, 1980-2014 1/
Supply Utilization Season-average price Year Per Current Constant
Production Imports Beginning Total Exports Seed Use Ending Domestic capita dollars 2009 2/ 3/ stocks 5/ 3/ 4/ stocks use 6/ dollars 7/
----------------------------------------------------- Million pounds ----------------------------------------------------- Pounds ------- $/ton --------
1980 18.6 -- 10.0 28.6 10.8 1.0 11.0 5.8 0.0 -- --1981 31.2 -- 11.0 42.2 15.0 0.8 18.1 8.3 0.0 -- --1982 25.7 -- 18.1 43.8 10.7 1.2 16.7 15.2 0.1 -- --1983 38.1 -- 16.7 54.8 11.0 2.7 23.6 17.5 0.1 -- --1984 83.0 -- 23.6 106.6 7.6 2.0 45.7 51.3 0.2 -- --1985 63.1 -- 45.7 108.8 9.4 0.7 26.5 72.1 0.3 -- --1986 22.0 -- 26.5 48.5 6.3 1.9 8.6 31.7 0.1 -- --1987 60.1 -- 8.6 68.7 7.6 1.6 35.5 24.1 0.1 -- --1988 49.1 -- 35.5 84.6 6.5 1.2 18.7 58.2 0.2 -- --
1989 37.5 0.0 18.7 56.2 3.9 1.0 15.4 35.9 0.1 -- --1990 32.1 2.7 15.4 50.2 5.5 1.0 14.4 29.2 0.1 25.60 38.301991 35.3 0.7 14.4 50.4 2.6 0.6 17.7 29.6 0.1 23.73 34.361992 16.6 0.8 17.7 35.0 5.9 0.4 10.6 18.1 0.1 29.40 41.621993 13.1 1.0 10.6 24.7 6.6 0.5 7.1 10.5 0.0 28.72 39.711994 16.4 0.3 7.1 23.8 8.8 0.5 8.0 6.5 0.0 34.43 46.611995 16.3 0.8 8.0 25.1 2.3 0.3 10.1 12.3 0.0 28.90 38.331996 11.3 0.9 10.1 22.3 1.8 0.5 6.0 14.0 0.1 38.63 50.311997 18.3 1.1 6.0 25.4 2.4 0.2 9.9 13.0 0.0 28.73 36.791998 6.0 1.2 9.9 17.1 2.9 0.3 3.2 10.7 0.0 28.19 35.71
1999 11.2 1.4 3.2 15.8 2.5 0.2 6.5 6.6 0.0 27.27 34.062000 6.4 1.6 6.5 14.5 3.6 0.1 3.7 7.1 0.0 24.82 30.312001 3.9 1.0 3.7 8.6 3.0 0.2 2.3 3.1 0.0 30.68 36.632002 6.8 2.0 2.3 11.1 1.7 0.2 4.4 4.9 0.0 25.89 30.442003 5.5 1.4 4.4 11.3 2.1 0.2 3.0 6.0 0.0 26.84 30.942004 6.6 2.9 3.0 12.5 2.8 0.1 3.4 6.2 0.0 33.61 37.712005 4.7 1.5 3.4 9.6 4.9 0.1 1.9 2.7 0.0 29.25 31.802006 4.6 2.1 1.9 8.6 1.8 0.0 2.2 4.6 0.0 30.25 31.902007 1.0 3.7 2.2 6.9 3.0 0.0 0.6 3.3 0.0 44.15 45.362008 1.0 3.3 0.6 4.9 2.0 0.2 0.5 2.1 0.0 49.56 49.94
2009 7.1 2.3 0.5 9.9 1.0 0.2 3.2 5.6 0.0 45.63 45.632010 7.1 4.3 3.2 14.6 2.2 0.1 3.4 8.9 0.0 49.50 48.912011 2.9 3.6 3.4 9.9 2.1 0.1 0.9 6.9 0.0 62.20 60.272012 3.3 3.8 0.9 8.0 2.0 0.1 1.1 4.8 0.0 64.45 61.292013 2.3 2.2 1.1 5.6 2.1 0.1 1.2 2.1 0.0 46.50 43.572014 p 4.2 2.9 1.2 8.3 2.3 0.1 1.7 4.2 0.0 --- --- -- = not available. R = revised. P = preliminary. 1/ Includes both fresh and processing beans. 2/ Source: USDA, NASS. 3/ Source: Bureau of the Census, U.S. Department of Census. 4/ Seed use is estimated by ERS. 5/ Approximated from Idaho's dry bean marketing pattern. Assumes no carryover into next crop year. 6/ Dealer price, ID small white as reported by Bean Market News, AMS, USDA. 7/ Constant dollar prices calculated using the GDP implicit price deflator, 2009=100.Source: USDA, Economic Research Service.
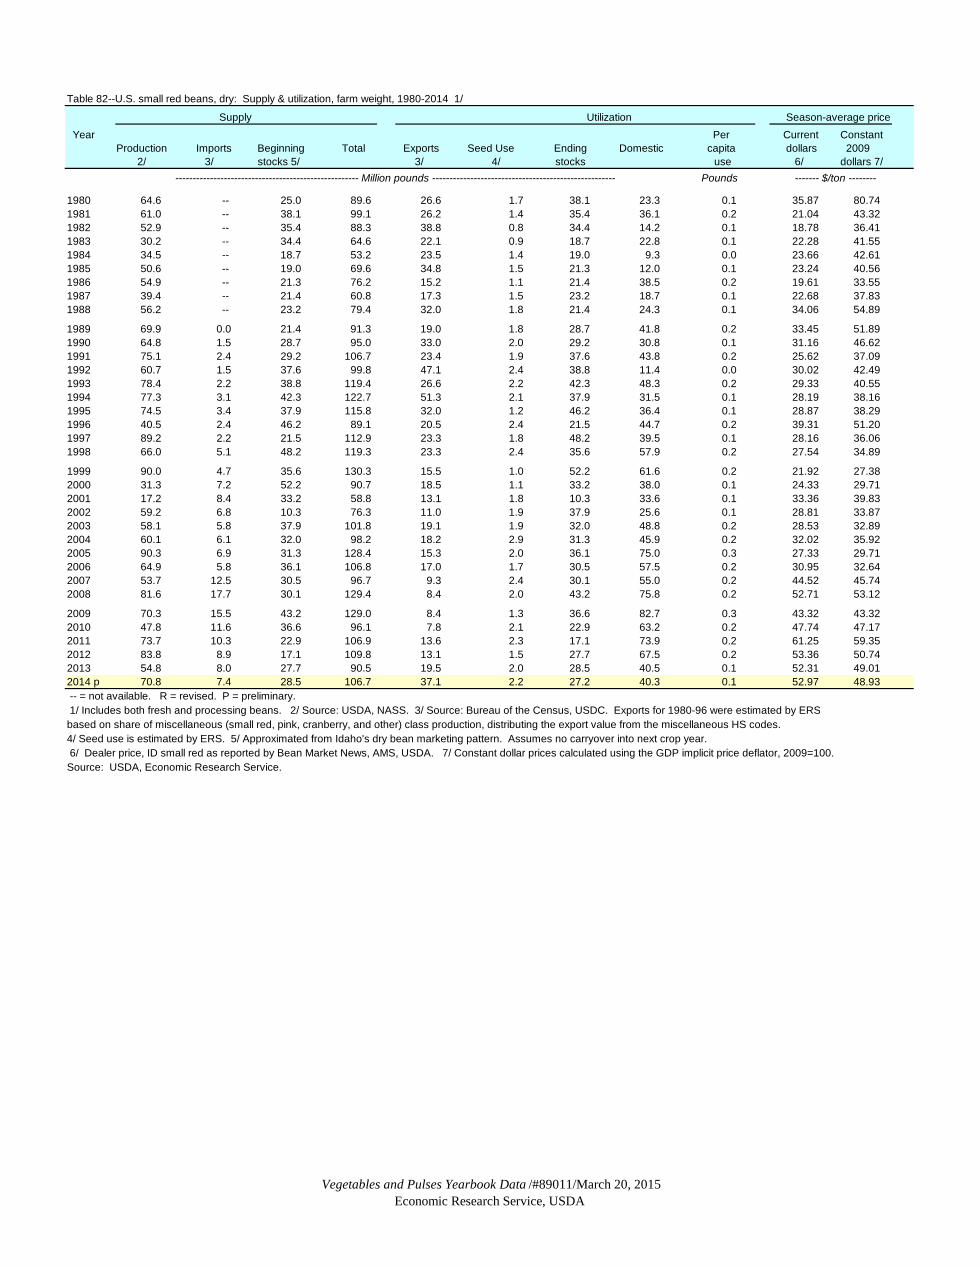
Vegetables and Pulses Yearbook Data /#89011/March 20, 2015Economic Research Service, USDA
Table 82--U.S. small red beans, dry: Supply & utilization, farm weight, 1980-2014 1/
Supply Utilization Season-average price Year Per Current Constant
Production Imports Beginning Total Exports Seed Use Ending Domestic capita dollars 2009 2/ 3/ stocks 5/ 3/ 4/ stocks use 6/ dollars 7/
----------------------------------------------------- Million pounds ----------------------------------------------------- Pounds ------- $/ton --------
1980 64.6 -- 25.0 89.6 26.6 1.7 38.1 23.3 0.1 35.87 80.741981 61.0 -- 38.1 99.1 26.2 1.4 35.4 36.1 0.2 21.04 43.321982 52.9 -- 35.4 88.3 38.8 0.8 34.4 14.2 0.1 18.78 36.411983 30.2 -- 34.4 64.6 22.1 0.9 18.7 22.8 0.1 22.28 41.551984 34.5 -- 18.7 53.2 23.5 1.4 19.0 9.3 0.0 23.66 42.611985 50.6 -- 19.0 69.6 34.8 1.5 21.3 12.0 0.1 23.24 40.561986 54.9 -- 21.3 76.2 15.2 1.1 21.4 38.5 0.2 19.61 33.551987 39.4 -- 21.4 60.8 17.3 1.5 23.2 18.7 0.1 22.68 37.831988 56.2 -- 23.2 79.4 32.0 1.8 21.4 24.3 0.1 34.06 54.89
1989 69.9 0.0 21.4 91.3 19.0 1.8 28.7 41.8 0.2 33.45 51.891990 64.8 1.5 28.7 95.0 33.0 2.0 29.2 30.8 0.1 31.16 46.621991 75.1 2.4 29.2 106.7 23.4 1.9 37.6 43.8 0.2 25.62 37.091992 60.7 1.5 37.6 99.8 47.1 2.4 38.8 11.4 0.0 30.02 42.491993 78.4 2.2 38.8 119.4 26.6 2.2 42.3 48.3 0.2 29.33 40.551994 77.3 3.1 42.3 122.7 51.3 2.1 37.9 31.5 0.1 28.19 38.161995 74.5 3.4 37.9 115.8 32.0 1.2 46.2 36.4 0.1 28.87 38.291996 40.5 2.4 46.2 89.1 20.5 2.4 21.5 44.7 0.2 39.31 51.201997 89.2 2.2 21.5 112.9 23.3 1.8 48.2 39.5 0.1 28.16 36.061998 66.0 5.1 48.2 119.3 23.3 2.4 35.6 57.9 0.2 27.54 34.89
1999 90.0 4.7 35.6 130.3 15.5 1.0 52.2 61.6 0.2 21.92 27.382000 31.3 7.2 52.2 90.7 18.5 1.1 33.2 38.0 0.1 24.33 29.712001 17.2 8.4 33.2 58.8 13.1 1.8 10.3 33.6 0.1 33.36 39.832002 59.2 6.8 10.3 76.3 11.0 1.9 37.9 25.6 0.1 28.81 33.872003 58.1 5.8 37.9 101.8 19.1 1.9 32.0 48.8 0.2 28.53 32.892004 60.1 6.1 32.0 98.2 18.2 2.9 31.3 45.9 0.2 32.02 35.922005 90.3 6.9 31.3 128.4 15.3 2.0 36.1 75.0 0.3 27.33 29.712006 64.9 5.8 36.1 106.8 17.0 1.7 30.5 57.5 0.2 30.95 32.642007 53.7 12.5 30.5 96.7 9.3 2.4 30.1 55.0 0.2 44.52 45.742008 81.6 17.7 30.1 129.4 8.4 2.0 43.2 75.8 0.2 52.71 53.12
2009 70.3 15.5 43.2 129.0 8.4 1.3 36.6 82.7 0.3 43.32 43.322010 47.8 11.6 36.6 96.1 7.8 2.1 22.9 63.2 0.2 47.74 47.172011 73.7 10.3 22.9 106.9 13.6 2.3 17.1 73.9 0.2 61.25 59.352012 83.8 8.9 17.1 109.8 13.1 1.5 27.7 67.5 0.2 53.36 50.742013 54.8 8.0 27.7 90.5 19.5 2.0 28.5 40.5 0.1 52.31 49.012014 p 70.8 7.4 28.5 106.7 37.1 2.2 27.2 40.3 0.1 52.97 48.93 -- = not available. R = revised. P = preliminary. 1/ Includes both fresh and processing beans. 2/ Source: USDA, NASS. 3/ Source: Bureau of the Census, USDC. Exports for 1980-96 were estimated by ERSbased on share of miscellaneous (small red, pink, cranberry, and other) class production, distributing the export value from the miscellaneous HS codes. 4/ Seed use is estimated by ERS. 5/ Approximated from Idaho's dry bean marketing pattern. Assumes no carryover into next crop year. 6/ Dealer price, ID small red as reported by Bean Market News, AMS, USDA. 7/ Constant dollar prices calculated using the GDP implicit price deflator, 2009=100.Source: USDA, Economic Research Service.

Vegetables and Pulses Yearbook Data /#89011/March 20, 2015Economic Research Service, USDA
Table 83--U.S. pink beans, dry: Supply& utilization, farm weight, 1980-2014 1/
Supply Utilization Season-average price Year Per Current Constant
Production Imports Beginning Total Exports Seed Use Ending Domestic capita dollars 2009 2/ 3/ stocks 5/ 3/ 4/ stocks use 6/ dollars 7/
----------------------------------------------------- Million pounds ----------------------------------------------------- Pounds ------- $/ton --------
1980 175.0 -- 50.0 225.0 71.9 6.0 103.3 43.8 0.2 33.79 76.061981 194.1 -- 103.3 297.4 83.4 2.7 122.3 88.9 0.4 18.03 37.121982 88.0 -- 122.3 210.3 74.6 2.0 57.2 76.5 0.3 16.96 32.881983 63.9 -- 57.2 121.1 46.8 2.6 39.6 32.1 0.1 21.63 40.341984 84.1 -- 39.6 123.7 62.4 2.5 46.3 12.6 0.1 20.91 37.661985 81.6 -- 46.3 127.9 66.1 3.8 34.3 23.6 0.1 22.93 40.021986 124.8 -- 34.3 159.1 34.5 2.6 48.7 73.4 0.3 18.88 32.301987 82.9 -- 48.7 131.6 36.4 1.8 48.9 44.5 0.2 19.70 32.861988 61.2 -- 48.9 110.1 34.8 3.6 23.3 48.4 0.2 35.03 56.46
1989 123.5 -- 23.3 146.8 74.8 3.7 50.6 17.6 0.1 35.16 54.551990 119.5 -- 50.6 170.1 50.0 2.3 53.8 64.1 0.3 23.16 34.651991 82.2 -- 53.8 136.0 37.2 1.9 41.1 55.8 0.2 20.55 29.751992 60.9 -- 41.1 102.0 18.1 2.8 39.0 42.1 0.2 27.21 38.521993 79.1 -- 39.0 118.1 25.4 2.4 42.7 47.5 0.2 28.53 39.451994 81.5 -- 42.7 124.2 25.7 2.2 39.9 56.4 0.2 26.25 35.541995 65.2 -- 39.9 105.1 16.0 1.8 40.4 47.0 0.2 28.19 37.381996 52.8 -- 40.4 93.2 24.0 2.2 28.0 39.1 0.1 32.02 41.701997 69.9 -- 28.0 97.9 1.6 3.1 37.7 55.4 0.2 28.70 36.751998 91.9 -- 37.7 129.6 19.0 2.9 49.6 58.1 0.2 27.14 34.38
1999 81.5 -- 49.6 131.1 5.8 1.0 47.3 77.1 0.3 21.78 27.202000 32.0 -- 47.3 79.3 16.5 1.1 18.6 43.1 0.2 23.71 28.952001 32.6 -- 18.6 51.2 2.8 2.0 19.6 26.8 0.1 32.83 39.192002 59.6 -- 19.6 79.2 3.8 1.9 38.1 35.3 0.1 28.33 33.312003 61.2 -- 38.1 99.3 0.9 1.7 33.7 63.1 0.2 28.29 32.612004 52.1 -- 33.7 85.8 1.0 2.2 27.1 55.5 0.2 32.07 35.982005 66.2 -- 27.1 93.3 3.3 2.6 26.5 61.0 0.2 27.50 29.892006 73.1 -- 26.5 99.6 5.3 1.8 34.4 58.2 0.2 30.24 31.892007 57.8 -- 34.4 92.2 3.6 1.7 32.4 54.4 0.2 36.89 37.902008 55.7 -- 32.4 88.1 2.9 1.6 29.5 54.1 0.2 50.01 50.39
2009 49.7 -- 29.5 79.2 3.1 1.9 22.4 51.9 0.2 43.74 43.742010 58.6 -- 22.4 81.0 3.5 1.2 28.1 48.1 0.2 43.56 43.042011 40.8 -- 28.1 68.9 1.9 1.7 12.2 53.1 0.2 62.12 60.192012 61.2 -- 12.2 73.4 3.0 1.3 20.2 48.9 0.2 53.80 51.162013 47.6 -- 20.2 67.8 2.9 1.4 24.8 38.7 0.1 53.52 50.152014 p 36.6 -- 24.8 61.4 2.5 1.7 14.9 42.2 0.1 45.19 41.74 -- = not available. R = revised. P = preliminary. 1/ Calendar year basis. Includes both fresh and processing beans. 2/ Source: USDA, NASS. 3/ Source: Bureau of the Census, U.S. Department of Commerce. Exports for 1980-96 were estimated by ERS based on share of miscellaneous (small red, pink, cranberry, and other) class production, distributing the export value from the miscellaneous HS codes. 4/ Seed use is estimated by ERS. 5/ Dec 31 stocks approximated from Idaho's dry bean marketing pattern. Assumes no carryover into next crop year (due to data limitations). 6/ Dealer price, ID pink beans as reported by Bean Market News, AMS, USDA. 7/ Constant dollar prices calculated using the GDP implicit price deflator, 2009=100.Source: USDA, Economic Research Service.

Vegetables and Pulses Yearbook Data /#89011/March 20, 2015Economic Research Service, USDA
Table 84--U.S. other beans, dry: Supply & utilization, farm weight, 1980-2014 1/
Supply Utilization Season-average price Year Per Current Constant
Production Imports Beginning Total Exports Seed Use Ending Domestic capita dollars 2009 2/ 3/ stocks 5/ 3/ 4/ stocks use 6/ dollars 7/
----------------------------------------------------- Million pounds ----------------------------------------------------- Pounds ------- $/ton --------
1980 46.8 15.3 174.0 220.8 28.9 8.9 69.5 113.5 0.5 27.60 62.131981 72.4 43.3 69.5 141.9 41.4 11.6 61.1 27.8 0.1 21.00 43.231982 92.1 21.8 61.1 153.2 83.9 6.2 48.7 14.3 0.1 14.20 27.531983 33.3 17.3 48.7 82.0 42.4 5.4 17.3 16.9 0.1 22.40 41.771984 32.3 29.1 17.3 49.6 25.2 5.3 16.9 2.3 0.0 18.70 33.681985 41.8 35.7 16.9 58.7 30.2 6.0 18.8 3.7 0.0 17.60 30.711986 47.7 19.8 18.8 66.5 16.9 2.3 18.2 29.1 0.1 19.10 32.671987 65.6 23.2 18.2 83.8 36.1 2.4 35.9 9.3 0.0 16.50 27.521988 68.5 30.5 35.9 104.4 44.1 3.3 29.0 28.0 0.1 29.90 48.19
1989 87.6 44.1 29.0 160.7 80.0 6.6 33.6 40.5 0.2 28.50 44.211990 139.1 29.4 33.6 202.1 95.4 4.3 65.1 37.3 0.1 18.50 27.681991 113.2 24.5 65.1 202.8 102.2 2.3 57.1 41.3 0.2 15.60 22.591992 57.1 21.5 57.1 135.6 42.7 2.7 25.8 64.5 0.3 19.90 28.171993 50.6 18.8 25.8 95.1 52.7 3.0 21.7 17.7 0.1 24.60 34.011994 70.2 27.1 21.7 118.9 55.9 3.6 27.4 32.0 0.1 22.50 30.461995 79.8 31.8 27.4 139.0 46.7 2.4 47.0 42.9 0.2 20.80 27.581996 57.2 30.1 47.0 134.3 67.2 2.6 44.5 20.0 0.1 23.50 30.611997 69.0 36.5 44.5 150.1 101.4 3.4 40.9 4.5 0.0 19.30 24.711998 69.9 33.6 40.9 144.4 103.9 4.6 32.3 3.6 0.0 19.00 24.07
1999 120.3 55.8 32.3 208.4 133.1 4.1 49.1 22.1 0.1 16.40 20.482000 96.2 48.8 49.1 194.1 86.5 3.3 44.5 59.7 0.2 15.50 18.932001 73.6 63.6 44.5 181.7 77.2 3.7 32.5 68.2 0.2 22.10 26.382002 86.0 100.7 32.5 219.2 57.7 3.5 41.8 116.2 0.4 17.10 20.102003 77.2 89.0 41.8 208.0 49.2 2.5 36.2 120.1 0.4 18.40 21.212004 60.7 100.8 36.2 197.7 46.7 2.5 24.6 123.8 0.4 25.70 28.832005 65.4 123.5 24.6 213.5 65.9 2.3 26.4 119.0 0.4 18.50 20.112006 63.2 106.8 26.4 196.5 73.1 2.0 29.5 91.9 0.3 22.10 23.312007 57.1 113.4 29.5 200.0 80.6 2.2 24.2 93.1 0.3 28.80 29.592008 64.1 122.7 24.2 211.0 106.8 3.4 23.7 77.1 0.3 34.60 34.87
2009 103.3 119.6 23.7 246.6 84.2 2.9 44.2 115.2 0.4 30.00 30.002010 93.0 144.9 44.2 282.1 68.1 2.9 43.6 167.5 0.5 28.00 27.662011 87.3 138.5 43.6 269.4 51.5 2.7 32.8 182.3 0.6 42.10 40.792012 85.8 121.4 32.8 240.0 92.4 3.6 33.5 110.6 0.4 38.00 36.132013 130.3 103.0 33.5 266.8 93.3 4.2 44.3 125.0 0.4 39.10 36.632014 p 131.4 137.3 44.3 313.0 97.9 4.0 48.4 162.7 0.5 34.50 31.87 -- = not available. R = revised. P = preliminary. 1/ Includes both fresh and processing beans. 2/ Source: USDA, NASS. Bean classes included vary depending on whether each class is included in it's own S&U. 3/ Source: Bureau of the Census, U.S. Department of Census. In 2010, 6 mil lbs of exports were moved from cranberry beans to misc beans. 4/ Seed use is estimated by ERS. 5/ Approximated from United States dry bean marketing pattern. Assumes no carryover into the following crop year. 6/ Season-average grower price for all classesas reported by NASS, USDA. 7/ Constant dollar prices calculated using the GDP implicit price deflator, 2009=100.Source: USDA, Economic Research Service.