vctc us-101 cc draft final report 113020- ver1
TRANSCRIPT

10419 | Prepared by Iteris, Inc.
This study was prepared with financial support from the Caltrans Sustainable Transportation Planning Grant Program.
STUDY REPORT December 4, 2020
Prepared for

VCTC US 101 Communities Connected Study | i
TABLE OF CONTENTS 1 Introduction .......................................................................................................................................................................................... 1
1.1. Project Overview and Purpose and Corridor Plan Guidelines .......................................................................................................................................... 3 1.1.1. Corridor Definition ......................................................................................................................................................................................................... 3
1.1.2. Study Purpose ................................................................................................................................................................................................................ 3
1.1.3. Corridor Plan Guidelines ................................................................................................................................................................................................ 3
1.2. Statewide Goals and Requirements, Ventura County Transportation Plans, and Sustainability Initiatives Overview .................................................... 4 1.3. US 101 Communities Connected Goals, Guiding Principles ............................................................................................................................................. 5 1.4. US 101 Communities Connected Process ......................................................................................................................................................................... 6
2 EXISTING CONDITIONS ........................................................................................................................................................................... 7 2.1. Land Use and Demographics ............................................................................................................................................................................................ 7 2.1.1. Development ................................................................................................................................................................................................................. 8
2.1.2. Open Space and Agriculture .......................................................................................................................................................................................... 8
2.1.3. Primary Land Uses ......................................................................................................................................................................................................... 9
2.1.4. Population and Employment ....................................................................................................................................................................................... 12
2.1.5. Disadvantaged Communities ....................................................................................................................................................................................... 15
2.2. Travel Market ................................................................................................................................................................................................................. 15 2.2.1. Commute Mode Choice ............................................................................................................................................................................................... 15
2.2.2. Commute Time ............................................................................................................................................................................................................ 16
2.2.3. Travel Patterns ............................................................................................................................................................................................................. 17
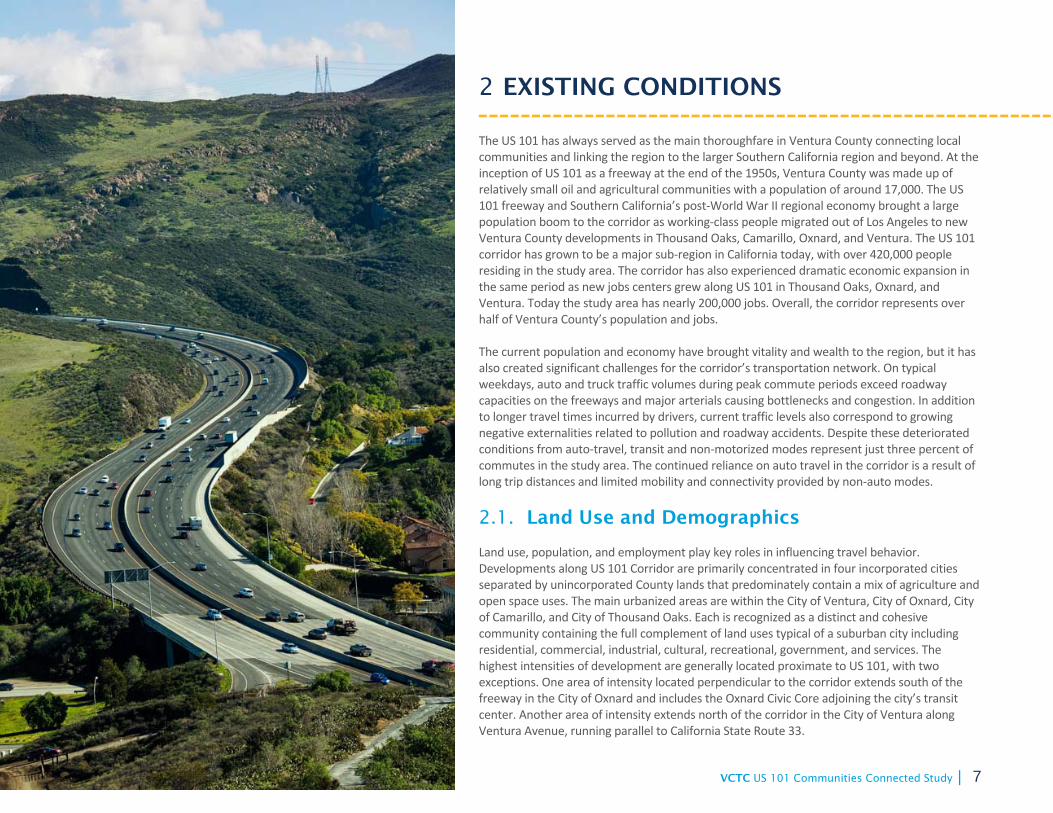
2.3. Freeway .......................................................................................................................................................................................................................... 18 2.4. Arterial/Local Streets ...................................................................................................................................................................................................... 22 2.4.1. Arterials with Highest Daily Volumes .......................................................................................................................................................................... 22
2.5. Transit and Active Transportation .................................................................................................................................................................................. 23 2.5.1. Transit and Rail ............................................................................................................................................................................................................ 24
2.5.2. Active Transportation .................................................................................................................................................................................................. 26
2.6. Safety .............................................................................................................................................................................................................................. 28 2.6.1. Study Area Collisions ................................................................................................................................................................................................... 29
2.6.2. US 101 Freeway ........................................................................................................................................................................................................... 29
2.6.3. Corridor Arterials ......................................................................................................................................................................................................... 29

VCTC US 101 Communities Connected Study | ii
2.6.4. Pedestrian and Bike Collision Locations ...................................................................................................................................................................... 30
2.7. Existing Challenges ......................................................................................................................................................................................................... 31 3 FUTURE CONDITIONS ........................................................................................................................................................................... 32
3.1. Land Use Demographics ................................................................................................................................................................................................. 32 3.1.1. Potential Areas of Future Land Use Intensification ..................................................................................................................................................... 32
3.1.2. Efficient Land Use Indicators ....................................................................................................................................................................................... 34
3.1.3. Population and Employment ....................................................................................................................................................................................... 34
3.2. Travel Market ................................................................................................................................................................................................................. 36 3.3. Freeway and Arterials/Local Streets ............................................................................................................................................................................... 37 3.3.1. Freeway ....................................................................................................................................................................................................................... 38
3.3.2. Arterial/Local Streets ................................................................................................................................................................................................... 38
3.4. Transit and Active Transportation .................................................................................................................................................................................. 39 3.4.1. Transit and Rail ............................................................................................................................................................................................................ 39
3.4.2. Active Transportation .................................................................................................................................................................................................. 40
3.4.3. Transportation Safety .................................................................................................................................................................................................. 41
3.5. Future Challenges ........................................................................................................................................................................................................... 42 4 PROJECTS AND PROGRAMS .................................................................................................................................................................. 43
4.1. Project and Program List Sources ................................................................................................................................................................................... 44 4.2. Project and Program List Categorization ........................................................................................................................................................................ 44 4.2.1. Funded Roadway Projects and Programs .................................................................................................................................................................... 45
4.2.2. Funded Non‐Roadway Projects and Programs ............................................................................................................................................................ 45
4.2.3. Unfunded Roadway Projects and Programs ................................................................................................................................................................ 47
4.2.4. Unfunded Non‐Roadway Projects and Programs ........................................................................................................................................................ 48
5 PUBLIC OUTREACH .............................................................................................................................................................................. 50 5.1. Community Contact Database ........................................................................................................................................................................................ 50 5.2. Digital Outreach .............................................................................................................................................................................................................. 51 5.3. Webpage ........................................................................................................................................................................................................................ 51 5.4. Digital Campaigns ........................................................................................................................................................................................................... 51 5.5. Online Survey Tool .......................................................................................................................................................................................................... 51 5.6. Public Workshops ........................................................................................................................................................................................................... 51 5.6.1. Outreach Phase 1 ......................................................................................................................................................................................................... 52
5.6.2. Public Comments Summary ......................................................................................................................................................................................... 52

VCTC US 101 Communities Connected Study | iii
5.6.3. Outreach Phase 2 ‐ Online Workshops ........................................................................................................................................................................ 53
5.7. Study Response to Comments ........................................................................................................................................................................................ 53 6 PERFORMANCE EVALUATION FRAMEWORK ........................................................................................................................................... 54
6.1. Project and Program Evaluation Methodology .............................................................................................................................................................. 55 6.2. Results ............................................................................................................................................................................................................................ 56 6.3. Goal Areas ...................................................................................................................................................................................................................... 57 6.4. Total Project Score and Communities Connected Index ................................................................................................................................................ 58 6.5. Scenario Analysis ............................................................................................................................................................................................................ 66 6.6. US 101 Communities Connected Plan Performance Results .......................................................................................................................................... 67
7 FUNDING SOURCES .............................................................................................................................................................................. 68 7.1. Federal Funding Sources ................................................................................................................................................................................................ 68 7.2. State Funding Sources .................................................................................................................................................................................................... 69 7.3. Local Funding Sources .................................................................................................................................................................................................... 70
8 Moving Forward................................................................................................................................................................................... 71 8.1. A Flexible Framework ..................................................................................................................................................................................................... 71 8.2. COVID‐19 Response ........................................................................................................................................................................................................ 72 8.3. New Baseline and Future ................................................................................................................................................................................................ 72 8.3.1. Decline in Commutes ................................................................................................................................................................................................... 72
8.3.2. Other Shifts in Travel Demand .................................................................................................................................................................................... 73
8.3.3. New Mode Choice ....................................................................................................................................................................................................... 73
8.3.4. Socioeconomic Factors ................................................................................................................................................................................................ 73
8.3.5. Adapting Framework ................................................................................................................................................................................................... 74
8.3.6. Alternate 2040 Future ................................................................................................................................................................................................. 75
8.4. Monitoring and Evaluating Progress .............................................................................................................................................................................. 76 8.5. Upcoming Activities and Funding Applications .............................................................................................................................................................. 78 8.5.1. Future Planning Activities ............................................................................................................................................................................................ 78
8.5.2. Next Steps in SB‐1 Funding Applications ..................................................................................................................................................................... 78
Tables Table 1 – Existing Land Use, Study Area ................................................................................................................................................................................................. 9 Table 2 – Existing Land Use within the Study Area by Jurisdiction ....................................................................................................................................................... 11 Table 3 – Existing Population, Household, and Employment Within the Study Area .......................................................................................................................... 12 Table 4 – Existing Population to Employment and Household to Employment Ratios Within the Study Area ................................................................................... 12

VCTC US 101 Communities Connected Study | iv
Table 5 – Mode Share by City ............................................................................................................................................................................................................... 16 Table 6 – Journey‐to‐Work Travel Times (minutes) by City .................................................................................................................................................................. 16 Table 7 – Daily Flow / Travel Patterns Within Study Area .................................................................................................................................................................... 17 Table 8 – County‐to‐County Commuting Flows for Workers Living in Ventura County. ...................................................................................................................... 17 Table 9 – County‐to‐County Commuting Flows for Workers Working in Ventura County ................................................................................................................... 17 Table 10 – Service Provider Summary .................................................................................................................................................................................................. 24 Table 11 – Fixed Route Annual Ridership FY 2017 ............................................................................................................................................................................... 24 Table 12 – Bus Stops with Most Daily Boardings and Alightings .......................................................................................................................................................... 25 Table 13 – On‐Demand Annual Ridership FF 2017 ............................................................................................................................................................................... 25 Table 14 – Park & Ride Facilities ........................................................................................................................................................................................................... 26 Table 15 – Miles of Existing Bikeways (2012) ....................................................................................................................................................................................... 27 Table 16 – Type of Collision .................................................................................................................................................................................................................. 28 Table 17 – Injury Collisions ................................................................................................................................................................................................................... 28 Table 18 – Collision Types and Injuries ................................................................................................................................................................................................. 29 Table 19 – Existing and Future Population and Households ................................................................................................................................................................ 34 Table 20 – Existing and Employment and Employment Ratios ............................................................................................................................................................ 35 Table 21 – 2018 and 2040 Mode of Travel Within Study Area ............................................................................................................................................................. 36 Table 22 – 2040 Daily Flow / Travel Patterns Within Study Area ......................................................................................................................................................... 36 Table 23 – Existing and Future Lane Miles ........................................................................................................................................................................................... 37 Table 24 – Existing and Future Volumes ............................................................................................................................................................................................... 37 Table 25 – Existing and Future US 101 Volumes .................................................................................................................................................................................. 38 Table 26 – Existing and Future Arterial Volumes .................................................................................................................................................................................. 38 Table 27 – Growth in Miles of Future Bikeways (2012 to 2040) .......................................................................................................................................................... 41 Table 28 – Funded Roadway Projects Summary .................................................................................................................................................................................. 45 Table 29 – Funded Non‐Roadway Projects Summary .......................................................................................................................................................................... 46 Table 30 – Un‐funded Roadway Projects Summary ............................................................................................................................................................................. 47 Table 31 – Un‐funded Non‐Roadway Projects Summary ..................................................................................................................................................................... 48 Table 32 – Online Survey Results .......................................................................................................................................................................................................... 51 Table 33 – Goal Ranking Results from the Public Meetings ................................................................................................................................................................. 52 Table 34 – Comments Received from Public ........................................................................................................................................................................................ 52 Table 35 – Comments on US 101 Freeway ........................................................................................................................................................................................... 52 Table 36 – Comments on Transit .......................................................................................................................................................................................................... 53 Table 37 – Comments on ATP (Bike/Pedestrian) .................................................................................................................................................................................. 53 Table 38 – Comments Received from Public ........................................................................................................................................................................................ 53 Table 39 – Summary of Performance Measure Results ....................................................................................................................................................................... 56 Table 40 – Summary of Average Goal Area Results .............................................................................................................................................................................. 57 Table 41 – 2045 Scenario Comparison ................................................................................................................................................................................................. 67 Table 42 – Relevant Federal Funding Sources ...................................................................................................................................................................................... 69 Table 43 – Relevant State Funding Sources .......................................................................................................................................................................................... 69

VCTC US 101 Communities Connected Study | v
Table 44 – Relevant Local Funding Sources .......................................................................................................................................................................................... 70 Table 45 – Active Transi8portation and Transit Projects and Programs .............................................................................................................................................. 76 Table 46 – On‐going Perform Measure Monitoring ............................................................................................................................................................................. 77 Figures Figure 1 – Study Area .............................................................................................................................................................................................................................. 3 Figure 2 – Project Process and Approach ............................................................................................................................................................................................... 4 Figure 3 – Project Goals .......................................................................................................................................................................................................................... 5 Figure 4 – Existing Land Use Map, West ................................................................................................................................................................................................. 8 Figure 5 – Exiting Land Use Map, East .................................................................................................................................................................................................... 8 Figure 6 – SOAR Boundaries, Greenbelts, & Regional Wildlife Corridors ............................................................................................................................................... 9 Figure 7 – Existing Population Density Map by TAZ ............................................................................................................................................................................. 13 Figure 8 – Existing Employment Density Map by TAZ .......................................................................................................................................................................... 14 Figure 9 – Disadvantaged Communities (2018) .................................................................................................................................................................................... 15 Figure 10 – Average Mode Share in the Corridor ................................................................................................................................................................................. 16 Figure 11 – Journey‐to‐Work Travel Times (minutes) by City .............................................................................................................................................................. 16 Figure 12 – Existing Daily Auto Trips in and to/from the Corridor ....................................................................................................................................................... 17 Figure 13 – Typical Southbound US 101 AM Congestion Patterns and Hours of Delay (Speed <45 mph) ........................................................................................... 19 Figure 14 – AM Peak Period LOS (Demand/Capacity) .......................................................................................................................................................................... 19 Figure 15 – Typical Northbound US 101 PM Congestion Patterns and ............................................................................................................................................... 20 Figure 16 – PM Peak Period LOS (Demand/Capacity) .......................................................................................................................................................................... 20 Figure 17 – Recurring "Bottleneck" Locations ...................................................................................................................................................................................... 21 Figure 18 – CMP Network Capacity ...................................................................................................................................................................................................... 22 Figure 19 – CMP Network Level of Service (LOS) ................................................................................................................................................................................. 22 Figure 20 – Fixed‐Route Transit Service ............................................................................................................................................................................................... 24 Figure 21 – Fixed‐Route Transit Service Bus Stop Typical Weekday Boardings and Alightings ............................................................................................................ 25 Figure 22 – Metrolink and Amtrak Services .......................................................................................................................................................................................... 25 Figure 23 – Park and Ride ..................................................................................................................................................................................................................... 26 Figure 24 – Bikeway Facilities ............................................................................................................................................................................................................... 27 Figure 25 – Workers Commute by Bicycle ............................................................................................................................................................................................ 27 Figure 26 – Workers Commute by Walking .......................................................................................................................................................................................... 28 Figure 27 – US 101 Collisions ................................................................................................................................................................................................................ 29 Figure 28 – Arterial Collisions ............................................................................................................................................................................................................... 30 Figure 29 – Pedestrian Collisions .......................................................................................................................................................................................................... 30 Figure 30 – Bike Collisions .................................................................................................................................................................................................................... 30 Figure 30 – Potential Areas of Land Use Intensification, West ............................................................................................................................................................ 33 Figure 31 – Potential Areas of Land Use Intensification, East .............................................................................................................................................................. 33

VCTC US 101 Communities Connected Study | vi
Figure 32 – Future Population Density ................................................................................................................................................................................................. 34 Figure 33 – Future Employment Density .............................................................................................................................................................................................. 35 Figure 34 – Future Daily Auto Trips in and to/from the Corridor ......................................................................................................................................................... 36 Figure 35 – Future AM LOS on Freeways and Arterials ........................................................................................................................................................................ 37 Figure 36 – Future PM LOS on Freeways and Arterials ........................................................................................................................................................................ 38 Figure 37 – Future SCAG High Quality Transit Area (HQTA) ................................................................................................................................................................. 40 Figure 38 – Future Bikeway Facilities ................................................................................................................................................................................................... 41 Figure 31‐ Funded Roadway Projects ................................................................................................................................................................................................... 45 Figure 32 – Funded Non‐Roadway Projects ......................................................................................................................................................................................... 46 Figure 33 – Unfunded Roadway Projects ............................................................................................................................................................................................. 47 Figure 34 – Unfunded Non‐Roadway Projects...................................................................................................................................................................................... 49 Figure 35 – Communities Connected Website ..................................................................................................................................................................................... 51 Figure 36 – Communities Connected Goals & Performance Measures ............................................................................................................................................... 55 Figure 37 – Evaluation Process ............................................................................................................................................................................................................. 55 Figure 38 – Summary of Performance Measure Results ...................................................................................................................................................................... 56 Figure 39 – Summary of Average Goal Area Results ............................................................................................................................................................................ 57 Figure 40 – Project Communities Connected Index and Cost by Funding ............................................................................................................................................ 59 Figure 41 – Projects Communities Connected Index and Cost by Project Type ................................................................................................................................... 60 Figure 42 – Active Transportation Projects by Communities Connected Index and Cost .................................................................................................................... 62 Figure 43 – Arterial Projects by Communities Connected Index and Cost ........................................................................................................................................... 63 Figure 44 – Highway Projects by Communities Connected Index and Cost ......................................................................................................................................... 64 Figure 45 – Transit Projects by Communities Connected Index and Cost ............................................................................................................................................ 65 Figure 46 – Google Community Mobility Report for Ventura County .................................................................................................................................................. 72 Figure 47 – Ventura County Unemployment Rate ............................................................................................................................................................................... 74 Figure 48 – Ventura County Trips by Duration ..................................................................................................................................................................................... 75 Figure 49 – Ventura County Trips Less Than 10 Minutes by Mode ...................................................................................................................................................... 75

VCTC US 101 Communities Connected Study | 1
1 INTRODUCTION The US Highway 101 Corridor through Ventura County is the most important highway corridor in Ventura County, and its importance to Ventura County, the Southern California region, and California cannot be overstated. Stretching from the rolling hills of Thousand Oaks in the eastern portion of the County, down the Conejo Grade that divides east from west County, through the fertile agricultural plains and productive cities of Camarillo and Oxnard, westward to the Pacific Ocean at the scenic Ventura pier, US 101 connects diverse communities, serves businesses, and connects coastal California to the north, central, and south. The opening of US 101 helped to accelerate population and economic growth in the county at the beginning of the 1960s, and urban development within the corridor area defines modern day Ventura County. For residents, US 101 serves as both freeway and regional Main Street, carrying both longer‐distance auto trips and serving as a focal point for a string of regional business districts. Whether it’s a daily commute to and from work, early morning drive to surf before starting the day, shopping trip to the outlets or favorite grocery store, weekend trip to watch kids play a favorite sport, or getting together with extended family to celebrate a special occasion, the US 101 Corridor is firmly rooted in the lives of local residents. US 101 Corridor serves as a critical link for goods movement, carrying freight traffic through the county. For example, US 101, Union Pacific rail, and local arterials serve the commercial Port of Hueneme as a surface transportation connection to markets throughout Southern California and across the United States. Ventura County’s agricultural producers in the Oxnard Plain and Santa Clara River Valley access worldwide markets; biotechnology firms that send and receive ingredients and medicines in and out of their laboratories; and manufacturing firms that transport raw materials, goods, and finished products to and from factories all use the 101 Corridor. US 101 is the primary reliever road to Interstate 5, serving as a secondary option for the freight and other traffic traveling between Southern and Northern California. While I‐5 is the backbone of California’s statewide surface transportation network, when that critical connection is affected by severe weather, natural disasters such as wildfire, construction, or a major accident, particularly on the stretch of I‐5 known as the Grapevine between the Los Angeles area and the Central Valley, US 101 is the preferred alternate route. US 101 plays a strategic role in having a resilient state freeway network.

VCTC US 101 Communities Connected Study | 2
For California’s statewide and Central Coast regional tourism economy in Ventura, Santa Barbara, San Luis Obispo, and Monterey Counties, US 101 Corridor carries families and friends to enjoy the State’s beaches, wineries, and historic sites, the highway itself a scenic treasure as it passes through coastal mountains and along the coast. Many of Ventura County’s tourist destinations are located within the corridor including the Ventura Pier, San Buenaventura State Beach, San Buenaventura Mission, Historic Downtown Ventura, Camarillo Premium Outlets, and various open space hiking and bicycle trails. As part of the National Strategic Highway Network, US 101, Victoria Avenue, and Las Posas Road in the corridor also serve the National Defense. The highway and arterials provide ground transportation for U.S. Navy Seabees and their equipment to travel from Naval Base Ventura County (NBVC) Port Hueneme to field training areas at Fort Hunter Liggett in San Luis Obispo County. U.S. Marines travel via US 101 to NBVC Point Mugu and Port Hueneme for major training exercises from Camp Pendleton in San Diego County and beyond. US 101 provides an important link between unique and important military assets throughout California. The US 101 Corridor serves as a conduit between Ventura County workers and jobs. Half of all population and jobs in the county are concentrated in the corridor and workers travel across the corridor to reach jobs in the cities of Ventura, Oxnard, Camarillo, and Thousand Oaks. Tens of thousands of corridor residents working beyond the County boundaries commute daily on US 101 or take commuter trains between US 101 Corridor stations and Los Angeles (Union Station). The Metrolink/Amtrak commuter rail lines runs through the US 101 Corridor serving Ventura, San Luis Obispo, Los Angeles, Orange, Riverside, San Bernardino, and San Diego counties. The need for a shared vision and comprehensive plan for the US 101 Corridor is more important than ever considering the central role the US 101 Corridor plays in the vitality of Ventura County, the Southern California region, and the State. As the transportation landscape changes in the wake of a global pandemic and in the face of climate change, increased demand for housing, an emphasis on active, healthy lifestyles, and job creation and economic recovery, the traditional concept of roadway infrastructure focused on single occupant vehicles and congestion management is not sufficient to meet local, State, and national goals. 101 Communities Connected seeks to foster a resilient, sustainable, and efficient transportation future for Ventura County to meet the many and diverse needs of the communities served by US Highway 101. This multi‐modal corridor study
analyzes demographic and economic data, considers existing and future land use, and inventories planned transportation infrastructure projects throughout the US 101 Corridor. It provides a roadmap for collaboration across jurisdictions and development of funding priorities for future investments in infrastructure throughout the corridor to improve connectivity, reduce vehicle miles travelled, and better serve the residents, businesses, and visitors of Ventura County.

VCTC US 101 Communities Connected Study | 3
1.1. Project Overview and Purpose and Corridor Plan Guidelines
1.1.1. Corridor Definition
The study area for this project is shown in Figure 1. It generally includes an area three miles wide on either side of US 101 from SR 23 to SR 33, and includes all or parts of the cities of Ventura, Oxnard, Camarillo and Thousand Oaks, as well as parts of unincorporated communities in Ventura County. The significance of the corridor area is underlined by the fact that it encompasses approximately half of Ventura County’s overall population and employment.
Figure 1 – Study Area
The volume of traffic on US 101 in the project area varies from a high of just over 200,000 daily trips in Thousand Oaks near SR 23 in the east, to approximately 150,000 mid‐corridor in Camarillo, to a low of 72,000 west of SR 33 at the western end of the corridor. These varied traffic flows yield unique congestion patterns and operational issues from both the geographic and time of day standpoint. As a result, traffic congestion and recurrent delays are prevalent along the corridor and are forecasted to intensify in the future. 1.1.2. Study Purpose To understand the mobility issues facing the corridor, Southern California Association of Governments (SCAG), Ventura County Transportation Commission (VCTC) and the California Department of Transportation (Caltrans) initiated the US 101 Communities Connected study. US 101 Communities Connected assesses mobility challenges and opportunities with the ultimate goal to identify multimodal infrastructure improvements that strengthen mobility for everyone travelling in the US 101 Corridor – from drivers and bicyclists to pedestrians and transit riders – while balancing factors such as climate change, land use
development, social equity, and advanced technologies. US 101 Communities Connected serves as a transportation blueprint for future projects and programs within the corridor. The enhancement of mobility options along the corridor is vital to the continued economic health of the County. To fund corridor improvements, all sources for potential funding should be considered. One of the most promising potential sources is the Road Repair and Accountability Act of 2017, or Senate Bill (SB) 1. SB 1 created the Solutions for Congested Corridors Program (SCCP), which continuously appropriates two hundred and fifty million dollars ($250,000,000) annually to be allocated by the California Transportation Commission (CTC) to projects designed to achieve a balanced set of transportation, environmental, and community access improvements within highly congested travel corridors throughout the state. Beginning with the 2020 Program, all projects nominated for the SCCP must be included in a Multimodal Corridor Plan designed to reduce congestion by providing more transportation choices, while preserving the character of the local communities of Ventura, Oxnard, Camarillo and Thousand Oaks. The US 101 Communities Connected Study will serve as the roadmap for future multimodal corridor planning within the study area. 1.1.3. Corridor Plan Guidelines US 101 Communities Connected identifies a comprehensive list of proposed transportation improvement projects and evaluates those projects and programs in a multimodal context using the Caltrans Corridor Planning Guidebook and the CTC’s Comprehensive Multimodal Corridor Plan (CMCP) guidelines. This report provides an overview of existing and future conditions, public input, documentation of projects and programs, and multimodal evaluation of the projects. The report is organized as follows:
Existing and Future Conditions Review – Preparing a Multimodal Corridor Plan requires a keen understanding of existing and future land use patterns, travel markets and patterns, and the underlying multimodal transportation infrastructure in the study area. This analysis considers how existing and future users of transportation infrastructure and services will affect operation, maintenance, availability, and conditions of multimodal infrastructure.
Engage Public and Policy Makers – Public outreach and participation are key parts of the US 101 Communities Connected Study. Comprehensive public involvement is crucial to the success of the project. Through

VCTC US 101 Communities Connected Study | 4
interactive community workshops, digital engagement and targeted outreach, focused on disadvantaged communities, the outreach program accomplished the following goals:
o Help to educate the public about the US 101 Communities Connected study, including its purpose and the important role it will play in Ventura County’s transportation future.
o Solicit input from the public and stakeholders, including special needs populations and disadvantaged communities, on transportation needs and priorities in the US 101 Corridor.
Identify Planned Projects and Programs – A number of sources are reviewed to identify planned projects within the study area including, but not limited to, local agency Capital Improvement Programs (CIPs), the Federal Transportation Improvement Program (FTIP), 2020 SCAG Regional Transportation Plan/Sustainable Communities Strategy (RTP/SCS), and Short‐Range Transit Plans (SRTP), as well as coordination with local agencies to ensure an all‐encompassing list.
Evaluation Framework – A project evaluation framework is developed to determine how each project would perform relative to the goals and guiding principles; and how it would benefit the overall corridor performance.
In summary, US 101 Communities Connected involves careful consideration and analysis of a wide range of transportation‐related issues, including land use, personal mobility across all modes, social equity, and advanced technologies. The challenges of fostering an efficient and equitable transportation system create opportunities to take a fresh look at the US 101 Corridor and bring 21st century solutions to this historically complex transportation corridor. The overall process is illustrated in Figure 2.
Figure 2 – Project Process and Approach
1.2. Statewide Goals and Requirements, Ventura County Transportation Plans, and Sustainability Initiatives Overview
Signed into law in 2006, Assembly Bill 32 (AB 32) requires California to lower statewide Greenhouse Gas (GHG) emissions to 1990 levels by 2020. Passed in 2008, Senate Bill 375 (SB 375) supports the implementation of AB 32 by encouraging planning practices that create sustainable communities. SB 375 also charged the California Air Resources Board (CARB) with setting regional targets for reducing GHG emissions by 2020 and by 2035. It also calls for California Metropolitan Planning Organizations (MPOs), such as SCAG, to prepare a Regional Transportation Plan / Sustainable Communities Strategy (RTP/SCS). The RTP/SCS must show how the region will meet its goals for reducing GHG emissions from automobiles and light trucks. By many metrics, progress has been made toward meeting these ambitious goals. The multimodal transportation network has been expanded by adding bike lanes, investing in transit, and completing mobility and safety projects. Much needed revenue to continue this expansion is being provided with passage of SB 1, a funding bill that generates $52 billion statewide over the next ten years. However, the continuation of the historical trend of population and job growth, falling transit ridership despite investment in transit, and rise in traffic collisions are challenging the progress. Ventura County adopted a Comprehensive Transportation Plan (CTP) in 2013 to preserve and enhance the special quality of life enjoyed in Ventura County by residents, businesses and visitors through a transportation system that supports State goals and objectives. The CTP defines the overarching “Shared Vision” as:
“A connected and integrated transportation system that provides convenient, safe and accessible options. This system is inclusive of all community members and needs, balancing all interests. It is intended to be built from a sustainable plan that reflects local priorities.”
Comprehensive Transportation Plan Goals
Preserve Quality of Life Connected and Integrated Transportation System Convenient and Accessible Options Inclusive of All Community Members and Needs Safer Travel in Ventura County Regional and Local Priorities

VCTC US 101 Communities Connected Study | 5
The CTP is in line with the Southern California region’s 2020 RTP/SCS, Connect SoCal (2020 ‐ 2045 Regional Transportation Plan/Sustainable Communities Strategy), that moves toward a more sustainable multimodal transportation system allowing people to move freely without the expense of a car. The 2020 RTP/SCS invests in projects and programs that would improve overall mobility while balancing safety and environmental considerations. The Connect SoCal vision is:
“Build upon and expand land use and transportation strategies established over several planning cycles to increase mobility options and achieve a more sustainable growth pattern.”
Connect SoCal incorporates policies to encourage emerging technologies, mobility innovations, and locating housing, jobs and transit closer together in priority growth areas while preserving natural lands and open spaces. It also contains a fiscally constrained list of projects and programs to achieve its vision, goals and policies.
1.3. US 101 Communities Connected Goals, Guiding Principles
US 101 Communities Connected builds on the Comprehensive Transportation Plan and Connect SoCal and reflects a shared vision for the future of the US Highway 101 corridor in Ventura County. The Study analyzes a wide range of issues to improve mobility to benefit all people by providing more choices for the highly travelled US 101 Corridor. It aims to preserve community character and create opportunities for neighborhood enhancement. This comprehensive approach addresses congestion and quality‐of‐life concerns related to transportation within the corridor through investment in transportation projects and programs developed in collaboration with State, regional and local partners. It is consistent with the goals and objectives of the 2013 CTP, 2020 RTP/ SCS and SCCP guidelines. The goals and guiding principles of the US 101 Communities Connected study are developed to improve the overall corridor mobility while balancing safety and environmental considerations as shown in Figure 3.
Figure 3 – Project Goals
Safety and Health – Improve safety and health by reducing the frequency and severity of safety incidents and hazards for all modes, improve air quality, and provide safe routes for children to get to school.
Social Equity – Be inclusive of all community members and their needs by ensuring a fair share of benefits of the transportation system for disadvantaged communities, provide viable transportation options for people who do not have cars, and improve workers’ access to jobs.
Multimodal Mobility – Improve mobility and accessibility for a connected and integrated transportation system by reducing Vehicle Miles Traveled, congestion and delay, increasing throughput and reliability for all users, and increasing transit ridership and active transportation participation.
Robust Economy – Improve freight movement while mitigating its impacts, manage curb demand, and improve access to jobs.
Connect SoCal Goals
Encourage regional economic prosperity and global competitiveness
Improve mobility, accessibility, reliability, and travel safety for people and goods
Enhance the preservation, security, and resilience of the regional transportation system
Increase person and goods movement and travel choices within the transportation system
Reduce GHG emissions and improve air quality Support healthy and equitable communities Adapt to a changing climate and support an integrated
regional development pattern and transportation network Leverage new transportation technologies and data-driven
solutions that result in more efficient travel Encourage development of diverse housing types in areas
that are supported by multiple transportation options Promote conservation of natural and agricultural lands
and restoration of habitats

VCTC US 101 Communities Connected Study | 6
Environmental Stewardship – Preserve and increase access to habitat and open space, reduce GHG emissions and improve air quality.
These goals and guiding principles provide a foundation to develop a holistic approach to mobility by identifying hotpots, finding multimodal solutions, and creating a path for implementation of projects and programs. Projects and programs will be evaluated in a multimodal context in the following areas:
Reduction in Vehicle Miles Traveled (VMT) – How will the project minimize VMT in the corridor?
Person throughput – How will the project maximize person throughput in the corridor?
Safety – How will the project increase safety for motorized and non‐motorized users?
Accessibility – How will the project provide access to multimodal choices? Will the project close an existing gap in transit and active transportation? How will the project connect to jobs, major destinations, and residential areas?
Economic Development and Job Creation and Retention – How does the proposed project improve accessibility to economic opportunities and the movement of goods and services in the region?
Air Quality and GHGs – How will the proposed project reduce greenhouse gas emissions (GHG) and criteria pollutants to advance the State’s air quality and climate goals?
Efficient Land Use – How does the project support mixed‐use and infill development with multimodal choices? Is the project located within a half‐mile of a major transit stop? Is the project located in an area with per capita household vehicle miles travel that is 15 percent below regional or city average?
1.4. US 101 Communities Connected Process
The following Chapters of the report cover each step of the US 101 Communities Connected planning process. The study begins with an analysis of existing and future transportation conditions in the corridor. The next chapters cover the steps taken to compile the list of transportation improvement projects and programs for the corridor and incorporate stakeholder input through public outreach. The report then discusses the study’s extensive performance evaluation framework, the results of the US 101 Communities Connected project evaluation, and identifies potential funding sources. The report concludes with guidelines and recommendations for a path forward to achieve the US 101 Communities Connected visions and goals.
Definition of Transportation Metrics
Vehicles Miles Traveled (VMT) – VMT is a common measure used in transportation planning to measure the amount of travel for all vehicles in a geographic area over a given period of time. Person Throughput – Person throughput is a measure of the total number of people traveling through a roadway. This measure is often used as an alternative to traditional traffic volume measures, as person throughput captures the impacts of transit, walking, and bicycling.
VCTC US 101 Communities Connected Study | 7
2 EXISTING CONDITIONS The US 101 has always served as the main thoroughfare in Ventura County connecting local communities and linking the region to the larger Southern California region and beyond. At the inception of US 101 as a freeway at the end of the 1950s, Ventura County was made up of relatively small oil and agricultural communities with a population of around 17,000. The US 101 freeway and Southern California’s post‐World War II regional economy brought a large population boom to the corridor as working‐class people migrated out of Los Angeles to new Ventura County developments in Thousand Oaks, Camarillo, Oxnard, and Ventura. The US 101 corridor has grown to be a major sub‐region in California today, with over 420,000 people residing in the study area. The corridor has also experienced dramatic economic expansion in the same period as new jobs centers grew along US 101 in Thousand Oaks, Oxnard, and Ventura. Today the study area has nearly 200,000 jobs. Overall, the corridor represents over half of Ventura County’s population and jobs. The current population and economy have brought vitality and wealth to the region, but it has also created significant challenges for the corridor’s transportation network. On typical weekdays, auto and truck traffic volumes during peak commute periods exceed roadway capacities on the freeways and major arterials causing bottlenecks and congestion. In addition to longer travel times incurred by drivers, current traffic levels also correspond to growing negative externalities related to pollution and roadway accidents. Despite these deteriorated conditions from auto‐travel, transit and non‐motorized modes represent just three percent of commutes in the study area. The continued reliance on auto travel in the corridor is a result of long trip distances and limited mobility and connectivity provided by non‐auto modes.
2.1. Land Use and Demographics Land use, population, and employment play key roles in influencing travel behavior. Developments along US 101 Corridor are primarily concentrated in four incorporated cities separated by unincorporated County lands that predominately contain a mix of agriculture and open space uses. The main urbanized areas are within the City of Ventura, City of Oxnard, City of Camarillo, and City of Thousand Oaks. Each is recognized as a distinct and cohesive community containing the full complement of land uses typical of a suburban city including residential, commercial, industrial, cultural, recreational, government, and services. The highest intensities of development are generally located proximate to US 101, with two exceptions. One area of intensity located perpendicular to the corridor extends south of the freeway in the City of Oxnard and includes the Oxnard Civic Core adjoining the city’s transit center. Another area of intensity extends north of the corridor in the City of Ventura along Ventura Avenue, running parallel to California State Route 33.

VCTC US 101 Communities Connected Study | 8
Information regarding existing land uses and zoning designations are primarily sourced from the SCAG 2016 land use dataset, updated in November 2018. The data is based on each local jurisdiction’s input received during SCAG’s 2020 RTP/SCS Local Input and Envisioning Process. The SCAG 2016 land use codes for zoning and existing land use were mapped, analyzed, and refined to correct evident errors. 2.1.1. Development The study area has multiple small business districts and is essentially suburban in nature, consisting primarily of open space, agriculture, and housing. Development is concentrated at multiple centralized nodes and along major corridors. These distinct concentrations of business and commercial development are surrounded by low‐density residential development and separated from each other by undeveloped open space and agricultural uses. Commercial centers and industrial centers typically exist within a quarter or half mile of the US 101 Corridor and higher density housing within a mile of the Corridor, which can be seen in Figures 4 and Figure 5. While land use groupings are oriented along the freeways, the downtown and community core of each city extend along the branching intra‐city corridors, such as SR 23, and city corridors, like Thousand Oaks Boulevard.
Figure 4 – Existing Land Use Map, East
Source: SCAG
Figure 5 – Exiting Land Use Map, West
Source: SCAG
2.1.2. Open Space and Agriculture While development patterns grew organically from the area’s initial settlements, policies to protect agriculture and open space between more urbanized areas have been in effect since the adoption of the Guidelines for Orderly Development (adopted by the Board of Supervisors in 1969, and revised and adopted in 1996), that encourage urban development to occur within incorporated Cities. These efforts are reinforced through voter approved Save Open Space and Agricultural Resources (SOAR) initiatives. The first SOAR initiative passed in 1995 in the City of Ventura; since then other SOAR initiatives passed in the corridor cities of Oxnard, Camarillo, and Thousand Oaks, and unincorporated Ventura County. In 2016, voters approved extensions to SOAR ordinances in through 2050. SOAR initiatives establish City Urban Restriction Boundary (CURB) lines around the cities and require a majority vote of the people to urbanize lands zoned for open space, agricultural or rural land uses. These measures preserve open space and agricultural lands while concentrating development within cities. In addition to the Guidelines for Orderly Development and SOAR ordinances, Greenbelt Agreements reinforce protections for open space and agriculture lands through voluntary agreements between the Board of Supervisors and one or more City Councils regarding development of agricultural and/or open space areas beyond city limits. Cities commit to not annex any property within a greenbelt, while the

VCTC US 101 Communities Connected Study | 9
Board agrees to restrict development to uses consistent with existing zoning. Further, regional wildlife corridor regulations, adopted by the Ventura County Board of Supervisors in 2019, enhance and protect linkages for animal migration to ensure the future health of the County’s natural resources. The objectives of these regulations are to minimize direct and indirect barriers to wildlife movement and reduce vegetation loss and habitat fragmentation, while simultaneously protecting property rights. The regulations create buffers between surface water and road crossings and developed areas, encourage compact development, and limit outdoor night lighting, impermeable fencing, and planting of invasive species. The SOAR area, greenbelts, and regional wildlife corridors are shown in Figure 6. Land use policies and patterns in Ventura County concentrate urban growth within incorporated cities and urban growth boundaries. As such, infrastructure improvements and services derived from development fee revenues have been internalized within each city’s jurisdictional boundaries and in unincorporated Ventura County. Figure 6 – SOAR Boundaries, Greenbelts, & Regional Wildlife Corridors
2.1.3. Primary Land Uses As documented in Table 1, roughly 16 percent of the existing land use in the study area is open space, recreation, and undevelopable or protected land, and an additional 31 percent of the study area is agricultural. More than 90 percent
of the study area will continue to be protected by the Guidelines for Orderly Development, greenbelt agreements, and SOAR policies. Residential land uses make up less than a quarter of the study area acreage. The top three land use types within the corridor study area are: agriculture, single‐family residential, and open space/recreation.
Table 1 – Existing Land Use, Study Area
LAND USE ACRES % OF ACRES Residential
Single‐family Residential 28,023.3 18.67% Multi‐Family Residential 4,014.7 2.67% Mobile Homes and Trailer Parks 774.9 0.52% Mixed Residential 268.2 0.18% Rural Residential 2,606.8 1.74%
Agriculture 46,638.6 31.07% Commercial and Office
Commercial and Services 4,187.6 2.79% General Office Use 1,275.6 0.85%
Institutional Facilities Facilities 2,702.1 1.80% Educational Institutions 3,300.9 2.20% Military Installations 7.4 0.00%
Industrial 4,966.2 3.31% Transportation, Communications, and
Utilities 4,991.6 3.33%
Mixed Uses Mixed Commercial and Industrial 520.3 0.35% Mixed Residential and Commercial 8.5 0.01%
Under Construction 142.2 0.09% Undeveloped Space
Open Space and Recreation 20,618.0 13.73% Vacant 5,269.9 3.51% Water 1,550.5 1.03% Undevelopable or Protected Land 3,442.2 2.29%
Specific Plan 887.3 0.59% Unknown 13,925.6 9.28% Total 150,122.2
Source: SCAG City of Ventura The historic core of the City of Ventura is located directly off US 101 along Main Street and California Street with its comparatively dense mix of commercial, office, single and multi‐family housing, coastal‐serving uses, and smaller

VCTC US 101 Communities Connected Study | 10
industries. The traditional street grid, small blocks, and shared parking facilities contribute to the area’s urban character and walkability. A secondary core of employment and activity, predominately auto‐oriented industrial and commercial uses, is located to the east, generally south of US 101 and flanking Telephone Road. Single‐family residential neighborhoods, which make up 36 percent of the City’s acreage, extend outward from these areas, with scattered commercial centers and pockets of multi‐family housing. Commercial corridors extend parallel to US 101 and SR 33 including Ventura Avenue, Main Street, and Thompson Boulevard. City of Oxnard The City of Oxnard’s historic core, which contains a similar mix of uses as the City of Ventura’s downtown, is located south of US 101 along Oxnard Boulevard and abutting the Oxnard Transit Center, which offers connections between Los Angeles, local and commuter bus service, Metrolink commuter rail service, Amtrak, Greyhound bus service, VCTC Intercity Service, Gold Coast Transit. In the core a concentrated mix of commercial, multi‐family residential, educational, public facilities, and industrial uses are located close to one another. Oxnard Boulevard is a major connector between US 101 and SR 1, which runs along the coast and connects to US 101 to the east of downtown. Though City policies emphasize infill and increasing density, particularly of housing, redevelopment activity in the City’s historic core has been slow to occur. Most recent development and economic activity have occurred north of the core, abutting US 101 in proximity to Vineyard Avenue and Oxnard Boulevards. This includes a major project, Riverpark that is designed as a pedestrian‐oriented village containing a mix of single‐family and apartment housing. The commercial development includes national brand retailers known as The Collection. Commercial properties south of Riverpark/The Collection have also been redeveloped. Like the City of Ventura, a second center of jobs and economic activity occurs to the east of the City’s core, flanking Rice Avenue, which is the most sizable concentration of industrial development in the study area. These centers of development are predominately surrounded by single‐family housing neighborhoods, which are nearly a third of the City of Oxnard’s existing land use in the study area. City of Camarillo Camarillo’s urban form and land uses exhibit a more typically suburban pattern of development. A small, pedestrian‐oriented downtown area with restaurants and small shops extends along three blocks of Ventura Avenue between Lewis Road
and Cedar Drive. Lands both north and south of US 101 extending west between Carmen Drive and Las Posas Road are developed with large scale commercial centers, including a regional Outlet Center, and professional offices, all of which are characterized by large footprint buildings surrounded by extensive surface parking lots. Flanking these uses, particularly to the north of the commercial centers, are multifamily housing developments. Defining the southwestern edge of this area is the Camarillo Airport, a public aviation facility serving general aviation and executive aircraft. Camarillo Airport is owned by the County of Ventura and managed by the Department of Airports. To the east and north of US 101, employment is concentrated in multi‐tenant office and industrial parks between Lewis Road and Conejo Creek. Like the City of Ventura and City of Oxnard, single‐family neighborhoods surround and extend outward, primarily to the north of these centers. Camarillo’s commercial core aligns with US 101, with a concentration of industrial development also northeast of the US 101 and SR 34 interchange. Multi‐family residential and institutional uses are clustered around these two areas. The majority of the city’s land use is low density residential, which occupies a third of the city’s area. Open space and agriculture occupy nearly a quarter of the existing land use. City of Thousand Oaks Thousand Oaks is characterized by three primary mixed‐use and activity nodes. The community core is a linear corridor parallel to US 101 that extends generally from Moorpark Road to Westlake Boulevard Road, anchored by a regional mall in the west and a mix of automobile‐oriented businesses and centers, offices, and government facilities along its length. A recently adopted Thousand Oaks Boulevard Specific Plan promotes the integration of moderate density mixed‐use building and housing in this area. To the east and extending to the City boundary with Westlake Village and LA County is an area guided by the development master plan for Westlake Village. Here, properties are developed as commercial centers with larger multi‐tenant buildings, restaurants, and offices fronted by expansive surface parking lots and landscape typical of suburban communities. A significant deviation from this pattern is the property at the southeast intersection of Westlake Boulevard and Thousand Oaks Boulevard planned and developed as The Promenade pedestrian‐active lifestyle center. The third node, located in the west, is north of US 101, extends from Wendy Drive to Ventu Park and contains major technology and bio‐medical uses abutted by moderate to high density housing. As found in the other cities in the study area, single‐family housing neighborhoods surround and extend outward from these centers and corridors.

VCTC US 101 Communities Connected Study | 11
The existing land use and zoning are similar in spatial organization; commercial, industrial, and multifamily development is concentrated adjacent to US 101. There is a notable concentration of mixed commercial, office, and industrial development on the eastern end of the corridor near the Los Angeles County border and SR 23. More than 75 percent of the City within the study area is either a single‐family residential or an open space and recreation.
Unincorporated Ventura County The balance of the study area is located in unincorporated Ventura County. This area is relatively undeveloped – more than 60 percent of the existing land use is agricultural. There are limited single‐family residences scattered throughout the unincorporated area with concentrations adjacent to Thousand Oaks and north of Camarillo. Existing land use in the study area is summarized in Table 2.
Table 2 – Existing Land Use within the Study Area by Jurisdiction
EXISTING LAND USE
CITY OF VENTURA CITY OF OXNARD CITY OF CAMARILLO CITY OF THOUSAND OAKS
UNINCORPORATED VENTURA COUNTY
Acres % of Total Acres % of Total Acres % of Total Acres % of Total Acres % of Total Residential
Single‐family Residential 5,565.7 36.5% 3,414.8 29.3% 3,465.4 22.1% 10,842.9 31.9% 4,734.5 6.4% Multi‐Family Residential 1,171.9 7.7% 891.3 7.6% 587.7 3.8% 1,329.8 3.9% 34.1 0.0% Mobile Homes and Trailer Parks 280.2 1.8% 107.0 0.9% 174.2 1.1% 211.2 0.6% 2.2 0.0% Mixed Residential 93.8 0.6% 4.3 0.0% 170.1 0.2% Rural Residential 8.3 0.1% 1,833.9 11.7% 764.6 1.0%
Agriculture 378.5 2.5% 45.1 0.4% 1,680.5 10.7% 0.1 0.0% 44,534.3 60.5% Commercial and Office
Commercial and Services 1,290.0 8.5% 1,088.8 9.3% 579.7 3.7% 1,191.8 3.5% 37.3 0.1% General Office Use 287.8 1.9% 186.9 1.6% 91.8 0.6% 694.1 2.0% 15.0 0.0%
Institutional Facilities Facilities 447.7 2.9% 284.9 2.4% 286.1 1.8% 645.3 1.9% 1,038.1 1.4% Educational Institutions 613.2 4.0% 406.7 3.5% 490.2 3.1% 819.5 2.4% 971.3 1.3% Military Installations 7.4 0.0%
Industrial 931.9 6.1% 1,709.5 14.7% 1,007.9 6.4% 787.7 2.3% 529.2 0.7% Transportation, Communications, and Utilities 470.8 3.1% 427.0 3.7% 1,189.3 7.6% 354.7 1.0% 2,549.8 3.5% Mixed Uses
Mixed Commercial and Industrial 124.1 0.8% 331.5 2.8% 28.1 0.2% 10.7 0.0% 25.8 0.0% Mixed Residential and Commercial 1.1 0.0% 1.4 0.0% 1.9 0.0% 0.3 0.0% 3.8 0.0%
Undeveloped Space Open Space & Recreation 1,796.3 11.8% 1,327.7 11.4% 1,846.6 11.8% 15,020.0 44.2% 627.4 0.9% Vacant 830.1 5.4% 210.9 1.8% 977.1 6.2% 1,602.1 4.7% 1,649.6 2.2% Water 382.5 2.5% 4.4 0.0% 75.7 0.5% 96.5 0.3% 991.5 1.3% Undevelopable or Protected Land 315.5 2.1% 326.2 2.8% 129.6 0.8% 2,800.4 3.8%
Specific Plan 887.3 7.6% Under Construction 12.5 0.0% Unknown 254.9 1.7% 4.7 0.0% 1,222.7 7.8% 371.0 1.1% 12,072.3 16.4% Total 15,251.8 11,660.3 15,668.5 33,990.1 73,551.4
Source: SCAG

VCTC US 101 Communities Connected Study | 12
2.1.4. Population and Employment Existing population, household, and employment information was compiled for each city from Transportation Analysis Zones (TAZs) within the study area. Over 420,000 people live within the study area, representing approximately half of the population of the entire Ventura County. Nearly 90 percent of the population in the study area lives in the incorporated cities of Thousand Oaks, Oxnard, Ventura, and Camarillo. In the study area as a whole, 3.0 people on average live in each household, which is on par with the county as a whole, but varies throughout the study area. Within the study area the average household in the City of Ventura has 2.6 people per household, while City of Oxnard has the highest people per house ratio of 3.9. Study area population and household information is shown in Table 3. Table 3 – Existing Population, Household, and Employment Within the
Study Area
CITY OR COUNTY POPULATION HOUSEHOLDS PERSONS PER HOUSEHOLD Ventura 94,300 36,000 2.6 Oxnard 105,400 26,800 3.9 Camarillo 61,300 23,000 2.7 Thousand Oaks 115,300 41,400 2.8 Unincorporated 45,300 14,700 3.1 Total Study Area 421,500 142,000 3.0 Source: SCAG The economy of the study area employs nearly 200,000 people, representing approximately half of the jobs in the entire Ventura County. 90 percent of the jobs are also located within incorporated cities. For the study area as a whole, the population to employment ratio is 2.12. Population and employment information is shown in Table 4.
Table 4 – Existing Population to Employment and Household to Employment Ratios Within the Study Area
CITY OR COUNTY POPULATION HOUSEHOLDS EMPLOYMENT POP/EMPLOYMENT RATIO Ventura 94,300 36,000 72,000 1.31 Oxnard 105,400 26,800 30,900 3.41 Camarillo 61,300 23,000 9,300 6.60 Thousand Oaks 115,300 41,400 69,00 1.67 Unincorporated 45,300 14,700 17,300 2.62 Total Study Area 421,457 141,938 198,500 2.12 Source: SCAG
In the corridor study area more than 115,000 residents, 41,000 households, and 69,000 jobs are within the City of Thousand Oaks. This portion of the study area has the largest share of the corridor population. On average 2.8 people live in each household, which is close to the average for the study area. There are 1.67 people for each job indicating the eastern‐edge of the corridor functions as an employment center, with many living outside of Thousand Oaks commuting to jobs within city limits. In the corridor study area, 105,400 residents, nearly 27,000 households, and approximately 31,000 jobs are within the City of Oxnard. This portion of the corridor has the highest persons per household ratio in the study area, at a rate of 3.9 people per housing unit. This may indicate that larger families or unrelated people live together in single households. In this portion of the corridor population to employment ratio is higher than the average for the study area. In the corridor study area approximately 94,300 residents, 36,000 households, and roughly 72,000 jobs are within the City of Ventura jurisdiction. In this area of the corridor the population/employment ratio is 1.31. With lower than average population/employment ratios, the western‐edge of the corridor in the City of Ventura functions as a regional employment center, with many people living outside of the city, commuting to jobs within city limits. In the corridor study area, 61,300 residents, more than 23,000 households, and roughly 9,000 jobs are in the City of Camarillo. In this central portion of the corridor, population to employment ratio is higher than average for the study area. There are nearly two and a half households for every job available in this area indicating many residents living in this portion of the community must travel outside of the city to reach their place of employment. In the corridor, unincorporated Ventura County accounts for roughly 10 percent of the study area population, households, and jobs. These corridor areas outside the four main jurisdictions have an average of 3.1 people per household and 2.62 people per job. Population and employment density in the study area is illustrated in Figure 7 and Figure 8.

VCTC US 101 Communities Connected Study | 13
Figure 7 – Existing Population Density Map by TAZ

VCTC US 101 Communities Connected Study | 14
Figure 8 – Existing Employment Density Map by TAZ

VCTC US 101 Communities Connected Study | 15
2.1.5. Disadvantaged Communities According to the California Energy Commission, disadvantaged communities are those most burdened by pollution from multiple sources and most vulnerable to its effects, taking into account socioeconomic characteristics and underlying health status. A quarter of the proceeds from the State of California’s GHG Reduction Fund go to projects that benefit disadvantaged communities. To determine which communities are disadvantaged, the Office of Environmental Health Hazard Assessment analyzed 20 health and socioeconomic wellbeing indicators at the census tract level to develop the California Communities Environmental Health Screening Tool (“CalEnviroScreen”). Pursuant to Senate Bill 535, CalEPA designates disadvantaged communities as those at or above the 75th percentile as determined by CalEnviroScreen. As of the 2018 CalEnviroScreen 3.0 update, there are seven disadvantaged communities with 31,900 people that fall completely or partially within the study area. As seen in Figure 9, these communities are concentrated west of Camarillo in and around the cities of Ventura and Oxnard. Seven out of the eight disadvantaged communities in Ventura County are in the corridor.
Figure 9 – Disadvantaged Communities (2018)
2.2. Travel Market The transportation system is mainly comprised of two components: Travel Demand (trips) and Transportation Supply (infrastructure). As previously discussed, Ventura County’s primary residential and jobs centers are concentrated in four main jurisdictions (City of Ventura, City of Oxnard, City of Camarillo, and City of Thousand Oaks) along the US 101 Corridor. Over 420,000 residents and nearly 200,000 workers travel in the study area to undertake a variety of activities such as work, school, shopping, leisure, and goods movement. Within the study area, population is concentrated in the four cities and jobs are concentrated in the cities of Ventura and Thousand Oaks. Residents and employees make over 1.9 million daily auto trips in the study area. This represents 50 percent of the trips in Ventura County. These 1.9 million trips represent most travel in the study area as it is very auto‐centric. Data shows over 90 percent of commutes are by car. Highways and arterials in the corridor are the most essential elements of the area’s transportation infrastructure, crisscrossing the study area connecting major activity centers. US 101 is the key route for travel as much of the existing a new residential communities and commercial development is formed along the highway in the corridor area. 2.2.1. Commute Mode Choice Data shows 91 percent of commutes are by car in the study area. High auto use is often found in suburban and rural areas with low‐density land uses like the US 101 Corridor. Transit accounts for just 1 percent of daily commutes. Notably, when examining commutes by car, a sizable portion of commuters carpool. In the study area, 78 percent of workers drove alone and 13 percent carpooled. The share of commuters that carpool is higher in the study area compared to Ventura County as a whole (13 percent in the study area, compared to 10 percent in Ventura County). Carpooling is particularly popular in the City of Oxnard where one in five workers in the study area carpool to work. Work at Home is the third most popular option in the corridor after Drive Alone and Carpool. Five percent of workers in the study area work at home. It is particularly popular in the City of Thousand Oaks where nearly 1 in 10 workers works from home. Figure 10 illustrates the average commute mode share in the study area. Table 5 shows commute mode share for the four main jurisdictions.

VCTC US 101 Communities Connected Study | 16
Figure 10 – Average Mode Share in the Corridor
Source: U.S. Census Bureau: American Community Survey (2018)
Table 5 – Mode Share by City
CITY DRIVE ALONE CARPOOL TRANSIT NON‐MOTORIZED
WORK AT HOME
Ventura 78% 11% 1.9% 3% 6% Oxnard 77% 17% 1.1% 2% 3% Camarillo 82% 10% 1.0% 2% 5% Thousand Oaks 80% 8% 1.1% 2% 9% Source: U.S. Census Bureau: American Community Survey (2018) 2.2.2. Commute Time Except for individuals who work at home, nearly a quarter‐million workers in the study area must find a way to travel to their jobs each workday. Their choice of transportation mode, departure time, trip origin and destination all play key roles in determining door‐to‐door travel time. The collective result of these daily decisions is reflected in the commute times for the study area. The majority (63 percent) of commute travel times within the study area are less than 30 minutes. 11 percent commute less than 10 minutes, 58 percent commute 10 to 30 minutes, 23 percent commute 30 to 60 minutes, and 8 percent commute over one hour. A summary of journey‐to‐work travel time is
illustrated in Figure 11 and tabulated in Table 6.
Figure 11 – Journey-to-Work Travel Times (minutes) by City
Source: U.S. Census Bureau: American Community Survey (2018)
Table 6 – Journey-to-Work Travel Times (minutes) by City
CITY <10 MINS. 10 TO 30 MINS 30‐60 MINS >60 MINS Ventura 14% 53% 24% 9% Oxnard 5% 65% 25% 5% Camarillo 19% 57% 21% 8% Thousand Oaks 14% 53% 22% 12% Study Area 10% 53% 23% 8% Ventura County 11% 54% 27% 9% California (State) 9% 47% 31% 13% Source: U.S. Census Bureau: American Community Survey (2018) Commute time varies based on place of residence, place of employment, and mode of travel. Across the four main jurisdictions, commute time distribution skewed towards shorter commutes. A majority of workers have commutes under 30 minutes with the plurality of workers having commutes between 10 and 30 minutes. Of the group of commuters with commutes under 30 minutes, workers who live in Oxnard tend to have slightly longer commutes with more workers who have commutes between 25 and 29 minutes compared to the rest of the study area. When it comes to long commutes, Thousand Oaks stands out for having the most commutes over one hour each way. Thousand Oaks residents who commute
0% 20% 40% 60% 80% 100%
City of VenturaCity of Oxnard
City of CamarilloCity of Thousand Oaks
Study AreaAll Ventura County
California
l to 5 5 to 9 10 to 14 15 to 1920 to 24 25 to 29 30 to 34 35 to 3940 to 44 45 to 59 60 to 89 Greater than 90

VCTC US 101 Communities Connected Study | 17
outside the city travel south to Los Angeles County and drive north to Camarillo, Oxnard, and Ventura to work. In addition to long drive distances, morning and evening congestion on highways in Thousand Oaks lengthens travel times. 2.2.3. Travel Patterns Daily auto trips are examined to gain valuable insight into the daily activity patterns of travelers in the region. The majority (58 percent) of daily trips are internal‐internal trips, meaning they both originate and end within the corridor study area. Daily internal‐internal trips typically represent trips to school, shopping, and leisure which are often proximate to home. They also represent trips to/from work for workers who live and work within the study area. City‐to‐city trip analysis shows for all cities, the majority of trips stay within the city. The largest city‐to‐city flows are between Oxnard and Ventura. 24,000 trips originate in Oxnard and end in Ventura, and 23,000 trips originate in Ventura and end in Oxnard each day. Daily flows by origin‐destination pairs are summarized in Table 7.
Table 7 – Daily Flow / Travel Patterns Within Study Area
ORIGIN/ DESTINATION CAMARILLO OXNARD VENTURA THOUSAND
OAKS OTHER
DESTINATIONS Camarillo 54,000 9,000 7,000 13,000 47,761 Oxnard 9,000 85,000 24,000 6,000 78,819 Ventura 7,000 23,000 235,000 2,000 74,300 Thousand Oaks 13,000 6,000 2,000 214,000 131,490 Other Origins 48,000 77,000 75,000 135,000 38,620,000 In addition, approximately 18,000 daily through vehicle trips occur along the corridor (in other words, trips that pass through, but originate and end outside of, the corridor). The remaining trips travel to or originate from outside of the study area (internal‐external trips and external‐internal trips). Approximately 28 percent of study area trips stay within Ventura County, 12 percent travel to/from Los Angeles County and beyond, and 2 percent travel to/from Santa Barbara. Workers commuting from homes within the study area to job centers outside of the county account for most of the trips to/from Los Angeles and Santa Barbara counties. Approximately 17 percent of workers living in Ventura County commute to Los Angeles County for work and 3 percent of workers living in Ventura County commute to Santa Barbara County for work. Housing costs in Los Angeles and Santa Barbara counties continue to rise, and some workers choose to live in Ventura County where housing is relatively more affordable. A small share of Ventura County workers live outside the County, including 10 percent who live in Los Angeles County. County‐to‐county commuting flows are tabulated
in Table 8 and Table 9. The generalized origin and destination of the auto trips are depicted in Figure 12.
Table 8 – County-to-County Commuting Flows for Workers Living in Ventura County.
WORKPLACE SHARE Ventura County 78.5% Los Angeles County 17.3% Santa Barbara County 3.3% Other 0.9% Source: ACS 2012-2016 via CTPP (Census Transportation Planning Products) County to County Flows Note: This data includes all of Ventura County (including outside of the study area) Table 9 – County-to-County Commuting Flows for Workers Working in
Ventura County
WORKPLACE SHARE Ventura County 87.5% Los Angeles County 10.8% Santa Barbara County 0.6% Other 0.1% Source: ACS 2012-2016 via CTPP (Census Transportation Planning Products) County to County Flows Note: This data includes all of Ventura County (including outside of the study area)
Figure 12 – Existing Daily Auto Trips in and to/from the Corridor
Source: VCTM

VCTC US 101 Communities Connected Study | 18
2.3. Freeway In its current configuration, US 101 generally consists of three lanes in each direction from SR 33 in the City of Ventura to Moorpark Road in Thousand Oaks and four lanes from Moorpark Road to east of SR 23. US 101 has no high occupancy vehicle (HOV) lanes in the study area and limited areas with auxiliary lanes, both of which are the subject of a major study by the Ventura County Transportation Commission (VCTC) and Caltrans, known as Our Future 101. The freeway carries a high of just over 200,000 daily trips in Thousand Oaks near SR 23, approximately 150,000 daily trips in mid‐corridor in Camarillo, and a low of 71,000 daily trips west of SR 33 on the western end of the corridor. Peak hour volumes in the corresponding segments range from 19,000 vehicles per hour (vph) in the east to 12,000 vph in the central portion of the corridor, and a low of about 6,000 vph on the western end of the corridor. With the diversity of the environment and origins‐destinations that US 101 connects, daily and peak hour traffic flows within the corridor yield unique operational and congestion patterns and issues from both geographical and time of day standpoints. Unlike typical freeway corridors in Southern California which generally experience symmetric traffic flow patterns during the day – with bottlenecks and congestion in opposite directions in the AM and PM peak periods, the US 101 Corridor has asymmetric daily traffic patterns. Figure 13 and Figure 15, depict typical morning and afternoon congestion patterns along the study corridor. The line graph identifies locations and hours of congestions when speed drops below 45 miles per hour. The heat map displays a congestion scan for the corridor’s freeway lanes. A congestion scan is a two‐dimensional contour plot, showing the average weekday traffic speeds with time of day on the vertical axis and post‐mile along the study corridor on the horizontal axis. Figure 14 and Figure 16 illustrate Level‐of‐Service (LOS) based on demand over capacity.
As shown in Figure 13, typical morning congestion patterns along the study corridor are considerably lighter than the evening and are concentrated eastbound in the eastern portion of the corridor approaching SR 23 and towards the Los Angeles County line. During the AM peak period, in addition to congestion around SR 23, the stretch of freeway between the Vineyard Avenue (SR 232) and Rice Avenue is congested for about 2 hours from 7:00 AM to 9:00 AM, and the stretch of freeway between Camarillo Springs Road and Lynn Road is congested for about 2.5 hours from 7:00 AM to 9:30 AM.
As shown in Figure 15, in contrast, evening congestion patterns are consistently much heavier and are widespread throughout a larger portion of the corridor, especially mid‐corridor from Vineyard Avenue (SR 232) in Oxnard to Lewis Road (SR 34) in Camarillo. During the PM peak period, the stretch of freeway between the SR 23 and Ventu Park Road is congested for about 3 hours from 3:30 PM to 6:30 PM. The stretch of freeway between Camarillo Springs Road and Rice Avenue is congested for about 3 hours from 3:30 ‐6:30 PM. Congestion during the PM peak period is especially notable in Thousand Oaks from the LA County line to Camarillo – with the exception of a short section between Hampshire Road and SR 23.
It can be concluded that these congestion and duration disparities are due to the traffic composition and highly different patterns in the two peaks. While in the AM peak, with most of the commercial activity centers still closed, a majority of the traffic is commute and school related. In contrast, in the PM peak, the composition and volumes of traffic are much more varied and complex, and include shopping, recreational and commercial trips combined with the regular school and commute return traffic. This is rather intuitive since the US 101 Corridor serves as an access facility for the majority of the county’s concentration of commercial land uses, especially in the central portions of the corridor in Camarillo.
Investigating the above phenomena more closely with Caltrans traffic and speed data, Figure 17 shows the locations of recurring, persistent traffic “bottlenecks” along the project corridor. Bottlenecks in this context are defined as locations where significant speed degradation occurs in more that 20 percent of the days throughout the year. Therefore, additional bottlenecks may occur within the study area that do not meet the formal definition and are not shown. Arrows correspond to the morning, mid‐day and evening period bottleneck patterns by direction and proportional in magnitude, as listed in the accompanying table. This data also corroborates the previous observations, confirming that the evening and mid‐day congestion patterns are much more pronounced than the morning, with some segments from Lynn Road to Wendy Drive exhibiting recurring delay patterns that consistently occur between 35 to 47 percent of the days during the year, with significant average delays (as high as 200 vehicle hours), lasting for 60 to 90 minutes in the afternoon periods.
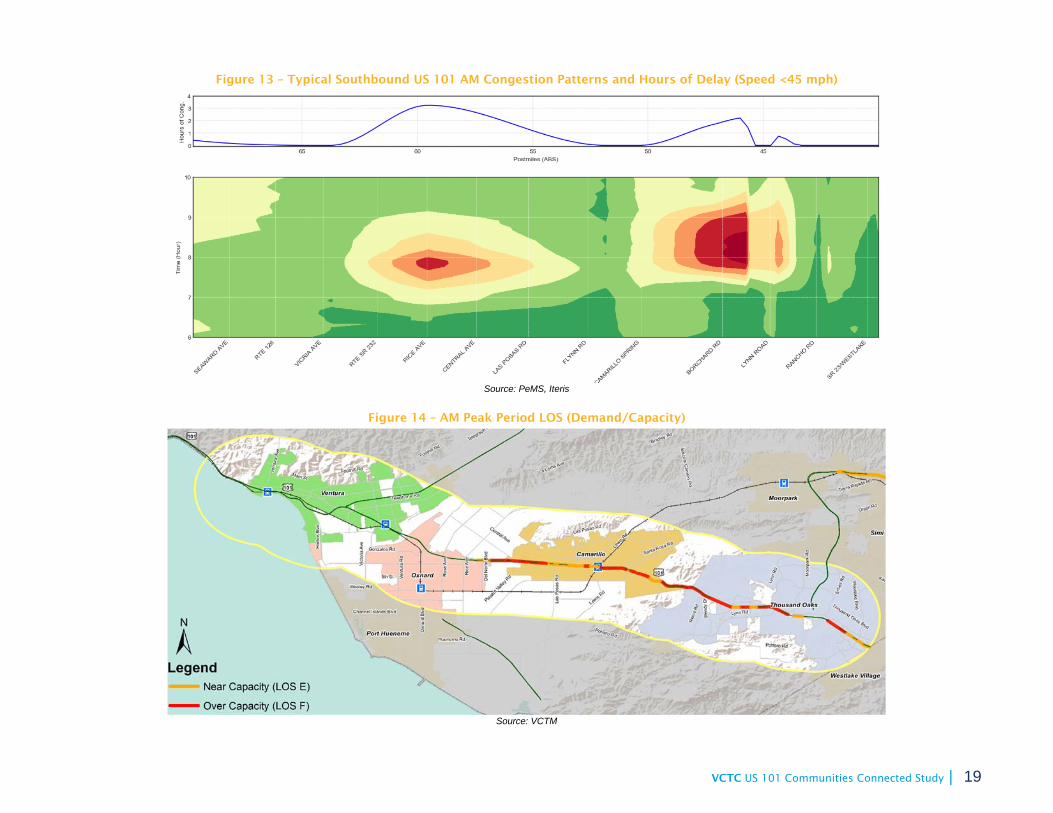
VCTC US 101 Communities Connected Study | 19
Figure 13 – Typical Southbound US 101 AM Congestion Patterns and Hours of Delay (Speed <45 mph)
Source: PeMS, Iteris
Figure 14 – AM Peak Period LOS (Demand/Capacity)
Source: VCTM
VCTC US 101 Communities Connected Study | 20
Figure 15 – Typical Northbound US 101 PM Congestion Patterns and
Hours of Delay (Speed <45 mph)
Source: PeMS, Iteris
Figure 16 – PM Peak Period LOS (Demand/Capacity)
Source: VCTM

VCTC US 101 Communities Connected Study | 21
Figure 17 – Recurring "Bottleneck" Locations
Source: Caltrans PeMS, Iteris

VCTC US 101 Communities Connected Study | 22
VCTC and Caltrans are engaged in a multi‐year Project Approval and Environmental Documentation (PA&ED) effort to improve US 101, generally from the SR 33 in the City of Ventura to SR 23 in Thousand Oaks. The PA&ED investigates infrastructure improvements alternatives including high occupancy vehicle (HOV)/express bus lanes and other related enhancements within the corridor, such as interchange improvements and auxiliary lanes.
2.4. Arterial/Local Streets Local streets and roads are critical components of the Ventura County transportation system. Roads provide important connections within and between local communities, and from the highway system to local streets. Automobiles, buses, bicycles, and pedestrians all use the local streets and roads. The arterials identified in the 2009 Ventura County Congestion Management Plan (CMP) are exhibited in Figure 18. The intent of the CMP is to more efficiently link land use and transportation, thereby prompting reasonable growth management programs that will effectively utilize transportation funds, alleviate traffic congestion and related impacts, and improve air quality.
Figure 18 – CMP Network Capacity
The study area includes approximately 260 lane miles of arterials including state highways, with more than half (57 percent) being 4‐lane roads, as shown in Figure 16. Level of Service (LOS), or the demand over roadway capacity, is presented in
Figure 19. A majority of the CMP roadways have LOS D or better with an average PM peak period speed of approximately 35 MPH within the study area.
Figure 19 – CMP Network Level of Service (LOS)
2.4.1. Arterials with Highest Daily Volumes The arterials analyzed below have the highest daily traffic volumes as measured by average daily traffic (ADT). ADT is a measure used in transportation planning and engineering to describe the total volume of vehicle traffic on a highway or road for a typical day. AM Peak hour and PM Peak hour traffic volumes for these arterials are also shown below. These hourly volumes represent the morning and evening hours with the highest volume of travel. Arterials with heavy commuter traffic will have high AM Peak and PM Peak hourly traffic volumes. Victoria Avenue (City of Ventura and City of Oxnard) 2018 CMP ADT Counts (south of Olivas Park Drive) – ADT: 44,900; AM Peak: 3,430; PM Peak: 3,850 Victoria Avenue is a north‐south arterial on the west‐side of the study area. The arterial runs through the City of Ventura and along the western edge of the City of Oxnard. The arterial connects the City of Ventura and US 101 to communities on the west‐side of the City of Oxnard. North of US 101 in the City of Ventura, the road is lined by local shopping centers, grocery stores, residential communities, Ventura County government offices, and Buena High School. South of US 101 in the City of Oxnard, the arterial passes through agriculture and open space,

VCTC US 101 Communities Connected Study | 23
residential neighborhoods, local shopping centers, grocery stores, Channel Island marina, and Naval Base Ventura County (NBVC) Port Hueneme. Victoria Avenue from NBVC Port Hueneme (south of Channel Islands Boulevard) to US 101 is designated by the United States Department of Defense as a Strategic Highway Network Connector, which serves as an important military mobilization corridor. Las Posas Road from Pointe Mugu Naval Complex and US 101 also have this designation. Additional planning and funding considerations are outlined in the Defense Access Roads program, Naval Base Ventura County (NBVC) Joint Land Use Study (2015), and United States Army Military Surface Deployment & Distribution Command (SDDC) STRAHNET program. Rice Avenue (City of Oxnard) 2018 CMP ADT Counts (south of 5th Street/SR 34) – ADT: 36,700; AM Peak: 2,500; PM Peak: 2,700 Rice Avenue is a north‐south arterial on the west‐side of the study area. The arterial runs south from US 101 through the eastern edge of the City of Oxnard. Rice Avenue connects US 101 to the east‐side of the City of Oxnard and continues further south connecting to US 1 towards Point Mugu and Malibu. Along the corridor is a concentration of industrial and commercial businesses north of 5th Street and agricultural land uses south of 5th Street. Traffic on the arterial grew 3 percent between 2017 and 2018. The City of Oxnard plans for significant near‐term light industrial and commercial development between Rice Avenue and Del Norte Avenue, south of US 101, continuing beyond Gonzales Boulevard, known as the Sakioka Farms Specific Plan. Santa Rosa Road (City of Camarillo) 2018 CMP ADT Counts (west of Moorpark Road) – ADT: 22,100; AM Peak: 2,130; PM Peak: 2,240 Santa Rosa Road is an east‐west arterial on the north‐side of the study area. The arterial runs from the east‐side of the City of Camarillo to the northern edge of the City of Thousand Oaks through Santa Rosa Valley. The road intersects US 101 in the City of Camarillo. Santa Rosa Road connects the City of Camarillo to the north‐side to the City of Thousand Oaks, Moorpark, and Simi Valley. The arterial is lined by primarily single‐family residential development and agricultural land uses. Traffic on Santa Rosa Road increased 2 percent in 2018 compared to the previous year. Harbor Boulevard (City of Ventura and City of Oxnard) 2018 CMP ADT Counts (north of Gonzales Road) – ADT: 21,700; AM Peak: 1,850; PM Peak: 2,180
Harbor Boulevard is a north‐south arterial on the western edge of the study area. Harbor Boulevard intersects US 101 corridor in the City of Ventura and links the corridor with the west‐side of the City of Oxnard and continues south to the City of Port Hueneme. The arterial runs along the coast and is adjacent to Ventura Harbor, Mandalay power plant, Mandalay State Beach, Oxnard Dunes, Oxnard Shores, and Channel Island Marina. Traffic on the arterial has increased nearly 3 percent year‐over‐year. Moorpark Road (City of Thousand Oaks) City of Thousand Oaks Counts (north of US 101) – ADT: 27,000; AM Peak: 2,160; PM Peak: 2,700 Moorpark Road is a north‐south arterial on the east‐side of the study area. The road serves as one of the primary north‐south routes in the City of Thousand Oaks that runs parallel to SR 23. Moorpark Road connects US 101 to many primarily single‐family residential neighborhoods on the north‐east side of the community. The arterial is flanked by many activity centers including local shopping centers, grocery stores, Thousand Oaks High School, Thousand Oaks Community Center and Community Park, Kaiser Permanente Thousand Oaks Medical Offices (off Hillcrest Drive), Janss Marketplace shopping mall (open‐air mall with box‐box stores and casual eateries), and open space recreation areas south of US 101 (Hope Nature Preserve, Los Robles Open Space, and Conejo Ridge Open Space). Traffic on the arterial increased nearly 5 percent between 2017 and 2018. Ventura County faces challenges to maintain existing roadways. The 2013 Comprehensive Transportation Plan estimated a $438 million funding shortfall to maintain existing roads, streets and arterials over the next 10 years. In 30 years, the projected need will reach $2.4 billion, but only $1.1 billion is available, leaving a $1.3 billion shortfall. Funding for the maintenance and rehabilitation of local roads continue to be insufficient, despite the recent implementation of SB 1 in 2017 to increase investment in transportation through a statewide gas tax. Other approaches and revenue sources – possibly at the local level – are needed to address the shortfall.
2.5. Transit and Active Transportation Although most trips in the corridor are made by automobiles, the study area does have a considerable transit and active transportation system. Transit and the active transportation network are vital for providing alternative low‐cost mobility options in the corridor – particularly for the population with limited or no access to a car.

VCTC US 101 Communities Connected Study | 24
2.5.1. Transit and Rail Ventura County is served by eleven separate service operators providing fixed route services and demand responsive service (Dial‐A‐Ride) including Metrolink and Amtrak operate daily commuter rail service within Ventura County, the Los Angeles region, and to Santa Barbara County. The key operators within the US 101 Corridor area are: Metrolink, Amtrak, Gold Coast Transit District, Ventura County Transportation Commission (VCTC Intercity), Camarillo Area Transit, and Thousand Oaks Transit. The majority of transit and rail service in Ventura County occurs within the study area. Four out of four of the Metrolink and Amtrak stations in the County are located within the study area. The entire Camarillo Area Transit fixed route service travels within the study area. All of Thousand Oaks Transit’s fixed routes are within the study area, with the exception of one bus stop on routes 41A and 42B. Sixty‐two (62) percent of Gold Coast Transit District (GCTD) bus stops are within the study area. Nearly all GCTD routes in Ventura are within the study, and about half in Oxnard are within the study area. All VCTC Intercity routes intersect the study area including Coastal Express and Cross County Limited that travel along portion of the corridor. VCTC Intercity Hwy 101/Conejo Routes 50‐55 travel along the US 101 Corridor. Fixed Route Transit Gold Coast Transit District operates 17 fixed bus routes, serving the communities of Oxnard, Ventura, Port Hueneme, and Ojai. VCTC operates an intercity bus network, primarily within Ventura County, extending into Santa Barbara and Los Angeles Counties. The VCTC Intercity bus runs eight routes to Oxnard, Ventura, Camarillo, Thousand Oaks, Moorpark, Simi Valley, Santa Paula, Fillmore, Piru, Carpinteria, Santa Barbara, and Goleta. Thousand Oaks Transit operates five routes, while Camarillo Transit operates two. A summary of number of routes, peak vehicles, and communities served by each service provider is included in Table 10. Figure 20 shows a map of all fixed‐route services in the study area.
Table 10 – Service Provider Summary
SERVICE PROVIDER ROUTES PEAK VEHICLES
BUS STOPS COMMUNITIES SERVED
Gold Coast Transit District 17 47 683 Oxnard, Ventura, Port Hueneme,
Ojai
VCTC Intercity 8 35 96
Oxnard, Ventura, Camarillo, Thousand Oaks, Moorpark, Simi Valley, Santa Paula, Fillmore, Piru, Carpentaria, Santa Barbara, Goleta
Thousand Oaks Transit 5 10 116 Thousand Oaks, Westlake Village
SERVICE PROVIDER ROUTES PEAK VEHICLES
BUS STOPS COMMUNITIES SERVED
Camarillo Area Transit 2 2 14 Camarillo Source: 2017 NTD
Figure 20 – Fixed-Route Transit Service
Table 11 presents a summary of annual ridership served by each service provider. Of the service providers, Gold Coast Transit District has the highest number of annual boardings at 3.6 million, more than twice as many boardings as all other service providers combined. As shown, ridership productivity is highest amongst transit providers with robust systems and/or bi‐directional routes. Figure 21 illustrates typical weekday boardings and alightings of bus stops in the study area, and Table 12 highlights the bus stops with the most boardings and alightings. The Oxnard Transit Center has the highest boardings and alightings among all stops.
Table 11 – Fixed Route Annual Ridership FY 2017
OPERATIONAL CHARACTERISTICS GOLD COAST VCTC
INTERCITY THOUSAND
OAKS CAMARILLO
Boardings 3,616,400 795,800 156,500 82,500 Total Revenue Miles 2,192,000 1,781,000 372,000 54,300 Total Revenue Hours 203,500 70,300 24,900 5,400 Operating Cost $18,924,500 $8,585,000 $2,403,500 $369,800 Operating Speed (mph) 10.8 25.3 14.9 10.0 Passengers per Rev Hr 17.8 11.3 6.3 15.3 Cost per Passenger $5.23 $10.79 $15.36 $4.48 Peak Vehicles 47 35 10 2 Source: 2017 NTD

VCTC US 101 Communities Connected Study | 25
Figure 21 – Fixed-Route Transit Service Bus Stop Typical Weekday Boardings and Alightings
Table 12 – Bus Stops with Most Daily Boardings and Alightings
RANK BUS STOP OPERATOR BOARDINGS ALIGHTINGS TOTAL 1 Oxnard Transit Center Gold Coast 1,150 1,040 2,190 2 Ventura Transit Center Gold Coast 1,000 960 1,970 3 Camarillo Metrolink Station VCTC Intercity 280 290 570 4 C Street Transfer Center #1 Gold Coast 220 340 560 5 4th and B Street #1 Gold Coast 500 20 520 6 4th and B Street #2 Gold Coast 20 490 510 7 Ventura Transit Center (VTC) VCTC Intercity 230 210 440
Source: 2018 Gold Coast, VCTC Intercity, Thousand Oaks Demand Response Transit Demand‐Response Transit (DRT) or Dial‐A‐Ride (DAR) is a non‐fixed route, flexible transit service providing curb‐to‐curb or door‐to‐door pickups and drop‐offs of passengers in response to calls from passengers to the transit operator, who then dispatches a vehicle to pick up the passengers and transport them to their destinations. Table 13 provides a summary of DRT annual ridership served by each transit provider.
Table 13 – On-Demand Annual Ridership FF 2017
OPERATIONAL CHARACTERISTICS GOLD COAST VCTC
INTERCITY THOUSAND
OAKS CAMARILLO
Boardings 102,400 25,300 83,900 96,900 Total Revenue Miles 735,000 173,800 632,500 272,500 Total Revenue Hours 49,200 11,200 37,700 26,300 Operating Cost $3,028,900 $740,300 $2,929,000 $1,541,000 Operating Speed (mph) 14.9 15.5 16.8 10.3 Passengers per Rev Hr 2.1 2.3 2.2 3.7 Cost per Passenger $29.57 $29.30 $34.93 $15.89 Peak Vehicles 23 10 18 14 Source: 2017 NTD Passenger Rail Metrolink is Southern California’s commuter rail operator in Los Angeles, Orange, Riverside, San Bernardino and Ventura counties. The Ventura County Line serves three stations within the study area including East Ventura, Oxnard, and Camarillo. From these stations, 3 trains operate weekdays to Los Angeles (Union Station), with return trips in the afternoon and evening. Daily weekday ridership on the Ventura County Line averages 3,700 boardings (Metrolink, 2018). The railroad right‐of‐way used for passenger travel in the study area is owned by Union Pacific Railroad, which operates freight trains on those same tracks. Amtrak operates commuter rail between San Luis Obispo, Los Angeles, and San Diego on its Pacific Surfliner line, with stations in Ventura, Oxnard and Camarillo in the Corridor study area. The Pacific Surfliner line operates five northbound trains and six southbound trains daily. Figure 22 provides a map of commuter rail system in the study area.
Figure 22 – Metrolink and Amtrak Services

VCTC US 101 Communities Connected Study | 26
Ridership Trends Levels of transit service and ridership in the study area have decreased, a trend experienced by much of the public transit industry. Speculations about the cause of the decline includes, but is not limited to, the rise of transportation network companies such as Lyft and Uber, and improvements in the general economy and wages that makes it possible for more people to own and operate their own vehicles. A 2018 SCAG study entitled Falling Transit Ridership: California and Southern California, attributes the decline in transit ridership primarily to increased motor vehicle access, particularly among low‐income households that have traditionally served as the region’s most frequent and reliable transit users. Studies also note that decreased ridership reduces funds available for transit service. Park and Ride Ten Park & Ride facilities provide over 1,000 free parking spots in the study area, as illustrated in Figure 23. Eight out of 10 of the facilities are along the US 101 Corridor. Each Metrolink rail station has a Park & Ride facility for Metrolink riders only. Table 14 includes a summary of all Park & Ride facilities.
Figure 23 – Park and Ride
Table 14 – Park & Ride Facilities
FACILITY LOCATION CITY SPACES 6175 Ventura Blvd (Metrolink Only) Ventura 55 Lockwood & Factory Outlet Center Oxnard 72 2621 E. Ventura Blvd Oxnard 20 201 E. Fourth St. (Metrolink Only) Oxnard 75 690 Ventura Blvd Camarillo 122 30 N Lewis Rd (Metrolink Only) Camarillo 220 US 101 and Santa Rosa Rd Camarillo 141 475 Rancho Conejo Blvd Thousand Oaks 183 Rancho Rd & SR 23 & US 101 Thousand Oaks 183 SR 23 & Janss Rd Thousand Oaks 94
Total 1,165 Source: VCTC; go511.com 2.5.2. Active Transportation Active and low‐speed transportation are an important part of the Ventura County multi‐modal transportation system. For purposes of this study, low‐speed transportation is defined as alternative travel modes that operate at lower speeds than conventional automobiles and focus on non‐polluting means of propulsion, including walking, cycling, scooters, and neighborhood electric vehicles. Active transportation is also key to supporting transit riders, as many transit trips start and/or end on foot. As stated in the 2016 SCAG RTP/SCS, Ventura County has some active transportation connections between local jurisdictions (such as Ventura to Ojai), but lacks regional bike routes and signage. For example, bicycle connectivity between Thousand Oaks and Camarillo is limited. VCTC completed its Bicycle Wayfinding Plan in 2016 to improve the convenience and safety of people traveling by bike in Ventura County. Funding to complete implementation of the Plan is limited. The State of California recognizes four types of bikeway facilities– Class I, Class II, Class III, and Class IV facilities. Class I facilities are multi‐use paths, often referred to as bicycle paths physically separated from motor vehicle routes. They are intended to accommodate multiple user groups, including cyclists, pedestrians, and, in some cases, Neighborhood Electric Vehicles (NEVs). NEVs are battery electric vehicles typically built to have a top speed of 25 miles per hour and weigh less than 3,000 pounds. NEVs are typically quadricycles. Class II facilities are referred to as bicycle lanes and provide exclusive space for cyclists on roadways. Class III facilities are bicycle routes designated by signage and painted “sharrows” in vehicle lanes. Class IV facilities are separated bikeways or “bicycle boulevards,” which are physically separated from motor traffic with a vertical feature, such as a curb. Figure 24 shows the existing bikeway facilities in Ventura County. Table 15 depicts the miles of existing bikeways in Ventura County.

VCTC US 101 Communities Connected Study | 27
Figure 24 – Bikeway Facilities
Table 15 – Miles of Existing Bikeways (2012)
BICYCLE FACILITY TYPE STUDY AREA VENTURA COUNTY Class I 33 80 Class II 217 361 Class III 48 70 Class IV 1 1
Total 299 512 Source: SCAG’s RTPSCS, Active Transportation, 2016
VCTC Existing Bike Lane Inventory 2018 by City by Class – Centerline Miles Location of Non‐Motorized Commutes Only 0.7 percent of commuters living in the study area bike to work, or around 1,500 workers. The 1,500 workers who bike to work within the study area represent 65 percent of all Ventura County bike commuters. Workers who commute by bicycle are concentrated in Ventura, Oxnard, and Camarillo. A higher concentration of bicycle commuters is located in Ventura communities south of US 101 along the coast and along Telegraph Road. In Oxnard, communities with a high number of bicycle commuters are concentrated along Oxnard Boulevard and near St. John’s Regional Medical Center. In Camarillo, bicycle commuters primarily live in communities east of SR 34. Figure 25 illustrates the aggregate share of workers who commute by bike by census tract in the study area.
Figure 25 – Workers Commute by Bicycle
Source: 2017 American Community Survey (5-year) 1.8 percent of commuters living in the study area walk to work, or around 3,800 workers. The 3,800 workers who walk to work in the study area represent 54 percent of all Ventura County walk commuters. Workers who commute by walking are concentrated in Ventura, Camarillo, and Thousand Oaks. In Ventura, a higher number of commuters who walk to work live in neighborhoods south of SR 126. In Camarillo, commuters who walk are concentrated in neighborhoods proximate to commercial centers north of US 101. In Thousand Oaks, walking commuters live in near commercial development along Rancho Conejo Boulevard. Commuters who walk to work also live in agricultural areas in unincorporated County areas. Figure 26 illustrates the aggregate share of workers who commute by walking by census tract in the study area.

VCTC US 101 Communities Connected Study | 28
Figure 26 – Workers Commute by Walking
Source: 2017 American Community Survey (5-year) As discussed in the Travel Markets and Patterns section, a very small proportion of corridor commuters use transit and active transportation. Despite the wide‐range of transit and active transportation facilities discussed above, auto is by far the most preferred means of travel. Travelers will consider riding transit (or non‐motorized modes) when they believe the mode has the lowest relative costs as measured by money, time, and uncertainty. If transit is cheaper, faster, and more reliable than driving, travelers are more likely to choose transit over driving to get to their destinations. To make non‐auto modes more attractive, future improvement projects can target transit service enhancements and multimodal infrastructure improvements – both within and between jurisdictions. Though driving will remain a necessary choice for some people, improving and increasing the use of transit and active travel will result in decreased auto congestion, better transit performance, and enhanced multi‐modal networks in the corridor.
2.6. Safety No transportation facility is designed to be unsafe, however, areas with high incidents of recurring collisions may need additional safety‐focused countermeasures to address specific issues. These may include additional
warning signs in areas of limited visibility or auxiliary lanes and other supportive facilities where breakdowns occur. To analyze the safety within the study area, vehicle collision data was collected for the three‐year period from January 1, 2016 to December 31, 2018. The collision data was obtained from the UC Berkeley Transportation Injury Mapping System (TIMS) website and modified to standardize primary and secondary street names and add geographic coordinates where missing. TIMS data comes from the California Highway Patrol (CHP) Statewide Integrated Traffic Records System (SWITRS). Comparing the study area to the countywide collision data, the frequency and type of collisions are consistent countywide and within the study area encompassing the urbanized core of the county as shown in Tables 16 and Table 17. Approximately half of the vehicle collisions in Ventura County occur in the US 101 Corridor, with ten percent on US 101 itself. US 101 has the majority of the pedestrian, bicycle and truck involved collisions, but a minority of motorcycle collisions. While the number of overall injury collisions is higher in the study area as compared to the county as a whole, the severity of those injuries is relatively lower—due to lower speeds in the urbanized areas. Additional information regarding traffic safety in the study area, including accident analysis of Caltrans Traffic Accident Surveillance and Analysis System (TASAS) data and City records, will be available in the upcoming US 101 HOV PA&ED report.
Table 16 – Type of Collision
INVOLVED WITH TOTAL IN COUNTY STUDY AREA TOTAL STUDY AREA AS PERCENT OF COUNTY TOTAL All Collisions 12,106 6,904 57% Pedestrian 689 381 55% Bicycle 770 415 54% Motorcycle 746 360 48% Truck 344 176 51%
Table 17 – Injury Collisions
TYPE OF INJURY COUNTY STUDY AREA STUDY AREA AS PERCENT OF COUNTY
Fatal 162 68 42% Severe Injuries 819 368 45% Visible Injuries 4,555 2,581 57% Complaint of Pain 11,611 6,748 58% Total Injuries 17,147 9,765 57%

VCTC US 101 Communities Connected Study | 29
2.6.1. Study Area Collisions Overall, there were 6,904 collisions resulting in 9,765 injuries and 68 deaths in the study area from January 1, 2016 to December 31, 2018 according to the TIMS data, as shown in Table 18. Approximately 20 percent or 1,400 collisions were on the US 101 mainline, and 28 percent of collisions were located on or adjacent to study area state highways (inclusive of US 101). Pedestrian and bicycle involved collisions accounted for approximately six percent of total collisions each. 20 percent of pedestrian/vehicle incidents resulted in fatalities, and nearly every pedestrian and bicycle involved collision resulted in an injury due to the vulnerability of persons traveling by walking or biking as compared to vehicles.
Table 18 – Collision Types and Injuries STUDY AREA COLLISIONS NUMBER PERCENT INJURIES AND
FATALITIES PERCENT
Total Collisions 6,904 100% 9,765 100% Pedestrian Collisions 431 6.2% 417 4.3% Bicycle Collisions 452 6.5% 420 4.3% US 101 Mainline 1,400 20.3% 1,944 19.9% All State Highways 1,933 28.0% 2,696 27.6% 2.6.2. US 101 Freeway The vast majority of collisions along the US 101 freeway are rear‐end collisions (63 percent of total) caused by unsafe speed (65.5 percent of total and 92 percent of rear‐end collisions). Rear‐end collisions are caused by following too closely to react to periodic slow‐downs in the flow of the freeway and are generally focused around areas of changing topography, visibility, and vehicle weaving conditions. The other most common type of collisions are hit object collisions (18 percent) and sideswipe collisions (9 percent). Top collision hot spots along the mainline of US 101 (from north to south) are near Victoria Avenue in Ventura; Rose Avenue in Oxnard; Camarillo Springs Road in Camarillo, Wendy Drive, Ventu Park Road, Lynn Road, and Moorpark Road in Thousand Oaks. Figure 27 illustrates the accident locations on US 101 including ramps in the study area. Overall, 389 collisions occurred on state highway ramps in the study area with another 229 occurring within 250 feet of a ramp, but not on the state highway itself. Thousand Oaks had the highest concentration of collisions on ramps. Locations with the highest number of ramp collision locations serving US 101 are Victoria Avenue in Ventura; Oxnard Boulevard and Rose Avenue in Oxnard; and Moorpark Road, Hampshire Road, Ventu Park Road, Hillcrest Drive, and Lynn Road in Thousand Oaks.
Figure 27 – US 101 Collisions
2.6.3. Corridor Arterials As illustrated in Figure 28, corridor arterials with US 101 interchanges with high share of collisions within the study area are (from north to south):
Main Street, Telephone Road, and Victoria Avenue in Ventura E. Vineyard Avenue (SR 232) and Rose Avenue south of US 101 in Oxnard Las Posas Road, Carmen Drive, Arneill Road, and Pleasant Valley Road in
Camarillo Rancho Conejo Boulevard, Ventu Park, Lynn Road, Moorpark Road and
Westlake Boulevard in Thousand Oaks Parallel arterial corridors with a high number of collisions are:
Main Street in Ventura Gonzales Road in Oxnard Central Avenue and SR 118 in the unincorporated area between Oxnard
and Camarillo Las Posas Road north of Earl Joseph Avenue and 5th Street/Lewis Road
(SR 34) in Camarillo Hillcrest Drive, Thousand Oaks Boulevard in Thousand Oaks

VCTC US 101 Communities Connected Study | 30
Figure 28 – Arterial Collisions
2.6.4. Pedestrian and Bike Collision Locations The pedestrian and bike collisions are illustrated in Figures 29 and 30. The top study area locations for pedestrian involved collisions are Gonzales Road at Rose Avenue in Oxnard and 5th Street at Ventura Road in Oxnard and Telephone Road at US 101 and Victoria Avenue at SR 126 in Ventura. The number of bicycle‐involved collision hot spots are concentrated around US 101 interchange and ramp‐area locations such as:
Along Main Street in Ventura (especially near the US 101 and SR 33 interchange and US 101 and SR 126 interchange.
Specific locations of concentrated bicycle‐involved collisions are Thousand Oaks Boulevard between SR‐23 and Conejo School Road in Thousand Oaks, Moorpark Road between Thousand Oaks Boulevard and Janss Road in Thousand Oaks, and Westlake Boulevard between Hampshire and Triunfo Road in Thousand Oaks, Thille Street at Victoria Avenue in Ventura, Oxnard Boulevard and Gonzales Road in Oxnard, and Main Street at Mills Road in Ventura.
Figure 29 – Pedestrian Collisions
Figure 30 – Bike Collisions

VCTC US 101 Communities Connected Study | 31
2.7. Existing Challenges The Existing Conditions analysis highlights the overall state of the US 101 Corridor today. The US 101 freeway has been the backbone for Ventura County and has supported much of the area’s population and economic growth. However, as travel demands have grown, the existing transportation network has shown some deficiencies. Key findings from the analysis include:
As the corridor has grown and continued to rely primarily on auto travel, freeways and arterials have exceeded capacity and become more congested – particularly during peak commute hours. The most significant freeway congestion is on the eastern portion of US 101 in the cities of Camarillo and Thousand Oaks.
A significant portion of study area commuters living in Camarillo travel to Thousand Oaks for work. A significant portion of study area commuters living in Oxnard travel to Ventura for work.
Transit and active transportation modes present a very small share of trips in the corridor. The corridor has a variety of transit services and active transportation facilities, but additional service enhancements and network improvements are needed to make these modes more attractive.
There were 6,904 collisions resulting in 9,765 injuries and 68 deaths on roadways in the study area from 2016 to 2018. Enhancing the safety of the existing roads for all users remains a key priority.

VCTC US 101 Communities Connected Study | 32
3 FUTURE CONDITIONS Following the Existing Conditions assessment, the next step of the US 101 Communities Connected planning process is to identify future mobility deficiencies and gaps in the transportation infrastructure by analyzing future multimodal travel demand in the study area. This Future Conditions Report identifies transportation issues that the study area is expected to face over the next 20 years. Analysis of the Ventura County Traffic Model (VCTM) helps to understand future land use, demographics, infrastructure improvements, and expected travel demand on the transportation system in 2040. Projected 2040 land use and demographic conditions are based on county, regional, and local transportation and land use plans, population forecasts from the SCAG 2016 RTP and VCTM. Transportation system conditions in 2040 are based on planned improvements to the existing system (transportation projects with funding commitments) that are included in existing planning documents (Capital Improvement Plans, Short‐Range Transit Plans, Transportation Improvement Programs, and the Regional Transportation Plan). Overall, the projected multimodal travel demand is expected to be similar to Existing Conditions given generally modest population and employment growth. Existing land use ordinances that protect agricultural and open space land, and limit growth outside of existing urban boundaries, are also expected to contribute to the modest growth forecast. Even modest population and employment growth will impact the transportation network through increased travel demand, which is expected to push travel volumes on the existing and planned network to its full capacity. As traffic congestion is a non‐linear phenomenon, modest growth in traffic can lead to significant increase in congestions and delays for vehicular travel – which will continue to represent the vast majority of travel in the region – roadways that previously met or exceeded capacity during peak travel periods will see worsened traffic congestion and increased overall travel times. However, increased congestion coupled with intensified land uses will produce opportunities for carpooling, transit, and non‐motorized travel modes in the corridor, which are able to support higher person throughput than single occupancy vehicle travel. Transportation demand management programs that encourage and incentivize telework can also reduce demand on the roadways.
3.1. Land Use Demographics 3.1.1. Potential Areas of Future Land Use Intensification Current zoning in the study area allows for potential higher intensity development in key areas. These areas are typically located adjacent to the current highest intensities of existing development in the corridor (which occurs primarily within corridor cities).

VCTC US 101 Communities Connected Study | 33
Figure 30 and Figure 31 highlight areas where current zoning allows for future development that exceeds intensities of the current land use. As seen in the figures, these areas are directly adjacent to US 101 and proximate to the two areas of concentrated development perpendicular to the freeway in Oxnard and Ventura. Areas within the SOAR boundary, which includes most of the unincorporated areas, are not permitted to intensify without rezoning and voter approval. The following is a city by city summary of areas with potential for future development. In Ventura, additional commercial and residential development is largely focused in the historic downtown core between Highway 33 and Hemlock Street. The greatest concentrations are centralized in the blocks surrounding Main Street and California Street. Flanking the commercial corridor of Ventura Avenue, additional multi‐family housing is an allowable use with over 600 unbuilt units permitted. In the eastern portion of the City, zoning allows for additional commercial and industrial development. In Oxnard, potential areas of land use development are concentrated in the historic downtown and civic center, which are both zoned for a mix of uses. To the west and north of this core are areas where additional multi‐family housing is allowable. There are opportunities to link this land use with the Oxnard Boulevard corridor and the multi‐agency transit station that lies within the central business district. Potential future development areas are located in the eastern portion of the city south of US 101 where business park uses, and light industrial areas are permitted by a number of specific plans. Two potential areas in Camarillo, near US 101, may intensify based on current zoning. In the western portion of the City, north of Camarillo Airport, zoning allows for commercial and industrial development where the land is currently vacant. However, this area is subject to the Airport Comprehensive Land Use Plan for Ventura County. In the vicinity of Camarillo’s central core, zoning permits commercial and multifamily development. Much of this area is already built out at a low scale. Areas where additional housing or mixed‐use development may occur includes Ponderosa Center, a low‐rise shopping center. Limited opportunities for growth exist in Thousand Oaks as many of the areas where commercial and multi‐family development is allowable have been mostly built out. Opportunities are concentrated on Thousand Oaks Boulevard where the additional development of mixed‐use, residential, commercial, and office uses are authorized through the Thousand Oaks Boulevard Specific Plan.
Figure 30 – Potential Areas of Land Use Intensification, West
Data Source: SCAG
Figure 31 – Potential Areas of Land Use Intensification, East
Data Source: SCAG

VCTC US 101 Communities Connected Study | 34
3.1.2. Efficient Land Use Indicators A number of land use policy initiatives can be used by the local jurisdictions to incentivize development, distribution, and density of uses that enhance access to and utilization of transit; promote walkability and bicycle use; and reduce single occupancy vehicle trip generation, VMT, and GHG emissions. These solutions, some of which are adopted from the Congested Corridor Program by the California Transportation Commission (CTC), include:
Implementation of a by‐right (nondiscretionary) approval process, adopted or in development, for multifamily residential and mixed‐use development
Streamlined plan‐level environmental analysis for multifamily residential and/or mixed‐use development within or adjacent to specific plan areas
Implementation of a density bonus ordinance, adopted or in development, whose allowable density increase exceeds the requirements of State Density Bonus Law
Implementation of an ordinance or other policy, adopted or in development, allowing reduced parking requirements for all sites zoned for multifamily residential or mixed‐use development.
Streamlining of CEQA Transportation Assessment for in‐fill development projects
3.1.3. Population and Employment Existing and forecasted population, household, and employment information was compiled for the study area from VCTM socioeconomic data. Table 19 illustrates the forecasted population, household and employment information for each city and unincorporated area of Ventura County in the study area, with comparisons to the existing context in parentheses. Overall, the population and number of households in the study area are expected to increase by 19 percent to 499,254 persons and 169,476 households over the next 20 years. Over the same period, the average household size throughout the study area is expected to decrease from 3.0 people per household to 2.9 people per household. This means housing unit development will increase at a greater rate than population due to the aging population and smaller overall household size. Future population density is mapped in Figure 32.
Table 19 – Existing and Future Population and Households
CITY OR COUNTY
EXISTING (2018) FUTURE (2040)
POPU
LATION
HOUSEHO
LDS
PEOPLE PE
R HO
USEHO
LD
POPU
LATION
(CHA
NGE)
HOUSEHO
LDS
(CHA
NGE)
PEOPLE PE
R HO
USEHO
LD
(CHA
NGE)
Ventura 94,317 36,033 2.6 110,344 (17%)
41,886 (16%)
2.6 (0%)
Oxnard 105,359 26,795 3.9 131,211 (25%)
36,331 (36%)
3.7 (‐4%)
Camarillo 61,284 23,020 2.7 77,967 (27%)
29,484 (28%)
2.6 (‐2%)
Thousand Oaks 115,240 41,431 2.8 125,882 (9%)
44,500 (7%)
2.8 (0%)
Unincorporated 45,257 14,659 3.1 53,850 (19%)
17,275 (18%)
3.1 (0%)
Total 421,457 141,938 3.0 499,254 (19%)
169,476 (19%)
2.9 (‐1%)
Data Source: VCTM
Figure 32 – Future Population Density

VCTC US 101 Communities Connected Study | 35
The number of jobs in the study area are expected to increase at more than double the rate of population growth (45 percent) to 288,570 jobs. The overall population to employment ratio is expected to decrease by from 2.12 to 1.73 between today and 2040, indicating the potential for decreased trips from residents to jobs outside of the study area and/or increased trips by residents to jobs within the study area from elsewhere, leading to overall better jobs/housing balance. Population, household, and employment information is shown in Table 20. Future employment density is mapped in Figure 33.
Table 20 – Existing and Employment and Employment Ratios
CITY OR COUNTY
EXISTING (2018( FUTURE (2040)
EMPLOYM
ENT
POP/EM
PLOYM
ENT
RATIO
HOUSEHO
LDS/
EMPLOYM
ENT
RATIO
EMPLOYM
ENT
(CHA
NGE)
POP/EM
PLOYM
ENT
RATIO (C
HANGE)
HOUSEHO
LDS
/EMPLOYM
ENT
RATIO (C
HANGE)
Ventura 71,992 1.31 0.50 81,238 (13%)
1.36 (4%)
0.52 (4%)
Oxnard 30,889 3.41 0.87 92,919 (201%)
1.41 (‐59%)
0.39 (‐55%)
Camarillo 9,282 6.60 2.48 10,409 (12%)
7.49 (14%)
2.83 (14%)
Thousand Oaks 69,024 1.67 0.60 80,583 (17%)
1.56 (‐7%)
0.55 (‐8%)
Unincorporated 17,274 2.62 0.85 23,421 (36%)
2.30 (‐12%)
0.74 (‐13%)
Total 198,461 2.12 0.72 288,570 (45%)
1.73 (‐18%)
0.59 (‐18%)
Data Source: VCTM
Figure 33 – Future Employment Density
Camarillo is expected to grow by the highest percentage of population (27 percent) by 2040, with Oxnard close behind (25 percent). Thousand Oaks is expected to grow at the lowest rate (nine percent) over the same period. However, Oxnard is expected to add the most households (36 percent) and decrease its average people per household size by the largest amount (eight percent decrease). Despite the forecasted increase in households, Oxnard retains the highest average people/household at 3.6. Thousand Oaks is forecast to see the least household growth in the study area by 2040 (seven percent). The forecasted growth in jobs is by far most dramatic in Oxnard, with an increase of 201 percent forecast. Of the 90,109 jobs expected to be added in the study area by 2040, 62,030 (69 percent) will be in Oxnard. The next highest employment growth percentage is in the unincorporated areas of the County (36 percent). The least employment growth is forecast for Camarillo (12 percent). With job growth expected to outpace population growth in the study area over the next 20 years, Oxnard (59 percent decrease), Thousand Oaks (seven percent decrease) and unincorporated areas of the County (12 percent decrease) are all expected to decrease their population to employment ratios. Oxnard may see the most significant change in commute patterns as a result, with more people commuting to a workplace within the city and/or fewer residents leaving the city to work in other areas. Ventura is forecast to increase its population to employment ratio slightly (four percent), while Camarillo’s ratio is expected to increase more significantly (14 percent).

VCTC US 101 Communities Connected Study | 36
3.2. Travel Market Due to population and job growth, travel in the study area is expected to grow by approximately 11 percent by 2040. Approximately 2.8 million daily auto trips will be made every day by residents and employees in the County. Trips in the study area will continue to represent approximately half of all trips in Ventura County as the county’s primary residential and job centers are expected to remain concentrated within the four incorporated cities along the US 101 Corridor in 2040. The majority of daily trips are expected to continue to be auto‐trips since the corridor area is anticipated to remain auto‐centric. Future mode split reflects the lack of significant changes to transit and non‐motorized infrastructure due to limited scopes of funded improvement projects. This means transit and non‐motorized mode shares are not expected to change in the future as shown in Table 21. Using the VCTM, 85 percent of daily trips are by car in the study area in both 2018 and 2040. High auto use is often found in suburban and rural areas with low‐density land uses like the US 101 Corridor. Transit accounts for just half of one percent of daily trips. Notably, when examining auto trips, a sizable portion of trips include carpoolers. 66 percent of auto trips are drive alone and 19 percent carpool, as shown in Table 21. The non‐motorized trips are approximately 15 percent of all daily trips.
Table 21 – 2018 and 2040 Mode of Travel Within Study Area
MODE OF TRAVEL 2018 2040 Drive Alone 860,750 66% 947,000 66% Carpool 249,250 19% 277,000 19% Transit 6,025 0.5% 6,100 0.4% Non‐Motorized 190,250 15% 206,000 14% Total 1,306,275 100% 1,436,100 100%
Future daily auto trips were examined to gain insight into the future activity patterns of travelers in the region. Travel patterns between Existing Conditions and 2040 are expected to be similar. The majority (59 percent) of daily trips are internal‐internal trips, meaning they both originate and end within the corridor study area. This rate is slightly higher than the Existing Conditions trips (58 percent). For all corridor cities, city‐to‐city trip analysis shows the plurality of trips stay within each city (intra‐city trips). The largest city‐to‐city flow is between Oxnard and Ventura. 23,000 trips originate in Oxnard and end in Ventura – 1,000 fewer trips compared to the Existing Conditions – and 23,000 trips originate in Ventura and end in Oxnard each day – on par with the Existing Conditions data. Daily flows of all trips between origin‐destination pairs are summarized in Table 22.
Table 22 – 2040 Daily Flow / Travel Patterns Within Study Area
ORIGIN/ DESTINATION CAMARILLO OXNARD VENTURA THOUSAND
OAKS OTHER
DESTINATIONS Camarillo 64,000 15,000 6,000 13,000 48,000 Oxnard 15,000 184,000 23,000 6,000 116,000 Ventura 6,000 23,000 259,000 2,000 74,542 Thousand Oaks 13,000 5,000 2,000 227,000 136,328 Other Origins 49,000 115,000 74,000 139,000 43,649,000
Data Source: VCTM
In addition, approximately 14,000 daily through vehicle trips occur along the corridor. This represents approximately an eight percent decline from the Existing Conditions data. The remaining trips travel to or originate from outside of the study area (internal‐external and external‐internal trips). Approximately 27 percent of trips stay within Ventura County, 11 percent are to/from Los Angeles County and beyond, and two percent are to/from Santa Barbara County and points west. Through daily trips using US 101 is estimated to grow by 15 percent to 14,000. These trip patterns are similar to those experienced in Existing Conditions. The generalized origin and destination of auto trips are illustrated in Figure 34.
Figure 34 – Future Daily Auto Trips in and to/from the Corridor
Data Source: VCTM

VCTC US 101 Communities Connected Study | 37
3.3. Freeway and Arterials/Local Streets Highway and arterial systems function as the backbone of the corridor’s overall transportation network and facilitates the movement of people and goods through the study area. As shown in Table 23, general purpose lanes will not be added to US 101 with exception of a few auxiliary lanes by 2040. The principal and minor arterials lane miles are expected to grow by 4.5 and 1.6 percent, respectively.
Table 23 – Existing and Future Lane Miles
TYPE EXISTING 2040 % CHANGE US 101 Freeway 286 288 0.0% Principal Arterials 872 911 4.5% Minor Arterials 379 385 1.6%
Data Source: VCTM VMT is a good indicator of total amount of travel, as it includes both the number of trips as well as the length of travel. Vehicle Hours Traveled (VHT) is also a good indicator of amount of travel as it provides information on total time spent traveling by persons and by a specific mode and/or facility. The corridor’s VMT and VHT are approximately 50 percent of the County’s VMT and VHT. Over half of all VMT in the study area in 2040 will be on US 101. VMT is projected to grow seven percent between Existing Conditions data and 2040 on US 101. Congestion on US 101 will increase in response to growth in travel demand and VMT. Portions of the highway are already over capacity during AM and PM peak periods (as stated in the Existing Conditions) and are expected to experience more constrained traffic operations in the future. Future VHT will be 18.4 percent higher in 2040 and average speed will fall 9.4 percent to 45.8 miles per hour. Approximately 40 percent of all VMT in the study area in 2040 will be on principal arterials. Between Exiting Conditions and 2040, VMT will grow 19 percent on principal arterials, which is significantly faster than VMT increase on US 101. There will be a slight increase in congestion on principal arterials facilities. Future VHT will be 20.5 percent higher in 2040 and average speeds will fall 1.2 percent to 36.7 miles per hour. Around seven percent of all VMT in the study area in 2040 will be on minor arterials. Similar to principal arterials, between Existing Conditions data and 2040, VMT is projected to grow 19.7 percent. There will be a slight increase in congestion on minor arterial facilities. Future VHT will be 25 percent higher in 2040 and average speeds will fall 4.2 percent to 29.5 miles per hour. Existing and future traffic volumes on the three main road facility types is
summarized in Table 24. As shown, VHT grows at a higher rate than VMT due to facilities reaching their operational capacity. AM and PM peak hour LOS on select freeways and arterials are illustrated in Figure 34 and Figure 36, respectively.
Table 24 – Existing and Future Volumes
LOCATION
EXISTING (2018) FUTURE (2040) % DIFFERENCE
VMT VHT AVG. SPEED (MPH)
VMT VHT AVG. SPEED (MPH)
VMT VHT AVG. SPEED (MPH)
US 101 Freeway 4,965,000 98,000 50.7 5,315,000 116,000 45.8 7.0% 18.4% ‐9.6%
Principal Arterials 3,086,000 83,000 37.2 3,672,000 100,000 36.7 19.0% 20.5% ‐1.2%
Minor Arterials 589,000 20,000 29.5 705,000 25,000 28.2 19.7% 25.0% ‐4.2%
Data Source: VCTM
Figure 35 – Future AM LOS on Freeways and Arterials
Data Source: VCTM

VCTC US 101 Communities Connected Study | 38
Figure 36 – Future PM LOS on Freeways and Arterials
Data Source: VCTM 3.3.1. Freeway By 2040, average daily trips on segments of US 101 will increase between 4 and 24 percent on individual segments US 101across the study area. The segments that are expected to see the largest growth (24 percent) are near the employment centers in Ventura, Camarillo, and Thousand Oaks. The freeway is estimated to carry its highest volumes, over 200,000 daily trips, in Thousand Oaks on the east side of the corridor near SR 23, gradually decreasing to approximately 150,000 daily trips in mid‐corridor in Camarillo, and over 100,000 daily trips in Ventura on the west side of the study area. The expected increase in trips will worsen traffic flow on the freeway system, particularly in Thousand Oaks and Camarillo where there are already congested conditions on various segments during AM and PM peak periods as shown in Figure 35 and Figure 36. The Future Conditions data shows there is less congestion on the western portion of the corridor; however, the significant increase in traffic on segments in Ventura and Oxnard is expected to worsen traffic operations in that portion of the corridor in the future. The Ventura area is forecasted to have the largest employment growth in the study area. Operational or capacity enhancing improvements on US 101 can help accommodate the projected increase in travel demand while also maintaining traffic flow. Table 25 presents a summary of existing and future US 101 traffic volumes.
Table 25 – Existing and Future US 101 Volumes
LOCATION DIRECTION ADT
EXISTING (2018)
FUTURE (2040)
PERCENT GROWTH
Between Westlake Blvd & Thousand Oaks Blvd NB 91,300 99,100 8.5%
Between Westlake Blvd & Thousand Oaks Blvd SB 68,300 74,200 8.6%
Between Lynn Rd & Wendy Dr NB 75,600 80,500 6.5% Between Lynn Rd & Wendy Dr SB 79,800 84,100 5.4% South of Santa Rosa Rd NB 64,800 69,700 7.6% South of Santa Rosa Rd SB 72,600 76,200 5.0% Between Del Norte Blvd & Rice Ave NB 59,000 65,400 10.8% Between Del Norte Blvd & Rice Ave SB 61,000 66,800 9.5% Between Ventura Rd & Victoria Ave NB 70,400 72,100 2.4% Between Ventura Rd & Victoria Ave SB 74,400 76,900 3.4% South of Ventura Ave SB 49,500 58,900 19.0%
Data Source: PeMS; VCTM 3.3.2. Arterial/Local Streets By 2040, arterials and local streets in the corridor will see a higher rate of increased travel demand compared to the freeway as shown in Table 26. VMT and VHT will increase on arterials and local streets due to a general increase in average daily trips and increased congestion. Five of the most heavily used arterials in the study area will have an increase in average daily trips between 3.9 and 21.5 percent. It will be important that local agencies both maintain existing arterials and local streets while implementing improvements on roads that have exceeded or are reaching their capacity and considering transportation alternatives to offset increased demand.
Table 26 – Existing and Future Arterial Volumes
ARTERIAL DIRECTION JURISDICTIONS ADT
EXISTING (2018)
FUTURE (2040)
% DIFFERENCE
Victoria Avenue North‐South Ventura; Oxnard 44,900 47,700 6.2% Rice Avenue North‐South Oxnard 36,700 44,600 21.5% Santa Rosa Road East‐West Camarillo 22,100 23,100 4.5% Harbor Boulevard North‐South Ventura; Oxnard 21,700 24,300 12.0% Moorpark Road East‐West Thousand Oaks 20,700 21,500 3.9%
Data Source: CMP; VCTM
VCTC US 101 Communities Connected Study | 39
3.4. Transit and Active Transportation While travel in the corridor is expected to remain generally auto‐centric, transit and active transportation will continue to play a vital role in the corridor’s multi‐modal transportation network, particularly by providing mobility for households or travelers with no or limited access to vehicles. Traditionally, these are low‐income households and elderly and disabled travelers. Transit and non‐motorized modes are expected to continue to represent approximately two to three percent of trips under baseline conditions. Increasing congestion coupled with intensifying land uses will produce additional opportunities for carpooling, transit, and non‐motorized travel mode investments to increase mode share in the corridor. The region and local agencies have made considerable strides to develop comprehensive transit and active transportation plans in the past decade. The region has taken preliminary steps to establish new services, fill funding gaps, and implement improvement projects. Future transit and active transportation plans and funding are discussed in the following sections. VCTC is currently leading a project called "Our Future 101" which is analyzing potential project alternatives within the 101 corridor (along a twenty‐seven‐mile stretch between State Route 23 in Thousand Oaks to State Route 33 in Ventura). One of the project alternatives includes the potential to have a high occupancy vehicle (HOV)/express bus lane along US 101. For suburban and rural areas with low‐density land uses, such as the US 101 corridor, an express bus lane has the opportunity to create similar transit advancements that Bus Rapid Transit (BRT) brings to dense urban areas. 3.4.1. Transit and Rail Ventura County countywide transit plans can be found in the VCTC FY 20‐21 Transit Needs Assessment, Ventura County Short Range Transportation Plan (SRTP,2015), Ventura County Comprehensive Transportation Plan (CTP, 2013), and Coordinated Public Transit‐Human Services Transportation Plan, 2016 Revision. VCTC is in the process of updating the SRTP, and an update to the CTP is planned for Fiscal Year 2020/2021. The corridor’s transit operators are concerned with expanding service, attracting additional riders, moving to zero‐emission vehicles and adopting new and improved technologies. In the wake of the COVID‐19 global pandemic that emerged in early 2020, transit operators are also concerned about continuing to meet essential transit service needs while ensuring the health and safety of the traveling public as well as bus drivers and other staff, in the face of anticipated reduced fare revenues and cuts to other funding sources.
Unmet transit needs in the study area described in the VCTC FY 18‐19. The comments that rose to the level of Unmet Needs mostly concern the Santa Clara valley. Two highly requested were service from Fillmore to Oxnard and service to Central Ave in Camarillo. Service to LA and more Metrolink service are common requests every year.
Shortfalls in transit service in the study area identified in the SRTP include a gap in transit service between South Oxnard to Camarillo; lack of transit center in the vicinity of downtown Ventura, Ventura College, and Government Center; and upgrading facilities at Hill Road and Thille Street transit stop.
Assessments also show Ventura County transit operators face increasing operating costs and often focus on how to maintain service within expected funding levels. The County’s Transit Asset Management (TAM) targets related to rolling stock, equipment, facilities, and infrastructure assets are to maintain current conditions through 2045.
Transit strategies that Ventura County has outlined in its Coordinated Public Transit‐Human Services Transportation Plan include: addressing information gaps, building capacity to fill mobility gaps, coordinate fixed route schedules, improve transit affordability, increase capital and infrastructure investment to enhance safety and mobility, and improve Dial‐A‐Ride service coordination.
The study area is served by Metrolink and Amtrak passenger rail service. The regional rail agencies and SCAG have several regional rail planning efforts. Metrolink is governed by the Southern California Regional Rail Authority (SCRRA) and the Amtrak service is governed by the Los Angeles – San Diego – San Luis Obispo (LOSSAN) Rail Corridor Agency.
SCRRA adopted a 2015 Strategic Assessment long‐range plan. LOSSAN developed a Corridor‐wide Strategic Implementation Plan
which emphasizes train monitoring, train and connecting bus schedule adjustments, improved connectivity with local transit services, equipment and crew utilization, response to service disruptions, and service planning.
LOSSAN also established the Pacific Surfliner South Service Development Plan (May 2013) to address corridor sustainability. The plan is in response to operational threats to service including climate change.
Regional rail strategies that SCAG has outlined in its long‐range plan include growing ridership, providing more frequent and new services, improving connectivity, and securing funding.

VCTC US 101 Communities Connected Study | 40
VCTC, in coordination with SCAG and local agencies, are programming improvement projects into existing funding programs. The current FTIP includes both committed and financially constrained project lists for Ventura County. The Solutions for Congested Corridors Program funding aims to fund transformative projects that make specific improvements designed to reduce congestion in highly traveled and highly congested corridors. Many of the projects on the Committed FTIP list currently qualify for funding because they expand or improve capacity, operational efficiency, safety, transit speed or reliability. The Financially Constrained Project list is focused on expansion of services and facilities, with projects extending out for over 40 years. Committed transit projects have been grouped into the following categories:
Passenger Rail Projects Capital and Demonstration Projects Planning, Marketing and Other Services Operating Assistance
Passenger Rail Projects These projects improve or expand stations, sidings and undercrossings. There is also funding for system‐wide preventative maintenance and purchase of rolling stock. Key passenger rail projects include the Constrained Plan Pacific Surfliner (Amtrak) Project; Metrolink East Ventura Area Maintenance Facility Environmental, Design, and Property project; and Metrolink SCORE Ventura County Line Service Improvement and Capacity Study complementary system enhancement projects including the Simi Valley Double Track project that is a part of SCORE. Capital and Demonstration Projects Capital projects fund new and replacement transit vehicles, transit centers, new transit technologies, bus stop improvements, shop equipment and electric charging infrastructure. Study area projects included in the 2019 FTIP include purchasing paratransit vehicles. Planning, Marketing and Other Services These projects cover on‐going planning and marketing efforts, including outreach and passenger awareness. System improvements such as fare collection, automatic vehicle location and ridership monitoring are also included.
Operating Assistance These projects fund operating assistance for fixed‐route and demand‐response services. Within the study area, two areas received a future High Quality Transit Area (HQTA) designation from SCAG. SCAG defines HQTA as areas within one‐half mile of major transit stops, and transit corridors based on the language in SB 375. The first corridor located in Ventura, and Oxnard connects the Metrolink/Amtrak rail stations and the areas around Victoria Avenue and Telegraph Road, which are well served by Gold Coast Transit District and VCTC Intercity bus service to meet required transit headways. The second area is the half‐mile circle around the Camarillo Metrolink/Amtrak rail station. Figure 37 shows the future SCAG HQTA.
Figure 37 – Future SCAG High Quality Transit Area (HQTA)
Source: SCAG 3.4.2. Active Transportation Active and low‐speed transportation, including walking, cycling, scooters, and neighborhood electric vehicles will continue to be an important and growing part of the Ventura County multi‐modal transportation system. These modes will continue to play similar roles in the transportation system in the future as the active transportation network grows more robust. Expansion of active and low‐speed transportation facilities will continue to connect travelers to nearby activity centers, add routes for workers to commute to workplaces, and provide opportunities for physical activity. Furthermore, as the transit system continues

VCTC US 101 Communities Connected Study | 41
to evolve, active transportation will remain key to supporting transit riders as many transit trips start and/or end on foot. A variety of improvements to active transportation facilities are planned throughout the corridor. Many proposed facility improvements target gaps in the existing pedestrian and bike network. The lack of bicycle connectivity between the four jurisdictions – particularly between the City of Thousand Oaks and the City of Camarillo – has been identified as a major deficiency in the current network. Study area projects included in the 2019 FTIP include pedestrian improvements, improvements to close bikeway and sidewalk gaps, and adding bikeways. The County and each jurisdiction have also undertaken various comprehensive planning efforts directly addressing active transportation. Ventura County has existing county‐wide active transportation plans such as the Ventura County Bike Plan (2007), County of Ventura Strategic Master Plan (2012), and the VCTC Bicycle Wayfinding Plan (2017). Each jurisdiction in the study area also has active transportation plans, such as the City of Camarillo Bikeway Master Plan (2017), City of Oxnard Bicycle and Pedestrian Master Plan (2011), City of Thousand Oaks 2019 Active Transportation Plan, and the City of Ventura Bicycle Master Plan (2011). The City of Oxnard has also developed an Oxnard Corridor Community Transportation Improvement Plan, including Complete Streets upgrades to Oxnard Boulevard. Other major arterials with proposed future active transportation improvements include Willow Lane, Conejo School Road, Rancho Road, Los Feliz Drive, 5th Street, Victoria Avenue, Thompson Boulevard, Telephone Road, and Carmen Drive. Collectively, plans call for approximately 162 miles of new bikeway facilities to be added to the 299 miles of existing bikeway facilities within the study area by 2040, including 53 miles of Class I facilities – multi‐use paths, often referred to as bicycle paths physically separated from motor vehicle routes. Future Class I facilities are primarily planned in the cities of Ventura and Oxnard. Facilities will improve accessibility within each city and improve connectivity between the cities. Camarillo also plans Class I facilities that improve connectivity within the city. Plans also call for 65 miles of Class II facilities – bicycle lanes providing exclusive space for cyclists on roadways – and 44 miles of Class III facilities – bicycle routes designated by signage and painted “sharrows” in vehicle lanes. Table 27 shows miles of future bikeways in the study area. Figure 38 depicts future bikeway facilities in Ventura County.
Table 27 – Growth in Miles of Future Bikeways (2012 to 2040)
BICYCLE FACILITY TYPE STUDY AREA Class I 53 Class II 65 Class III 44 Class IV 0
Total 162 Data Source: 2011 Ventura Bicycle Master Plan; Camarillo General Plan Circulation Element; City of Oxnard Bicycle & Pedestrian Facilities Master Plan; City of Thousand Oaks Proposed Bicycle Improvements
Figure 38 – Future Bikeway Facilities
Data Source: 2011 Ventura Bicycle Master Plan; Camarillo General Plan Circulation Element; City of Oxnard Bicycle & Pedestrian Facilities Master Plan; City of Thousand Oaks Proposed Bicycle Improvements 3.4.3. Transportation Safety Continued population and economic growth will increase demand on many of our existing roadways, increasing traffic density and making safety more critical than ever for the diverse population who use the multimodal transportation network daily. As established and shown in a wide range of literature, VMT and number of collisions have a direct relationship, and VMT increase results in a rise in collisions and deaths. The VMT is expected to grow in the study area by 12 percent, resulting in a similar increase in number of collisions. Traffic related fatalities and serious injuries are critical and preventable public

VCTC US 101 Communities Connected Study | 42
health and social equity issues. Providing a safe transportation network is essential to meet economic, housing, environmental, equity, and public health goals, and will require optimizing the existing system to have a safer multimodal transportation network. In 2015, the California Department of Transportation released an update to the Strategic Highway Safety Plan (SHSP) to reduce and mitigate the effects of accidents/incidents on traffic flow and efficiency. The SHSP recommends that the four “E”s of transportation safety – engineering, enforcement, education, and emergency response – become an integral part of the transportation safety program. The safety program should also support the Toward Zero Deaths (TZD) vision, a national strategy on highway safety that provides a framework for traffic safety planning efforts. The SHSP goals are as follows:
A three percent per year reduction for the number and rate of fatalities A 1.5 percent per year reduction for the number and rate of severe
injuries The Ventura County Service Authority for Freeway Emergencies (SAFE) is in the process of implementing a Freeway Service Patrol (FSP) program for the County’s highway network. The FSP program provides roving tow and/or service trucks on the highway network during peak traffic periods for rapid clearing of disabled vehicles and motorist assistance. The implementation of FSP is conducted through a partnership between Caltrans, the California Highway Patrol (CHP), and a local transportation agency such as SAFE. Two FSP beats are planned for US 101 within the study area to begin in December 2020, and a third beat will serve State Route‐118 outside of the study area. The program will strive to improve the safety of US 101 by reducing the amount of time that motorists and vehicles spend on the side of the road or disabled within freeway lanes, reducing opportunities for secondary incidents and improving traffic operations.
3.5. Future Challenges Over the next two decades, travel patterns in the study area are projected to be similar to Existing Conditions due to focused population and employment growth. The corridor area is unique in the Southern California region in that existing land use planning ordinances, policies, and guidelines in Ventura County and incorporated cities limit growth outside of existing urban boundaries. Despite the limited growth, the future transportation network still has many of the deficiencies identified under Existing Conditions. This means the current set of funded transportation projects is insufficient in meeting future transportation demand.
The existing and future transportation challenges will continue to have a direct negative impact on corridor travelers through increased travel times, limited multi‐modal network connectivity, and unsafe roadways. Continued reliance on private auto has negative externalities on the corridor community (and global environment) through air pollution and greenhouse gas emissions. Over time, the limitations of the transportation network could potentially have a negative effect on the region’s public health and economic progress. Though the corridor is expecting significant job growth, workers may be denied access to regional job centers either by lengthy commutes or lack of multi‐mobility options. Employers may have to consider a limited employment base. Planning for a robust multi‐modal transportation network and securing funding for improvement projects will play a key role in cultivating an improved US 101 corridor in the future. Findings from the Future Conditions analysis include:
Land use planning ordinances, policies, and guidelines in the corridor will direct population and employment growth largely within neighborhoods proximate to the current highest intensities of existing development in the corridor.
Population and job growth will occur throughout the urbanized areas of the corridor. In the future, residents of Camarillo and Oxnard will represent a larger share of the corridor population and jobs in Ventura and Oxnard will represent a larger share of the corridor employment. The City of Oxnard is expecting to triple the number of jobs by 2040.
Due to a slightly improved jobs‐housing balance, there will be a modest growth in travel volumes. However, the modest growth in will lead to increased congestion for vehicles on roadways that are currently at or have exceeded capacity during peak travel periods.
The area with the most significant congestion for vehicles will continue to be on US 101 in the Thousand Oaks area.
Planned transit and active transportation improvements will improve accessibility and travel time for non‐vehicle trips in Future Conditions. Notably, the County and local jurisdictions have planned 162 new miles of bikeways.

VCTC US 101 Communities Connected Study | 43
4 PROJECTS AND PROGRAMS The path toward living in a sustainable community relies on a transportation system that provides residents and workers the means to conduct their daily activities with minimal time spent traveling. Based on the public input, a sustainable transportation system needs to reduce congestion and delay while improving safety and health, be equitable, and protect sensitive habitat and open space. A sustainable transportation system requires a balance between the transportation network, service supply, and daily trip demand. At the same time, a sustainable transportation system aims to reduce vehicle miles travelled and reduce greenhouse gas emissions related to transportation. Decades of investment focused on the roadway system to improve auto travel included a set of strategies known as Transportation System Management (TSM) and Transportation Demand Management (TDM). TSM strategies are designed to maximize the efficiency of the existing transportation system by improving roadway throughput, reducing bottlenecks and chokepoints by implementing relatively low cost projects, such as traffic signal timing, ramp metering, complete streets, traffic management through Intelligent Transportation Systems (ITS) technologies, High Occupancy Vehicle (HOV) lanes, and interchange/intersection improvements. In recent years, the concepts of transportation asset efficiency have been applied to other modes of travel to improve their utilization and service. TDM programs are aimed at reducing vehicle trips, particularly at peak commute hours, by promoting strategies, including but not limited to, encouraging rideshare and carpooling, staggered work shifts, and other mode shifts, telecommuting from home, transit usage including Integrated Corridor Management (ICM) systems . Ventura County is incorporated into Caltrans District 7's Integrated Corridor Management (ICM) Master Plan under TDM strategies. The purpose of the ICM is to improve transportation by integrating various network systems together, so that partner agencies can manage the transportation corridor as a unified multi‐modal system. Once considered “alternative” transportation due to the primacy of auto travel, investments in multimodal transportation have increased, acknowledging other forms of travel are not only as important, but more sustainable and sometimes more practical than single occupancy vehicle travel. Employers and employees have been quick to invest in and adapt to telecommuting as a result of stay‐at‐home and social distancing mandates related to the COVID‐19 pandemic.

VCTC US 101 Communities Connected Study | 44
4.1. Project and Program List Sources
To assemble a complete list of TSM projects and TDM programs, US 101 Communities Connected evaluated multiple sources to identify planned projects and programs. First, the 2020 SCAG Regional Transportation Plan/Sustainable Communities Strategy (RTP/SCS) identifies funding for all major transportation projects in the Southern California region which add capacity to the transportation system or receive federal funding. The RTP/SCS provided the basis for organizing planned projects by their funding status. SCAG organizes planned projects by funding status in the following categories:
Federal Transportation Improvement Program (FTIP) projects – funding
needs programmed and secured over the next six‐year period. Financially‐Constrained projects – high‐priority projects identified for
future funding under a 30‐year funding forecast. Strategic projects – long‐term potential projects to be pursued if
additional funding is identified. From this initial list of major projects, VCTC and each of the cities within the study area refined the projects and identified any ongoing or planned projects which were outside the scope of SCAG’s lists. Capital Improvement Programs (CIPs) and Active Transportation Programs (ATPs) from each city provided a source for a majority of additional projects evaluated for US 101 Communities Connected. Projects were reviewed to ensure completed or cancelled projects were removed from the list and to verify the accuracy of estimated cost and project completion years.
4.2. Project and Program List Categorization
The compiled project list is organized based on project type into “roadway” and “non‐roadway” projects, and by funding status, in a manner similar to the SCAG RTP/SCS, into “funded” and “un‐funded” projects categories. Funded projects include those included in the FTIP and most projects listed within the city CIPs. Unfunded projects include those from the RTP/SCS listed as “Financially Constrained” which are defined as committed projects with reasonable available funding and CIP projects that lack total funding. Strategic projects listed in the RTP/SCS were not included in this analysis as they need additional funding and commitment. Roadway and non‐roadway projects were further organized into sub‐categories
based on project type. Roadway projects include any type of infrastructure project that primarily benefits vehicular travel. The sub‐categories for roadway projects include:
Auxiliary lanes Bridge improvement Capacity enhancement Grade separation HOV lanes Interchange improvement Intersection improvement Intelligent Transportation Systems (ITS)
Non‐roadway projects primarily benefit transit, passenger rail, and active transportation (pedestrian and bicycle) users and include planning and administrative efforts to support the multimodal transportation system. The sub‐categories for non‐roadway projects include:
Capital and demonstration projects o Demonstration projects o Other capital projects o Multi‐purpose/grouped projects
Passenger rail projects Planning, marketing, and other services
o Planning and marketing o Operating assistance o Other services
Vehicle purchase and lease Active transportation
o Pedestrian facilities o Bicycle facilities
Travel demand management o Telecommuting o Incentives for transit and alternate modes o Integrated Corridor Management (ICM)
Appendix A provides a complete list of multimodal projects and programs.

VCTC US 101 Communities Connected Study | 45
4.2.1. Funded Roadway Projects and Programs The total estimated cost of all funded roadway projects within the study area is approximately $205 million, with the grade separation projects accounting for the majority of this total. The grade separation project along the Union Pacific Railroad tracks at Rice Avenue near 5th Street in Oxnard, the site of several train‐vehicle collisions, is another project of special note. Figure 31 exhibits funded roadway projects, and Table 28 tallies their total overall costs.
Table 28 – Funded Roadway Projects Summary
PROJECT CATEGORY COST ($1,000’s) Capacity Enhancement $55,440 Grade Separation $117,000 Intersection Improvement $33,290
Total $205,730
Figure 31- Funded Roadway Projects
4.2.2. Funded Non-Roadway Projects and Programs The total estimated cost of all funded non‐roadway corridor projects is approximately $307 million. The transit investments are composed of passenger rail and transit infrastructure projects and transit vehicle purchases and leases. Unlike funded roadway projects, which are concentrated in a few areas, the funded non‐roadway projects are distributed throughout the study area. Examples include improvements to transit and passenger rail facilities in Thousand Oaks and Camarillo, an improved transit corridor along Ventura Road, and numerous active transportation projects in Oxnard, Ventura, and unincorporated Ventura County. It
is important to keep in mind that many non‐roadway projects are not specific to one geographical location and therefore serve various areas throughout the corridor. Table 29 tallies their total overall costs, and Figure 32 presents funded non‐roadway projects.

VCTC US 101 Communities Connected Study | 46
Table 29 – Funded Non-Roadway Projects Summary
PROJECT CATEGORY COST ($1,000’s) Capital and Demonstration Projects $41,401 Passenger and Rail Projects $188,990 Operating Assistance and Transit Planning $59,628 Vehicle Purchase and Lease $6,049 Active Transportation $11,253
Total $307,321
Figure 32 – Funded Non-Roadway Projects

VCTC US 101 Communities Connected Study | 47
4.2.3. Unfunded Roadway Projects and Programs The total estimated cost of all un‐funded planned roadway projects is approximately $1.74 billion. With the exception of the HOV lanes that run the length of the study area, the majority of unfunded roadway projects are concentrated in the west of the study area in Oxnard and Ventura. These include several lengthy roadway widening and extension projects, three grade separations along railroad tracks in Oxnard, an interchange improvement at US 101 at Del Norte Boulevard, and improvements to the Main Street Bridge in Ventura. Figure 33 maps unfunded roadway projects, and Table 30 tallies their total overall costs.
Table 30 – Un-funded Roadway Projects Summary
PROJECT CATEGORY COST ($1,000’s) Auxiliary Lanes $232,175 Capacity Enhancement $193,948 Grade Separation $215,272 HOV Lanes $700,000 Interchange Improvement $313,688 Intersection Improvement $89,492
Total $1,744,575
Figure 33 – Unfunded Roadway Projects

VCTC US 101 Communities Connected Study | 48
4.2.4. Unfunded Non-Roadway Projects and Programs The total estimated cost of all unfunded non‐roadway projects is approximately $447 million, which includes transit service expansion, operations and maintenance, zero and low emission vehicle fleets. Unfunded, non‐roadway projects in specific geographic locations include active transportation improvements along Central Avenue and the Springville Drive Bike Trail in Camarillo, the Santa Paula Branch Line Recreational Trail stretching from Montalvo in Ventura toward Santa Paula, and a multimodal transportation center in Downtown Ventura.
Table 31 tallies are their total overall costs, and Figure 34 presents unfunded non‐roadway projects.
Table 31 – Un-funded Non-Roadway Projects Summary
PROJECT CATEGORY COST ($1,000’s) Capital and Demonstration Projects $99,702 Transit Service Expansion / Transit Planning $133,254 Vehicle Purchase and Lease $57,317 Active Transportation $157,617
Total $447,890
US 101 Communities Connected Study and Our Future 101
101 Communities Connected is one of two concurrent planning efforts for the US 101 Corridor conducted by VCTC. In addition to 101 Communities Connected multimodal corridor study, VCTC and Caltrans are preparing a Project Approval & Environmental Document (PA&ED) to consider the addition of High Occupancy Vehicle (HOV) / Express Bus lanes on US 101, a study called Our Future 101. Our Future 101 is an alternatives analysis, preliminary design, and environmental assessment for specific highway improvements, including adding general purposes lanes, HOV/express bus lanes, auxiliary lanes, and/or ramps. Additional information regarding the US 101 HOV PA&ED can be found at OurFuture101.org. While Our Future 101 analyzes specific highway improvements to the 101 freeway, 101 Communities Connected is a high‐level multimodal analysis of the broader three‐mile radius around US 101 that analyzes a large list of potential multimodal projects for freeway, roadway, bicycle, pedestrian, and transit facilities, infrastructure, and services in the corridor.

VCTC US 101 Communities Connected Study | 49
Figure 34 – Unfunded Non-Roadway Projects

VCTC US 101 Communities Connected Study | 50
5 PUBLIC OUTREACH Public participation is a key component of the US 101 Communities Connected Study, and a comprehensive public involvement process is crucial to the success of this project. A public outreach plan is developed and conducted through interactive community workshops, digital engagement and targeted outreach to community‐based organizations within the project corridor. The outreach program goals are as follows:
Educate the public about the US 101 Communities Connected Study purpose and the role it will play in Ventura County’s transportation future, and
Solicit input from stakeholders, including special needs populations and disadvantaged communities, on transportation needs and priorities in the US 101 Corridor.
The US 101 Communities Connected Study outreach program is composed of the following tactical elements:
Community contact database Digital outreach Webpage Digital campaigns
Online survey tool In‐person public workshops Online public workshops Public comments summary
5.1. Community Contact Database As one of the first tasks, the project team compiled a community database for the US 101 Communities Connected Study area. The outreach group identified and updated existing databases, which included information of groups who represent low‐income and special needs communities. The database serves as the project’s ever‐growing email list and was used to distribute meeting invitations, project updates and other important information. Engaging community‐based organizations is an important part of the US 101 Communities Connected Outreach process. Early in the project, a database of key organizations was compiled, including organizations serving each city in the study area as well as those serving Ventura County as a whole. Organizations in the database fell into the following basic categories: social services, children and families, environmental, business, agriculture, community development and planning, bicycle advocacy, and civic groups, such as neighborhood councils, Rotary Clubs, etc. In the month leading up to the public workshops, each organization on the list received four emails with information to share with constituents, an online survey and reminders about workshop dates and locations.

VCTC US 101 Communities Connected Study | 51
In addition, the project team in consultation with VCTC staff narrowed down the database to approximately 30 organizations whose missions are most closely aligned with the topics covered in the US 101 communities Connected study. These organizations received personal follow‐up calls or personal emails from VCTC or consultant staff. They were also tagged in social media posts on Facebook and Instagram. Finally, VCTC staff gave in‐person presentations to groups that requested additional information.
5.2. Digital Outreach Alongside in‐person and online public meetings, a digital outreach process ensures that key community organizations are updated on the project and their opportunities for public involvement. The outreach team sent email blasts to organizations at important project milestones. Project documents, graphics, and other resources (in both English and Spanish) were sent to organizations to use on their websites, bulletin boards, and social media channels. Social media tagging further engaged key organizations and their constituents on Facebook and Instagram.
5.3. Webpage A project webpage was created on VCTC’s website, www.goventura.org/101communities, as shown in Figure 35. The page served as a public repository of all project information, including project overview, schedule, FAQs, public meeting information, online survey tool, comment form, contact information, and downloadable materials.
Figure 35 – Communities Connected Website
5.4. Digital Campaigns The online survey tool and public meetings were successful because the community was aware of them and was encouraged to participate. An engagement campaign was conducted through VCTC’s Facebook, Instagram and email (Mail Chimp) accounts to drive traffic to the survey tool and encourage the public to share their opinions. A total of 212 comments were collected over a period of 29 days concerning the various modes of transportation in the corridor, including freeway, arterial, bike/pedestrian, bus, and rail modes. Comments received also described safety issues and proposed solutions. Strategic use of paid and organic social media and email increased the visibility of the public process and the amount of feedback received.
5.5. Online Survey Tool Prior to the first round of the public meetings, an online survey tool was set up to collect public input on the study. The survey tool, which was available in both Spanish and English, allowed users to submit their feedback, even if they were not able to attend the public meetings in person. During the survey, the participants were asked to rank the five goals of the projects in order of their importance to the survey participant. As shown in Table 32, the top two goals of most concern to the attendees were safety/health and multimodal mobility.
Table 32 – Online Survey Results
GOAL RANK Safety/Health 1 Multimodal Mobility 2 Improve Economy 3 Environmental Stewardship 4 Social Equity 5
5.6. Public Workshops Initially, four in‐person public workshops were planned as part of the outreach plan. The first two workshops occurred in January 2020 as planned. The second two workshops were scheduled to occur in July 2020. However, due to the stay‐at‐home and social distancing mandates related to COVID‐19, the outreach plan had to be modified. The July workshops were re‐designed as one online workshops and funds were re‐directed to enhance the digital outreach campaign.

VCTC US 101 Communities Connected Study | 52
5.6.1. Outreach Phase 1 The two in‐person public workshops in January 2020 were held in the cities of Ventura and Camarillo to provide more than one option for community members to attend and allow locations generally on the east and west parts of the corridor, respectively. Both locations were public transit and ADA‐accessible. The workshops included a short presentation, and interactive stations where participants had a chance to speak with project team members and explore various aspects of the study in more detail. Participants were also able to provide their feedback in a variety of formats. Materials were provided in English and Spanish. During the second half of the workshop, participants were given 10 $10 bills ($100) in “Transportation Dollars” (play money). They were invited to spend this money on different goals and help rank these goals including social equity, environmental stewardship, multimodal mobility, safety and health, and economy. As shown in Table 33, the goals receiving the highest ranking included social equity, multimodal mobility and safety.
Table 33 – Goal Ranking Results from the Public Meetings
GOAL RANK Social Equity 29% Multimodal Mobility 29% Safety & Health 17% Environmental Stewardship 16% Improve Economy 9%
Total 100% 5.6.2. Public Comments Summary Ventura County residents and stakeholders submitted comments via email, online survey, paper survey, social media comments, as well as orally at the public workshops. All comment forms were made available in English and Spanish. The following is a breakdown of the public input that was received:
Source o 24 from Ventura Meeting (11%) o 20 from Camarillo Meeting (9%) o 12 from social media (6%) o 149 from online survey (70%) o 7 from email (4%)
Language: English vs. Spanish o 206 English (97%) o 6 Spanish (3%)
Method: Digital vs. In‐Person o 44 In‐Person (20%) o 168 Digital (80%)
Each comment was reviewed, and key areas of concern were identified. Table 34 presents a summary of comments. As shown in Table 35, nearly half of all comments were about bottlenecks and congestion on US 101 Freeway. Many of the comments regarding transit were about expanding the services as shown in Table 36. Transit related comments were shared with VCTC transit staff to incorporate in their annual Unmet Transit Needs process. Bike and pedestrian comments were predominantly about closing gaps and expanding the bike lanes as shown in Table 37.
Table 34 – Comments Received from Public
COMMENT # OF COMMENTS PERCENTAGE US 101 Freeway 99 47% Transit 43 20% Bike/Pedestrian 37 17% Rail 12 6% Multimodal 16 8% Arterials 5 2%
Total 212 100%
Table 35 – Comments on US 101 Freeway
COMMENT # OF COMMENTS PERCENTAGE Bottlenecks 47 48% Traffic Congestion 36 36% Others 16 16%
Total 99 100%

VCTC US 101 Communities Connected Study | 53
Table 36 – Comments on Transit
COMMENT # OF COMMENTS PERCENTAGE Expand Services 32 74% Others 11 26%
Total 43 100%
Table 37 – Comments on ATP (Bike/Pedestrian)
COMMENT # OF COMMENTS PERCENTAGE Close Gaps/Expand Bike Network 20 54% Safety 9 24% Others 8 22% Total 37 100%
5.6.3. Outreach Phase 2 - Online Workshops The initial outreach plan was to hold two additional in‐person public workshops in the cities of Oxnard and Thousand Oaks in July 2020. However, in‐person workshops became unfeasible due to stay‐at‐home and social distancing mandates related to the COVID‐19 pandemic. The public outreach strategy shifted to holding an online workshop. Information that was planned to be shared at the July in‐person workshops was re‐imagined for the digital/online format. VCTC staff recorded short video presentations to explain the purpose and overall substance of the US 101 Communities Connected study. Online attendees were given the option to watch additional video presentations discussing detailed study analysis and findings. Online attendees were invited to review the digital draft of the report and provide written feedback via email. Additional resources were allocated to the digital outreach campaign after the online workshop was published online to ensure stakeholders had an opportunity to participate in the feedback process. A summary of the comments received is presented in Table 38.
Table 38 – Comments Received from Public
COMMENT # OF COMMENTS PERCENTAGE Wildlife Crossing 209 79% US 101 ‐ Opposed Widening 15 6% US 101 ‐ For Widening 3 1% US 101 ‐ Noise 6 2% Expand Transit 11 4% Arterials ‐ Don't Take Lanes 4 2% Use of Technology 3 1% Others 13 5%
Total 264 100%
5.7. Study Response to Comments Public and stakeholder feedback were incorporated in the study through the corridor’s performance evaluation framework. The goals and performance measure were scoped so performance objectives and metrics were better aligned with stakeholder funding priorities, areas of concern, and unmet transportation needs. Projects included in the study were evaluated to identify which projects had design components that addressed stakeholder areas of concern and unmet transportation needs. Comments and survey responses regarding funding prioritization were particularly important in designing the performance evaluation framework because a key outcome of the 101 Community Connected study is to recommend projects for transportation funding. Stakeholder’s recommendation to prioritize Safety & Health, Multi‐Modal Mobility, and Social Equity goal areas is reflected in the project Communities Connected Index (CCI) score, which is part of the evaluation framework. Projects that are likely to have positive impacts on these goal areas are given a higher CCI score. Projects with higher CCI scores are more aligned with stakeholders’ vision for the future of the US 101 Corridor. The role of public input in the performance evaluation process is discussed in further detail in the following chapter. During the second phase of public outreach for 101 Communities Connected, a substantial number of comments were received from members of the public regarding interest in the relationship between transportation projects along the U.S. 101 corridor and wildlife crossing in the Santa Monica Mountains. The U.S. 101 High Occupancy Vehicle (HOV) / Express Bus lanes project (also known as Our Future 101) is conducting analysis of wildlife crossings and potential impacts to wildlife as part of its preliminary design and environmental analysis. All comments received through the 101 Communities Connected public review process related to the U.S. 101 freeway will be forwarded to the Our Future 101 project team.

VCTC US 101 Communities Connected Study | 54
6 PERFORMANCE EVALUATION FRAMEWORK
The 101 Communities Connected team developed a corridor performance framework to evaluate the potential performance of the projects and programs considered for the corridor in a multimodal context. The framework is intended to evaluate expected outcomes and effects of the projects and programs on the transportation system once they are implemented using a set of performance measures. A wide range of performance measures were initially considered for use in the study, but the final set of measures were selected based on their measurability and relevance to the study. Measurability of a performance measure is determined by needs and requirements to conduct quantitative and qualitative analyses. Relevance of a performance measure is determined by performance measure’s applicability to the established goals and principles for US 101 Communities Connected. Particular emphasis is placed on the multimodal nature of the study to ensure that the selected performance measures go beyond the traditional auto‐centric measures. The performance measures also support existing State, regional, and local policies and goals including those listed in the California Transportation Commission (CTC) 2018 Comprehensive Multimodal Corridor Plan Guidelines. The performance measures are also consistent with the SCAG 2020‐2045 RTP, Connect SoCal, regional goals and VCTC’s CTP (2013) vision statement to have “A connected and integrated transportation system that provides convenient, safe and accessible options.” They also respond to stakeholder feedback collected from the public outreach process. The performance measures considered for US 101 Communities Connected are as follows:
Safety – Increase safety for motorized and non‐motorized users Health – Improve opportunities for healthy lifestyles Air Quality – Reduce criteria pollutants and advance the State’s air quality goals Disadvantaged Communities – Project is located in a disadvantaged community Congestion/VMT Reduction – Minimize vehicle miles traveled Person Throughput – Maximize person throughput in the corridor Accessibility – Improve accessibility and connectivity for residents and non‐residents;
close existing gap in transit and active transportation Economic Development – Support economic development and access to employment GHGs – Reduce GHG emissions and advance the State’s air quality and climate goals Efficient Land Use:
o Transit Proximity – Half mile of major transit stop or HQTA o Low‐VMT Zone – VMT per household is 15 percent below regional average o High Accident Locations – Accidents are 50 percent above the corridor average

VCTC US 101 Communities Connected Study | 55
Figure 36 illustrates the relationship of performance measures and US 101 Communities Connected goals and principles. Figure 36 – Communities Connected Goals & Performance Measures
6.1. Project and Program Evaluation
Methodology Projects and programs from the study list are evaluated against performance measures based on how strongly they support the goals and principles of the project. The evaluation process is comprised of categorizing the projects into subtypes and funding availability, performing qualitative and quantitative analyses and determining the project or program score across all performance measures as shown in Figure 37. Projects and programs are ranked for each performance measure as high, medium, low, and no positive impact. The rankings are then converted to a numeric score on a scale from one to 10, with a score of one representing no positive impact, four representing low impact, seven medium impact, and ten as high impact.
Figure 37 – Evaluation Process
The outcome of the evaluation is to identify which projects – or subset of projects – support certain performance measures and corridor goals. This information is useful for prioritizing project and program funding and developing the most appropriate funding scenarios to help move the corridor toward a sustainable and efficient multimodal transportation system. Performance evaluation results may also provide insight into areas where current projects are less successful at achieving Communities Connected goals and identify areas where new strategies might strengthen future mobility and land use planning efforts. Appendix B provides a detailed description and evaluation criteria for each performance measure. Evaluation criteria are developed largely based on recommendations listed in the CTC 2018 Comprehensive Multimodal Corridor Plan Guidelines and Caltrans 2020 Corridor Planning Process Guide.
Safety &Health
Safety
Health
Air Quality
SocialEquity
Disa
dvan
taged
Com
munit
ies
Multimodal Mobility
Congestion Reduction/
VMT
Person Throughput
Transit Proximity
Accessibility
Robust Economy
Econ
omic
Deve
lopme
nt
Environmental Stewardship
GHG
EfficientLandUse
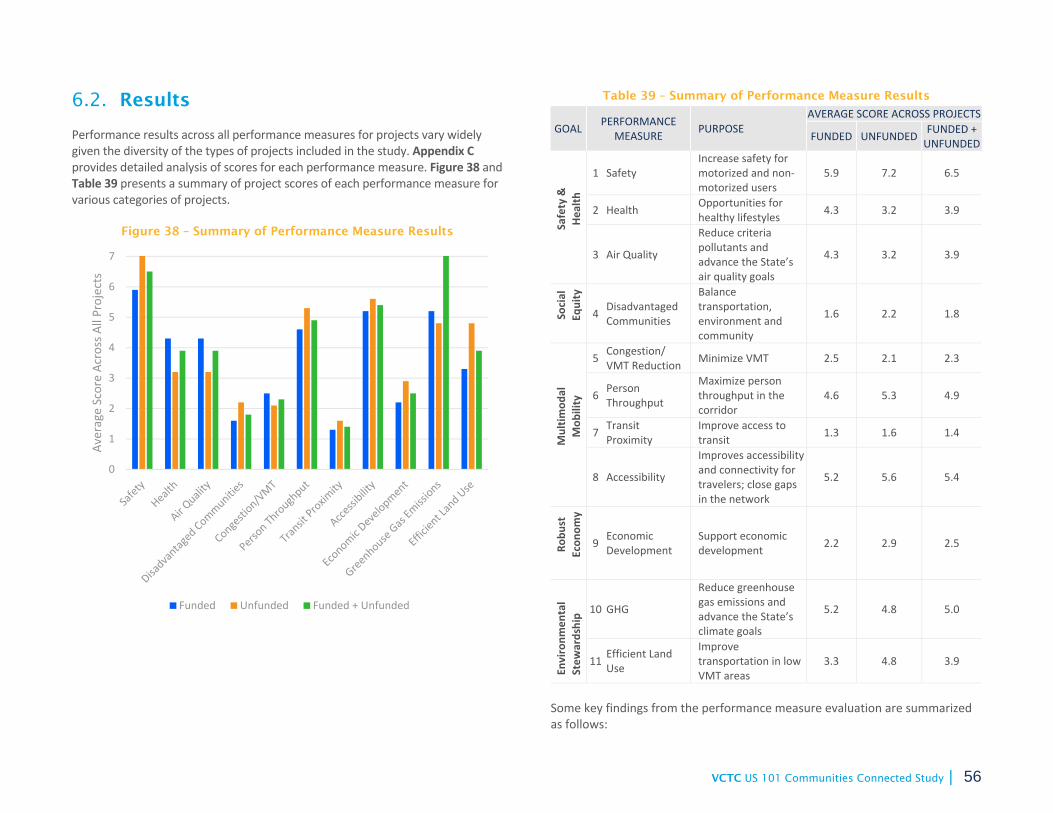
VCTC US 101 Communities Connected Study | 56
6.2. Results Performance results across all performance measures for projects vary widely given the diversity of the types of projects included in the study. Appendix C provides detailed analysis of scores for each performance measure. Figure 38 and Table 39 presents a summary of project scores of each performance measure for various categories of projects.
Figure 38 – Summary of Performance Measure Results
Table 39 – Summary of Performance Measure Results
GOAL PERFORMANCE MEASURE PURPOSE
AVERAGE SCORE ACROSS PROJECTS
FUNDED UNFUNDED FUNDED + UNFUNDED
Safety &
Hea
lth
1 Safety Increase safety for motorized and non‐motorized users
5.9 7.2 6.5
2 Health Opportunities for healthy lifestyles 4.3 3.2 3.9
3 Air Quality
Reduce criteria pollutants and advance the State’s air quality goals
4.3 3.2 3.9
Social
Equity
4 Disadvantaged Communities
Balance transportation, environment and community
1.6 2.2 1.8
Multim
odal
Mob
ility
5 Congestion/ VMT Reduction Minimize VMT 2.5 2.1 2.3
6 Person Throughput
Maximize person throughput in the corridor
4.6 5.3 4.9
7 Transit Proximity Improve access to transit 1.3 1.6 1.4
8 Accessibility
Improves accessibility and connectivity for travelers; close gaps in the network
5.2 5.6 5.4
Robu
st
Econ
omy
9 Economic Development
Support economic development 2.2 2.9 2.5
Environm
ental
Stew
ardship 10 GHG
Reduce greenhouse gas emissions and advance the State’s climate goals
5.2 4.8 5.0
11 Efficient Land Use
Improve transportation in low VMT areas
3.3 4.8 3.9
Some key findings from the performance measure evaluation are summarized as follows:
0
1
2
3
4
5
6
7
Average Score Ac
ross All Projects
Funded Unfunded Funded + Unfunded

VCTC US 101 Communities Connected Study | 57
On average, Safety and Accessibility are the top two scoring
performance measures with average scores of 6.5 and 5.4 for all projects, respectively.
The lower scoring performance measures are Transit Proximity and Disadvantaged Communities reflecting lack of projects located within the two geographic areas related to these measures.
All study projects have a positive impact on Safety. Active transportation projects are likely to have a positive impact on
Health and Air Quality, while Arterial/Highway projects all have no positive impact, or a low impact, based on these measures.
Most projects in the study are not located within a disadvantaged community, and therefore have no positive impact on the Disadvantaged Communities performance measure. Similarly, few projects are located proximate to transit stations and therefore have no positive impact on the Transit Proximity performance measure. These results reveal opportunity areas to improve corridor performance in future planning.
No project alone in the study has a high impact on reducing congestion/VMT or increasing person throughput. This reflects limited opportunities to improve congestion/VMT and person throughput through transportation projects. This finding is typical of established areas, such as the US 101 Corridor, which already have extensive transportation systems.
Projects that perform better on the Congestion/VMT Reduction performance measure are related to TDM programs such as telecommuting and transit projects. Telecommuting is currently about 5 percent in the study area. A higher percentage of telecommuting will reduce congestion and VMT during the highest congested traffic hours of day.
More than 80 percent of all projects have a positive impact on Accessibility.
More than half of the projects do not have a positive impact on Economic Development. Projects that performed well were a mix of arterial, highway, and active transportation projects that are likely to address goods movement or improve access to jobs.
Over 70 percent of projects have an effect on reducing greenhouse gas emissions. All active transportation projects score high on the GHG performance measure.
20 percent of all projects are located in low‐VMT areas meaning they have a positive impact on Efficient Land Use.
When comparing funded and unfunded project packages, it was shown
that unfunded projects have a positive impact on overall project performance across all projects in the study for the performance measures of Safety, Disadvantaged Communities, Person Throughput, Transit Proximity, Accessibility, Economic Development, and Efficient Land Use.
6.3. Goal Areas Performance measures can be aggregated by each goal area to calculate a goal score. These scores identify projects that are most effective or impactful in selected goal areas and can be effective for prioritizing transportation funding to target specific corridor goals. Figure 39 and Table 40 present a summary of project scores for each goal area. The goal score is the average of all relevant performance measure scores.
Figure 39 – Summary of Average Goal Area Results
Table 40 – Summary of Average Goal Area Results
GOAL AVERAGE SCORE ACROSS PROJECTS
FUNDED UNFUNDED FUNDED & UNFUNDED
Safety and Health 5.0 5.1 5.1 Social Equity 1.6 2.2 1.8 Multimodal Mobility 2.8 3 2.9 Robust Economy 2.2 2.8 2.5 Environmental Stewardship 5.1 5.7 5.3
0
1
2
3
4
5
6
Safety &Health
Social Equity Multi‐ModalMobility
RobustEconomy
EnvironmentalStewardshipAv
erage Score Ac
ross All Projects
Funded Unfunded Funded + Unfunded

VCTC US 101 Communities Connected Study | 58
6.4. Total Project Score and Communities Connected Index
A total project score is calculated for each project to measure the project’s impact across all goal areas by summing the Goal Area scores and scaling it from 0 to 100. To further incorporate stakeholder priorities in the evaluation process, a Communities Connected Index (CCI) is calculated for all projects. CCI is similar to the total project score, except that stakeholder priorities were given greater weight in the scoring. The Safety & Health, Social Equity, and Multi‐Modal Mobility goal areas are valued higher in the CCI because they were identified as stakeholder priorities during public workshops, online surveys, and other feedback from the public. This means projects that address stakeholder priorities will have a higher CCI. Similar to the total project score, CCI is also scaled from 0 to 100. CCI is calculated using the following formula:
𝑆𝑎𝑓𝑒𝑡𝑦 & 𝐻𝑒𝑎𝑙𝑡ℎ 2 𝑆𝑜𝑐𝑖𝑎𝑙 𝐸𝑞𝑢𝑖𝑡𝑦 2 𝑀𝑢𝑙𝑡𝑖 𝑀𝑜𝑑𝑎𝑙 𝑀𝑜𝑏𝑖𝑙𝑖𝑡𝑦 2𝑅𝑜𝑏𝑢𝑠𝑡 𝐸𝑐𝑜𝑛𝑜𝑚𝑦
𝐸𝑛𝑣𝑖𝑜𝑟𝑛𝑚𝑒𝑛𝑡𝑎𝑙 𝑆𝑡𝑒𝑤𝑎𝑟𝑑𝑠ℎ𝑖𝑝 ∗10080 CCI
Within the context of the framework, it is important to note that the total project score and CCI are most informative when looking at subsets of projects or evaluating various funding scenarios. Figure 40 shows project cost against CCI for individual projects by funding. Funded projects are shown in green and unfunded projects are shown in orange. The y‐axis and the size of the bubble represent the project cost. The x‐axis shows the CCI. Projects on the right‐side of the figure represent projects that are most aligned with the US 101 Corridor vision and goals prioritized by stakeholders through public outreach. Both funded and unfunded have high and low CCI. Of the 10 projects with the highest CCI, there is a 50‐50 split between funded and unfunded projects. Figure 41 shows project cost against CCI for individual projects by project type. Active transportation projects and arterial projects from the project list generally have higher CCI. Active transportation projects are likely to score high as they typically have direct positive impacts on Safety & Health and Multi‐Modal Mobility. Many arterial projects on the list score well. High scoring arterial
projects tend to address many aspects of the Safety & Health goal area. Although arterial projects in the list are generally widening improvement projects, many arterial projects also include safety countermeasure for not only motorists, but also bicyclists and pedestrians. These types of projects have higher CCI. Of the 24 projects with the highest CCI, over 60 percent are active transportation projects, 30 percent are arterial projects, and the remaining are highway or transit projects. It should be noted the projects with cost estimate under $10 million are graphically clustered at the bottom of the chart. In order to show all projects in one chart, the vertical scale includes a break to illustrate relatively high value projects above $200 million. Figure 42 to Figure 45 summarizes project cost against CCI for individual projects by project type. In general, active transportation projects perform the best among the project type categories.

VCTC US 101 Communities Connected Study | 59
Figure 40 – Project Communities Connected Index and Cost by Funding

VCTC US 101 Communities Connected Study | 60
Figure 41 – Projects Communities Connected Index and Cost by Project Type

VCTC US 101 Communities Connected Study | 61
Figure 42 to Figure 45 summarizes project cost against CCI for individual projects by project type. In general, active transportation projects, shown in Figure 42, perform the best among the project type categories. The four projects with the highest CCI in this study are active transportation projects:
Ventura River Trail – Sheridan Way Bike Path Link (Westside) Bike Lanes Northeast of Transportation Center in Oxnard Eastside Sidewalk – ADA Improvements Poinsettia in Ventura 2019 ATP Sidewalk Corridor Improvements on Thousand Oaks
These three specific projects have high CCIs because project components have addressed all three of the stakeholder prioritized goal areas (Safety & Health, Social Equity, and Multi‐Modal Mobility). Most notably, all three projects are located in disadvantaged communities meaning they scored well in the Social Equity goal area compared to the majority of projects on the list. Because the project scoring framework is partially based on project design components, active transportation projects that had well defined scopes performed better than active transportation projects with general or miscellaneous countywide scopes. Project evaluation for arterial projects, shown in Figure 43, appear to split the projects into two groups. A small group of high scoring arterial projects include improvement projects on:
SR 33/Stanley Avenue Harbor Boulevard at Gonzales Road Pleasant Valley Road Between Dodge Road and Las Posas Road Victoria Avenue at Gonzales Harbor Boulevard in Oxnard and Ventura Victoria Avenue at Gonzales Rice Avenue at Railroad Crossing Moorpark Road north of Thousand Oaks Boulevard widening
As previously discussed, high scoring arterial projects typically involve comprehensive safety measures. Most of these highest scoring arterial projects are also located in disadvantaged communities, meaning they scored well in the Social Equity goal area. Arterial projects, such as the improvement project at Rice Avenue at Railroad Crossing, that involve improving rail or freight operations
through grade separation also score well. These projects score well in the Robust Economy goal area. The second group of arterial projects have CCI scores that fall in the middle of the pack. This group of arterial projects include smaller arterial widening projects as well as countywide safety improvement and ITS program implementation. This set of arterial projects tend to score well in the Safety & Health performance area. Projects with more limited or unspecified scope may not clearly address stakeholder concerns related to social equity and multi‐modal mobility. Project sponsors should consider revisiting the project scope or project design to find additional opportunities to add or define project components that address US 101 Communities Connected shared vision and goals. The few highway projects, shown in Figure 44, in the study list tend to score average to above average compared to the overall project list. The US 101 HOV project stands out, not only as the most costly project on the list, but also for having amongst the highest CCI. The US 101 HOV project has a positive impact on all goal areas except Robust Economy. Because it scores well in the three stakeholder prioritized goal areas (Safety & Health, Social Equity, and Multi‐Modal Mobility) the project’s overall CCI is high. Transit projects had a wide range of CCI. Projects with higher CCI include:
SCORE rail expansion program Route 23 Bus Stop Installation at Ventura Road Downtown Ventura Multi‐Modal Transportation Center Group projects for operation assistance, planning, purchase of
replacement vehicle, or miscellaneous expense for elderly and disabled New Freedoms initiative
Expanded Bus Service for High Quality Transit Corridors Countywide Transit Service Expansion Countywide Bus Expansions (Includes Paratransit)
As with the active transportation projects, transit projects that had higher CCI had a well‐defined scoped, which are more likely to directly address stakeholder concerns and comments reflected in project scoring. Also, projects that targeted service enhancements had higher scores. Transit projects with lower scores had either vague scopes or were for non‐service‐related projects such as programming and planning and facilities improvement.

VCTC US 101 Communities Connected Study | 62
Figure 42 – Active Transportation Projects by Communities Connected Index and Cost
Note: Not all projects are labeled due to space limitations. Projects with costs less than $5 million are graphically clustered near the bottom of the chart. Although some projects may appear close to $0, all projects have
costs greater than $25,000.

VCTC US 101 Communities Connected Study | 63
Figure 43 – Arterial Projects by Communities Connected Index and Cost
Note: Not all projects are labeled due to space limitations. Projects with costs less than $5 million are graphically clustered near the bottom of the chart. Although some projects may appear close to $0, all projects have
costs greater than $25,000.

VCTC US 101 Communities Connected Study | 64
Figure 44 – Highway Projects by Communities Connected Index and Cost
Note: Not all projects are labeled due to space limitations. Projects with costs less than $5 million are graphically clustered near the bottom of the chart. Although some projects may appear close to $0, all projects have
costs greater than $25,000.

VCTC US 101 Communities Connected Study | 65
Figure 45 – Transit Projects by Communities Connected Index and Cost
Note: Not all projects are labeled due to space limitations. Projects with costs less than $5 million are graphically clustered near the bottom of the chart. Although some projects may appear close to $0, all projects have
costs greater than $25,000.

VCTC US 101 Communities Connected Study | 66
6.5. Scenario Analysis To evaluate the performance of projects and programs as a multimodal transportation system, two scenarios illustrating alternative representations of the study area as well as the SCAG region in 2045 are considered. Each scenario is designed to convey the impact of how regional growth and the transportation system would be shaped in the future:
2045 Baseline – The 2045 Baseline scenario assumes that the region continues along its current development trajectory. It includes all funded roadway and transit programs and assumes a continuation of existing development trends. It represents a future scenario in 2045 in which only the following have been implemented: projects that are currently under construction or undergoing right‐of‐way acquisition, transportation plans, projects and programs committed to in the 2019 FTIP, CIPs and/or transportation projects that have already received environmental clearance.
2045 Plan – This scenario represents transportation investments, policy recommendations, and strategies identified in the SCAG 2020 RTP Connect SoCal are fully implemented. The 2045 Plan includes a more compact development pattern which can be more efficiently served by transit, supporting walking and biking, and generating less vehicle travel. The Plan also places an emphasis on transit service and complete streets near transit, walk, and bicycle supportive land uses with higher density and a mix of uses most likely to generate a mix of travel modes.
Road and highway projects concentrate on alleviating major bottlenecks and congestion points, while other TSM and TDM strategies focus on greater optimization of existing transportation infrastructure and reducing auto trips. Connect SoCal commits $7.3 billion through 2045 to implement TDM strategies throughout the region with three primary goals:
o Reduce the number of single occupant vehicle (SOV) trips and per capita VMT through ride sourcing (which includes carpooling and vanpooling) and providing first/last mile services to and from transit
o Redistribute or eliminate vehicle trips during peak demand periods by supporting telecommuting and alternative work schedules.
o Reduce the number of SOV trips through use of other modes such as transit, rail, bicycling, and walking, or other micro–mobility modes.
The appropriate tools for analyzing the above scenarios are Ventura County Transportation Model (VCTM) and SCAG’s new Activity Base Model (ABM). VCTM’s current horizon year is 2040 and it will be updated to horizon year 2045 once the 2020 RTP ABM is available. SCAG has provided data, information, outputs and analyses of the 2045 Baseline and Plan scenarios as part of the 2020 RTP, Connect SoCal. To be consistent with the latest planning effort, SCAG’s 2045 Baseline and Plan forecasting results are used to compare the scenarios to the existing conditions. The 2045 scenarios model outputs and analyses are currently available at the County level. These outputs are reasonable and applicable to the US 101 Communities Connected study area since more than half of the Ventura County’s population and employment are located within the US 101 Communities Connected study area. The most appropriate area‐wide analysis is VMT, which measures overall network efficiency, rather than LOS, which is generally used to evaluate local (i.e., intersection level) impacts. Total daily VMT is used as a measure of overall utilization of roadways which relates to vehicle emissions, traffic congestion, and the effectiveness of land use patterns and alternate mode options in reducing the need for vehicular travel. Another area‐wide performance measure is Vehicle Hours of Delay (VHD) which measures the general congestion level of the roadway system through time spent in travel. As shown in Table 41, Daily VMT is expected to increase by 11 percent and five percent as compared to current daily VMT under Baseline and Plan, respectively. VHD is expected to increase by 40 percent under Baseline, but reduced by 20 percent under Plan compared to the existing conditions. The VMT per capita reflecting the population and employment growths declines in both scenarios. VHD per capita would increase by nine percent in the Baseline scenario and decrease by 38 percent in the Plan scenario. The declines in VMT and VHD per capita under the Plan indicate that transportation projects, as well anticipated growth patterns, if implemented, would effectively work together to improve system efficiency and minimize increases in VMT and VHD.

VCTC US 101 Communities Connected Study | 67
Table 41 – 2045 Scenario Comparison
GOAL 2019 2045 BASELINE 2045 PLAN
ABSOLUTE % CHANGE FROM 2019 ABSOLUTE % CHANGE
FROM 2019 VMT 19,000,000 21,000,000 11% 20,000,000 5% VHD 55,000 77,000 40% 44,000 ‐20% VMT/Capita 22.3 21.1 ‐5% 21.05 ‐6% VHD/Capita 5.6 6.1 9% 3.5 ‐38%
6.6. US 101 Communities Connected Plan Performance Results
As previously discussed in the Future Conditions and further examined in the performance evaluation scenario analysis, over the next two decades, despite the focused population and employment growth, travel conditions on the baseline future transportation network will be worse than Existing Conditions. If no additional improvement projects are funded, both VMT and VHD in the corridor will increase and the corridor will move further from achieving the shared US 101 Communities Connected vision and goals. Project performance for funded and unfunded projects and programs for the US 101 Corridor identified in Chapter 4 of the report resulted in a wide range of project scores. When evaluated against the project performance evaluation framework, project CCI scores ranged from 12.5 to 79.38. Unfunded projects with higher CCI scores, many of which were lower‐cost active transportation projects, should be considered when prioritizing new funding for the corridor. These projects have design components that speak to US 101 Communities Connected performance objects and stakeholder visions and goals. The two highest‐cost projects for the corridor are currently unfunded and are good candidates for future funding based on their high CCI. The US 101 HOV project and the countywide grade separation projects are successful at having a positive impact on the stakeholder prioritized goal areas (Safety & Health, Social Equity, and Multi‐Modal Mobility). 2040 Plan scenario analysis shows if funded projects are supplemented with targeted arterial, highway, transit, bicycle, walk, and TDM strategies; there is potential for significant improvements to the transportation network. In addition to moving the corridor towards the shared US 101 Communities Connected goals, VHD in the corridor can decline by as much as 20 percent.
Analysis of CCI results for transit projects reveals projects with general scopes that do not provide new or enhanced transit service do not score well. One limitation of the evaluation framework is that it may not capture the full value of operation and maintenance or state of good repair related projects. While rehabilitation design components are included in the performance evaluation criteria, non‐service enhancing and non‐capacity enhancing projects do not score well. Luckily, many maintenance and rehabilitation projects are already funded. However, the evaluation framework may need to be updated in the future if operation and maintenance shortfalls continue to go unfunded. Project evaluations and project CCIs are important takeaways from this study. Projects with high CCI scores should be prioritized when seeking new funding in the corridor. Project sponsors for projects with lower CCI should review the project scope and consider adding project components which address the US 101 Communities Connected performance goals. The individual performance measure evaluation criteria can be used as a guide when developing corridor transportation projects in the future.

VCTC US 101 Communities Connected Study | 68
7 FUNDING SOURCES Funding for transportation improvements in California is available through a series of Federal, State, and local sources. Eligibility for each funding source differs by mode, scope, matching fund requirements and project phase. Some funding programs allocate resources through competitive grant processes or other discretionary means, while other funds are distributed by formula to state, regional, or local governments for specific use. The section below summarizes some of the relevant funding sources available for projects in the US 101 Communities Connected study area.
7.1. Federal Funding Sources Federal transportation funding is administered by the U.S. Department of Transportation (U.S. DOT) and authorized through a Federal transportation bill through trust accounts from tax revenue. The most recent federal transportation funding bill, Fixing America’s Surface Transportation Act (FAST Act), was signed into law in 2015. The FAST Act was set to expire on September 30, 2020. However, on September 22, 2020, within the "Continuing Appropriations Act of 2021 and Other Extensions Act of 2020," Congress extended the FAST Act for one additional year through September 30, 2021. Much of the funding available through the U.S. DOT’s Highway Trust Account is allocated to California based on the state’s population. The State of California, in turn, distributes those funds to local agencies by formula or through competitive grant programs. The distribution of the federally funded Surface Transportation Program funding in California is listed and programmed in the Statewide Transportation Improvement Program (STIP) document. The STIP includes highway and transit program funds as well as California’s Active Transportation Program that consolidates most of the federal and state funding sources for bicycle and pedestrian (non‐motorized) projects. For local agencies, there are two relevant federal discretionary grant programs available for application. These include the Better Utilizing Investments to Leverage Development program (BUILD) and the Infrastructure for Rebuilding America program (INFRA). Highlighted in Table 42, these programs provide opportunities for the US 101 Corridor cities and regional entities in Ventura County to apply for substantial funding amounts for regionally significant projects.

VCTC US 101 Communities Connected Study | 69
Table 42 – Relevant Federal Funding Sources NAME FUNDING ESTIMATE FUNDING TYPE ELIGIBLE MODES/NOTES INFRA $1.5 B (nationwide) Discretionary A Federal discretionary grant program reviewed by USDOT. Emphasis on highway and goods movement projects.
BUILD ~$150 M (California portion) Discretionary A Federal discretionary grant program reviewed by USDOT. Emphasis on multimodal and rural projects.
Highway Safety Improvement Program (HSIP)
~$150 M (California) Discretionary
Federally allocated to the state by formula, the HSIP program is available for roadway Safety projects through a competitive program administered by Caltrans.
Congestion Mitigation Air Quality (CMAQ) $325 K Formula Federally designated air quality containment areas receive funding by formula to program local and regional
projects. VCTC programs the allocated CMAQ funding. Regional Surface Transportation Program (RSTP)
$8 M Formula Currently funding the first phase of the Route 101 preliminary design and environmental document project.
Source: United States Department of Transportation; California Department of Transportation; Southern California Association of Governments; Ventura County Transportation Commission.
7.2. State Funding Sources With the passage of Senate Bill 1 (SB1), the Road Repair and Accountability Act of 2017, the State of California has additional transportation funding for local and regional projects. SB1 augmented existing sources of funding, such as the Active Transportation Program and State Highway Operation and Protection Program (SHOPP), and created entirely new funding programs, such as the Solutions for Congested Corridors (SCC) and Trade Corridor Enhancement (TCE) programs. Table 43 highlights State funding sources that are most relevant to the US 101 Communities Connected improvement scenarios.
Table 43 – Relevant State Funding Sources
NAME FUNDING ESTIMATE FUNDING TYPE ELIGIBLE MODES/NOTES
Local Street and Roads $2.6 B (California) Formula Cities and counties for road maintenance, safety projects, railroad grade separations, complete streets, and traffic
control devices. Solutions for Congested Corridors
$250 M (California) Discretionary Regional transportation authorities and Caltrans may nominate projects for funding. The California Transportation
Commission (CTC) administers this program. Trade Corridor Enhancement
$830 M (California) Discretionary Caltrans and regional entities can be project sponsors. Funding is available for Bay Area, Central Valley, Central
Coast, LA/Inland Empire, and San Diego/Border areas.
Local Partnership Program $200 M (California)
50% Discretionary 50% Formula Eligible funding for “self‐help” counties*. Most transportation improvements are eligible.
Active Transportation Program
$253 M (California)
Grant (statewide and regional competitions)
Eligible projects include bicycle and pedestrian improvements and planning. SB1 augmented the ATP with an extra $100M per year.
State Highway Operation and Protection Program
$17.96 B (four‐year program) Discretionary Projects are selected by Caltrans and adopted by the CTC.
State Transportation Improvement Program
Varies (five‐year program) Formula Projects are proposed by regional transportation agencies and approved by the CTC on a bi‐annual basis. The
majority of STIP funding comes from Federal sources. Transit and Intercity Rail Capital Program
$545 M (California) Discretionary Discretionary program administered by Caltrans and the California State Transportation Agency (CalSTA).
Interregional Transportation Improvement Program
Varies (five‐year program) Formula Managed by Caltrans and funded with 25% of new STIP revenues in each cycle. ITIP
promotes the goal of improving interregional mobility and connectivity across California.
Local Transportation Fund $21 M Unknown Revenues are derived from one‐quarter cent of the general statewide sales tax and are returned to the County of origin. Funds are restricted for transportation purposes and are dispersed to the County.

VCTC US 101 Communities Connected Study | 70
NAME FUNDING ESTIMATE FUNDING TYPE ELIGIBLE MODES/NOTES
State Transit Assistance $7 M Unknown Revenues are derived from the State portion of the sales tax on diesel fuel. The State Controller allocates these funds based on the County’s population and operator revenues of each eligible transit operator. Funds are restricted for transit purposes and are administered by the VCTC.
Low‐Carbon Transit Operations Program $1.6 M Discretionary Funds spent for ongoing transit can only be for new or expanded services.
Adaptation Planning Grant $220 K (California) Discretionary
Funds are provided to local and regional agencies on a competitive basis to advance adaptation planning on California’s transportation infrastructure, including but not limited to roads, railways, bikeways, trails, bridges, ports, and airports.
Source: United States Department of Transportation; California Transportation Commission; Ventura County Transportation Commission.
7.3. Local Funding Sources Unlike other counties in the SCAG region, Ventura County does not have a locally collected sales tax dedicated to fund local transportation projects. Such funding measures are enacted by the voters and require 2/3 supermajority for passage. VCTC, as the Regional Transportation Planning Authority, programs much of the Federal and state apportioned funding that is allocated to Ventura County. Table 44 displays relevant local funding sources.
Table 44 – Relevant Local Funding Sources NAME FUNDING ESTIMATE FUNDING TYPE ELIGIBLE MODES/NOTES
Local Contributions and Fees $4 M Discretionary
Funds include contributions from the Air Pollution Control District (APCD), SBCAG, the cities and County of Ventura, Moorpark College, California State University, Channel Islands (CSUCI), etc. to support VCTC and regional programs. Local funds also include fares paid on the VCTC Intercity and Valley Express buses and lease payments paid through the Santa Paula Branch Line.
Investment Income and Other Revenues $344 K Discretionary Other funding sources include interest and miscellaneous income. VCTC utilizes investment income to offset
expenditures when possible. Interest is estimated by staff based on prior receipts and current rates. Source: Ventura County Transportation Commission

VCTC US 101 Communities Connected Study | 71
8 MOVING FORWARD 101 Communities Connected provides corridor communities and stakeholders with an overall vision of the future of mobility in the corridor—a roadmap for future improvements necessary to meet corridor plan goals. This vision stems from a coordinated effort and reflects state, regional, local jurisdiction, and stakeholder goals and objectives. The study identifies and prioritizes a list of planned infrastructure improvements that have potential to enhance mobility for everyone who travels the U.S. 101 corridor, including drivers, bicyclists, pedestrians and transit riders. Transportation planning and decision‐making for the corridor must be flexible and responsive to a range of conditions. The study area features a diverse physical environment that is unique to Ventura County. The area covers urbanized, suburban, and rural areas and is under the jurisdiction of several local jurisdiction and county entities. Future conditions in the study area also includes uncertainties in governing factors, such as land use and funding that may impact the transportation system. The data and conclusions in this study should be used to inform future transportation planning and decision‐making in the corridor. The technical analysis identifies external factors that may affect transportation demand (Existing and Future Conditions analysis) and opportunities to better utilize the transportation system (Project analysis). This chapter includes additional information that can be used to enhance the future planning process, which will ultimately improve mobility for all users within the corridor.
8.1. A Flexible Framework An important outcome of US 101 Communities Connected was to establish methods that assess baseline and future corridor performance, as well as an evaluation framework to analyze potential mobility improvements to the corridor. This analysis provided a snapshot of current and future corridor conditions. The evaluation results were based on this information, but also incorporated feedback from corridor stakeholders and the general public in regard to their mobility goals and priorities. While the study’s corridor analyses are static and reflect a moment‐in‐time, the methods and framework developed through this study are intended for use in future efforts, as they are flexible and can account for any future variations in stakeholder funding priorities by adjusting scoring weights for performance goal areas. The study will remain a relevant and responsive guide for future planning studies and funding priorities that support the future vision and goals of US 101 Communities Connected.

VCTC US 101 Communities Connected Study | 72
8.2. COVID-19 Response The need for a responsive and flexible plan is especially timely considering current conditions. As this US 101 Communities Connected study was underway, the future conditions of the corridor became even more uncertain as the world became impacted by the COVID‐19 pandemic. As the short‐term impacts of COVID‐19 on the economy and the transportation system are realized over the coming months, new baseline conditions may need to be developed, future conditions may need to be reconsidered, and the evaluation framework may be adapted to respond to new priorities resulting from this event. The corridor plan will continue to help guide the corridor towards the shared community vision and goals, while also addressing new issues and priorities facing stakeholders. After months of modified community movement across the globe in response to mandates of social distancing and curtailing work and social activities aimed at slowing the spread of COVID‐19, it is likely that some changes such as telecommuting, telehealth, tele‐education, and social distancing may be extended in years to come. Uncertainty regarding future travel demand, travel behavior, and public policy should be considered when planning the future of this vital corridor. The following sections provide more detailed discussion on these phenomena.
8.3. New Baseline and Future
8.3.1. Decline in Commutes Telecommuting is expected to grow and surge past the COVID‐19 crisis. Based on the latest surveys, nearly one in five chief financial officers has said they plan to keep at least 20 percent of their workforce working remotely, primarily as a means to cut costs and overhead. Many companies are now giving an option to employees to work from home permanently. It is expected that a more hybrid work environment will become the new permanent format for work, with more flexibility afforded to employees to work remotely and/or stagger their working hours. Data from the Google Community Mobility Report, shown in Figure 46, illustrates that movement trends at workplaces in Ventura County fell around 50 percent during the height of “stay‐at‐home” orders at the end of March 2020. Further, as the County and state began lifting these orders in May and June 2020, workplace movement continues to be 30 percent lower year over year than before the pandemic. Tele‐education/e‐learning is expanding at a very fast rate. The outbreak of COVID‐19 was a major disruption to K‐12 schools, colleges and universities, with cancelation of in‐person classes and moving to online‐only instruction. Education it has changed dramatically with the rise of e‐learning, whereby now, a majority of instruction is undertaken remotely and on digital platforms. Similar to work, the future of learning is expected to be a “Blended Learning” environment where online tools will be layered into face‐to‐face instructions.
Figure 46 – Google Community Mobility Report for Ventura County
‐80‐60‐40‐200
204060
% Cha
nge From
Baseline
Retail and Recreation Grocery and Pharmacy Parks Transit Stations Workplaces Residential

VCTC US 101 Communities Connected Study | 73
8.3.2. Other Shifts in Travel Demand Telehealth or e‐health is the use of electronic information and telecommunications technologies to support patients by providing professional health‐related services, including virtual appointments. Technologies include videoconferencing, store‐and‐forward imaging, and streaming media. As part of the Coronavirus Preparedness and Response Supplemental Appropriations Act (CARES), the Centers for Medicare & Medicaid Services (CMS) has broadened access to Medicare telehealth services so that patients can receive services from their doctors without having to travel to a healthcare facility, and service providers are paid at the same rate as for a regular in‐person visit.
8.3.3. New Mode Choice COVID‐19 has not only impacted the levels of travel but also the choice of transportation modes used by travelers. The decline in transit ridership was an immediate challenge to the transit system and operations. Pre‐COVID‐19, transit ridership had fallen over the last several years, and that ridership is expected to continue fall further and at a faster rate in the near‐term, post‐COVID‐19 period. A traveler sentiment survey by Oliver Wyman management consulting group in June 2020 showed 41 percent of transit riders may not revert back to transit once the stay‐at‐home mandates are removed. One of the influencing factors is that riders may be concerned about the ability to physically distance within transit vehicles. As a result, transit agencies will face new challenges in maintaining services and generating revenue. Desire for safety was ranked as a high priority by stakeholders during the US 101 Communities Connected public outreach efforts. Today’s definition of safety includes a wide range of public health concerns. As shown in the Google Community Mobility Report, movement at transit stations in Ventura County fell 50 percent during the peak of the “stay‐at‐home” mandate. As the mandates have lifted, movement has increased. In June 2020, activity was approximately 15 percent below pre‐COVID‐19 levels. This may be reflective of the higher share of workers who cannot telecommute to work and rely on transit to get to work, namely the captive riders. COVID‐19 is predicted to have a severe effect on farebox recovery, and it is uncertain if emergency funding will be available for transit operators to continue service beyond the initial funding provided by the CARES Act. Another effect from COVID‐19 has been the increased interest in bicycling and bicycle ownership. As the coronavirus pandemic shrunk daily activities and the typical distances traveled, people flocked to one of the most basic forms of
mobility: the bicycle. According to latest data, the March 2020 nationwide sales of bicycles, equipment and repair services nearly doubled compared to the same period last year. Sales of commuter and fitness bikes in the same month increased 66 percent, leisure bikes jumped 121 percent, children’s bikes went up 59 percent, and electric bikes rose 85 percent. By the end of April 2020, many stores and distributors had sold out of low‐end consumer bikes, and the United States is facing a bike shortage. Similarly, there has been an increase in e‐scooter use. More low‐cost e‐scooters have become available on the consumer market, making e‐scooters more accessible to a wider audience. Bicycles and e‐scooters have been alternative modes of transportation for former rideshare users who are now unwilling to use rideshare services such as Uber and Lyft during the pandemic. This trend will have to be monitored and accounted for while planning for active transportation and a more robust bicycle network.
8.3.4. Socioeconomic Factors Long‐term socioeconomic factors will have an impact on transportation performance in the corridor. One of the most pressing issues will be unemployment and the need for economic development. The unemployment rate in Ventura County jumped from 4.7 percent in March 2020 to 14.0 percent in April 2020. The April 2020 unemployment rate surpassed the highest rate seen during the 2008 Recession, as shown in Figure 47. There is an abundance of uncertainty regarding how long it will take for employment levels to return to pre‐COVID‐19 conditions. This will have a direct impact on travel in the corridor and indirect impact on general travel behavior, as many households will have a more limited income. The secondary effect of a weak economy and high unemployment rate include significant changes in population as residents move in and out of the region seeking a lower cost‐of‐living or employment. A weakened economy will also have a detrimental effect on government funding for transportation improvements as monies from retail sales and gas tax declines.

VCTC US 101 Communities Connected Study | 74
Figure 47 – Ventura County Unemployment Rate
8.3.5. Adapting Framework As previously mentioned, the evaluation framework developed in this study can be used to respond to new transportation issues and priorities resulting from COVID‐19. Some potential adaptations include:
Safety & Health: Extra emphasis can be placed on identifying projects that benefit the Safety and Health goal if there is growing concern in this area. This goal area can receive higher priority and have a higher weight in overall project evaluation. Furthermore, since the purpose of the Safety performance measure is to “increase safety for motorized and non‐motorized users,” and there is growing concern from transit users with regard to social distancing and spread of disease, additional evaluation criteria can be added to consider how individual projects have a positive impact of social distancing on transit. Similarly, the purpose of the Health performance measure is to create “opportunities for healthy lifestyles.” Additional criteria can be added to consider the promotion of a more robust trail network or accommodating the growing concern from active transportation users with regard to social
distancing on narrow trails and sidewalks. Social Equity: COVID‐19 has had a disproportionate negative impact on
low‐income and minority communities across the country. Additional prioritization may be placed on the corridor’s Social Equity goal area to address growing health and economic inequalities as a result of COVID‐19. Existing evaluation framework suggests that projects located in disadvantaged communities will have a positive impact on improving social equity in the corridor.
Multimodal Mobility: Long‐term shifts in commute patterns may make it less important to prioritize Congestion/VMT reduction and “person‐throughput” issues related to peak hour travel. Changes in travel demand may present an opportunity to place more emphasis on multi‐modal projects which benefit non‐work related trips such as recreation. The Google Community Mobility Report for Ventura County shows an increase in mobility in residential and park locations compared to pre‐COVID‐19. This may mean there is increased demand for transportation facilities, such as bicycle and pedestrian paths in residential and park locations.
Robust Economy: One of the largest negative impacts of COVID‐19 has

VCTC US 101 Communities Connected Study | 75
been on the world’s economy. While economic development was not identified as a priority pre‐COVID‐19 by stakeholders, it may become a more important goal area during this recovery period. The COVID‐19 recovery period will be a challenge and opportunity for the Ventura County economy. Unemployment may continue to be a challenge, and infrastructure projects that support job recovery may be prioritized. Telecommuting may be an opportunity for Ventura County as fewer residents may need to commute long distances to job centers in Thousand Oaks and beyond in western Los Angeles County for work. Projects in new technology areas, including broadband internet deployment, may be especially beneficial in a post‐COVID‐19 community. The region may be a more attractive place to live for workers in neighboring places such as Los Angeles who no longer need to be located close to job centers, or who may seek residence or employment in more sub‐urban or rural environments. The Robust Economy goal area may need to be prioritized and thus given a higher weight in project evaluation.
8.3.6. Alternate 2040 Future
The VCTM 2040 Baseline model was used to evaluate a future where telecommuting will increase from the pre‐COVID conditions of 5 percent in Ventura County to 20 percent, and other daily vehicle trips such as shopping, social/recreation, and schools will be reduced by 10 percent due to technology or a mode shift to biking or walking. The key findings from the analysis are as follows:
VMT is reduced by 11 percent VHT is reduced by 16 percent
To develop a transportation infrastructure that supports future demand, the focus was placed on short trips of less than 10 minutes. Based on 2017 Caltrans Household Travel Survey (CHTS), approximately 40 percent of daily trips in Ventra County are less than 10 minutes, and 90 percent of those trips are vehicle trips as shown in Figures 48 and 49. To increase biking and walking, the Project Evaluation Framework and Communities Connected Index (CCI) was used to identify the funded and unfunded active transportation and transit projects. A list of the top five active transportation and transit projects and programs are provided in Table 45.
Figure 48 – Ventura County Trips by Duration
Source: 2017 California Household Travel Survey
Figure 49 – Ventura County Trips Less Than 10 Minutes by Mode
44%
42%
11%3%
0%
10%
20%
30%
40%
50%
60%
70%
80%
90%
100%
Ventura County Trips
<= 10 min 10 ‐ 30 min 30 ‐ 60 min < 60 min
90.0%
1.6%8.4%
Ventura County Trips <= 10 min
Auto Transit Non‐Motorized

VCTC US 101 Communities Connected Study | 76
Source: 2017 California Household Travel Survey
Table 45 – Active Transportation and Transit Projects and Programs
PROJECT NAME PRIMARY PROJECT TYPE FUNDED COST (X1000) CCI Multimodal Transportation Center In Downtown Ventura Service Center, Parking, Layover, And Retail Space For Rail, Bus, And Bicycle Commuters. Transit N $50,000 62
The Southern California Optimized Rail Expansion (Score) Program Expands Capacity Of The Entire Metrolink System To Accommodate Service That Is More Regular And Frequent, Throughout The Entire Service Day (From Morning To Late Evening). Capital Investment
Transit N $7,905 48
Route 23 Bus Stop Installation (Ventura Rd.) Transit Y $588 46 Expand Bus Service: High Quality Transit Corridors Transit N $4,500 43 Countywide Bus Expansions (Includes Paratransit) Transit N $47,180 43 Bike Lanes Northeast Of Transportation Center Active Transportation Y $872 79 Ventura River Trail ‐ Sheridan Way Bike Path Link (Westside) Active Transportation Y $250 79 Eastside Sidewalk ‐ Ada Improvements Poinsettia Active Transportation Y $700 75 Gainsborough Road Improvement Active Transportation Y $650 64 Along Sp Branch Rail Line Montalvo Los Angeles County Line Santa Paula Branch Recreational Trail Active Transportation N $48,618 63 Thousand Oaks 2019 ATP – Recommended Projects Active Transportation N $39,500 57
8.4. Monitoring and Evaluating Progress Requirements of State and federal statutes such as Moving Ahead for Progress in the 21st Century (MAP‐21), Assembly Bill (AB) 32/State Bill (SB) 375 and SB 743 place a great emphasis on project and program performance monitoring. In addition, the Congestion Management Program (CMP) requires local governments to link land use, transportation, and air quality decisions at the regional and local level. The program requires that every county designate a regional roadway network for monitoring purposes and develop a deficiency plan to address deficiencies in levels of service on the network. However, the CMP uses a level‐of‐service (LOS) performance metric, which is no longer appropriate for CEQA‐level analysis. The Ventura County Transportation Commission has plans to update the CMP to use VMT in lieu of LOS in the coming fiscal year. As we move toward a more sustainable transportation system, a Performance‐based Planning and Programming (PBPP) approach is needed. The PBPP seeks to ensure that transportation investment decisions are followed through the life of the Plan and projects meet the established goals. One key element of PBPP is Performance Measures devised to measure effectiveness of the strategies in support of the Plan’s goals and objectivities. Such performance measures are included in the US 101 Communities Connected study. The final step of the corridor planning process is to monitor and evaluate
progress. Performance monitoring serves three key purposes:
1. Re‐establishing baseline and future conditions based on most recent data; 2. Measuring the impacts of newly built infrastructure projects; and 3. Providing new data on travel behavior and patterns in the corridor.
The approach, analysis, and results of this study can serve as a blueprint for future performance monitoring. As part of expanding the Comprehensive Transportation Plan (CTP) capabilities, a multimodal monitoring system should be developed to collect and analyze data on both the transportation infrastructure and its users. This may include additional survey work and/or considering third‐party GPS data. New information regarding transportation users – especially non‐auto users – will provide additional data for better informed multi‐modal planning. The transportation system is comprised of demand (users) and supply (infrastructure). Understanding the users across all socio‐economic groups and creation of a customer‐based viewpoint in planning and operating services is needed. A user‐based approach focuses on the needs of a community’s residents, understanding their mobility issues, and using targeted strategies to mitigate concerns and provide viable solutions. The ongoing performance measure monitoring system can be built on the existing

VCTC US 101 Communities Connected Study | 77
efforts taken by local and regional agencies’ data collection efforts such as countywide Congestion Management Plan (CMP) and SCAG regional monitoring
program by streamlining the process and lowering the data collection costs. A list of potential ongoing performance measures monitoring are provided in Table 46.
Table 46 – On-going Perform Measure Monitoring
OUTCOME PERFORMANCE MEASURE DEFINITION DATA SOURCE(S)
Location Efficiency
Share of household growth in HQTAs Share of total regional household growth occurring in HQTAs American Community Survey (ACS), SCAG Share of employment growth in HQTAs Share of total regional employment growth occurring in HQTAs ACS, SCAG VMT per capita Average annual vehicle miles traveled per person (automobiles & light
trucks) Highway Performance Monitoring System (HPMS)
Transit boardings per capita Average annual number of transit boardings per person National Transit Database (NTD) Annual household transportation cost Annual household spending on transportation including cost of vehicle
ownership, operation and maintenance, and transit ACS
Share of annual household income spent on housing
Share of annual household income spent on housing‐related expenses U.S. Bureau of Labor Statistics, ACS
Mobility Highway non‐recurrent delay Delay caused by atypical traffic patterns including accidents, weather, planned lane closures, special events
Caltrans Performance Measurement System (PeMS)
Mode share for work trips Share of work trips using various travel modes ACS Travel time to work Average travel time to work ACS
Transportation System Sustainability Reliability
State Highway System pavement condition
Share of State Highway System lane miles in 'Poor' condition and in 'Good' condition
Pavement Management System (Caltrans)
Local roads pavement condition Pavement Condition Index (PCI) for local roads Local Arterial Survey Database Travel time reliability for automobiles Day‐to‐day variation in travel times experienced by automobile travelers
along a specified roadway PeMS
Travel time reliability for trucks Day‐to‐day variation in travel times experienced by trucks along a specified roadway
PeMS
Productivity Lost highway lane miles Percent utilization of regional transportation system during peak demand conditions
PeMS, NTD
Safety and Public Health
Collision rates by severity and by mode Serious injury and fatality rates per 100 million vehicle miles by mode (all, bicycle/ pedestrian); and number of fatalities and serious injuries by mode
PeMS, Traffic Accident Surveillance & Analysis System (TASAS)
Mode share of walking and biking Mode share of walking and biking for work and non‐work trips ACS, CHTS Daily amount of walking and biking Percent of population having walk or bike trips by age group; and number
of minutes of walking and biking for those who had walk or bike trips CHTS
Asthma incidence Share of population in the region who were ever diagnosed with asthma California Health Interview Survey (CHIS) Asthma exacerbation Share of population in the region already diagnosed with asthma who had
asthma‐ related emergency room visits CHIS
Percent of households living <500 feet from high volume roadways
Share of households within 500 feet of a high volume roadway, (traffic volumes of over 100,000 vehicles per day in urban areas, or 50,000 vehicles per day in rural areas)
SCAG
Premature deaths due to PM2.5 Number of premature deaths due to long‐term exposure to particulate matter (estimated from monitored or modeled PM2.5 concentrations)
California Air Resources Board (ARB)
Percent of residents within 1/2 mile walk to parks and open space
Share of regional population living within walking distance to open space SCAG GIS database

VCTC US 101 Communities Connected Study | 78
OUTCOME PERFORMANCE MEASURE DEFINITION DATA SOURCE(S)
Number of acres of parks for every 1,000 residents
Number of acres of parks (local, regional, and beach parks) for every 1,000 residents
SCAG GIS database
Ambient air quality conditions Existing condition of air quality in the various air basins ARB
8.5. Upcoming Activities and Funding Applications
8.5.1. Future Planning Activities
The project evaluation results from the US 101 Communities Connected study can be used to support new funding for projects that fit within the future vision and support the study’s goals. The evaluation framework is universal, thus the US 101 Communities Connected evaluation framework can be utilized to support a variety of eligible funding programs. Decision‐makers can recommend projects that have high project performance results in this nexus area for future funding. The project scoring, CCI, provides all the information needed to evaluate each project in a multimodal environment, while also being compliant with CTC guidelines and State Highway Codes 2093‐20194. This study and the evaluation framework can be used in the funding application process to discuss the consistent strategic direction of the package of projects and programs. As VCTC is preparing to update its Comprehensive Transportation Plan (CTP) in the near future, this study can be used as a blueprint. Other corridors within the County can be identified and evaluated independently as well in the context of the County and region as one system. This approach will further improve interconnectivity and enhance connectivity among all modes of travel within the corridor and throughout the County. During the second phase of public outreach for 101 Communities Connected, VCTC staff received a substantial number of comments from members of the public regarding interest in the relationship between transportation projects along the U.S. 101 corridor and wildlife crossing in the Santa Monica Mountains. The U.S. 101 High Occupancy Vehicle (HOV) / Express Bus lanes project (also known as Our Future 101) is conducting analysis of wildlife crossings and potential impacts to wildlife as part of its preliminary design and environmental analysis. All comments received through the 101 Communities Connected public review process related to widening of the U.S. 101 freeway will be forwarded to the Our Future 101 project team. No independent wildlife crossing projects were included in the list of multimodal corridor projects within 101 Communities Connected to date, as such projects
are not directly related to managing congestion and improving mobility of transportation networks within the study area, and are outside of the scope of this study. However, to address significant public concern surrounding this issue, multi‐benefit highway and multimodal transportation projects that include components to foster connectivity for wildlife within and between natural habitats are recognized as an important area for further study across the countywide transportation system within the forthcoming Comprehensive Transportation Plan Update.
8.5.2. Next Steps in SB-1 Funding Applications One of the objectives of this study was to assist VCTC in pursuing the SB‐1 funding opportunities in coming years, including the next cycle of Solutions for Congested Corridors Program (SCCP) funding in 2022. The next cycle of SCCP funding is scheduled for 2022, which provides VCTC and its stakeholders time to develop a package of projects and programs in a post COVID‐19 setting that is aligned with US 101 Communities Connected goals and objectives. Communities Connected study provides a process for all transportation partners to work together to build a more sustainable and equitable multimodal transportation system. The project evaluation process provides flexibility in developing multimodal system investment packages and investment decisions for moving forward.

Project ID
Project Name/Description Primary Project TypeSecondary Project
TypeJurisdiction Completion Year
Cost (x1000)
Funded?
1 Ventura County Seacliff’s Siding Upgrade and Extension Transit None Caltrans 2024 $23,520 Y
2 Las Posas Road Bridge Enhancements Active Transportation None Camarillo 2024 $350 Y
3Pleasant Valley Road Class II Bike Lanes Project from 5th Street to Las Posas
Road (Approximately 8,700 feet)Active Transportation None Camarillo 2024 $2,953 Y
4 Camarillo Metrolink Station Pedestrian Undercrossing Transit Transit Camarillo 2023 $10,742 Y
5 Central Avenue from US 101 to City Limits (1700 ft.) Add Bike Lane. Active Transportation None Camarillo 2020 $2,000 N
6 Traffic Signal Improvements at Las Posas and Temple Arterial None Camarillo 2024 $550 Y
7 Las Posas Road Widening to 6 Lanes Arterial None Camarillo 2024 $3,071 Y
8US 101 from Santa Rosa Rd. to Central Ave. (Add 7 Miles of Auxiliary Lanes
Between Interchanges and Ramp Metering)Highway None Camarillo 2023 $232,175 N
9 Widen the SB 101 Freeway Off‐Ramp to Pleasant Valley Road from 1 Lane
to 2 LanesHighway None Camarillo 2020 $1,100 N
10Widen the SB 101 Freeway On‐Ramp from 1 to 2 Lanes and Improve
Intersection at Pleasant Valley Road Highway None Camarillo 2024 $4,308 N
11Reconfigure Central Ave. / Route 101 Interchange (includes Central Ave
Bridge Widening from 1 to 2 Lanes in Each Direction)Highway None Camarillo 2024 $50,000 N
12 Las Posas Park and Ride Parking Lot Expansion Transit None Camarillo 2024 $320 Y
13 Purchase Two Expansion Cut‐Away Paratransit Vehicles Transit None Camarillo 2020 $136 Y
14 Purchase One Replacement Cut‐Away Bus for Camarillo Transit‐Gas Transit None Camarillo 2021 $168 Y
15 Operating Assistance Transit None Camarillo 2029 $4,552 Y
16 ADA Paratransit Service Transit None Camarillo 2029 $850 Y
17 Camarillo Rail Station and Bus Maintenance Transit None Camarillo 2029 $3,750 Y
Appendix A
A1

Project ID
Project Name/Description Primary Project TypeSecondary Project
TypeJurisdiction Completion Year
Cost (x1000)
Funded?
18Springville Drive Bike Trail ‐ Extends Class I Bike Trail from Springville Drive
to Central AvenueActive Transportation None Camarillo 2039 $3,145 N
19Payments for Certificates of Participation for New Operations and
Maintenance FacilityTransit None
Gold Coast Transit District
2024 $4,600 Y
20 Operating Assistance Transit NoneGold Coast Transit
District2029 $10,500 Y
21 Operating Assistance – ADA Paratransit Capital Transit NoneGold Coast Transit
District2029 $8,090 Y
22 Business System Upgrade Including Software and Hardware Transit NoneGold Coast Transit
District2029 $1,000 Y
23 Transit Planning and Programming (Planning Support & ADM) Transit NoneGold Coast Transit
District2029 $625 Y
24 Passenger Awareness Activities (Planning Support & ADM) Transit NoneGold Coast Transit
District2029 $625 Y
25 Preventive Maintenance – Fixed Route & ADA Transit NoneGold Coast Transit
District2029 $9,595 Y
26 Business System Upgrades (Computer and Server Replacement) Transit NoneGold Coast Transit
District2021 $18 Y
27 Business System Upgrades (Computer and Server Replacement) Transit NoneGold Coast Transit
District2030 $166 N
28Business System Upgrades (Finance ER, Payroll, Planning Scheduling
Software, Servers)Transit None
Gold Coast Transit District
2022 $565 Y
29Business System Upgrades (Finance ER, Payroll, Planning Scheduling
Software, Servers)Transit None
Gold Coast Transit District
2022 $577 N
30 Expansion Demand Response Transit NoneGold Coast Transit
District2021 $130 Y
31 Expansion Demand Response Vehicles (Microtransit) Transit NoneGold Coast Transit
District2029 $1,248 N
32 Expansion Fixed Route Buses (CNG) Transit NoneGold Coast Transit
District2026 $5,300 N
33 Expansion Fixed Route Buses (ZEB) Transit NoneGold Coast Transit
District2030 $7,768 N
34 Facility Battery Storage and Solar Panel Systems Transit NoneGold Coast Transit
District2023 $1,041 N
35 Fuel Station Upgrades (Hydrogen) Transit NoneGold Coast Transit
District2024 $8,490 N
36 Maintenance Truck Transit NoneGold Coast Transit
District2025 $38 N
37 On Demand Software (Microtransit) Transit NoneGold Coast Transit
District2021 $25 Y
38 Replacement Fixed Route Buses ‐ CNG Transit NoneGold Coast Transit
District2021 $1,800 Y
A2

Project ID
Project Name/Description Primary Project TypeSecondary Project
TypeJurisdiction Completion Year
Cost (x1000)
Funded?
39 Relief Car ‐ Sedan Transit NoneGold Coast Transit
District2027 $526 N
40 Replacement Demand Response Vehicles Transit NoneGold Coast Transit
District2030 $2,546 N
41 Replacement Fixed Route Buses (CNG) Transit NoneGold Coast Transit
District2028 $21,362 N
42 Replacement Fixed Route Buses (ZEB) Transit NoneGold Coast Transit
District2024 $19,315 N
43 Website Redesign Transit NoneGold Coast Transit
District2021 $80 Y
44 Ventura Rd. Bus Stop Construction Phase II Transit NoneGold Coast Transit
District2023 $500 N
45 Wooley Road Pedestrian Improvements Active Transportation None Oxnard 2024 $2,400 N
46 Oxnard Boulevard Bicycle Facilities Installation Active Transportation Arterial Oxnard 2021 $1,591 Y
47 Oxnard Boulevard Gap Closure Active Transportation None Oxnard 2023 $860 Y
48 Bike Lanes from US 101 to Gonzales Rd. Active Transportation None Oxnard 2021 $1,550 Y
49 Hemlock Street Pedestrian (Districts 1 and 4) Active Transportation None Oxnard 2024 $1,700 N
50 La Colonia Green Alleys (Bike Lanes) Active Transportation None Oxnard 2024 $1,078 Y
51 Ventura Boulevard Sidewalk ‐ Rose Avenue to Balboa Street Active Transportation None Oxnard 2021 $1,151 Y
52 C Street Bicycle Facilities Installation Active Transportation None Oxnard 2020 $371 Y
53Install 1.9 Mile Class II Bike lanes, 6.3 Class III Bike Lanes and Improvements to the Existing 3.69 Mile Bike Lane. Northeast of Oxnard Transportation
CenterActive Transportation None Oxnard 2021 $872 Y
54At Rice Ave. Railroad Grade Separation ‐ Includes Widening of Rice From
Sturgis Road to 1350' South of Fifth StreetArterial None Oxnard 2026 $117,000 Y
55Victoria Ave. Widening Improvement – Gonzales Road Oxnard City Limits
Widen From 4 Lanes to 6 LanesArterial None Oxnard 2030 $8,437 N
A3

Project ID
Project Name/Description Primary Project TypeSecondary Project
TypeJurisdiction Completion Year
Cost (x1000)
Funded?
56Rose Ave. at SR‐34 (E. Fifth St.) SR 34 Construct 4 Lane Grade Separation
with Left Turn Pockets Arterial None Oxnard 2030 $27,000 N
57Gonzales Rd / Oxnard Blvd. UPRP Tracks Construct 6 Lanes in Both
Directions Grade Separation at SR‐1 and UPRP Tracks with Left Turn PocketsArterial None Oxnard 2030 $21,001 N
58Vineyard Ave. Oxnard Blvd. Mary’s Drive Construct 6 Lanes Total for Both
Directions and Grade Separation Over UPPR TracksArterial None Oxnard 2030 $20,000 N
59Colonial Rd./Camino Del Sol Oxnard Blvd. (RT 1) to Entrada Dr. Construct 4
LanesArterial None Oxnard 2026 $10,269 Y
60 Del Norte Blvd. – Improve Interchange, Widen Del Norte Bridge Over 101 (From Ventura Blvd. to US 101 SB Ramps) From 2 to 4 Lanes Plus Left Turn
Lane. Add NB Loop Onramps and Realign and Improve Other RampsHighway None Oxnard 2030 $56,700 N
61 Ventura Road Transit Line Construct Bus Stop Improvements Transit None Oxnard 2020 $500 Y
62 Systemwide Preventative Maintenance for Metrolink Commuter Rail Transit None SCRRA 2029 $34,911 Y
63Systemwide Rehabilitation and Renovation Including the Purchase of
Replacement Locomotives with Tier‐4 Technology, Track, Signals, Platforms, Power systems, Facilities, Rolling Stock, Equipment, Signage
Transit None SCRRA 2029 $20,367 Y
64 2019 ATP Bike Lane Corridor Improvements Active Transportation None Thousand Oaks 2024 $10,700 N
65 2019 ATP Sidewalk Corridor Improvements Active Transportation None Thousand Oaks 2024 $28,800 N
66 Gainsborough Road Improvements Active Transportation Arterial Thousand Oaks 2024 $650 N
67 Add Bike/Pedestrian Lanes Between NB and SB Boarchard Ramps Active Transportation None Thousand Oaks 2030 $3,500 N
68 Rancho Road Sidewalk and Bike Lane Improvements Active Transportation None Thousand Oaks 2022 $1,625 Y
69 Thousand Oaks Boulevard at Moorpark Road Widening Arterial None Thousand Oaks 2024 $350 N
70 Moorpark Road North of Thousand Oaks Boulevard Widening Arterial None Thousand Oaks 2024 $1,250 N
A4

Project ID
Project Name/Description Primary Project TypeSecondary Project
TypeJurisdiction Completion Year
Cost (x1000)
Funded?
71 Hodencamp Road Improvements Arterial None Thousand Oaks 2024 $135 N
72 Newbury Road East of Ventu Park Road Widening and Improvements Arterial None Thousand Oaks 2024 $200 Y
73 Thousand Oaks Boulevard at Rancho Road Widening Arterial None Thousand Oaks 2024 $3,300 N
74 Old Conejo Road from Ruth Drive to Reino Road Widening Arterial None Thousand Oaks 2024 $850 N
75 Conejo School Rd/Willow Sidewalk and Bike Lane Improvements Active Transportation None Thousand Oaks 2020 $5,100 Y
76 Moorpark Road/Hillcrest Drive Intersection Improvements Arterial None Thousand Oaks 2024 $1,260 N
77 Agoura Road/Westlake Boulevard Arterial None Thousand Oaks 2024 $1,496 Y
78 Hampshire Road at Thousand Oaks Boulevard Modification Arterial None Thousand Oaks 2024 $260 N
79 Hampshire Road/101 Freeway Interchange Replacement Highway None Thousand Oaks 2023 $66,000 N
80 101 Freeway/Lynn Road Intersection Improvements Highway None Thousand Oaks 2024 $8,300 N
81 Dial‐A‐Ride Service – Capital Transit None Thousand Oaks 2024 $450 Y
82 Dial‐A‐Ride Vehicle Capital and Maintenance Service Transit None Thousand Oaks 2024 $857 Y
83 ADA Service – Paratransit Capital Transit None Thousand Oaks 2024 $500 Y
84 Purchase 2 Replacement EV Buses Transit None Thousand Oaks 2029 $1,100 Y
85 New Bus Washer for Thousand Oaks Transit None Thousand Oaks 2025 $800 Y
86 Bus Stop Enhancement for Thousand Oaks Transit Transit None Thousand Oaks 2023 $130 Y
87New Transit Technologies – Electronic Dispatch, Automated Stop
Annunciators, Transit Reporting Software, and Projects To Be Determined Transit None Thousand Oaks 2024 $251 Y
88 Transit Planning Transit None Thousand Oaks 2024 $950 Y
89At Municipal Center, Upgrade Fueling Station to Add New Dispensers, Fuel
Control System, and IGHT Emitting Diode LightingTransit None Thousand Oaks 2021 $302 Y
A5

Project ID
Project Name/Description Primary Project TypeSecondary Project
TypeJurisdiction Completion Year
Cost (x1000)
Funded?
90At the Transportation Center on Rancho Rd. and the Municipal Service
Center on Rancho Conejo Blvd., Construction of EV Charging InfrastructureTransit None Thousand Oaks 2024 $4,000 Y
91At Janss Road Park and Ride, New Light Poles and LED Fixtures, New Vinyl Fencing, Asphalt and Overlay, Installation of Additional EV Charger, New
StrippingTransit None Thousand Oaks 2023 $200 Y
92Preventive Maintenance – Fixed Route and Dial‐Ride Vehicles and Facility
Including Transit Centers and Bus StopsTransit None Thousand Oaks 2025 $1,000 Y
93 Along Branch Rail Line‐ Santa Paula Branch Recreation Trail Active Transportation None VCTC 2024 $48,618 N
94 Transportation Enhancements Countywide Active Transportation Program
ProjectsActive Transportation None VCTC 2037 $14,379 N
95 Grade Separation Countywide Improvements Arterial None VCTC 2025 $147,271 N
96 ITS Project Implementation Arterial None VCTC 2039 $83,876 N
97Ventura Freeway Los Angeles/Ventura County Line SR‐33 US 101‐
Add One HOV Lane in Each DirectionHighway None VCTC 2029 $700,000 N
98 Purchase Two Trolley‐Like Buses for Local Circulators Service Transit None VCTC 2029 $400 Y
99Automatic Vehicle Locator System Upgrade, Passenger Counting, and Fare
Box System Transit None VCTC 2020 $3,046 Y
100Grouped Projects for Operation Assistance, PLNG, Purchase or Replace Vehicle or Maintenance Expense – Elderly and Disabled New Freedoms
Initiative Transit None VCTC 2029 $1,749 Y
101 Operating Assistance Transit None VCTC 2029 $16,690 Y
102 New Buses to Replace Existing Vehicles, Operation Assistance to Transit
AgenciesTransit None VCTC 2029 $1,278 Y
103Fare Collection and Ridership Monitoring and Automotive Vehicle Locator
Equipment and MaintenanceTransit None VCTC 2019 $2,191 Y
A6

Project ID
Project Name/Description Primary Project TypeSecondary Project
TypeJurisdiction Completion Year
Cost (x1000)
Funded?
104 Transit Mobility Management Information Center Transit None VCTC 2024 $994 Y
105 Elderly/Disabled Planning Including Patron Disability Evaluation Transit None VCTC 2020 $1,452 Y
106 Transit Programming/Planning Transit None VCTC 2029 $4,325 Y
107 VCTC Bus System Planning Transit None VCTC 2029 $2,097 Y
108 Transit Outreach Activity Transit None VCTC 2029 $2,400 Y
109Three Year Demonstration Express Bus Service ‐ East/West County Connector Serving Simi Valley, Moorpark, Camarillo, and Ventura
Transit None VCTC 2029 $1,100 Y
110Grouped Projects for Operating Assistance, Planning, Replace Vehicles or
Min Exp. – Jobs Access Reverse Commute ProjectsTransit None VCTC 2029 $284 N
111 VCTC Intercity Capital Lease/Maintenance Contract Transit None VCTC 2029 $3,885 N
112 Multimodal Transportation Center in Downtown Ventura Transit None VCTC 2026 $50,000 N
113 Countywide Transit Service Expansion Transit None VCTC 2039 $31,453 N
114 Transit Planning & Application Transit None VCTC 2039 $52,423 N
115 Countywide Bus Expansions (Includes Paratransit) Transit None VCTC 2039 $47,180 N
116 Countywide New Transit Facility Improvements Transit None VCTC 2039 $31,453 N
117 Countywide Misc. Transit Items Transit None VCTC 2039 $15,727 Y
118 Metrolink Commuter Rail Service Improvements Transit None VCTC/SCRRA 2025 $95,700 Y
A7

Project ID
Project Name/Description Primary Project TypeSecondary Project
TypeJurisdiction Completion Year
Cost (x1000)
Funded?
119 Main Street Bridge Replacement Arterial None Ventura 2024 $21,221 N
120On Wells Road from Carlos to Citrus – Wells Center Bus Stop Improvements including New Sidewalk with Retaining Wall, Access Ramps, Additional Bus
ShelterActive Transportation Transit Ventura 2020 $350 Y
121 Eastside Sidewalk ‐ ADA Improvements Poinsettia Active Transportation None Ventura 2024 $700 Y
122 Hwy. 126 Bike Path Gap Closure (Thiele) Active Transportation None Ventura 2022 $1,000 N
123 Ventura River Trail ‐ Sheridan Way Bike Path Link (Westside) Active Transportation None Ventura 2023 $250 N
124Olivas Park Drive Perkin Ave. Auto Center Drive Construction 4‐Lane
ExtensionArterial None Ventura 2020 $22,000 Y
125 SR‐33 Stanley Ave. New Two‐Lane Freeway Bridge for SB Traffic Arterial None Ventura 2037 $18,000 Y
126 TDM Countywide Misc. TDM Arterial None Ventura 2026 $6,440 Y
127 Traffic Signal System Update ‐ Citywide Arterial None Ventura 2022 $18,000 Y
128Reconfigure NB California St. Off‐ramp to Terminate at Oak St. Instead of
California St. Highway None Ventura 2023 $10,580 N
129Santa Clara Widening Improvement North of Oxnard City Limits SR‐118
Widen from 2 to 4 LanesArterial None Ventura County 2030 $27,000 N
130Harbor Blvd. Widening Improvement Oxnard City Limits Ventura City Limits
Widen from 2 to 4 Lanes or Widening the Existing BridgeArterial None Ventura County 2030 $60,000 N
131Pleasant Valley Road Widening Improvement Dodge Rd. Las Posas Road
Widen from 2 to 4 LanesArterial None Ventura County 2030 $60 N
A8

Project ID
Project Name/Description Primary Project TypeSecondary Project
TypeJurisdiction Completion Year
Cost (x1000)
Funded?
132Victoria Ave. Widening Improvement at Gonzales Rd. Ventura City Limits
Widen from 4 Lanes to 6 LanesArterial None Ventura County 2025 $16,500 N
133Los Angeles Ave. Route 232 Santa Clara Avenue Widen from 2 Lanes to 4
LanesArterial None Ventura County 2030 $42,000 N
134 Central Ave. Camarillo City Limit Santa Clara Ave. Widen from 2 to 4 Lanes Arterial None Ventura County 2030 $6,400 N
135 Olivas Park Drive Telephone Road Victoria Ave Widen from 2 to 4 Lanes Arterial None Ventura County 2028 $8,345 N
136Harbor Blvd. at Gonzales Road Add 2 Southbound Through Lanes and 2
Northbound Through LanesArterial None Ventura County 2030 $2,600 N
137 SR‐126 to US‐101 Connection Freeway None Ventura County 2040 $65,000 N
138 Victoria Avenue/US 101 Interchange Freeway None Ventura County 2040 $60,000 N
A9

Appendix B
Performance Measure Description and Methodologies

B1
Performance Measure #1: Safety Target: Increase safety for motorized and non‐motorized users
Background This performance measure is related to the Connected Corridor Health & Safety Goal and is focused on public health by evaluating the impacts transportation improvements have on safety for all users of the transportation network. The Safety performance measure assesses how corridor projects impact VCTC’s target to increase safety for motorized and non‐motorized users in the US 101 corridor.
This performance measure supports existing state, regional, and local policies and goals related to roadway safety. State policies and goals listed in the CTC 2018 Comprehensive Multimodal Corridor Plan Guidelines that have a nexus with the US 101 Connected Communities Safety performance measure include: increasing safety and security of the transportation system for motorized and non‐motorized users; improving public health; and increasing active transportation levels (walking, cycling, transit). The performance measure also supports the SCAG Connected SoCal RTP (2020) regional goal to “Improve mobility, accessibility, reliability, and travel safety for people and goods” and VCTC’s CTP (2013) vision statement to have “[a] connected and integrated transportation system that provides … safe … options”. The safety element of the CTP vision is for travel to “be safer in Ventura County…Better road conditions and transit stops will improve protections between vehicles, bicycles and pedestrians.” The CTP vision also states “[c]ommunities and cities will have safe and high quality streets and connections to neighboring areas.”
Evaluation Methodology Projects increase safety if they are likely to reduce collisions and minimize conflict zones between motorized and non‐motorized users. Expanding safety performance metrics from the CTC 2018 Comprehensive Multimodal Corridor Plan Guidelines and the SCAG Connected SoCal RTP to incorporate the local CTP vision, this study measures safety performance by assessing likely project impacts to the number and rate of fatal and injury crashes; number and rate of pedestrian and bicycle crashes; policies that support public safety and security such as lighting and other crime prevention and safety measures; road conditions; and quality of transit stops.
In this study, project performance for safety is measured by both project location and project type characteristics. Projects are rated on Safety based on the following criteria:
Score Criteria High Location: Project in high collision zone. High collision zones are TAZs with
above average number of accidents. Characteristics: Type of project is
Transit – Targeted Safety Measures, Grade Separation Arterial – Targeted Safety Measures, Bridge and Grade Separation,
Grade Separation and Crossing Projects Highway – Miscellaneous targeted safety projects
Medium Location: Project not in high collision zone. Characteristics: Type of project is

B2
Active Transportation – 1st/Last Mile, Complete Streets, Bike/ped Bridges, Bikeway – Class 1 or 4, New Sidewalk/Trail, Pedestrian Improvements
Arterial – Intersection Improvement, Access Management Highway – Interchange Enhancement
Low Location: Project not in high collision zone. Characteristics: Type of project is
Active Transportation – Bikeway – Class 2, Education or Promotion Transit – Bus Replacement, Transit Maintenance, Transit Operations,
Transit Centers, Bus Stations, Bus Stops, Dial‐a‐Ride/Paratransit, Zero Emission Bus Replacement
Arterial – ITS/Operational Improvements, Corridor Improvement, State of Good Repair
Highway – Ramp Improvement, Auxiliary Lane, Integrated Corridor, ITS/Operational Improvements, New Interchange, Rehabilitation
No Positive Impact All other projects
Performance Measure #2: Health Target: Improve opportunities for healthy lifestyles
Background This performance measure is related to the Connected Corridor Health & Safety Goal and is focused on public health by evaluating the impacts transportation improvements have increasing active transportation. The Safety performance measure assesses how corridor projects impact VCTC’s target to improve opportunities for healthy lifestyles in the US 101 corridor.
This performance measure supports existing state and regional policies and goals related to roadway safety. State policies and goals listed in the CTC 2018 Comprehensive Multimodal Corridor Plan Guidelines that have a nexus with the US 101 Connected Communities Health performance measure include: improving public health; and increasing active transportation levels (walking, cycling, transit). The performance measure also supports the SCAG Connected SoCal RTP (2020) regional goal to “Support healthy and equitable communities.”
Evaluation Methodology Projects improve opportunities for healthy lifestyles if they are likely to increase walking, cycling, and transit in the corridor. Projects that support healthy lifestyles may increase opportunities for non‐motorized or transit commutes, shopping trips, and recreational road uses. This study measures health performance through metrics adopted from the CTC 2018 Comprehensive Multimodal Corridor Plan Guidelines and the SCAG Connected SoCal RTP related to health accessibility. This study measures health performance by assessing likely project impacts to access to multi‐modal choices; first‐mile/last‐mile considerations; considerations of complete streets policies and the creation of networks of non‐motor vehicle facilities that connect residential, recreational, and employment opportunities; and mode share for walking and biking.
In this study, project performance for health is measured project type characteristics. Projects are rated on Health based on the following criteria:

B3
Score Criteria High Characteristics: Type of project is
Active Transportation – 1st/Last Mile, Bikeshare, Bikeway – Class 1 or 4, New Sidewalk/Trail
Medium Characteristics: Type of project is Active Transportation – Complete Streets, Bike/ped Bridges, Bikeway –
Class 2, Education or Promotion, Pedestrian Improvements Transit – New BRT, New Bus, New Rail, Dial‐a‐Ride/Paratransit
Low Characteristics: Type of project is Active Transportation – Bikeway – Class 3 or Unspecified Transit – Bus Replacement, Transit Maintenance, Transit Operations,
Transit Centers, Park and Ride, Bus Station, Bus Stops, Metrolink Commuter Rail Program Enhancements, Zero Emissions Bus Replacement
Arterial – ITS/Operational Improvements, Corridor Improvement, Intersection Improvement, State of Good Repair, Targeted Safety Projects, Access Management
No Positive Impact All other projects
Performance Measure #3: Air Quality Target: Reduce criteria pollutants and advance the State’s air quality goals
Background This performance measure is related to the Connected Corridor Health & Safety Goal and is focused on public health by evaluating the impacts transportation improvements have on air quality. The Air Quality performance measure assesses how corridor projects impact VCTC’s target reduce criteria pollutants and advance the State’s air quality goals in the US 101 corridor.
This performance measure supports existing state and regional policies and goals related to air quality. State policies and goals listed in the CTC 2018 Comprehensive Multimodal Corridor Plan Guidelines that have a nexus with the US 101 Connected Communities Air Quality performance measure include: improving air quality; reducing exposure to toxic air contaminants and criteria air pollutants in communities most impacted by air pollution; prioritizing transportation sustainability; and improving public health. The performance measure also supports the SCAG Connected SoCal RTP (2020) regional goal to “Reduce greenhouse gas emissions and improve air quality”.
Evaluation Methodology Projects improves air quality if they are likely to reduce criteria air pollutants. This study incorporates metrics outlines in the CTC 2018 Comprehensive Multimodal Corridor Plan Guidelines and the SCAG Connected SoCal RTP to measures safety performance by assessing likely project impacts to reduce criteria pollutants (airborne particulates, ground level ozone and other pollutants), pollution‐related respiratory diseases, and single occupancy vehicle mode share.
In this study, project performance for safety is measured by project type characteristics. Projects are rated on Air Quality based on the following criteria:

B4
Score Criteria High Characteristics: Type of project is
Active Transportation – All projects Transit – New BRT, New Rail, EV Charging, Zero Emission Bus
Replacement Medium Characteristics: Type of project is
Transit – Metrolink Commuter Rail Program Enhancements, New Bus Low Characteristics: Type of project is
Transit – Bus Replacement, Transit Maintenance, Transit Operations, Transit Centers, Park and Ride, Bus Stations, Bus Stops
Highway – Interchange Enhancements, HOV/HOT/Express Lanes, Integrated Corridor, ITS/Operational Improvements
No Positive Impact All other projects
Performance Measure #4: Disadvantaged Communities Target: Balance transportation, environment and community
Background This performance measure is related to the Communities Connected Social Equity Goal and is focused on equitable access to transportation improvements by evaluating the likelihood of transportation improvements have a positive impact on residents in disadvantaged communities suffering from a combination of economic, health, and environmental burdens. The Disadvantaged Communities performance measure assesses how corridor projects impact VCTC’s target to balance transportation, environment and community in the US 101 corridor.
This performance measure supports existing state, regional, and local policies and goals related to equitable transportation. State policies and goals listed in the CTC 2018 Comprehensive Multimodal Corridor Plan Guidelines that have a nexus with the US 101 Connected Communities Disadvantaged Communities performance measure include: improving multi‐modal mobility and accessibility for all Californians, especially low‐income and disadvantaged communities; reducing exposure to toxic air contaminants and criteria air pollutants in communities most impacted by air pollution; improving public health; preventing residential and small business displacement; encouraging sustainable land use patterns; and increasing the supply of affordable housing. The performance measure also supports the SCAG Connected SoCal RTP (2020) regional goal to “Support healthy and equitable communities” and VCTC’s CTP (2013) vision statement to have a system that is “inclusive of all community members and needs, balancing all interests”. The CTP vision is for the “transportation system [to] be focused on meeting community members’ basic needs” including “access to schools and recreation centers… jobs and shopping…[and] medical and social services.”
Evaluation Methodology Projects improve the balance between transportation, environment and community if they are likely to serve disadvantaged communities. Expanding economic development and environmental justice performance metrics from the CTC 2018 Comprehensive Multimodal Corridor Plan Guidelines and the SCAG Connected SoCal RTP to incorporate the local CTP vision, this study measures disadvantaged communities performance by assessing likely project impacts to access to jobs and education for
B5
disadvantage populations, emissions and health impacts for areas with high concentrations of minority and low income population, travel time and travel distance savings for minority and low income populations.
In this study, project performance for safety is measured by project location. Projects are rated on serving Disadvantaged Communities based on the following criteria:
Score Criteria High Location: Project located in disadvantaged area. Disadvantaged areas are
defined by California Environmental Protection Agency’s Cal EnviroScreen tool. No Positive Impact All other projects
Performance Measure #5: Congestion/VMT Reduction Target: Minimize vehicle miles traveled
Background This performance measure is related to the Connected Corridor Multi‐Modal Mobility Goal and is focused on mobility by evaluating the impacts transportation improvements have reducing congestion. The Congestion/VMT Reduction performance measure assesses how corridor projects impact VCTC’s target to minimize vehicle miles traveled in the US 101 corridor.
This performance measure supports existing state, regional, and local policies and goals related to congestion/VMT reduction. State policies and goals listed in the CTC 2018 Comprehensive Multimodal Corridor Plan Guidelines that have a nexus with the US 101 Connected Communities Congestion/VMT Reduction performance measure include improving transportation system operations and efficiency, reducing growth in vehicles miles traveled, improving jobs‐housing balance. The performance measure also supports VCTC’s CTP (2013) vision statement to have “[a] connected and integrated transportation system that provides … convenient … options” and meets community member needs. The CTP vision is for transportation system to be “more connected”, have “more choices for traveling locally and beyond”, and have “traffic and congestion levels… better managed to keep people moving smoothly”, meet business need to have “good access for customers, employees, deliveries, and tourists.”
Evaluation Methodology Projects minimize vehicle miles traveled if they are likely to increase opportunities for non‐single occupancy vehicle travel, improve jobs‐housing balance to reduce length of commute trips, and improve network connectivity to reduce length of local trips. Expanding congestion/delay, mobility/accessibility, economic development, efficient land use performance metrics from the CTC 2018 Comprehensive Multimodal Corridor Plan Guidelines and the SCAG Connected SoCal RTP to incorporate the local CTP vision, this study measures safety performance by assessing likely project impacts to vehicle miles travelled (considering impact of induced demand), access to multi‐modal choices, number of households within 45‐minute transit ride of major employment center or college, travel time reliability for non‐auto trips, first/last mile considerations, complete streets policies and creation of network of non‐motor vehicle facilities that connect residential and employment opportunities, access to jobs and education, non‐single occupancy vehicle mode share.

B6
In this study, project performance for congestion/VMT reduction is measured by project type characteristics. Projects are rated on Congestion/VMT Reduction based on the following criteria:
Score Criteria High Characteristics: Type of project is
Transit – New BRT, New Bus, New Rail Arterial – Targeted Safety Measures, Bridge and Grade Separation,
Grade Separation and Crossing Projects Medium Characteristics: Type of project is
Transit – Metrolink Commuter Rail Program Enhancements, Marketing/Outreach, Planning, Demonstration Service
Low Characteristics: Type of project is Active Transportation – All projects Transit – Transit Centers, Park and Ride, Bus Stations, Bus Stops,
Unspecified Projects No Positive Impact All other projects
Performance Measure #6: Person Throughput Target: Maximize person throughput
Background This performance measure is related to the Connected Corridor Multi‐Modal Mobility Goal and is focused on transportation efficiency by evaluating the impacts transportation improvements have reducing congestion and delay in the corridor. The Person Throughput performance measure assesses how corridor projects impact VCTC’s target to maximize person throughput in the US 101 corridor.
This performance measure supports existing state, regional, and local policies and goals related to congestion and delay reduction. State policies and goals listed in the CTC 2018 Comprehensive Multimodal Corridor Plan Guidelines that have a nexus with the US 101 Connected Communities Person Throughput performance measure encouraging development of new or enhanced multimodal infrastructure, improving transportation system operations and efficiency, increasing active transportation levels (walking, cycling, transit). The performance measure also supports the SCAG Connected SoCal RTP (2020) regional goal to “Increase person and goods throughput and travel choices within the transportation system” and VCTC’s CTP (2013) vision statement to have “[a] connected and integrated transportation system that provides … convenient … options” and meets community member needs. The CTP vision is for transportation system to be “more connected”, have “more choices for traveling locally and beyond”, and have “traffic and congestion levels… better managed to keep people moving smoothly”, meet business need to have “good access for customers, employees, deliveries, and tourists.”
There are many overlapping goals of the Connected Corridor Congestion/VMT Reduction and Person Throughput performance measures. The two measures represent two approaches to reducing congestion in the corridor. The Congestion/VMT Reduction performance measure is more focused on reducing trip distances for commutes, school, and shopping trips while the Person Throughput performance measure is more focused on reducing delay on the transportation network.

B7
Evaluation Methodology Projects maximize person throughput if they are likely to reduce delay on the transportation network through operational improvements or increase opportunities for non‐single occupancy vehicle travel to use a greater amount of the non‐vehicle capacity on the network. Expanding congestion/delay, mobility/accessibility from the CTC 2018 Comprehensive Multimodal Corridor Plan Guidelines and the SCAG Connected SoCal RTP to incorporate the local CTP vision, this study measures safety performance by assessing likely project impacts to person throughput, person hours of delay, travel time reliability, access to multi‐modal choices, and non‐single occupancy vehicle mode share.
In this study, project performance for Peron Throughput is measured by project type characteristics. Projects are rated on Person Throughput based on the following criteria:
Score Criteria High Characteristics: Type of project is
Transit – New BRT, New Bus, New Rail Medium Characteristics: Type of project is
Active Transportation – 1st/Last Miles, Complete Streets, Bikeway – Class 1 or 4, New Sidewalk/Trail
Transit – Transit Centers, Park and Ride, Bus Stations, Metrolink Commuter Rail Program Enhancements
Arterial – Capacity Enhancement, ITS/Operational Improvement Highway – Auxiliary Lane, Capacity Enhancement, HOV/HOT/Express
Lanes, Integrated Corridor, ITS/Operational Improvements, New Interchange
Low Characteristics: Type of project is Active Transportation – Bike/ped Bridges, Bikeshare, Bikeway – Class
2, Bikeway – Class 3 or Unspecified, Education or Promotion, Pedestrian Improvements
Transit – Bus Replacement, Transit maintenance, Transit Operations, Marketing/Outreach, Planning, Demonstration Service
Arterial – Corridor Improvement, Intersection Improvement, Bridge and Grade Separation
Highway – Ramp Improvements, Interchange Enhancements No Positive Impact All other projects
Performance Measure #7: Transit Proximity Target: Improves access to transit
Background This performance measure is related to the Multi‐Modal Mobility Goal and is focused on transit use by evaluating the likelihood of transportation improvements have a positive transit accessibility and quality of transportation service. The Transit Proximity performance measure assesses how corridor projects impact VCTC’s target to improve access to transit in the US 101 corridor.
This performance measure supports existing state, regional, and local policies and goals related to transit. State policies and goals listed in the CTC 2018 Comprehensive Multimodal Corridor Plan

B8
Guidelines that have a nexus with the US 101 Connected Communities Transit Proximity performance measure include: encouraging development of new or enhanced multimodal infrastructure, increasing active transportation levels (walking, cycling, transit). The performance measure also supports the SCAG Connected SoCal RTP (2020) regional goals to “Improve mobility, accessibility, reliability, and travel safety for people and goods” and “Increase person and goods throughput and travel choices within the transportation system” and VCTC’s CTP (2013) vision statement to have “[a] connected and integrated transportation system that provides … convenient … options” and meets community member needs. The CTP vision is for the Ventura County to have “many options that are easy to use at the local and regional levels” to improve connectivity and to “[i]mrpov[e] local streets, roads, highways and rail [to]… expand and enhance their use for bus, bicycle, pedestrian, train rideshare, car share… creating more choices for traveling locally and beyond.”
Evaluation Methodology Projects improve access to transit if they grow the existing transit network. Expanding accessibility and efficient land use performance metrics from the CTC 2018 Comprehensive Multimodal Corridor Plan Guidelines and the SCAG Connected SoCal RTP to incorporate the local CTP vision, this study measures transit proximity performance by assessing likely project impacts to increasing transit use and increasing transit accessibility.
In this study, project performance for transit proximity is measured by project location based on the following criteria:
Score Criteria High Location: Project located in proximate to existing transit station. These
locations are defined as within half a mile of a transit station. No Positive Impact All other projects
Performance Target #8: Accessibility Target: Improve accessibility and connectivity for travelers; close gaps in the transportation network
Background This performance measure is related to the Connected Corridor Multi‐Modal Mobility Goal and is focused on transportation accessibility by evaluating the impacts transportation improvements have on making transportation more accessible to and functional. The Accessibility performance measure assesses how corridor projects impact VCTC’s target to improve accessibility and connectivity for travelers and close network gaps in the US 101 corridor.
This performance measure supports existing state, regional, and local policies and goals related to transportation accessibility. State policies and goals listed in the CTC 2018 Comprehensive Multimodal Corridor Plan Guidelines that have a nexus with the US 101 Connected Communities Accessibility performance measure include: preserving existing transportation infrastructure, encouraging development of new or enhanced multimodal infrastructure, improving multi‐modal mobility and accessibility for all Californians, especially low‐income and disadvantaged communities, increasing active transportation levels (walking, cycling, transit). The performance measure also supports the SCAG Connected SoCal RTP (2020) regional goal to “Improve mobility, accessibility, reliability, and travel safety

B9
for people and goods” and VCTC’s CTP (2013) vision statement to have “[a] connected and integrated transportation system that provides … accessible… options” and meets community member needs. The CTP vision is for transportation system to have “[m]any options that are easy to use at local and regional levels…to improve connectivity.”
Evaluation Methodology Projects improve accessibility and connectivity if they are likely to increase the size and scope of the existing transportation network, especially for non‐auto modes, and close gaps in the network. Expanding accessibility and mobility performance metrics from the CTC 2018 Comprehensive Multimodal Corridor Plan Guidelines and the SCAG Connected SoCal RTP to incorporate the local CTP vision, this study measures accessibility performance by assessing likely project impacts to access to multi‐modal choices (e.g. access to traveler information, availability of connections between modes, convenience of multiple transportation choices, vehicle ownership), number of households within 45‐minute transit ride of major employment center or college, travel time reliability for non‐auto modes, first/last‐mile considerations, consideration of complete streets policies and the creation of networks of non‐motor vehicle facilities (e.g. pedestrian, cycling) that connect residential, recreational, and employment opportunities, and transit mode share.
In this study, project performance for Accessibility is measured by project type characteristics based on the following criteria:
Score Criteria High Characteristics: Type of project is
Transit – New BRT, New Bus, New Rail, Dial‐A‐Ride/Paratransit Highway – HOV/HOT/Express Lanes
Medium Characteristics: Type of project is Active Transportation – All projects Transit – Transit Centers, Park and Ride, Bus Stations, Bus Stops,
Metrolink Commuter Rail Program Enhancements Arterial – Capacity Enhancement, ITS/Operational Improvement Highway – Ramp Improvements, Interchange Enhancement, Auxiliary
Lane, Capacity Enhancement, Integrated Corridor, ITS/Operational Improvements
Low Characteristics: Type of project is Transit – Bus Replacement, Transit Maintenance, Transit Operations Arterial – Corridor Improvement, Intersection Improvement, Bridge
and Grade Separation Highway –New Interchange, Rehabilitation
No Positive Impact All other projects
Performance Measure #9: Economic Development Target: Support economic development
Background This performance measure is related to the Connected Corridor Robust Economy Goal and is focused on economic vitality by evaluating the impacts transportation improvements have in the overall economy.

B10
The Economic Development performance measure assesses how corridor projects impact VCTC’s target to improve support economic development in the US 101 corridor.
This performance measure supports existing state, regional, and local transportation policies and goals related to the economy. State policies and goals listed in the CTC 2018 Comprehensive Multimodal Corridor Plan Guidelines that have a nexus with the US 101 Connected Communities Economic Development performance measure include: supporting economic development and the efficient movement of freight, preventing residential and small business displacement, improving jobs‐housing balance. The performance measure also supports the SCAG Connected SoCal RTP (2020) regional goal to “Encourage regional economic prosperity and global competitiveness” and VCTC’s CTP (2013) vision statement to have “[a] connected and integrated transportation system that… meets community member needs, balancing all interests”. The CTP vision is for transportation system to provide businesses with “good access for customers, employees, deliveries, and tourists.”
Evaluation Methodology Projects improve economic development if they are likely to improve residents’ access to jobs, businesses access to employees, and reduce congestion/delay for goods movement and business‐related travel. Expanding economic development, job creation & retention, and economic opportunity performance metrics from the CTC 2018 Comprehensive Multimodal Corridor Plan Guidelines and the SCAG Connected SoCal RTP to incorporate the local CTP vision, this study measures accessibility performance by assessing likely project impacts to improve freight throughput, truck time reliability, access to jobs and education, and new jobs supported by improved economic competiveness.
In this study, project performance for Economic Development is measured by project type characteristics based on the following criteria:
Score Criteria High Characteristics: Type of project is
Arterial – Bridge and Grade Separation, Grade Separation and Crossing Projects
Medium Characteristics: Type of project is Arterial –ITS/Operational Improvement, Corridor Improvement, State
of Good Repair, Access Management Highway – Interchange Enhancement, Targeted Safety Projects
Low Characteristics: Type of project is Active Transportation – 1st/Last Mile, Complete Streets, Bike/ped
Bridges, Bikeshare, Bikeway, New Sidewalk/Trail, Pedestrian Improvements
No Positive Impact All other projects
Performance Measure #10: GHG Target: Reduce greenhouse gas emissions and advance the State’s climate goals
State: SB 375. Help region meet state‐identified greenhouse gas reduction targets, reducing greenhouse gas emission and improving air quality, prioritizing transportation sustainability
Local: VCTC has goal for environmental stewardship

B11
Background This performance measure is related to the Environmental Stewardship Goal and is focused on public health by evaluating the impacts transportation improvements have on climate change. The Greenhouse Gas performance measure assesses how corridor projects impact VCTC’s target to reduce greenhouse gas emissions and advance the State’s air quality goals in the US 101 corridor.
This performance measure supports existing state and regional policies and goals related to air quality. This performance measure directly supports the State’s SB 375 mandate to reduce greenhouse gas emissions. State policies and goals listed in the CTC 2018 Comprehensive Multimodal Corridor Plan Guidelines that have a nexus with the US 101 Connected Communities Greenhouse Gas performance measure include: reducing greenhouse gas emission such as carbon dioxide and methane. The performance measure also supports the SCAG Connected SoCal RTP (2020) regional goal to “Reduce greenhouse gas emissions and improve air quality” and meet state‐identified greenhouse gas reduction targets.
Evaluation Methodology Projects reduce greenhouse gas emissions if they are likely to reduce single‐occupancy vehicle miles traveled and support zero‐emissions travel. This study incorporates metrics outlines in the CTC 2018 Comprehensive Multimodal Corridor Plan Guidelines and the SCAG Connected SoCal RTP to measures greenhouse gas emissions performance by assessing likely project impacts to greenhouse gas emissions, greenhouse gas emissions rate, and single occupancy vehicle mode share.
In this study, project performance for greenhouse gas is rated by project type characteristics based on the following criteria:
Score Criteria High Characteristics: Type of project is
Active Transportation – All projects Transit – New BRT, New Rail, EV Charging, Zero Emission Bus
Replacement Medium Characteristics: Type of project is
Transit – Metrolink Commuter Rail Program Enhancements, New Bus Low Characteristics: Type of project is
Transit – Bus Replacement, Transit Maintenance, Transit Operations, Transit Centers, Park and Ride, Bus Stations, Bus Stops
Highway – Interchange Enhancements, HOV/HOT/Express Lanes, Integrated Corridor, ITS/Operational Improvements
No Positive Impact All other projects
Performance Measure #11: Efficient Land Use Target: Improve transportation in low VMT areas
Background This performance measure is related to the Environment Stewardship Goal and is focused on the relationship between land use and transportation by assessing the likelihood transportation improvements will help reduce future VMT growth by encouraging development in neighborhoods with

B12
lower‐vehicle miles traveled rates. The Efficient Land Use performance measure assesses how corridor projects impact VCTC’s target to improve transportation in low VMT areas in the US 101 corridor.
This performance measure supports existing state, regional, and local policies and goals related to reducing future VMT growth. The performance measure supports the State’s transportation goals outlined in SB 743 to promote the reduction of environmental impacts by supporting projects that will help reduce future VMT growth. State policies and goals listed in the CTC 2018 Comprehensive Multimodal Corridor Plan Guidelines that have a nexus with the US 101 Connected Communities Transit Proximity performance measure include: reducing growth in vehicles miles traveled, prioritizing transportation sustainability, conserving land and natural resources, encouraging sustainable land use patterns. The performance measure also supports the SCAG Connected SoCal RTP (2020) regional goals to “Leverage new transportation technologies and data‐driven solutions that result in more efficient travel” and “Encourage development of diverse housing types in areas well supported by multiple transportation options”.
Evaluation Methodology Projects improve transportation in low VMT areas if they grow the existing transit network in those areas. Low VMT areas are typically neighborhoods where households may live proximate to job centers and/or the transportation network provides good connectivity for short local trips. Expanding efficient land use performance metrics from the CTC 2018 Comprehensive Multimodal Corridor Plan Guidelines and the SCAG Connected SoCal RTP to incorporate the local CTP vision, this study measures location efficiency performance by assessing likely project impacts to mixed‐use and in‐fill development with multimodal choices, interconnected streets and corridor access management policies, and vehicle miles traveled.
In this study, project performance for transit proximity is measured by project location based on the following criteria:
Score Criteria High Location: Project located in a low VMT area. These locations are defined as
having VMT per household 15 percent less than the county average. No Positive Impact All other projects
Geographic MOE Description and Methodologies MOE 1: Transit Proximity Transit Proximity is used to evaluate projects in the context of accessibility to major transit stops or high quality transit corridors. SCCP Guidelines defines Transit Proximity as:
Whether the project is located within a half mile of a major transit stop, or Whether the project is located within a half mile of a high‐quality transit corridor.
Major transit stops are typically defined as having frequency of transit service intervals of 15 minutes or less during the morning and afternoon peak commutes.
There is a nexus between the Transit Proximity MOE and the Multi‐Modal Mobility and Environmental Stewardship goals of the project. The Transit Proximity MOE helps measure how projects contribute to

B13
improving multimodal transportation system. Projects that are proximate to existing transit stops will improve mobility by increasing multimodal system efficiency and encouraging the transit use. By increasing access to transit and improving transit ridership, projects can make the study area more sustainable by reducing emissions and improving air quality.
MOE 2: Low‐VMT Zone Low‐VMT Zone is defined by CTC as an area having per capita household vehicle travel that is 15 percent below regional or city average. A project located on the Low‐VMT Zone MOE area generates relatively low VMT. Households that live in areas with relatively low VMT likely do not have to travel far to complete their daily activities. Housing, jobs, school, and shopping centers are located nearby so there are more opportunities for residents to use alternative modes of transportation.
There is a nexus between the Low‐VMT Zone MOE and the Environmental Stewardship goal of the project. Projects that are in low‐VMT zones have a greater chance of reducing the amount of VMT per household in the study area by encouraging travel in the low‐VMT zone and removing personal vehicles from the road. A decline in VMT and personal vehicle use can reduce emissions and improve air quality.
MOE 3: Crash Zone Crash Zone is a geographic MOE identifies areas with high number of traffic collisions including fatalities and/or serious injuries, transit, bicycle, and pedestrian collisions. There is a nexus between the Crash Zone MOE and the Safety and Health goal for the study area. Crash Zone MOE will help measure how projects contribute to improving transportation in the study area when it comes to safety capacities. New projects can reduce safety collisions and hazards by improving and modernizing transportation facilities in these high crash zones.
MOE 4: Disadvantaged Community Disadvantaged Community is a geographic MOE defined in a combination of economic, health, and environmental burdens. The California Environmental Protection Agency (CalEPA) and the Office of Environmental Health Hazard Assessment (OEHHA) have developed CalEvironScreen to compare the relative pollution burden for communities across the state.
There is a nexus between the Disadvantaged Community MOE and Safety and Health and Social Equity goals for the study area. The Disadvantaged Community MOE will help measure how projects contribute to improving transportation in serving the disadvantaged population. Projects in disadvantaged communities improve accessibility and equity, reducing emissions and improving air quality.

Appendix C
Performance Measure Results
The results for project performance for each scenarios are report for each performance measure below. Performance measures are scored on a scale from 1 to 10 with a score of 1 representing no positive impact, 4 representing low impact, 7 is medium impact, and 10 is high impact.
Performance Measure #1: Safety Target: increase safety for motorized and non‐motorized users
All projects have a positive impact on safety for motorized and non‐motorized users. 38 percent of the projects have a high positive impact on increasing safety for motorized and non‐motorized users. As a package, projects in this study score best on this performance measure. The following figure and table show the performance measure rating for all projects and the average performance measure score.
Scenario (Group of Projects) Average Score Funded 5.9 Unfunded 7.2 Funded + Unfunded 6.5
0%
10%
20%
30%
40%
50%
60%
70%
80%
90%
100%
Funded Unfunded Funded + Unfunded
Performance Measure #1: Safety
No Positive Impact Low Medium High

C2
Performance Measure #2: Health Target: Improve opportunities for healthy lifestyles
Over half of all projects have a positive impact on improving opportunities for healthy lifestyles. 10 percent of all project score high for the Health performance measure. The following figure and table show the performance measure rating for all projects and the average performance measure score.
Scenario (Group of Projects) Average Score Funded 4.3 Unfunded 3.2 Funded + Unfunded 3.9
Performance Measure #3: Air Quality Target: Reduce criteria pollutants and advance the Sate’s air quality goals
Over half of all projects have a positive impact on reducing criteria pollutants and advancing the State’s air quality goals. 30 percent of all project score high for the Air Quality performance measure. The following figure and table show the performance measure rating for all projects and the average performance measure score.
0%
10%
20%
30%
40%
50%
60%
70%
80%
90%
100%
Funded Unfunded Funded + Unfunded
Performance Measure #2: Health
No Positive Impact Low Medium High

C3
Scenario (Group of Projects) Average Score Funded 4.3 Unfunded 3.2 Funded + Unfunded 3.9
Performance Measure #4: Disadvantaged Communities Target: Balance transportation, environment and community
The vast majority of projects in the study are not located in disadvantaged communities and therefore just 10 percent of all project have a positive impact on balancing transportation, environment and community. The following figure and table show the performance measure rating for all projects and the average performance measure score.
0%
10%
20%
30%
40%
50%
60%
70%
80%
90%
100%
Funded Unfunded Funded + Unfunded
Performance Measure #3: Air Quality
No Positive Impact Low Medium High

C4
Scenario (Group of Projects) Average Score Funded 1.6 Unfunded 2.2 Funded + Unfunded 1.8
Performance Measure #5: Congestion/VMT Reduction Target: Minimize VMT
Around 40 percent of all projects have a positive impact on minimizing VMT. However, just 3 percent of all project score high for the Congestion/VMT Reduction performance measure. The following figure and table show the performance measure rating for all projects and the average performance measure score.
0%
10%
20%
30%
40%
50%
60%
70%
80%
90%
100%
Funded Unfunded Funded + Unfunded
Performance Measure #4: Disadvantaged Communities
No Positive Impact Low Medium High

C5
Scenario (Group of Projects) Average Score Funded 2.5 Unfunded 2.1 Funded + Unfunded 2.3
Performance Measure #6: Person Throughput Target: Maximize person throughput in the corridor
More than 4 out of 5 of all projects have a positive impact on maximizing person throughput in the corridor. However, just 3 percent of all projects score high in the Person Throughput performance measure. The following figure and table show the performance measure rating for all projects and the average performance measure score.
0%
10%
20%
30%
40%
50%
60%
70%
80%
90%
100%
Funded Unfunded Funded + Unfunded
Performance Measure #5: Congestion/VMT Reduction
No Positive Impact Low Medium High

C6
Scenario (Group of Projects) Average Score Funded 4.6 Unfunded 5.3 Funded + Unfunded 4.9
Performance Measure #7: Transit Proximity Target: Improve access to transit
Nearly all projects in the study are not within half a mile of transit stations so the vast majority of projects do not have a positive impact on improving access to transit. Seven project, or 5 percent of all projects, are proximate to transit stations and score high on the Transit Proximity performance measure. This is the worst scoring performance measure across all projects. The following figure and table show the performance measure rating for all projects and the average performance measure score.
0%
10%
20%
30%
40%
50%
60%
70%
80%
90%
100%
Funded Unfunded Funded + Unfunded
Performance Measure #6: Person Throughput
No Positive Impact Low Medium High

C7
Scenario (Group of Projects) Average Score Funded 1.3 Unfunded 1.6 Funded + Unfunded 1.4
Performance Measure #8: Accessibility Target: Improves accessibility and connectivity for travelers; close gaps in the network
More than 80 percent all projects have a positive impact on improving accessibility and connectivity for travelers and/or closing gaps in the network. 10 percent of projects score high for the Accessibility performance measure. The following figure and table show the performance measure rating for all projects and the average performance measure score.
0%
10%
20%
30%
40%
50%
60%
70%
80%
90%
100%
Funded Unfunded Funded + Unfunded
Performance Measure #7: Transit Proximity
No Positive Impact Low Medium High

C8
Scenario (Group of Projects) Average Score Funded 5.2 Unfunded 5.6 Funded + Unfunded 5.4
Performance Measure #9: Economic Development Target: Support economic development
Just under 30 percent of all projects have a positive impact on supporting economic development. 8 percent of all projects score high on the Economic Development performance measure. The following figure and table show the performance measure rating for all projects and the average performance measure score.
0%
10%
20%
30%
40%
50%
60%
70%
80%
90%
100%
Funded Unfunded Funded + Unfunded
Performance Measure #8: Health
No Positive Impact Low Medium High
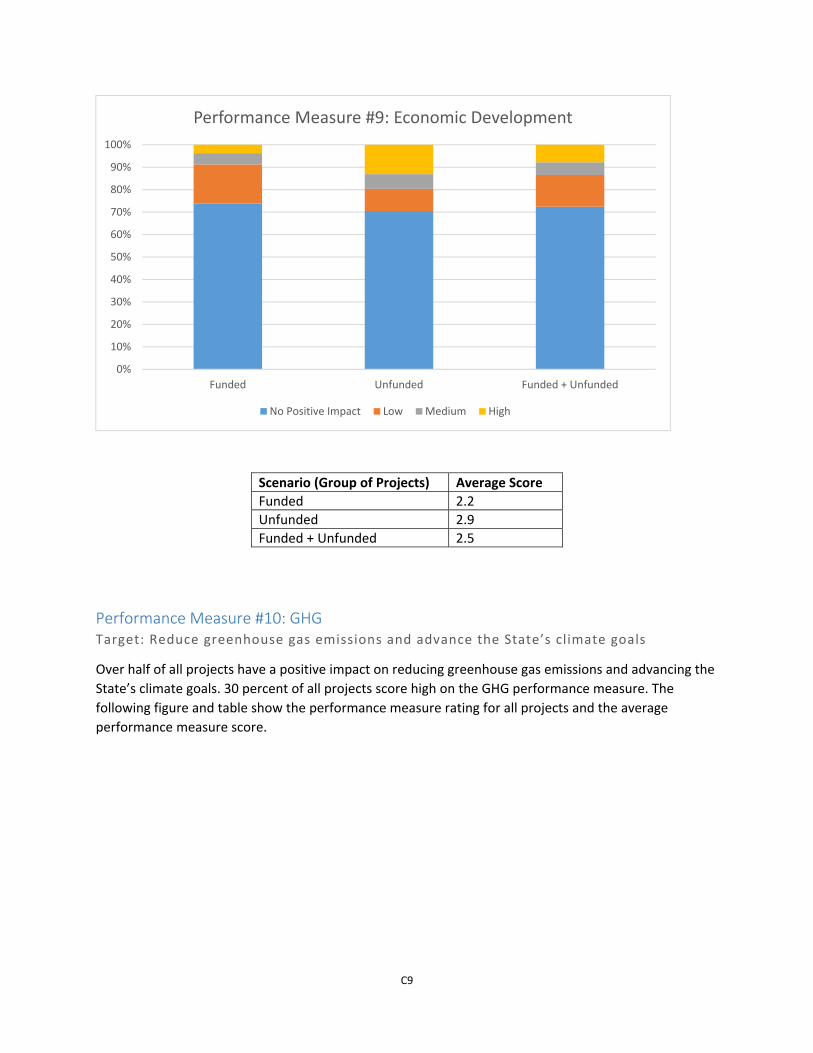
C9
Scenario (Group of Projects) Average Score Funded 2.2 Unfunded 2.9 Funded + Unfunded 2.5
Performance Measure #10: GHG Target: Reduce greenhouse gas emissions and advance the State’s climate goals
Over half of all projects have a positive impact on reducing greenhouse gas emissions and advancing the State’s climate goals. 30 percent of all projects score high on the GHG performance measure. The following figure and table show the performance measure rating for all projects and the average performance measure score.
0%
10%
20%
30%
40%
50%
60%
70%
80%
90%
100%
Funded Unfunded Funded + Unfunded
Performance Measure #9: Economic Development
No Positive Impact Low Medium High

C10
Scenario (Group of Projects) Average Score Funded 5.2 Unfunded 4.8 Funded + Unfunded 5.0
Performance Measure #11: Efficient Land Use Target: Improve transportation in low VMT areas
41 out of 140 projects in the study are located in an area where VMT per household is 15 percent less than the county average. This means 29 percent of all projects have a positive impact and score high on improving transportation in low VMT areas. The following figure and table show the performance measure rating for all projects and the average performance measure score.
0%
10%
20%
30%
40%
50%
60%
70%
80%
90%
100%
Funded Unfunded Funded + Unfunded
Performance Measure #10: GHG
No Positive Impact Low Medium High

C11
Scenario (Group of Projects) Average Score Funded 3.3 Unfunded 4.8 Funded + Unfunded 3.9
0%
10%
20%
30%
40%
50%
60%
70%
80%
90%
100%
Funded Unfunded Funded + Unfunded
Performance Measure #11: Efficient Land Use
No Positive Impact Low Medium High