vawt epsmso5th fullpaper vfinale
TRANSCRIPT

8/14/2019 VAWT Epsmso5th Fullpaper Vfinale
http://slidepdf.com/reader/full/vawt-epsmso5th-fullpaper-vfinale 1/9
Science Arts & Métiers (SAM)is an open access repository that collects the work of Arts et Métiers ParisTech
researchers and makes it freely available over the web where possible.
This is an author-deposited version published in: http://sam.ensam.euHandle ID: .http://hdl.handle.net/10985/7254
To cite this version :
Annie-Claude BAYEUL-LAINE, Sophie SIMONET, Gérard BOIS - VAWT with controlled blades :influence of wake of one turbine on power coefficient on the next turbine - - 2013
Any correspondence concerning this service should be sent to the repository
Administrator : [email protected]
8/14/2019 VAWT Epsmso5th Fullpaper Vfinale
http://slidepdf.com/reader/full/vawt-epsmso5th-fullpaper-vfinale 2/9
5th International Conference on Experiments/Process/System Modeling/Simulation/Optimization
5th IC-EpsMsO
Athens, 3-6 July, 2013
© IC-EpsMsO
VAWT WITH CONTROLLED BLADES: INFLUENCE OF WAKE OF ONE
TURBINE ON POWER COEFFICIENT ON THE NEXT TURBINE
Bayeul-Lainé Annie-Claude1,*
, Simonet Sophie2, *
, Bois Gérard3, *
* Arts et Métiers PARISTECH, LML, UMR CNRS 8107, Bd Paul Langevin, 59655 VILLENEUVE D’ASCQ Keywords: Numerical simulation, unsteady calculations, VAWT, vertical axis, wind turbine, wind turbine arrays
Abstract. Power production from wind turbines is affected by several conditions like wind speed,
turbine speed, turbine design, turbulence, changes of wind direction, wake of previous turbines.
These con ditions ar e not a lways optimal and have negative effects on most turbines. The present
wind turbine is a small one which allows to be used on roofs or in gardens to light small areas like publicity
boards, parkings, roads or for water pumping, heating... This turbine is less affected by these
conditions because the blades combine a rotating movement around each own axis and around
the main turbine’s one. Due to this combination of movements, flow around this turbine is more
optimized than classical Darrieus turbines. It has been shown in previous studies that the best
configuration was obtained with straight blades, a blade stager angle comprised between 0 and
8 d egree s an d a rang e of non- dimen sion al ve locit y f rom 0.4 to 0. 6 fo r a very good power coefficient
of about 0.4 in case of one VAWT. The present study points up the influence of the position of each VAWT in a
group of three turbines and of the distances between turbines. It deals on global and local performances of these
turbines.
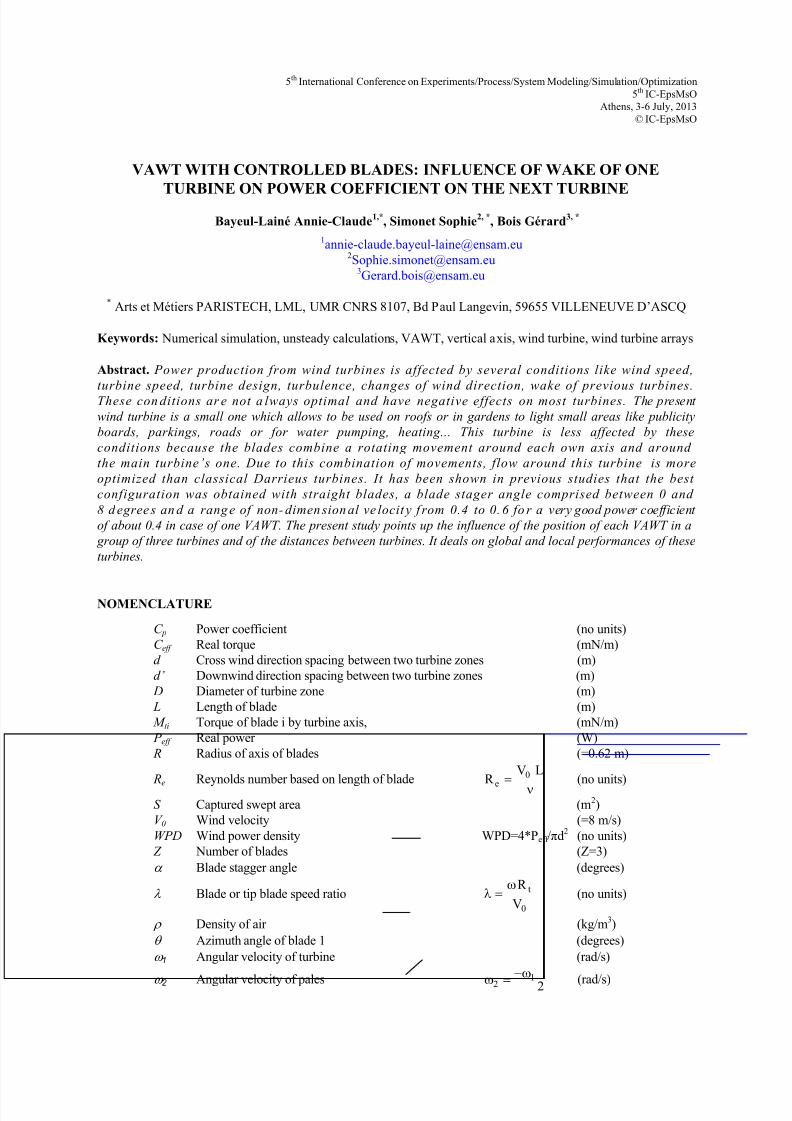
NOMENCLATURE
C p Power coefficient (no units)
C eff Real torque (mN/m)
d Cross wind direction spacing between two turbine zones (m)
d’ Downwind direction spacing between two turbine zones (m)
D Diameter of turbine zone (m)
L Length of blade (m)
M ti Torque of blade i by turbine axis, (mN/m)
P eff Real power (W)
R Radius of axis of blades (=0.62 m)
Re Reynolds number based on length of blade
LVR
0
e
(no units)S Captured swept area (m
2)
V 0 Wind velocity (=8 m/s)
WPD Wind power density WPD=4*Peff /πd2 (no units)
Z Number of blades (Z=3)
Blade stagger angle (degrees)
Blade or tip blade speed ratio0
t
V
R (no units)
Density of air (kg/m3)
Azimuth angle of blade 1 (degrees)
1 Angular velocity of turbine (rad/s)
2 Angular velocity of pales 21
2
(rad/s)
8/14/2019 VAWT Epsmso5th Fullpaper Vfinale
http://slidepdf.com/reader/full/vawt-epsmso5th-fullpaper-vfinale 3/9
Bayeul-Lainé Annie-Claude , Simonet Sophie , Bois Gérard
1 INTRODUCTION
All wind turbines can be classified in two great families (Leconte et al.[9]
Martin[10]
) (i) horizontal-axis
wind turbine (HAWTs) and (ii) vertical-axis wind turbine (VAWTs). VAWTs work at low speed ratios. A lot of
works was published on VAWTs like Savonius or Darrieus rotors[8]
, Pawsey[12]
…) but few works were
published on VAWTs with relative rotating blades (Bayeul-Lainé et al.[2, 3]
, Cooper[4, 5]
, Dieudonné[7]
) Some
inventors discovered this kind of turbine in the same time on different places (Cooper and Dieudonné for
example) and made studies these last fifteen years on this kind of VAWTs.
The present study concerns this kind of VAWT technology in which each blade combines a rotating
movement around its own axis and a rotating movement around turbine’s axis. The blade sketch needs to have
two symmetrical planes because the leading edge becomes the trailing edge when each blade rotates once time
around the turbine’s axis.
In previous studies (Bayeul-Lainé et al.,[2, 3]
) the benefit of rotating elliptic and straight blades was shown: the
performance of this kind of turbine was very good and better than those of classical VAWTs for some specific initial
blade stagger angles between 0 and 15 degrees. It was shown that each blade’s behaviour has less influence on
flow stream around next blade and on power performance.
The low influence of Reynolds number on mean power coefficients was also confirmed for different initial
blade stagger angles for straight blades. It has only been observed a small increase of mean power coefficient
with Reynolds number.
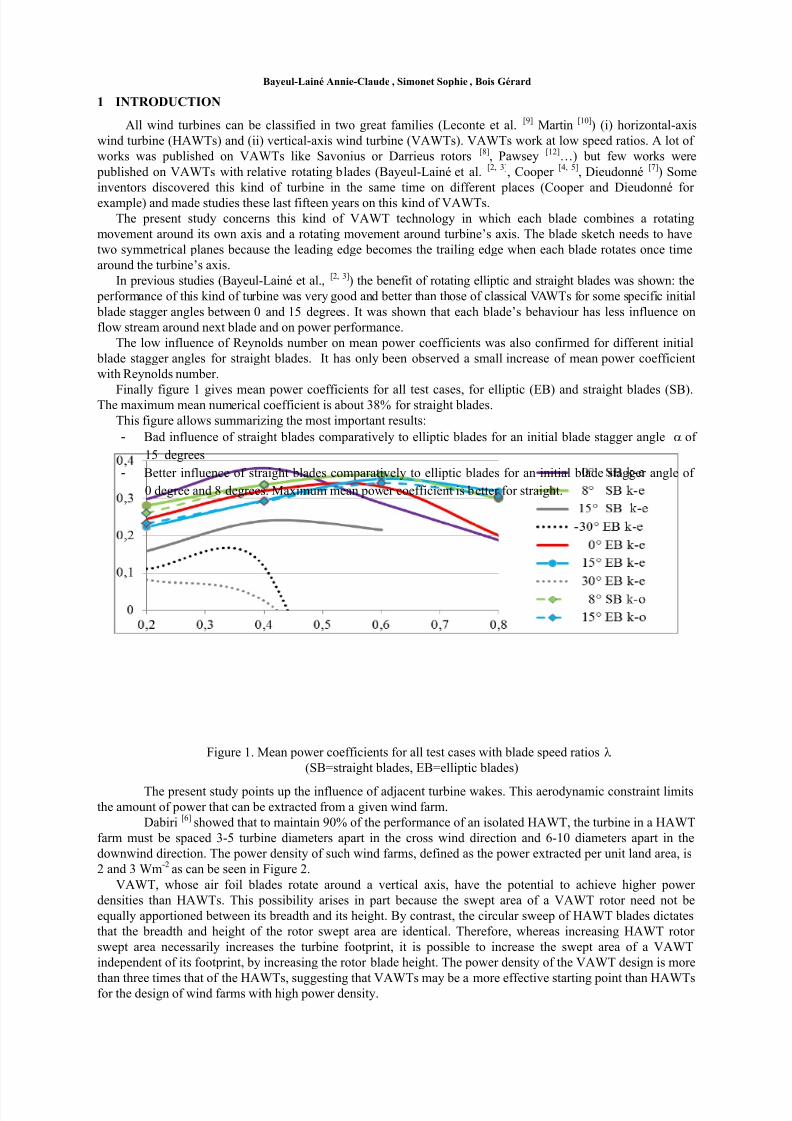
Finally figure 1 gives mean power coefficients for all test cases, for elliptic (EB) and straight blades (SB).The maximum mean numerical coefficient is about 38% for straight blades.
This figure allows summarizing the most important results:
- Bad influence of straight blades comparatively to elliptic blades for an initial blade stagger angle of
15 degrees
- Better influence of straight blades comparatively to elliptic blades for an initial blade stagger angle of
0 degree and 8 degrees. Maximum mean power coefficient is better for straight.
Figure 1. Mean power coefficients for all test cases with blade speed ratios
(SB=straight blades, EB=elliptic blades)
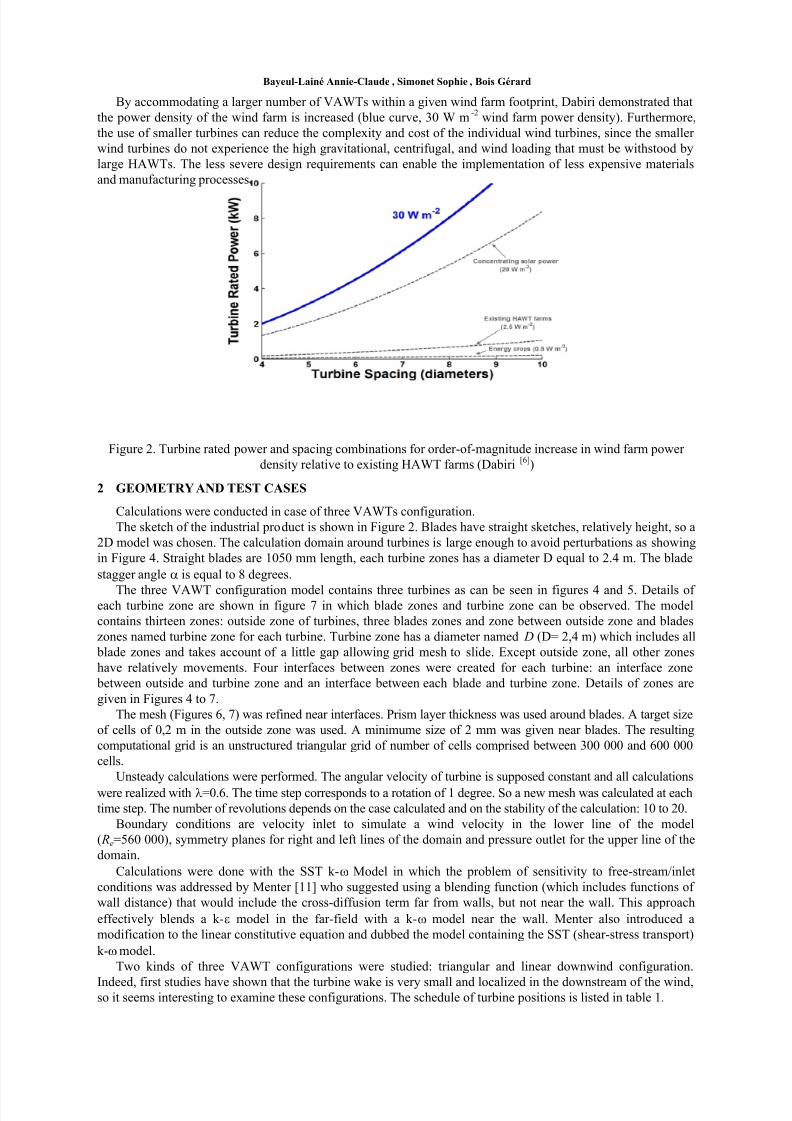
The present study points up the influence of adjacent turbine wakes. This aerodynamic constraint limits
the amount of power that can be extracted from a given wind farm.
Dabiri[6]
showed that to maintain 90% of the performance of an isolated HAWT, the turbine in a HAWT
farm must be spaced 3-5 turbine diameters apart in the cross wind direction and 6-10 diameters apart in the
downwind direction. The power density of such wind farms, defined as the power extracted per unit land area, is
2 and 3 Wm-2
as can be seen in Figure 2.
VAWT, whose air foil blades rotate around a vertical axis, have the potential to achieve higher power
densities than HAWTs. This possibility arises in part because the swept area of a VAWT rotor need not be
equally apportioned between its breadth and its height. By contrast, the circular sweep of HAWT blades dictates
that the breadth and height of the rotor swept area are identical. Therefore, whereas increasing HAWT rotor
swept area necessarily increases the turbine footprint, it is possible to increase the swept area of a VAWT
independent of its footprint, by increasing the rotor blade height. The power density of the VAWT design is more
than three times that of the HAWTs, suggesting that VAWTs may be a more effective starting point than HAWTsfor the design of wind farms with high power density.
8/14/2019 VAWT Epsmso5th Fullpaper Vfinale
http://slidepdf.com/reader/full/vawt-epsmso5th-fullpaper-vfinale 4/9
Bayeul-Lainé Annie-Claude , Simonet Sophie , Bois Gérard
By accommodating a larger number of VAWTs within a given wind farm footprint, Dabiri demonstrated that
the power density of the wind farm is increased (blue curve, 30 W m-2
wind farm power density). Furthermore,
the use of smaller turbines can reduce the complexity and cost of the individual wind turbines, since the smaller
wind turbines do not experience the high gravitational, centrifugal, and wind loading that must be withstood by
large HAWTs. The less severe design requirements can enable the implementation of less expensive materials
and manufacturing processes.
Figure 2. Turbine rated power and spacing combinations for order-of-magnitude increase in wind farm power
density relative to existing HAWT farms (Dabiri[6]
)
2 GEOMETRY AND TEST CASES
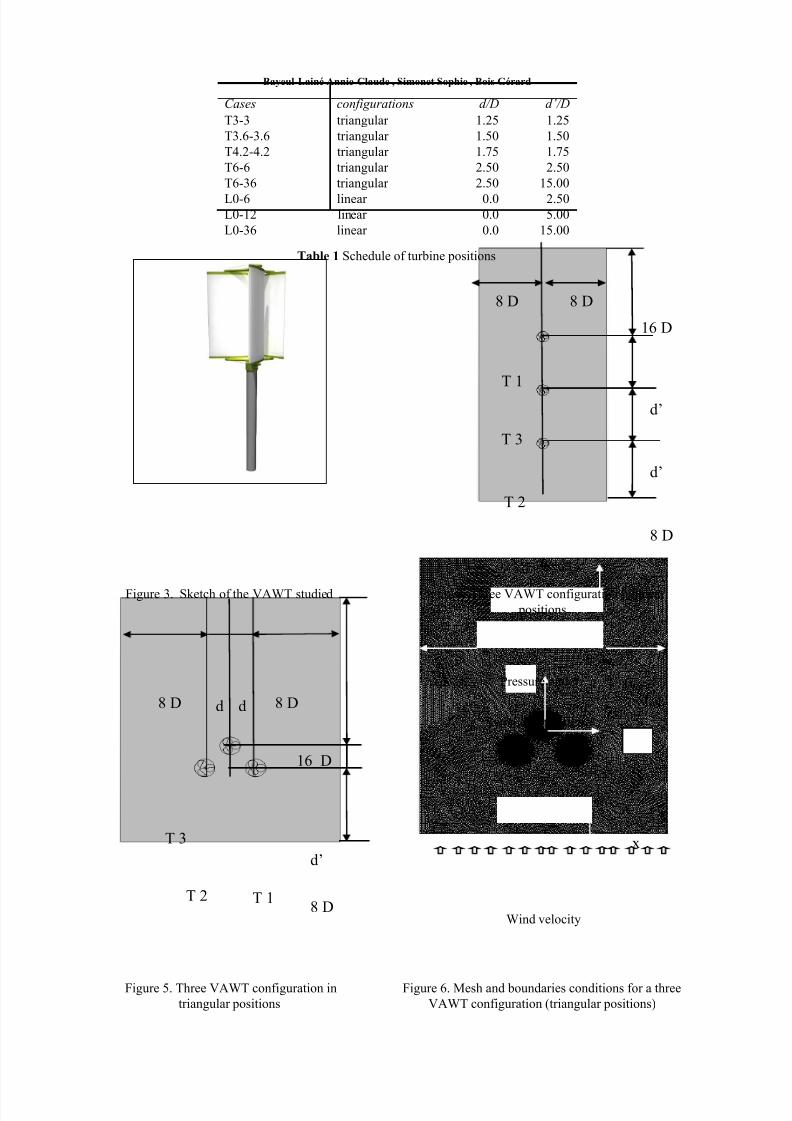
Calculations were conducted in case of three VAWTs configuration.
The sketch of the industrial product is shown in Figure 2. Blades have straight sketches, relatively height, so a
2D model was chosen. The calculation domain around turbines is large enough to avoid perturbations as showing
in Figure 4. Straight blades are 1050 mm length, each turbine zones has a diameter D equal to 2.4 m. The blade
stagger angle is equal to 8 degrees.
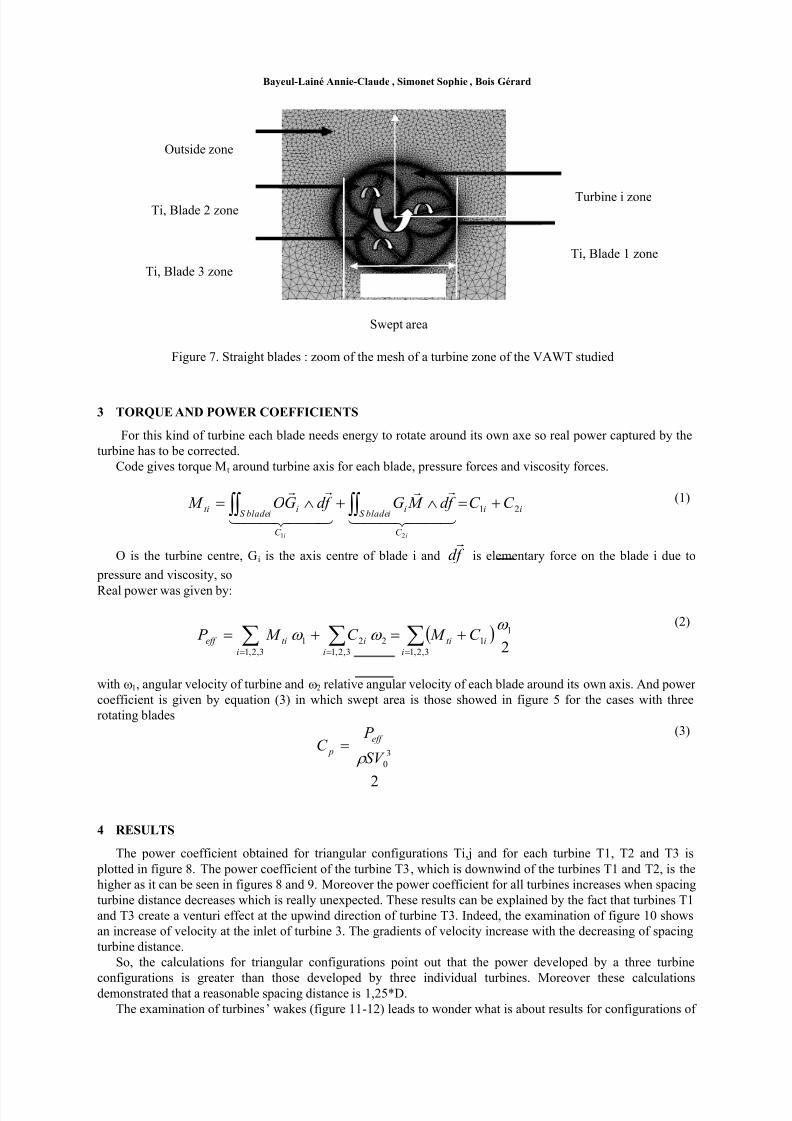
The three VAWT configuration model contains three turbines as can be seen in figures 4 and 5. Details ofeach turbine zone are shown in figure 7 in which blade zones and turbine zone can be observed. The model
contains thirteen zones: outside zone of turbines, three blades zones and zone between outside zone and blades
zones named turbine zone for each turbine. Turbine zone has a diameter named D (D= 2,4 m) which includes all
blade zones and takes account of a little gap allowing grid mesh to slide. Except outside zone, all other zones
have relatively movements. Four interfaces between zones were created for each turbine: an interface zone
between outside and turbine zone and an interface between each blade and turbine zone. Details of zones are
given in Figures 4 to 7.
The mesh (Figures 6, 7) was refined near interfaces. Prism layer thickness was used around blades. A target size
of cells of 0,2 m in the outside zone was used. A minimume size of 2 mm was given near blades. The resulting
computational grid is an unstructured triangular grid of number of cells comprised between 300 000 and 600 000
cells.
Unsteady calculations were performed. The angular velocity of turbine is supposed constant and all calculations
were realized with =0.6. The time step corresponds to a rotation of 1 degree. So a new mesh was calculated at each
time step. The number of revolutions depends on the case calculated and on the stability of the calculation: 10 to 20.
Boundary conditions are velocity inlet to simulate a wind velocity in the lower line of the model
( Re=560 000), symmetry planes for right and left lines of the domain and pressure outlet for the upper line of the
domain.
Calculations were done with the SST k- Model in which the problem of sensitivity to free-stream/inlet
conditions was addressed by Menter [11] who suggested using a blending function (which includes functions of
wall distance) that would include the cross-diffusion term far from walls, but not near the wall. This approach
effectively blends a k- model in the far-field with a k- model near the wall. Menter also introduced a
modification to the linear constitutive equation and dubbed the model containing the SST (shear-stress transport)
k- model.
Two kinds of three VAWT configurations were studied: triangular and linear downwind configuration.
Indeed, first studies have shown that the turbine wake is very small and localized in the downstream of the wind,so it seems interesting to examine these configurations. The schedule of turbine positions is listed in table 1.
8/14/2019 VAWT Epsmso5th Fullpaper Vfinale
http://slidepdf.com/reader/full/vawt-epsmso5th-fullpaper-vfinale 5/9
Bayeul-Lainé Annie-Claude , Simonet Sophie , Bois Gérard
Cases configurations d/D d’ /D
T3-3 triangular 1.25 1.25
T3.6-3.6 triangular 1.50 1.50
T4.2-4.2 triangular 1.75 1.75
T6-6 triangular 2.50 2.50
T6-36 triangular 2.50 15.00
L0-6 linear 0.0 2.50L0-12 linear 0.0 5.00
L0-36 linear 0.0 15.00
Table 1 Schedule of turbine positions
Figure 3. Sketch of the VAWT studied
Figure 4. Three VAWT configuration in linear
positions
Figure 5. Three VAWT configuration in
triangular positions
Figure 6. Mesh and boundaries conditions for a three
VAWT configuration (triangular positions)
8 D 8 D
16 D
8 D
d’
d’
y
Symmetry planes
Wind velocity
Pressure outlet
16 D
8 D
d’
8 D
8 D dd
x
T 1
T 1
T 3
T 2
T 2
T 3
8/14/2019 VAWT Epsmso5th Fullpaper Vfinale
http://slidepdf.com/reader/full/vawt-epsmso5th-fullpaper-vfinale 6/9
Bayeul-Lainé Annie-Claude , Simonet Sophie , Bois Gérard
Figure 7. Straight blades : zoom of the mesh of a turbine zone of the VAWT studied
3 TORQUE AND POWER COEFFICIENTS
For this kind of turbine each blade needs energy to rotate around its own axe so real power captured by the
turbine has to be corrected.
Code gives torque Mt around turbine axis for each blade, pressure forces and viscosity forces.
ii
C
ibladeS i
C
ibladeS iti C C f d M G f d GO M
ii
21
21
(1)
O is the turbine centre, Gi is the axis centre of blade i and f d
is elementary force on the blade i due to
pressure and viscosity, so
Real power was given by:
2
1
3,2,1
1
3,2,1 3,2,1
221
i
iti
i i
itieff C M C M P
(2)
with 1, angular velocity of turbine and 2 relative angular velocity of each blade around its own axis. And power
coefficient is given by equation (3) in which swept area is those showed in figure 5 for the cases with three
rotating blades
2
3
0SV
P C
eff
p
(3)
4 RESULTS
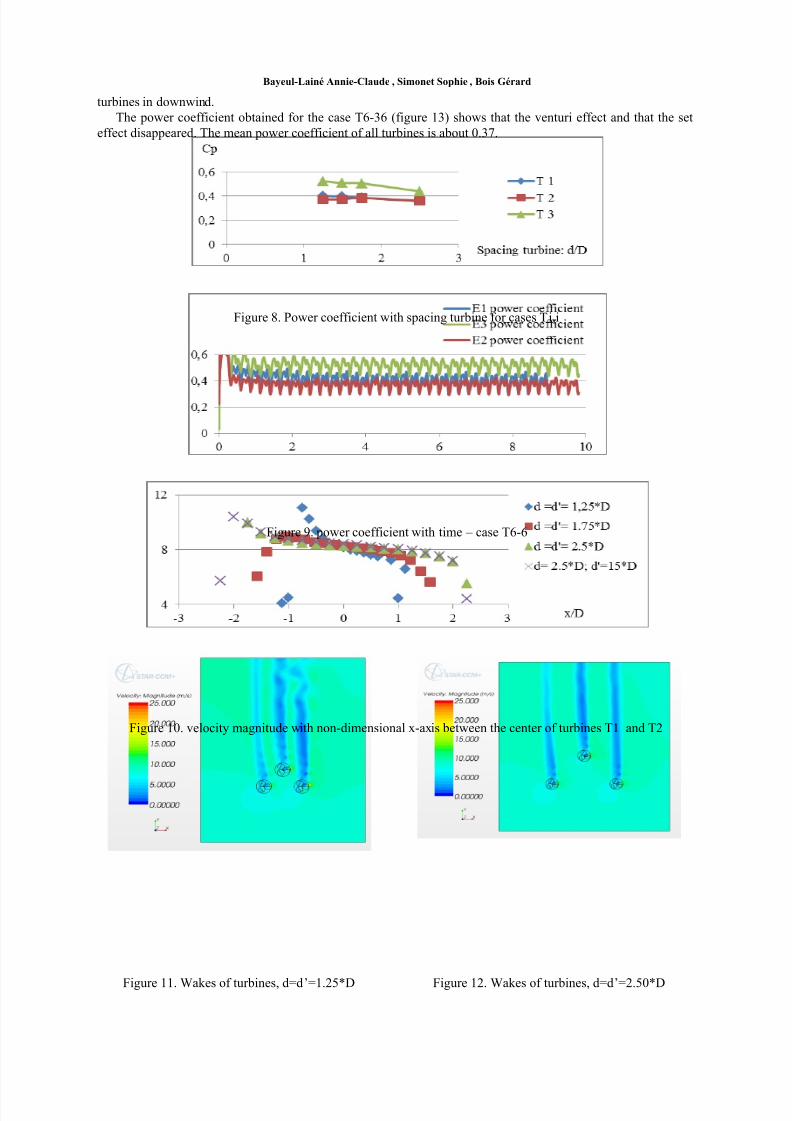
The power coefficient obtained for triangular configurations Ti,j and for each turbine T1, T2 and T3 is
plotted in figure 8. The power coefficient of the turbine T3, which is downwind of the turbines T1 and T2, is the
higher as it can be seen in figures 8 and 9. Moreover the power coefficient for all turbines increases when spacing
turbine distance decreases which is really unexpected. These results can be explained by the fact that turbines T1
and T3 create a venturi effect at the upwind direction of turbine T3. Indeed, the examination of figure 10 shows
an increase of velocity at the inlet of turbine 3. The gradients of velocity increase with the decreasing of spacing
turbine distance.
So, the calculations for triangular configurations point out that the power developed by a three turbine
configurations is greater than those developed by three individual turbines. Moreover these calculationsdemonstrated that a reasonable spacing distance is 1,25*D.
The examination of turbines’ wakes (figure 11-12) leads to wonder what is about results for configurations of
Outside zone
Turbine i zoneTi, Blade 2 zone
Ti, Blade 1 zone
Ti, Blade 3 zone
Swept area
8/14/2019 VAWT Epsmso5th Fullpaper Vfinale
http://slidepdf.com/reader/full/vawt-epsmso5th-fullpaper-vfinale 7/9
Bayeul-Lainé Annie-Claude , Simonet Sophie , Bois Gérard
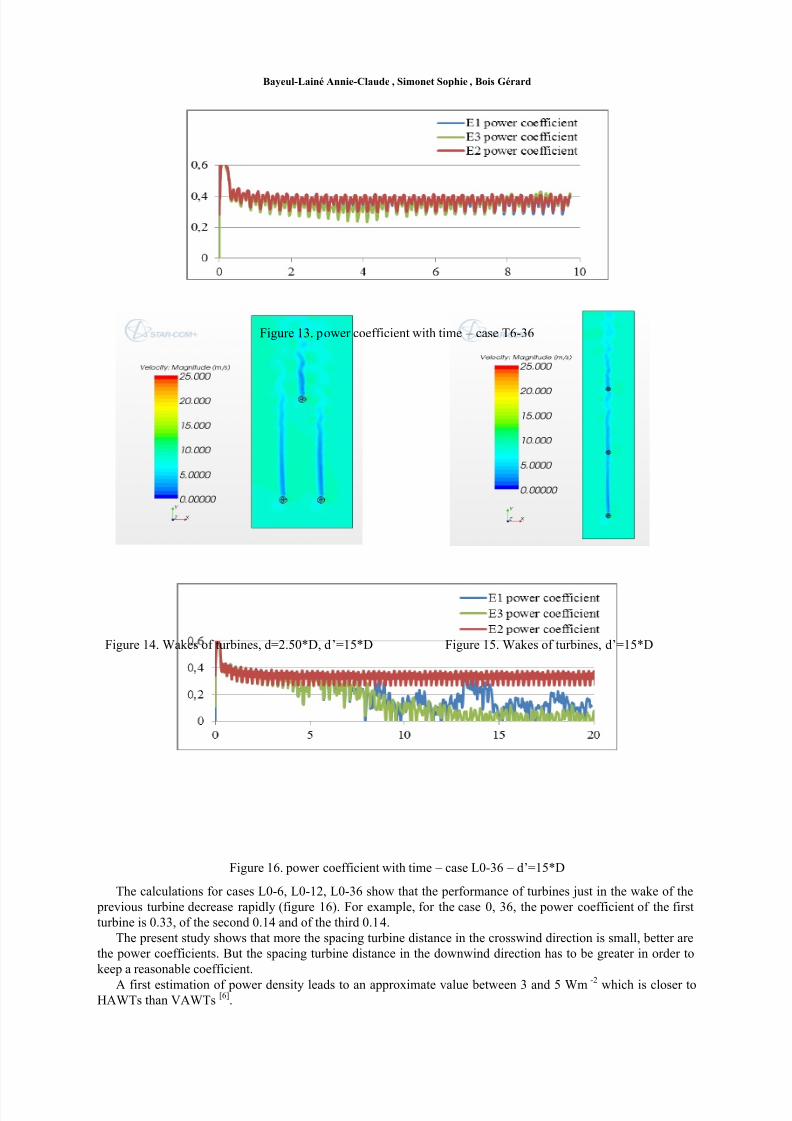
turbines in downwind.
The power coefficient obtained for the case T6-36 (figure 13) shows that the venturi effect and that the set
effect disappeared. The mean power coefficient of all turbines is about 0.37.
Figure 8. Power coefficient with spacing turbine for cases Ti,i
Figure 9. power coefficient with time – case T6-6
Figure 10. velocity magnitude with non-dimensional x-axis between the center of turbines T1 and T2
Figure 11. Wakes of turbines, d=d’=1.25*D Figure 12. Wakes of turbines, d=d’=2.50*D
8/14/2019 VAWT Epsmso5th Fullpaper Vfinale
http://slidepdf.com/reader/full/vawt-epsmso5th-fullpaper-vfinale 8/9
Bayeul-Lainé Annie-Claude , Simonet Sophie , Bois Gérard
Figure 13. power coefficient with time – case T6-36
Figure 14. Wakes of turbines, d=2.50*D, d’=15*D Figure 15. Wakes of turbines, d’=15*D
Figure 16. power coefficient with time – case L0-36 – d’=15*D
The calculations for cases L0-6, L0-12, L0-36 show that the performance of turbines just in the wake of the
previous turbine decrease rapidly (figure 16). For example, for the case 0, 36, the power coefficient of the first
turbine is 0.33, of the second 0.14 and of the third 0.14.
The present study shows that more the spacing turbine distance in the crosswind direction is small, better are
the power coefficients. But the spacing turbine distance in the downwind direction has to be greater in order to
keep a reasonable coefficient.
A first estimation of power density leads to an approximate value between 3 and 5 Wm -2 which is closer toHAWTs than VAWTs
[6].
8/14/2019 VAWT Epsmso5th Fullpaper Vfinale
http://slidepdf.com/reader/full/vawt-epsmso5th-fullpaper-vfinale 9/9
Bayeul-Lainé Annie-Claude , Simonet Sophie , Bois Gérard
5 CONCLUSIONS
Modern wind farms of HAWTs require significant land resources to separate each wind turbine from the
adjacent turbine wakes. This constraint limits the amount of power that can be extracted from a given wind farmfootprint.
The use of a small VAWT with relative rotating blades was investigated in order to achieve medium power
output per unit land area. Whereas modern wind farms consisting of HAWTs produce 2 – 3 W of power per
square meter of land area, these calculations indicate that power densities are an order of magnitude equal or just
greater. The results suggest an alternative approach to wind farming that has the potential to concurrently reduce
the cost, size, and environmental impacts of wind farms. The present turbine will be used in urban configurations.
A short-cut model suitable for the best performance of the overall wind park can be drawn. The turbine grid
can’t be a uniform one. Each individual machine is equally placed between its neighbours in triangular
configurations.
REFERENCES
[1] Abbott, I. H., Von Doenhof, A. E. (1949), Theory of wing sections, Mc Graw Hill Book, ISBN 486-60586-8
[2] Bayeul-Lainé A.C., Bois G. (2010), « Unsteady simulation of flow in micro vertical axis wind turbine »,
Proceedings of 21st International Symposium on Transport Phenomena, Kaohsiung City Taiwan, 02-05
november.
[3] Bayeul-Lainé, A. C., Dockter, A., Bois, G., Simonet, S. (2011) , “Numerical simulation in vertical wind axis
turbine with pitch controlled blades”, IC-EpsMsO, 4th , Athens, Greece, 6-9 July, pp 429-436 , ISBN 978-960-
98941-7-3
[4] Cooper P., Kennedy 0. (2005), “Development and analysis of a novel Vertical Axis Wind
Turbine”,http://www.datataker.com/public_domain/PD71%20Development%20and%20analysis%20of%20a
%20novel%20vertical%20axis%20wind%20turbine.pdf
[5] Cooper P. (2010), Wind Power Generation and wind Turbine Design, WIT Press, chapter 8, ISBN 978-1-
84564-205-1
[6] Dabiri, J. 0. (2011), “Potential order of magnitude enhancement of wind farm power density via counter-rotating vertical-axis wind turbine arrays”, J. renewable Sustainable Energy 3,043104 ,
http://dx.doi.org/10.1063/1.3608170
[7] Dieudonné P.A.M. (2006), « Eolienne à voilure tournante à fort potentiel énergétique », Demande de brevet
d’invention FR 2 899 286 A1, br evet INPI 0602890, 03 avril
[8] Hau, E. (2000), Wind turbines, Springer, Germany
[9] Leconte, P., Rapin, M., Szechenyi, E. (2001), Eoliennes, Techniques de l’ingénieur BM 4 640, pp 1-24
[10] Martin J. (1987), Energies éoliennes, Techniques de l’ingénieur B 8 585, pp 1-21
[11] Menter, F. R. and Kuntz, M. (2002), Adaptation of Eddy Viscosity Turbulence Models to Unsteady
Separated Flows Behind Vehicles, in The Aerodynamics of Heavy Vehicles: Trucks, Buses and Trains,
Springer, Asilomar, CA.
[12] Pawsey, N.C.K., (2002), Development and evaluation of passive variable-pitch vertical axis wind turbines,
PhD Thesis, Univ. New South Wales, Australia