variations in social support and mental health among black
TRANSCRIPT

University of Nebraska - Lincoln University of Nebraska - Lincoln
DigitalCommons@University of Nebraska - Lincoln DigitalCommons@University of Nebraska - Lincoln
Sociology Theses, Dissertations, & Student Research Sociology, Department of
2010
Variations in Social Support and Mental Health Among Black Variations in Social Support and Mental Health Among Black
Women by Socioeconomic Status Women by Socioeconomic Status
Lesa A. Johnson University of Nebraska at Lincoln, [email protected]
Follow this and additional works at: https://digitalcommons.unl.edu/sociologydiss
Part of the Inequality and Stratification Commons, Race and Ethnicity Commons, and the Social
Psychology and Interaction Commons
Johnson, Lesa A., "Variations in Social Support and Mental Health Among Black Women by Socioeconomic Status" (2010). Sociology Theses, Dissertations, & Student Research. 9. https://digitalcommons.unl.edu/sociologydiss/9
This Article is brought to you for free and open access by the Sociology, Department of at DigitalCommons@University of Nebraska - Lincoln. It has been accepted for inclusion in Sociology Theses, Dissertations, & Student Research by an authorized administrator of DigitalCommons@University of Nebraska - Lincoln.

VARIATIONS IN SOCIAL SUPPORT AND MENTAL HEALTH AMONG BLACK
WOMEN BY SOCIOECONOMIC STATUS
by
Lesa A. Johnson
A THESIS
Presented to the Faculty of
The Graduate College at the University of Nebraska
In Partial Fulfillment of Requirements
For the Degree of Master of Arts
Major: Sociology
Under the Supervision of Professor Bridget J. Goosby
Lincoln, Nebraska
November, 2010
VARIATIONS IN SOCIAL SUPPORT AND MENTAL HEALTH AMONG BLACK
WOMEN BY SOCIOECONOMIC STATUS
Lesa A. Johnson, M.A.
University of Nebraska, 2010
Adviser: Bridget J. Goosby
A considerable body of research focuses on the mental health of black women
with low socioeconomic status. Social scientists have noted that women in low
socioeconomic status groups often utilize social networks to provide protection and
survival in dense and depressed communities. Still, some social scientists also suggest
that the bounded solidarity of kinship networks decreases chances for women to pursue
opportunities for economic mobility by creating stressful and time consuming obligations
for reciprocity. Though many qualitative and community quantitative studies have been
conducted regarding social support and survival among low income women, few
quantitative studies have addressed variation in these networks by socioeconomic status
and their association with psychological distress. This research paper seeks to expound
upon the empirical research on social support among black women by focusing on its
relationship to mental health. Using data from the National Survey of American Life
(NSAL), a nationally representative survey designed to contextually explore mental
disorders and psychological distress of African and Caribbean Black Americans, I
investigate the associations between socioeconomic status, various means of social
support, and mental health for African American, Afro-Caribbean, and white women in
the United States.
iii
DEDICATION
This document is presented in memory of my sister, Linda Johnson, and my parents,
Florentene and Alonzia Johnson.
It is also presented in honor of my son, Justin Curtis Johnson, and my brother, Julius
Maurice Johnson.
In good times and bad, family is everything.

1
Much research has been dedicated to the mental health of black women in low
socioeconomic status (SES) groups. Black women in low SES groups experience more
stressful life events, such as unemployment, poor physical health, problems with
romantic relationships (Edin and Kefalas 2005), difficulties securing child care (Press et
al 2006), and difficult parent-child relationships (McLoyd et al 1994) than women in
higher status groups. As a result, these women often utilize networks of family, friends,
and church members to pool material and emotional resources that protect members of
the network (Macinko and Starfield 2001; Dominguez and Watkins 2003). Each member
of such a group is expected to reciprocate for the help she receives by providing services
to another member in the future (Portes 1998; Dominguez and Watkins 2003; Sarkisian
and Gerstel 2004). Social theorists hypothesize that the expectation of reciprocity, as
well as the maintenance of relations between group members, may hinder individual
economic mobility and freedom, thereby further contributing to the psychological distress
of group members (Bourdieu 1986; Portes 1998; Macinko and Starfield 2001).
Researchers find that African American women experience psychological distress
at twice the rate of African American men (Williams et al 2007). However, very few
researchers have investigated distress with regards to the heterogeneity within the black
female population in America. African American women may utilize means of coping
which are different from other groups of black women. For instance, the utilization of
social support may be different among groups when guarding against mental illness that
accompanies the scarcity of economic resources.
This research expounds upon the research on mental health among low income
populations through the examination of race and ethnicity differences in the relationships

2
between socioeconomic status, stressful life events, and social support among women
through the use of nationally representative data. Using data from the National Survey
of American Life (NSAL), I investigate the associations between socioeconomic status,
life stressors, social support, and mental health for Afro-Caribbean and African American
adult females by asking the following questions: 1) Is there a direct association between
socioeconomic status and psychological distress for females? 2) Is this relationship
mediated by stressful life events? 3) Is the association between socioeconomic status and
mental health further mediated by various means of social support, such as support
reciprocity, emotional support or negative interaction? 4) Are these associations further
moderated by race/ethnicity?
Literature Review
Black Females, Socioeconomic Status, and Depressive Symptoms
While whites experience a higher prevalence of Major Depressive Disorder
(MDD) than African Americans (Riolo et al 2005; Williams et al 2007), African
Americans experience a higher prevalence of Dysthymic Disorder (Riolo et al 2005), a
less severe yet more chronic form of depression. African Americans who do experience
MDD experience it more severely (Lewis et al 2006; Williams et al 2007). George and
Lynch (2003) also found that stress exposure increased steadily with age among blacks,
thereby increasing depressive symptoms, while stress and depressive symptoms waned
during middle ages and increased again for whites. Williams et al (2007) also found
significant diversity within the black population regarding gender and depression.

3
African American women experience a lifetime prevalence of MDD at twice the
rate of African American men. However, no significant difference was found between
MDD prevalence among Afro-Caribbean men and women. Black and Hispanic women
were also found to have a higher prevalence of depressive symptoms than white or Asian
women in America, again, mainly due to socioeconomic factors (Bromberger et al 2004).
Among the major factors associated with depressive symptoms and disorders,
poverty and low socioeconomic status are most prominent (Gibbs and Fuery 1994; Link
and Phelan 1995; Nolen-Hoeksema et al 1999; Muntaner et al 2007). Women in general
experience lower socioeconomic status than men, as well as more psychological distress
associated with such low status (Nolen-Hoeksema 1999). In addition, research provides a
growing body of evidence that continued racial gaps in SES (education, income,
occupational prestige, and wealth) provide a large contribution to the reason for health
disparities in the United States. For instance, as Black women achieve less education and
experience more unemployment, more single parenthood and more neighborhood crime
than white women (Wilson 1987; Belle 1990; Gibbs and Fuery 1994), black women are
subsequently at greater risk for prolonged or re-occurring incidences of mental distress
associated with these experiences.
Still, the heterogeneity of the black population with regards to socioeconomic
status and its association with mental health has been neglected until recently. Current
research reveals that more black immigrants reside in the United States than American
Indians, Cuban Americans, Chinese, or Japanese. In addition, Afro-Caribbeans are the
largest subgroup of black immigrants in the U.S. (Williams et al 2007). Few researchers

4
have closely examined the differences between immigrant and native black American
females with regards to socioeconomic status and mental health.
Because of immigration regulations, black immigrants to the United States
generally have more education and higher incomes than native African Americans, as
well as lower rates of mental illness (Williams et al 2007). Caribbean American black
women report lower rates of MDD than native black women (Miranda et al 2005).
Though these findings offer some explanation for different mental health statuses among
black ethnicities, very little is known about how different ethnicities respond to stressors
specifically associated with their economic status. Researchers have instead concentrated
on the socioeconomic status and stressors of black women without specifying ethnic
variations.
Socioeconomic Status and Stressors in the Black Community
As more black women gained middle class and higher status in the last forty
years, their mental health adapted to their newfound socioeconomic status. For some, the
stress of living in neighborhoods with fewer services and high crime (Williams 2001)
was replaced with or added to the stress of higher workplace and/or residential
discrimination as access to higher status became available. In addition, as black women
gained more education and status than black men (Day and Bauman 2000), the number of
single mothers remained high in the black community (Staples 1985; Higginbotham and
Weber 1992; Edin and Kefalas 2005). Though many black females believe in traditional
standards of a stable relationship and family, they find a lack of available mates of quality
(Staples 1985). For these women, the first quality in a potential mate would be gainful

5
and steady employment. However, the vestiges of systematic structural discrimination
leave many black men without such employment, and certainly without income that is
necessary for supporting a family (Staples 1985; Wilson 1987). Even without the pre-
requisite of employment, the lack of marriageable black men remains due to high
incarceration and homicide rates (Wilson 1987).
In 2008, the U.S. Census Bureau reports, black males over the age of 18 who
were never married, widowed, or divorced totaled 6.6 million. The number of black
women in the same categories totaled 9.2 million (U.S. Census Bureau 2010). This
leaves close to 3.3 million black women without potential black mates – that is, if all
things were equal and each of the available men was actually desirable as a potential
mate. Consequently, black women are much less likely to be encouraged to pursue
marriage as their primary life goal than white women (Edin and Kefalas 2005). Middle-
class black women are expected to be self-sufficient and successful (Higginbotham and
Weber 1992). As such, a major factor of depression for black women is the presence of
life stressors, such as discrimination, difficult or lack of romantic relationships, and role
strain, as mediators in the relationship between socioeconomic status and mental health.
Psychological Resources: Mastery and Self Esteem
In the midst of difficult circumstances, some people may be able to utilize coping
resources which help to alleviate depressive symptoms. Self esteem and mastery are
coping mechanisms that help individuals to guard against depression during challenging
times by maintaining a positive self perception. Mastery is defined as a sense of control
over immediate environmental factors, or over circumstances which affect one‟s life

6
(Pearlin et al 1981). Self esteem is the perception of self worth (Pearlin et al 1981).
These self perceptions serve as psychological resources that can protect persons from
depressive symptoms during periods of distress.
Both self esteem and mastery have been found to increase when social support is
provided for an individual (Lincoln et al 2005). Social network members, such as family,
friends and community members, can provide social support in the form of positive
interaction and appraisal that guard against a negative self image and feelings of
worthlessness. Social support from others can also help individuals to redirect the
negative impact from stressors by helping to evaluate the situation as one that is not
beyond the individual‟s control and help provide positive solutions to the problem. This
process further increases the individual‟s estimation of herself, thereby increasing her
mastery and self esteem.
Acute and Chronic Life Stressors
A stressor is defined as any environmental, social or otherwise internal factor
which affects an individual‟s mood to the extent that requires some change in behavioral
patterns (Thoits 1995). Researchers who have investigated the interplay of race/ethnicity
and gender in psychological distress have found significant associations between both
acute and chronic stressors and the mental health of black women. Stressful life events
have been found to disrupt an individual‟s sense of self, thereby negatively influencing
mental health outcomes (Lincoln et al 2005). The presence of acute stressors - such as
rape or assault, family death, or other short-term stressors – may have greater depressive
influence among those who have not previously encountered similar stressors (Turner

7
and Noh 1988, Avison and Turner 1988). However, chronic stressors, such as prolonged
unemployment or financial worries, are noted as most potent in relation to psychological
distress (Aneshensel 1992; Turner et al 1995). The difference in the two types of
stressors lies in the duration of exposure.
African American and other minority women are more prone to distress
associated with economic hardship than white women (Eckenrode 1984; Aneshensel
1992). Such stressors associated with economic hardship include neighborhood violence
in economically deprived neighborhoods (Wight et al 2009), problems with children
associated with single-motherhood, and difficulty with personal relationships (Avison
and Turner 1988; Edin and Kefalas 2005). Persistent poverty poses a distinctive threat to
the emotional well-being of African American women, as black women are ten times
more likely to experience poverty than white women (Belle 1990). However, research
also shows evidence of a higher prevalence of discrimination as education levels increase
(Kessler 1999). This finding may indicate an additional level of distress which increases
with economic mobility, even while stressors brought on by poverty decrease. In any
case, many black women find they need the support of family and friends to increase
their chances for financial independence.
As black families support these women on their journeys to financial
independence, black women are expected to stay away from men who do not present
themselves as financial equals, so that the relationship does not result in further detriment
to the entire family. In light of the fact that black women achieve economic and
educational success at higher rates than black men (Day and Bauman 2000), this may
result in percentages of unmarried black middle class women that rival those of poor
8
black women. As a result, upward mobility for these women comes with bouts of
isolation at work and loneliness at home (Benjamin 1982), which can increase the
prevalence of depressive symptoms among black middle class women. Researchers have
not yet found whether this is also true for black Caribbean women. To help alleviate
these symptoms, many women turn to networks of friends, family and church members
for emotional support.
Black Women’s Social Support Networks
Four types of social support are generally utilized by those women seeking
protection from stressors that accompany poverty among black Americans. These are
instrumental, or material support; emotional support, informational support and appraisal
(Berkman and Glass 2000; Gorman and Sivaganesan 2007). Instrumental support
involves the exchange of material goods and services that help women care for their
families, such as child care, transportation, small loans, or housing in times of relocation
or eviction (Stack 1974; Domingues and Watkins 2003; Sarkisian and Gerstel 2004).
Emotional support involves talking with others about problems or spending time with
family and friends as a way to temporarily remove oneself from the stressful situation.
However, research reveals that this type of support does not reduce stress (Wethering and
Kessler 1986; Gary et al 1992; Lincoln et al 2003) and may actually increase depressive
symptoms (Mirowsky and Ross 1989).
Informational support usually occurs in the form of conversations and contacts
which help in the acquisition of employment or promotions at work. In close-knit,
poverty-stricken support groups, the information conveyed through dense networks
9
becomes redundant, severely limiting the effectiveness of informational support for
employment assistance (Macinko and Starfield 2001; Smith 2005). However, if lower
SES members have family or network members with higher socioeconomic status, those
higher status members may be held responsible for making sure family members have
information which leads to gainful employment, as well as material support in the form
of money (Higginbotham and Weber 1992; Heflin and Patillo 2002; Sarkisian and Gerstel
2004). This responsibility of providing such support is seen as reciprocation for the
support received as network members supported the higher status individual to achieve
her goals.
Appraisal is another form of vital support that is not discussed much in the
research. As network members seek economic and social mobility, they may find the
need for approval by family and friends to help with self esteem and a sense of control.
In addition to family and friends, church participation, in some instances, may provide
appraisal and support for attempting to conquer life‟s challenges against the odds of less
education or social and cultural capital which accompany lower socioeconomic status.
However, the negative interaction, or disapproval of network members may ensure the
opposite effect (Ellison et al 2009), especially if network or family members do not agree
with the person‟s means of achievement (Higginbotham and Weber 1992) or of her
consideration of other network members along the way.
The possible hindrance of support reciprocation on well-being has been
mentioned in several studies on survival among lower income families (Stack 1974;
Uehara 1990; Domingues and Watkins 2003). The reciprocation of support takes
considerable time away from the individual‟s efforts to improve her socioeconomic status

10
by thwarting her own efforts, for instance, to form relationships with those in higher
status groups or attend to and concentrate on educational mobility (Granovetter 1973,
1983; Macinko and Starfield 2001; Domingues and Watkins 2003). Perceptions of an
imbalance in support reciprocation may further exacerbate psychological distress
(Vaananen et al 2008), through the presence of in-group control mechanisms, such as the
relinquishment of further support, which may be more evident in low SES or minority
kinship groups (Macinko and Starfield 2001; Gray and Keith 2003).
The expectation of support reciprocity is maintained through bounded solidarity, a
control mechanism found in kinship and other community groups (Portes 1998). Bounded
solidarity is an informal or covert way of controlling members of a group “binding”
members to agreements of reciprocity. Membership in such a group is dependent upon
each member sharing any and all resources at her disposal, whenever any other member
is in need. Bounded solidarity is a means of ensuring that all members of the group are
taken care of and have adequate protection (Dominguez and Watkins 2003). However,
family, friends‟, and church members‟ requests for help with transportation, loans, child
care, or a listening ear tend to multiply and in some instances, may remain unanswered as
material resources of the group decrease (Nelson 2000).
Each member in kinship network is responsible for making any sacrifice
necessary to make sure that available resources are distributed throughout the group as
needed. In return for such support, members who receive support are expected to
reciprocate in some manner at a later date. This act is termed balanced reciprocity
(Sarkisian and Gerstel 2004). The main goal is assurance that each member has an equal
amount of resources and protection that are available. The expectation or perception of
11
available support is paramount for participation in such a group. Therefore, difficulties in
maintaining the system arise when members receive insufficient support or no support at
all when needed (Meadows 2009). The maintenance of bounded solidarity assures that
no member gets further ahead than any other member. Thus, all advance at the same
pace, or none advance at all.
Very little research has focused on support reciprocation and its positive or
negative effects on black women‟s depressive symptomatology. In addition, though the
body of literature on socioeconomic status, social and material support, and kinship has
continued to grow, much of the literature is based on community, patient, or non-US
samples. There is a dire lack of nationally representative studies that relate these
variables to the mental health of African American and black Caribbean-American
women.
Theoretical Frameworks
The Mediator Effect Model of Social Interaction
The mediator effect model of social interaction posits that “the impact of a
stressor is mediated by social interactions with others; these positive and negative social
interactions, in turn, either increase or decrease one‟s vulnerability to psychological
distress” (Lincoln et al 2003: 392). Social support matters for mental health. Human
beings are a very social species, and as such, our social interactions play a large role in
our general well-being (Portes 1998). The idea that one can share ideas, hopes and
dreams with similar others, or with those who would serve as mentors, is pivotal in the
attainment of mastery or a sense of control over one‟s own environment. Similarly, when

12
material resources are scarce, the provision of shared resources from others who
understand can ease the tensions that accompany economic hardship. But if the material
help is accompanied by harsh criticism or a condescending, blame-ridden attitude, the
receiver of such help is more likely to perceive the material help received as a judgment
against her own weakness or inability to take care of her own responsibilities, rather than
as a true “helping hand” (Lincoln et al 2003). By proposing the mediator effect model of
social interaction, I hypothesize that emotional support and negative interaction by
family, friends and church will mediate the effects of lower socioeconomic status,
chronic stressors, economic hardship and internal psychological resources on depressive
symptomatology. These relationships will also be dependent upon the expectation of
reciprocity in social interactions. These expectations can be further explained through
the theory on Failed Reciprocity in Social Exchange.
Failed Reciprocity in Social Exchange
Theorists have hypothesized that the bounded solidarity within social networks,
namely kinship networks, may hinder individual freedom and economic mobility
(Bourdieu 1986; Portes 1998) through expectations of material support reciprocity. In
situations of economic hardship, families, neighbors and community members may find
relief by consolidating resources for the benefit of the entire group. Networks are formed
which can organize material resources such as child care, transportation and food
supplies, as well as emotional support for parenting and interpersonal relationships. Such
emotional support includes advice and consolation during times of extreme stress and
hardship like bereavement or legal troubles (Domingues and Watkins 2003; Sarkisian and
Gerstel 2004). Since providing such support can be difficult and costly, such provision

13
is predicated with an expectation of reciprocity, which, when followed, ensures that
everyone in the network is taken care of in times of need. When reciprocity is not evident
among members, a sense of instability permeates the relationship and weakens the
individual‟s confidence in herself and in the group (Weiner 1992; Siegrist 2009).
The effort-reward imbalance model (Siegrist 2009) represents the principal of
social reciprocity that is left unfulfilled when one person in the relationship or network
fails to equally provide some measure of support that has been previously provided to
her. This models suggests that failed reciprocity is strongly associated with feeling
cheated or poorly regarded (Siegrist 2009:312; Väänänen et al 2008). In other words, one
who receives more than she gives may often feel guilt, shame or low self esteem
associated with the perception that she cannot control her own circumstances or take care
of her own family. By contrast, giving more than one receives may reliance on family
support more stressful. Both situations would indicate a decrease in positive self
evaluation and an increase in hopelessness or resentment, which increases depressive
symptoms (Väänänen et al 2008).
Based on the existing literature and theory, I proposed the following hypotheses:
H1. African American, Afro-Caribbean and Caucasian women who
experience lower socioeconomic status will report more symptoms of
depression than women from higher socioeconomic statuses.
H2. Psychological resources of self esteem and mastery will serve as
protective mechanisms that will offset or mediate the effects of socioeconomic
status on depressive symptoms.

14
H3. Acute stressors and economic hardship will further exacerbate depressive
symptoms, even after taking into account self esteem and mastery.
H4. Those who perceive an unequal exchange, or lack of reciprocity in
material support between themselves and family, friends, or church, as well as
those who perceive more negative interaction from family and church, will
report more symptoms of depression.
H5. The relationships between social support, stressors, psychological
resources, and depressive symptoms will be significantly different for African
American, Afro-Caribbean, and white women.
These relationships are shown in Figure 1. As modeled, I expect to find a direct
association between socioeconomic status and depressive symptoms for women. I also
expect that psychological resources, stressors, and social support will each serve as
successive mediators this relationship between SES and CES-D depressive symptoms.
Finally, I expect that race/ethnicity will moderate all of these associations.
Data
The National Survey of American Life: Coping with Stress in the 21st Century
(NSAL) is a nationally representative survey conducted by researchers in the Program for
Research on Black Americans at the University of Michigan‟s Institute for Social
Research, between February 2001 and March 2003. The study was designed to be a
contextual exploration of mental disorders and psychological distress of Americans of
African and Caribbean descent, through manifestations of various “stressors, risk and
resilient factors, and coping resources, among national adult and adolescent samples”

15
(Jackson et al 2004). Face-to-face interviews were given to 6,199 adults ages 18 and
older, based on a multi-state probability design. The sample included 3,570 Black
Americans, 1,623 black respondents of immediate Caribbean descent, and 1006 non-
Hispanic whites. In addition, a national sample was obtained of adolescents, aged 13-17,
who were attached to households of the previously interviewed adults in the survey. The
adolescent sample is not used in this study. The NSAL sample was designed to draw
considerably large numbers of black respondents so that within-group variation could be
considered. It is also the first study to include a nationally representative sample of Afro-
Caribbeans. The sample was designed to have at least twice as many African Americans
and Afro-Caribbeans as whites, so that within-race variation could be maximized and still
retain an adequate reference group. Examinations of the data have found no loss of
power in comparisons (Jackson et al 2004).
Since the NSAL involves a multi-staged, complex survey design, analyses of the
data for this study were conducted using United States population weights based on the
March 2002 demographic supplement of the Current Population Survey (Alegria et al
2008). Sampling of respondents involved nationally representative samples of
households, along with additional sampling in core census areas where there was a high
density of the populations of interest, namely African Americans and Afro-Caribbeans
(Heeringa et al 2004). Therefore, analysis using clustered, stratified population weights
allowed for probability sampling inference to the general population in the United States.
All analyses were conducted using linear regression in the Stata software package,
version 11.1 (Statacorp LP, College Station, TX). Weights were applied using the “svy”
command for analysis of complex sample survey data, as follows:

16
. svyset SECLUST [pweight=NSALWTPN], strata(SESTRAT)
(Heeringa et al 2007).
Measures
Dependent Variable
Depressive symptoms were assessed using nine items from the Center for
Epidemiological Studies Depression Scale (CES-D). Respondents were given nine
statements to rate themselves on in the past week, such as “I felt depressed,” “I felt that I
just couldn‟t get going” or “I felt that I was just as good as others” (see Appendix A).
Responses were provided based on a five-point Likert scale, where 0 = rarely or never, 1
= some of the time, 2 = occasionally, and 3 = most or all of the time. Responses were
coded so that higher values represented negative affect (depressed, sad, people dislike
me) and low values represented positive affect (happy, hopeful about the future). All
item scores were combined to form a scale of depressive symptoms (α = .73).
Respondents who failed to respond to more than 2 items on the scale were dropped from
the sample.
Independent Variables
Socioeconomic Status. Poverty Index is a scaled item devised in the
Collaborative Psychiatric Epidemiology Surveys (CPES), 2001-2003, based on the U.S.
Census Bureau‟s indications of poverty thresholds in the United States, used to calculate
the number of people in poverty in the nation (U.S. Census Bureau 2010). The calculated
measure includes a Census 2001 income-to-needs ratio, which includes household

17
income and compares these to the national poverty threshold for the same year
(household income/poverty threshold) (Alegria et al 2008). The poverty threshold
includes family size and ages of family members (U.S. Census Bureau 2010). Scores
range from 0 – 17, with higher scores indicating higher household incomes to
accommodate needs according to family size. Education is an 11-item scale indicating
the last completed year of education for the respondent. Items range from 4 to 17 or
more and indicated the respondent‟s report of completed years of education.
Employment is measured by creating binary measures of a single response item, in which
the respondent was to indicate his or her work status. The binary measures created were
Employed, Unemployed and Not in the Labor Force, where “1” equaled the title indicator
and “0” equaled other responses. The variable showing those currently employed was
used as the reference variable.
Race/Ethnicity is composed of three dichotomous variables in which the
respondent indicated whether they were African American, Afro-Caribbean, or non-
Hispanic white. Responses were “1” for yes and “0” for no. Respondents who indicated
a race other than these three were dropped from the sample.
Psychological Resources. Self Esteem was measured using the ten-item
Rosenberg scale (Rosenberg 1965), which asks the respondent to indicate her agreement
with items that measure her value of and regard for herself, such as “I am a person of
worth,” “I have a number of good qualities,” or “I am a failure” (see Appendix B). Item
responses were presented on a Likert scale form where 1 = strongly agree, 2 = somewhat
agree, 3 = somewhat disagree, and 4 = strongly disagree. Negative statements were
reverse coded so that higher numbered responses indicated higher self esteem. All items

18
were combined to form a scale where summary scores ranged from 12-40. The scale
showed acceptable internal reliability (α =.77)
Mastery was measured in the model as a scale of seven items (Pearlin and
Schooler 1978) indicating the respondent‟s sense of control of his environment, such as
“I feel pushed around,” “There is no way to solve my problems,” “I feel helpless” (see
Appendix C). Responses were arranged on a Likert scale where 1 = strongly agree, 2 =
somewhat agree, 3 = somewhat disagree, and 4 = strongly disagree. Negative statements
were reverse coded so that higher numerical values on the Likert scale represented higher
mastery scores. All items were combined to form a scale where scores ranged from 7-28
and the scale showed acceptable internal reliability (α = .73).
Stressors. Acute Stressors is a summary scale variable devised of responses to
nine items that asked whether or not respondents had experienced various stressors
during the past month, such as race problems, police harassment, victim of a crime,
problems with children, relationship problems, etc. Responses were 1=yes or 0=no. The
scale represents the total number of acute stressors to which the respondent has been
exposed (α = .54). Chronic Economic Hardship is a scaled variable developed from three
items asking the respondent about her worry in the past year over survival issues, such as
whether there was enough to eat in her household, whether there was enough income to
pay bills (α = .67).
Social Support Measures. Material Support Reciprocity is indicated by nine
binary variables devised to represent respondents‟ perceptions of support from family,
friends and church. Three variables were devised to discern perceptions of whether

19
respondents thought they 1) Gave More to Family than they Received, 2) Family
Reciprocal Relationship, or 3) Received More from Family than they Gave. Another
three variables showed perceptions of whether respondents 1) Gave More to Friends than
Received, 2) Friend Reciprocal Relationship, or 3) Received More from Friends than
Gave. The last three variables showed perceptions of whether respondents 1) Gave More
to Church than Received, 2) Church Reciprocal Relationship, or 3) Received More from
Church than Gave.
The group of variables regarding family was created using items which asked two
questions: “How often does your family help you out? Would you say very often (coded
as 1), fairly often (2), not too often (coded as 3), never (coded as 4), or that you never
needed help (coded as 5). Respondents were also asked “How often do you help your
family out?” Responses were coded the same as above. Responses were re-coded to
reflect higher numbers as more help received or given.
A separate scale was created for each group wherein the responses for receiving
help were subtracted from the responses for giving help. The scale reflected item scores
from -5 to 5, where negative scores reflected perceptions of giving more help than
received, and positive scores reflect perceptions of receiving more help than given.
Scores of zero (0) reflected perceptions of a reciprocal relationship. A binary variable
was then created, where all negative scores were collapsed to “1”, and zero or positive
scores were collapsed to “0” to reflect “Given more to Family than Received.” Another
binary variable was created, where zero scores reflected “1” for “Family Reciprocal
Relationship” and negative or positive scores were collapsed to “0.” A third binary
variable was created, where all positive scores were collapsed to 1 and zero or negative

20
scores collapsed to 0 to reflect “Received more from Family than Received.” This
procedure was repeated for relationships with friends and church. For analysis, the
variables reflecting the Reciprocal Relationships were used as the reference variables.
Emotional Support is indicated by four categorical measures indicating whether
the respondents receive positive or negative support from family and church members.
Family Emotional Support and Church Emotional Support were measured using two
mean-scaled variables that indicated the amount of emotional support received from
family and church, such whether they feel loved, listened to, or that their family/church
members express concern for their well-being. Family Negative Interaction and Church
Negative Interaction were measured using two mean-scaled variables that indicated the
amount of negative interaction received from family and church members, such as
whether family or church members criticized the respondent too much, took advantage
of her, or made too many demands of her.
Controls. Age and marital status were included as controls. Researchers find
that these factors serve as predictors of depression in women. Age was indicated by the
respondent in years (18 years of age and above), and an additional variable of the squared
Age (Age2) was also created to account for a nonlinear relationship in the model. Marital
status was divided into four binary variables, Married, Cohabiting,
Divorced/Widowed/Separated, or Never Married, where “1” equals the title response and
“0” equals all others.
Data Analysis

21
I employed linear regression analysis in Stata 11.1 to test the relationships shown
in the Conceptual Model, Figure 1. This approach was used to identify direct and
indirect pathways leading to symptoms of depression and to test the hypotheses of
interest. Analysis of the sample that included both men and women took place first, so
that gender distinctions could be specified with regards to depressive symptoms and
pathways. Then women‟s pathways were analyzed separately to further test theories and
analyze pathways for depressive symptomatology for women. Lastly, women‟s pathways
were analyzed by race/ethnicity to analyze differences in pathways for African American,
Afro-Caribbean and white women. I then performed z-tests between coefficients that
revealed a significant relationship for each group to discover significant differences
between groups for the same associations.
RESULTS
I first analyzed the total sample of men and women and found a significant
difference in symptoms and pathways of depression for males and females. I also found
differences between race/ethnic groups. These results can be found in Appendices E-G1.
This preliminary analysis indicated that a separate investigation of the female sample was
warranted for testing the hypotheses regarding differences among pathways for
depression for ethnic groups of adult women.
Descriptive Statistics for Female Sample
Table 1 presents descriptive characteristics for females in the sample. The
presence of depressive symptoms is shown to be significantly different between groups.
Non-Hispanic white women report higher depressive symptoms (M = 6.56) than African
22
American (M = 4.70) or Afro-Caribbean women (M = 3.70). There are also significant
differences in the poverty index scores, education, and unemployment rates. Non-
Hispanic white females have higher poverty index scores, more education, and lower
rates of unemployment than the other two groups. In fact, white women have
significantly higher depressive symptoms even though they also report significantly
higher education (See Graph 1). These initial findings partially refute the first hypothesis
of the study (H1) which predicted that lower socioeconomic status groups would report
more symptoms of depression than those in the higher status group. Afro-Caribbean
women rate between the other two groups on all significant socioeconomic measures.
However, there are no significant differences on average scores between groups on
psychological resources, and average scores of stressors do not vary significantly by
race/ethnicity.
A lower proportion of African American women (9 %) and Afro-Caribbean
women (9%) perceived themselves to have given more to family than they received,
compared to non-Hispanic white (14%) women, χ2
(2, N = 3660) = 28.47, p < 0.01.
Significantly more African American women (37%) perceived themselves receiving
more from family members than they gave; thirty-six percent of Afro Caribbean women
and thirty-one percent of white women perceived the same, χ2
(2, N = 3660) = 16.73, p <
0.01. Twenty-six percent of black women (African American and Afro-Caribbean) say
they received more from their friends than they gave, while nineteen percent of non-
Hispanic white women said the same, χ2
(2, N = 3602) = 23.16, p < 0.01. Also,
significantly more African American and Afro-Caribbean women perceived themselves
receiving more from the church than they received (38% and 39%, respectively),

23
compared to non-Hispanic white women (30%), χ2
(2, N = 3139) = 21.52, p < 0.01.
Though more than half of all groups considered themselves to be in reciprocal
relationships with their churches, significantly more white women (59%) perceived
themselves to be in reciprocal church relationships than African Americans or Afro-
Caribbeans (50% and 52%, respectively), χ2
(2, N = 3139) = 29.09, p < 0.01.
Two control variables revealed significant differences between groups regarding
marital status. A larger proportion of white females were married (42%) than Afro-
Caribbeans (30%) or African Americans (27%), χ2
(2, N = 3694) = 82.28, p < 0.05. Also,
a significantly larger proportion of African American and Afro-Caribbean females had
never been married (33% and 31%, respectively) compared to non-Hispanic white
women (20%), χ2
(2, N = 3687) = 62.50, p < 0.01.
Multivariate Analyses
Table 2 shows results for OLS regressions of independent variables on depressive
symptoms for females in the sample. Poverty Index scores and unemployment are
initially significantly associated with depressive symptoms. For each unit increase in the
poverty index score, women can expect a .20 unit decrease in depressive symptoms (p <
0.01). Also, unemployment is associated with a 1.53 unit increase in depressive
symptoms (p < 0.001). These findings support the first hypothesis (H1) that lower
socioeconomic status would be associated with an increase in depressive symptoms for
all women in the sample. However, these initial effects change when race and ethnicity
are introduced to the equation (model 2).
24
Afro-Caribbeans report 3.25 units less (p < 0.001) and African Americans report
2.52 units less (p<0.001) depressive symptoms than non-Hispanic whites. In addition,
race/ethnicity is a suppression of the association of poverty index with depression (from β
= -.20, p<0.01 to β = -.28 units, p<0.001). The addition of race/ethnicity also leads to an
increase in the association of unemployment with depression (from β = 1.53, p<0.001 to
β = 1.60, p<0.001).
The addition of psychological resources (model 3) yields more information about
the association with depressive symptoms for women. Those with more self esteem
report fewer depressive symptoms, so that for each unit increase in self esteem,
depressive symptoms decline by .33 units (p<0.001). Each additional unit of mastery
accounts for a .35 unit decrease in depressive symptoms (p<0.001). Self esteem and
mastery both mediate the effects of socioeconomic status on depressive symptoms. With
the addition of these two variables, the effect of the poverty index on depressive
symptoms increases substantially (from β = -.28, p<0.001 to β = -.18, p<0.05), signaling
a mediation effect. However, the additions mediate the effect of unemployment on
depression, as unemployment is no longer a significant associate of depressive
symptoms. These findings do partially substantiate the second hypothesis (H2), stating
that internal psychological resources would serve as protective mechanisms that offset or
mediate the effects of socioeconomic status on depressive symptoms.
As acute and chronic stressors are introduced in the equation (model 4), both
acute stressors (β=.65, p<0.001) and economic hardship (β=.17, p<0.05) are associated
with an increase in depressive symptoms for females. This supports the third hypothesis
(H3), which predicted that both types of stressors would be associated with an

25
exacerbation in depressive symptoms. However, only two of the material support
measures (model 5) are associated with the report of depressive symptoms. Perceiving
oneself to receive more from family than one gives is associated with a .39 unit increase
in depressive symptoms, and giving more to the church than receiving is associated with
a .91 unit increase in depressive symptoms. The addition of material support also
mediates the effect of acute stressors on depression, but has a small suppression affect on
the association between economic hardship and depressive symptoms.
Once emotional support is added (model 6), negative emotional interaction from
family members is significantly associated with an increase the report of depressive
symptoms by .49 units, (p<0.05). The addition of emotional support also significantly
mediates the positive effect of giving more to the church, receiving more from the family,
both acute and chronic stressors, and race/ethnicity. The addition of emotional support
decreases the negative association of psychological resources on depression, suggesting
that respondents somehow feel less competent and in control of their circumstances when
they initiate emotional support. The findings on material and emotional support partially
support the fourth hypothesis (H4) which states that those women perceiving an unequal
exchange in material or emotional support will report more depressive symptoms.
Race/Ethnicity and Pathways to Depressive Symptoms
To further explain the potential racial/ethnic differences in pathways of
depression, I reproduced the model on depressive symptoms for each racial/ethnic group
separately. I found that different pathways exist across race/ethnicity with regards to
stressors and social support. Additionaly, I tested the coefficients for each independent

26
variable using z-test calculations between coefficients
to find the
significant differences between racial/ethnic groups (Paternoster et al 1998). The results
are shown in Table 3.
For African American women, unemployment is associated with a .86 unit
increase in depressive symptoms. Afro-Caribbean women and white women do not report
a significant association between unemployment and depressive symptoms. However, z-
test calculations reveal that there is a significant 2.72 unit difference in African American
and Caribbean women‟s associations between unemployment and depressive symptoms.
Unemployment is the only socioeconomic variable that significantly affects depressive
symptoms for any of the three groups.
Mastery and self esteem serve as protective factors against depressive symptoms
for all three groups of women. Each unit increase in self esteem is associated with a .28
unit decrease (p<0.001) in depressive symptoms for African American women, a .21 unit
decrease (p<0.01) for Afro-Caribbean women, and a .26 unit decrease (p<0.01) for white
women. For each unit increase in mastery, African American women reported a .21 unit
decrease (p<0.001), Afro-Caribbean women reported a .23 unit decrease (p<0.01), and
white women reported a .33 unit decrease (p<0.01) in depressive symptoms. There is no
significant difference in racial ethnic coefficients for associations between self esteem or
mastery with depressive symptoms.
Acute and chronic stressors also play a pronounced role in the relationship
between race/ethnicity and depression. The highest association between acute stressors
27
and depressive symptoms is reported for African American women, as additional acute
stressor is associated with a .68 unit increase in depressive symptoms (p<0.01). For
Afro-Caribbean women, each additional acute stressor is associated with a .36 unit
increase in depressive symptoms (p<0.01), though no signficant association is evident for
white women. A significant difference in this association is also evident between groups.
The association between acute stressors and depressive symptoms is .32 units higher for
African American women than Afro-Caribbean women, and .50 units higher than white
women. There is no difference between Afro-Caribbean and white women in the
association between acute stressors and depressive symptoms.
Economic hardship presents a significant association with depressive symptoms
for African American women only, and is associated with a .30 unit increase in
depressive symptoms (p<0.001). The findings regarding acute stressors and economic
hardship support the hypothesis (H3) that these two variables would reveal a strong
association with depressive symptoms even after self esteem and mastery are taken into
account. These findings also partially support the hypothesis (H5) that pathways to
depressive symptoms are significantly different for each group of black women, as both
acute and chronic stressors operate differently for different groups. Material and
emotional support measures also play different roles in this relationship.
The material support relationships that black women have with the church differs
by ethnicity. For Afro-Caribbean women, the perception of giving more to the church
than received is associated with a 1.41 unit increase in depressive symptoms (p<0.05).
This relationship is not significant for African American or white women. Also, no other
28
material support reciprocity measures show a significant association with depressive
symptoms.
Emotional support shows a sharper difference in the effect on depressive
symptoms by ethnicity. For Afro-Caribbean women, emotional support from family
members serves as a protective factor against depressive symptoms, as this type of
support is associated with a 1.16 unit decrease in depressive symptoms (p<0.001). This
association is not significant for the other groups. Instead, negative interaction from
family members plays a more important role for African American women. Family
negative interaction is association with a .37 unit increase (p<0.05) in depressive
symptoms for African American women, while this measure shows no significant
association for Afro-Caribbean or white women. Afro-Caribbean women report an
association between family emotional support and depressive symptoms that is 1.04 units
higher than that of African American women. However, no significant difference is
shown between African American and white women, or between Afro-Caribbean and
white women. These findings on material and emotional support further support the
hypotheses (H4 and H5) that pathways to depression regarding support relationships differ
among groups of black women, and further reflect the heterogeneity in these groups.
DISCUSSION/CONCLUSION
This study investigated the associations of socioeconomic status, stressors, social
support and psychological resources with depressive symtoms. I took special account of
respondents‟ perceptions of their supportive relationships with family, friends, and
church members, while evaluating their perceptions of reciprocity within material

29
support relationships, and the amount of emotional support and negative interaction in
those same relationships. Previous literature shows that African Americans report fewer
than or the same number of depressive symptoms as whites, but that when African
Americans are diagnosed with depressive disorders they tend to suffer longer from the
symptoms and comorbidity of conditions associated with the disorder (Williams et al
2007). Although chronicity cannot be measured with this cross-sectional data, these
results show fewer depressive symptoms among both African American and Afro-
Caribbean Americans, both overall and among females.
Socioeconomic status is indeed found to be associated with depressive symptoms
in this study, in agreement with my first hypothesis (H1). However, the association of
one SES variable, unemployment, is much higher for African American women than for
Afro-Caribbean women. All of the SES associations significantly decrease as
psychological resources and stressors are considered. As previous literature has shown,
both self esteem and mastery provide significant protection against depressive symptoms
among women. The findings in this study agreed with previous literature.
Acute stressors occuring in the last month are reported to have a larger impact on
depressive symptoms than chronic economic hardship. Both types of stressors do
exacerbate depressive symptoms, even when accounting for the protective factors of
psychological resources. This finding is opposite of the literature which states that acute
stressors would have less of an impact on depressive symptoms than chronic stressors
(Aneshensel 1992; Turner et al 1995). However, the presence of acute stressors is
associated with an even more pronounced association for African American women than
the other two groups. Accordingly, this finding substantiates the hypothesis that acute

30
stressors and economic hardship would exacerbate depressive symptoms (H3) and
partially substantiates the hypothesis that relationships among variables would be
different for each group of women (H5). Still, relationships with family, friends, and
church members significantly alter the effects of stressors in different ways.
The findings of such pronounced differences of interaction effects between black
women warrants further discussion. Since the heterogeneity among black women has not
been discussed often in the literature, researchers should continue to parse out the many
other variants that may occur among minority groups. Further exploration could expand
the way we conceptualize stress and hardship, the way we categorize groups, and could
further enlighten researchers on differences in group interactions. These interactions with
friends, family and community may be a product of or a precursor to socioeconomic
circumstances which could in turn affect psychological processes.
When Siegrist (2009) discussed the impact of unfair exchange, he suggested that
those who receive more from family than they give may feel somehow inadequate, noting
that self worth and esteem may decrease because of economic hardship and the need for
asking for more than one can reciprocate. I found support for this theory by noting that
those who found themselves in this situation did perceive a loss in self esteem, even as
their sense of mastery increased, and this perception was associated with an increase in
depressive symptoms. In addition, those who perceived giving more to the church,
particularly, Afro-Caribbean women, reported an increase in depressive symptoms.
African American women in the sample who perceived critical remarks and other
negative interaction from family also reported fewer depressive symptoms, as well as a
decrease in the associations between psychological resources and depression. Further

31
study should ascertain more definitive pathways of social support on depressive
symptoms.
This study contained some limitations which inhibited complete investigation.
This study involved cross-sectional data, as longitudinal data with the same groups and
items are not available at this time. Therefore, the study could not investigate the
changing effects of socioeconomic status and means of support on depressive symptoms
over time. As mentioned previously, longitudinal data would also allow for the
investigation of the chronicity of depressive symptoms.
Internal consistency and reliability of the acute stressors scale raises some
concern. The low alpha coefficienct for acute stressors (α = .54) may indicate low
variance among items (DeVellis 2003). Indeed, no inter-item variance in this scale
reached a score above .015. Carol Aneshensel (1992) regards this issue as a problem of
disporportionally represented events which affect some groups more than others.
Although many data sets other than the NSAL have included stressful events that were
more representative among whites than other groups, the NSAL may contain stressors
more representative among blacks. The result is still a pool of events which is not
representative of different groups. The low alpha coefficient indicates that more analysis
could draw out the differences among groups for these particular stressors. Future
research, then, could include these stressors in a more widely recognized group of
stressors, so that a scale could be devised which constitutes a representative sample of the
acute stressors occuring in various races/ethnicities, not just those on which the study is
concentrated.
32
This analysis revealed that acute stressors had more of a significant association
with depressive symptoms for women than chronic strain, represented here as economic
hardship. This finding is opposite of analyses performed previously (i.e., Avison and
Turner 1988). However, the finding of my analysis should be considered in light of the
high correlation between the acute stressors scale and the economic hardship scale in this
study (R = .40). Although there is analytical presedence for separating acute from
chronic stressors by asking respondents which occurred in the last month (acute) versus
those that have occurred in the last twelve months (chronic), one must recognize the
natural occurance of economic hardship that is experienced if a respondent answers
affirmatively to some of the items in the acute stressors scale, such as having health
problems, money problems or job problems. The structure of the items on acute stressors
do not specify when the problems began, only that the problems existed in the last month.
Therefore, some of these problems could have been experienced over an extended period
of time and resulted in chronic economic hardship. Analytically, the result would be a
bias toward zero for the economic hardship estimates in the regression models.
Emotional support items were not available to assess relationships with friends.
In addition, two means of support, appraisal and informational support, were unavailable
in the data set used in this study. An important avenus for fuuture research is to further
investigate and compile data sets that can entail all four means of support and produce
explanations for their associations with depressive symptoms among various ethnicities.
This data set is one of the first to provide means for investigating the
heterogeneity of the black population in America. However, I would further like to study
the effect of immigration status, which was not possible in the current study. Future
33
research should further investigate racial/ethnic differences in psychological pathways,
especially involving their associations with socioeconomic resources and social support.
Unraveling these processes may allow for more understanding and cooperation between
minority women and service agencies or other representatives in helping capacities.
This study reveals important differences in pathways between socioeconomic
status, stressors, various means of social support and mental health of three groups of
women in the United States. It is the first to investigate the differences in these particular
associations between different groups of women and the first to explore the heterogeneity
of black women in this regard. This study makes a contribution to the literature by
exploring such heterogeneity, and by encouraging future research which continues to
parse out structural and mental health differences among black ethnic groups.

34
REFERENCES
Alegria, Margarita, James S. Jackson, Ronald C. Kessler, and David Takeuchi. 2008.
Collaborative Psychiatric Epidemiology Surveys (CPES), 2001-2003 [United
States] [Computer file]. ICPSR20240-v5. Ann Arbor, MI: Institute for Social
Research, Survey Research Center [producer], 2007. Ann Arbor, MI: Inter-
university Consortium for Political and Social Research.
Aneshensel, Carol. 1992. “Social Stress: Theory and Research.” Annual Review of
Sociology 18: 15-38.
Benjamin, Lois. 1982. “Black Women Achievers: An Isolated Elite.” Sociological
Inquiry 52(2): 141-151.
Bromberge, Joyce, Sioban Harlow, Nancy Avis, Howard Kravitz and Adriana Cordal.
2004. “Racial/Ethnic Differences in the Prevalence of Depressive Symptoms
Among Middle-Aged Women: The Study of Women‟s Health Across the Nation
(SWAN).” American Journal of Public Health 94(8): 1378-1385.
Brown, Diane, Gary Lawrence, Angela Greene, and Norweeta Milburn. 1992. “Patterns
of Social Affiliation as Predictors of Depressive Symptoms Among Urban
Blacks.” Journal of Health and Social Behavior 33(3): 242-253.
Conley, Dalton. 1999. Being Black, Living in the Red. Berkeley, CA: University of
California Press.
35
Day, Jennifer and Kurt Bauman. 2000. Have We Reached the Top? Educational
Attainment Projections of the U.S. Population. Paper presented at the Population
Association of America. Retrieved October 17, 2008.
DeVellis, Robert. 2003. Scale Development: Theory and Applications. 2nd
Edition.
Thousand Oaks, CA: Sage Publications, Inc.
Din-Dzeitham, Rebecca, Wendy Nembhard, Rakale Collins, and Sharon Davis. 2004.
“Perceived stress following race-based discrimination at work is associated with
hypertension in African–Americans. The metro Atlanta heart disease study, 1999–
2001.” Social Science & Medicine 58: 449-461.
Domingues, Silvia and Celeste Watkins. 2003. “Creating Networks for Survival and
Mobility: Social Capital among African-American and Latin-American Low-
Income Single Mothers.” Social Problems 50(1): 111-135.
Edin, Kathryn and Maria Kefalas. 2005. Promises I can Keep: Why Poor Women Put
Motherhood before Marriage. Berkeley, CA: University of California Press.
Ellison, Christopher, Wei Zhang, Neal Krause, and John Marcum. 2009. “Does
Negative Interaction in the Church Increase Psychological Distress? Longitudinal
Findings from the Presbyterian Panel Survey.” Sociology of Religion 70(4): 409-
431.
Evans-Campbell, Teresa, Karen Lincoln, and David Takeuchi. 2007. “Race and Mental
Health: Past Debates, New Opportunities.” Pp. 169-189 in Mental Health, Social
Mirror, edited by William Avison, Jane McLeod, and Bernice Pescosolido. New
York: Springer.

36
George, Linda and Scott Lynch. 2003. “Race Differences in Depressive Symptoms: A
Dynamic Perspective on Stress Exposure and Vulnerability.” Journal of Health
and Social Behavior 44(3): 353-369.
Granovetter, Mark. 1973. “The Strength of Weak Ties.” American Journal of Sociology
78: 1360–1380.
Gray, Beverly and Verna Keith. 2003. “The Benefits and Costs of Social Support for
African American Women.” Pp. 242-257 in In and Out of Our Right Minds, eds.
Diane Brown and Verna Keith. New York: Columbia University Press.
Heeringa, Steven, James Wagner, Myriam Torres, Naihua Duan, Terry Adams, and
Patricia Berglund. 2004. “Sample Designs and Sampling Methods for The
Collaborative Psychiatric Epidemiology Studies (CPES).” International Journal
of Methods in Psychiatric Research 13(4): 221-240.
Heeringa, Steven and Patricia Berglund. 2007. “National Institutes of Mental Health
(NIMH) Collaborative Psychiatric Epidemiology Survey Program (CPES) Data
Set. Integrated Weights and Sampling Error Codes for Design-based Analysis.”
Accessed on May 9, 2010 from
http://www.icpsr.umich.edu/cocoon/cpes/using.xml?section=Weighting
Heflin, Colleen and Mary Patillo. 2002. “Crossing Class Boundaries: Siblings and
Socioeconomic Heterogeneity.” JCPR Working Papers 252, Northwestern
University/University of Chicago Joint Center for Poverty Research.
37
Higginbotham, Elizabeth and Lynn Weber. 1992. “Moving up with Kin and
Community: Upward Social Mobility for Black and White Women.” Gender
and Society 6(3): 416-440.
Jackson, James, Miriam Torres, Cleopatra Caldwell, Harold Neighbors, Randolph Nesse,
Robert Tayler, Stephen Treierweiler, and David R. Williams. 2004. “The
National Survey of American Life: A Study of Racial, Ethnic and Cultural
Influences on Mental Disorder and Mental Health.” International Journal of
Methods in Psychiatric Research 13(4): 196-207.
Kessler, Ronald. 1979. “Stress, Social Status, and Psychological Distress.” Journal of
Health and Social Behavior 20(3): 259-272.
Lincoln, Karen, Linda Chatters and Robert Taylor. 2003. “Psychological Distress
among Black and White Americans: Differential Effects of Social Support,
Negative Interaction and Personal Control.” Journal of Health and Social
Behavior 44(3): 390-407.
----- 2005. “Social Support, Traumatic Events, and Depressive Symptoms among
African Americans.” Journal of Marriage and Family 67(3): 754-766.
Macinko, James and Barbara Starfield. 2001. “The Utility of Social Capital in Research
on Health Determinants.” The Milbank Quarterly 79(3): 387-427.
McLoyd, Vonnie, Toby Jayaratne, Rosario Ceballo, and Julio Borquez. 1994.
“Unemployment and Work Interruption among African American Single

38
Mothers: Effects on Parenting and Adolescent Socioemotional Functioning.”
Child Development 65(2): 562-589.
Meadows, Sarah. 2009. “Is it There When You Need It? Mismatch in Perception of
Future Availability and Subsequent Receipt of Instrumental Social Support.”
Journal of Family Issues 30(8): 1070-1097.
Miech, Richard and Michael Shanahan. 2000. “Socioeconomic Status and Depression
over the Life Course.” Journal of Health and Social Behavior 41(2): 162-176.
Muntaner, Carles, Carme Borrell, and Haejoo Chung. 2007. “Class Relations, Economic
Inequality and Mental Health: Why Social Class Matters to the Sociology of
Mental Health.” Pp. 127-141 in Mental Health, Social Mirror, edited by William
Avison, Jane McLeod, and Bernice Pescosolido. New York: Springer.
Neighbors, Harold and James Jackson. “Mental Health in Black America.” Pp. 1-13 in
Mental Health in Black America, edited by H. Neighbors and J. Jackson.
Thousand Oaks, CA: Sage Publications.
Nelson, Margaret. 2000. “Single Mothers and Social Support: The Commitment to, and
Retreat from, Reciprocity.” Qualitative Sociology 23(3), 291 - 318.
Paternoster, Raymond, Robert Brame, Paul Mazerolle and Alex Piquero. 1998. “Using
the Correct Statistical Test for the Equality of Regression Coefficients.”
Criminology 36(4): 859-866.
Pearlin, Leonard and Carmi Schooler. 1978. “The Structure of Coping.” Journal of
Health and Social Behavior 19(1): 2-21.

39
Press, Julie, Jay Fagan and Elisa Bernd. 2006. “Child Care, Work, and Depressive
Symptoms among Low-Income Mothers.” Journal of Family Issues 27(5): 609-
632.
Portes, Alejandro. 1998. “Social Capital: Its Origins and Applications in Modern
Sociology.” Annual Review of Sociology 24: 1-24.
Radloff, Lenore. 1977. “The CES-D Scale: A Self-Report Depression Scale for
Research in the General Population.” Applied Psychological Measurement 1:
385-401.
Rook, Karen. 1987. “Reciprocity of Social Exchange and Social Satisfaction among
Older Women.” Journal of Personality and Social Psychology 52: 145–154.
Rosenberg, Morris. 1965. Society and the Adolescent Self Image. Princeton, NJ:
Princeton University Press.
Ross, Catherine and John Mirowsky. 1989. “Explaining the Social Patterns of
Depression: Control and Problem Solving – or Support and Talking?” Journal of
Health and Social Behavior 30: 206-219.
Sarkisian, Natalia and Naomi Gerstel. 2004. “Kin Support among Blacks and Whites:
Race and Family Organization.” American Sociological Review 69(6): 812-837.
Schoon, Ingrid, Amanda Sacker and Mel Bartley. 2003. “Socioeconomic adversity and
psychosocial adjustment: a developmental contextual perspective.” Social
Science & Medicine 57: 1001-1015.
40
Shapiro, Thomas. 2004. The Hidden Cost of Being African-American: How Wealth
Perpetuates Inequality. New York: Oxford University Press.
Shaw, Kathleen and Ahsaki Coleman. 2000. “Humble on Sundays: Family, Friends, and
Faculty in the Upward Mobility Experiences of African American Females.”
Anthropology & Education Quarterly 31(4), 449-470.
Siegrist, Johannes. 2008. “Unfair Exchange and Health: Social Bases of Stress-Related
Diseases.” Social Theory and Health 7(4): 305-317.
Stack, Carol. 1974. All Our Kin: Strategies for Survival in a Black Community. New
York: Harper & Row.
Staples, Robert. 1985. “Changes in Black Family Structure: The Conflict between
Family Ideology and Structural Conditions.” Journal of Marriage and the Family
47(4): 1005-1013.
Thoits, Peggy. 1995. “Stress, Coping, and Social Support Processes: Where Are We?
What Next?” Journal of Health and Social Behavior 35: 53-79.
Thoits, Peggy. 1999. “Sociological Approaches to Mental Illness.” Pp. 121-138 in A
Handbook for the Study of Mental Health: Social Contexts, Theories, and
Systems, edited by A. Horwitz and T. Scheid. New York: Cambridge University
Press.
Turner, R. Jay, Blair Wheaton, and Donald Lloyd. 1995. “The Epidemiology of Social
Stress.” American Sociological Review 60(1): 104-125.
41
U.S. Census Bureau. 2010. Current Population Reports, P20-537 and earlier reports; and
„„Families and Living Arrangements‟‟;
http://www.census.gov/population/www/socdemo/hh-fam.html
Last updated January 10, 2010. Accessed April 16, 2010.
----- 2010. How the Census Bureau Measures Poverty.
http://www.census.gov/hhes/www/poverty/about/overview/measure.html Last
updated September 16, 2010. Accessed September 17, 2010.
Wight, Richard, Janet Cummings, Arun Karlamangla, and Carol Aneshensel. 2009.
“Urban Neighborhood Context and Change in Depressive Symptoms Late in
Life.” Journal of Gerontology:Social Sciences 64B(2): 247-251.
Wilson, William J. 1987. The Truly Disadvantaged: The Inner City, The Underclass,
and Public Policy. Chicago, IL: University of Chicago Press.
Williams, David R. 2001. "Racial Residential Segregation: A Fundamental Cause of
Racial Disparities in Health." Public Health Reports 116: 404-416
Williams, David R., Hector Gonzales, Harold Neighbors, Randolph Nesse, Jamie
Abelson, Julie Sweetman, and James Jackson. 2007. “Prevalence and
Distribution of Major Depressive Disorder in African Americans, Caribbean
Blacks, and Non-Hispanic Whites: Results from the National Survey of American
Life.” Archives of General Psychiatry 64: 305-315.
Vaananen, Ari, Abraham Buunk, Mika Kivimaki, Jussi Vahtera, and Markku Koskenvuo.
2008. “Change in Reciprocity as a Predictor of Depressive Symptoms: A

42
Prospective Cohort Study of Finnish Women and Men.” Social Science &
Medicine 67: 1907-1916.
Yu, Yan and David Williams. 1999. “Socioeconomic Status and Mental Health.” Pp.
151-166 in Handbook for the Sociology of Mental Health, edited by C.
Aneshensel and J. Phelan. New York: Plenum Publishing.

43
FIGURE 1. Conceptual Model
Psychological Resources
Social Support
Mental Health
Socioeconomic Status
Race/Ethnicity
Stressors

44
43
Variable Range M SD M SD M SD p value X2
CESD 0 - 27 4.70 0.15 3.70 0.27 6.56 0.27 0.000 17.93
SOCIOECONOMIC STATUS
Poverty Index 0 - 17 2.30 0.09 2.94 0.30 3.43 0.26 0.000 110.10
Education (in years) 4 - 17 12.46 0.10 12.86 0.23 13.63 0.27 0.000 16.19
Employed 0 - 1 0.64 -- 0.74 -- 0.67 -- 0.168 7.30
Unemployed 0 - 1 0.11 -- 0.10 -- 0.06 -- 0.039 22.12
Not In Labor Force 0 - 1 0.25 -- 0.17 -- 0.27 -- 0.316 5.61
INTERNAL RESOURCES
Self Esteem 12 - 40 36.09 0.14 36.88 0.16 35.47 0.31 0.003 11.72
Mastery 7 - 28 23.13 0.12 23.21 0.40 23.13 0.24 0.823 0.39
STRESSORS
Acute Stressors 0 - 9 1.95 0.05 1.57 0.07 1.53 0.07 0.000 48.78
Economic Hardship 3 - 12 5.27 0.06 5.43 0.20 5.24 0.17 0.261 2.68
MATERIAL SUPPORT RECIPROCITY
Gave more to Family than Received 0 - 1 0.09 -- 0.09 -- 0.14 -- 0.007 34.47
Received More from Family than Gave 0 - 1 0.37 -- 0.36 -- 0.31 -- 0.009 16.73
Family Reciprocal Relationship 0 - 1 0.54 -- 0.55 -- 0.55 -- 0.839 0.289
Gave more to Friends than Received 0 - 1 0.05 -- 0.08 -- 0.07 -- 0.503 4.68
Received More from Friends than Gave 0 - 1 0.26 -- 0.26 -- 0.20 -- 0.010 23.16
Friends Reciprocal Relationship 0 - 1 0.68 -- 0.66 -- 0.74 -- 0.152 12.64
Gave More to Church than Received 0 - 1 0.12 -- 0.09 -- 0.11 -- 0.217 8.45
Received More from Church than Gave 0 - 1 0.38 -- 0.39 -- 0.30 -- 0.004 21.52
Church Reciprocal Relationship 0 - 1 0.50 -- 0.52 -- 0.59 -- 0.002 29.09
EMOTIONAL SUPPORT
Emotional Support from Family 1 - 4 3.28 0.02 3.36 0.05 3.41 0.05 0.507 1.36
Negative Interaction from Family 1 - 4 1.90 0.02 1.87 0.05 1.77 0.03 0.000 19.27
Emotional Support from Church 1 - 4 2.98 0.03 2.73 0.06 2.96 0.06 0.057 5.72
Negative Interaction from Church 1 - 4 1.48 0.01 1.42 0.04 1.37 0.03 0.000 38.90
CONTROLS
Age 18 - 94 42.18 0.57 40.83 0.73 43.75 2.27 0.003 11.59
Married 0 - 1 0.27 -- 0.30 -- 0.42 -- 0.001 80.45
Cohabiting 0 - 1 0.08 -- 0.11 -- 0.06 -- 0.307 5.68
Divorced, Widowed, or Separated 0 - 1 0.32 -- 0.28 -- 0.31 -- 0.752 0.73
Never Married 0 - 1 0.33 -- 0.31 -- 0.20 -- 0.018 68.88
Statistics are weighted according to U.S. population.
African-
Americans
(N = 2189)
Afro-
Caribbeans
(N = 842)
Whites
(N = 358)
TABLE 1. Descriptive Statistics for Females (Weighted Means or Proportions, and Standard Deviations)

45
GRAPH 1. Depressive Symptoms of Females by Race/Ethnicity and
Education.
0
2
4
6
8
Me
an
of
CE
SD
0-11 YEARS 12 YEARS 13-15 YEARS >15 YEARS
By Race and Education
Depressive Symptoms
Afro-Caribbean
White
African American
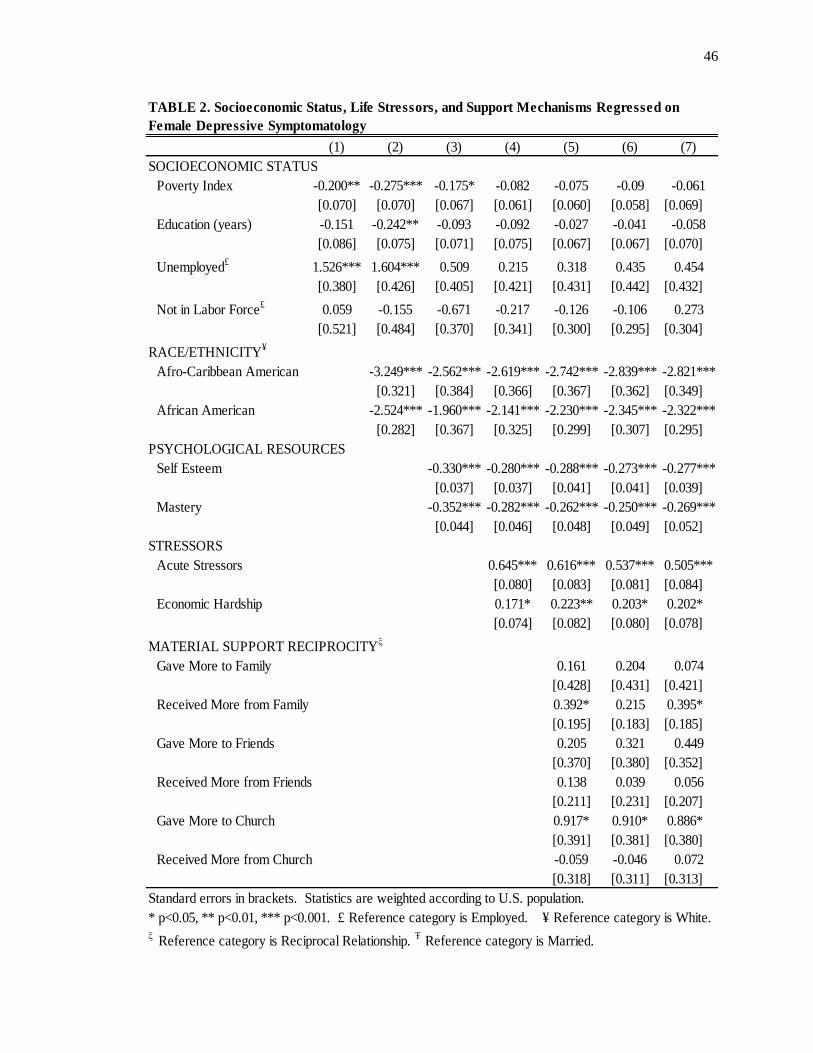
46
(1) (2) (3) (4) (5) (6) (7)
SOCIOECONOMIC STATUS
Poverty Index -0.200** -0.275*** -0.175* -0.082 -0.075 -0.09 -0.061
[0.070] [0.070] [0.067] [0.061] [0.060] [0.058] [0.069]
Education (years) -0.151 -0.242** -0.093 -0.092 -0.027 -0.041 -0.058
[0.086] [0.075] [0.071] [0.075] [0.067] [0.067] [0.070]
Unemployed£
1.526*** 1.604*** 0.509 0.215 0.318 0.435 0.454
[0.380] [0.426] [0.405] [0.421] [0.431] [0.442] [0.432]
Not in Labor Force£
0.059 -0.155 -0.671 -0.217 -0.126 -0.106 0.273
[0.521] [0.484] [0.370] [0.341] [0.300] [0.295] [0.304]
RACE/ETHNICITY¥
Afro-Caribbean American -3.249*** -2.562*** -2.619*** -2.742*** -2.839*** -2.821***
[0.321] [0.384] [0.366] [0.367] [0.362] [0.349]
African American -2.524*** -1.960*** -2.141*** -2.230*** -2.345*** -2.322***
[0.282] [0.367] [0.325] [0.299] [0.307] [0.295]
PSYCHOLOGICAL RESOURCES
Self Esteem -0.330*** -0.280*** -0.288*** -0.273*** -0.277***
[0.037] [0.037] [0.041] [0.041] [0.039]
Mastery -0.352*** -0.282*** -0.262*** -0.250*** -0.269***
[0.044] [0.046] [0.048] [0.049] [0.052]
STRESSORS
Acute Stressors 0.645*** 0.616*** 0.537*** 0.505***
[0.080] [0.083] [0.081] [0.084]
Economic Hardship 0.171* 0.223** 0.203* 0.202*
[0.074] [0.082] [0.080] [0.078]
MATERIAL SUPPORT RECIPROCITYξ
Gave More to Family 0.161 0.204 0.074
[0.428] [0.431] [0.421]
Received More from Family 0.392* 0.215 0.395*
[0.195] [0.183] [0.185]
Gave More to Friends 0.205 0.321 0.449
[0.370] [0.380] [0.352]
Received More from Friends 0.138 0.039 0.056
[0.211] [0.231] [0.207]
Gave More to Church 0.917* 0.910* 0.886*
[0.391] [0.381] [0.380]
Received More from Church -0.059 -0.046 0.072
[0.318] [0.311] [0.313]
Standard errors in brackets. Statistics are weighted according to U.S. population.
* p<0.05, ** p<0.01, *** p<0.001. £ Reference category is Employed. ¥ Reference category is White.ξ Reference category is Reciprocal Relationship.
Ŧ Reference category is Married.
TABLE 2. Socioeconomic Status, Life Stressors, and Support Mechanisms Regressed on
Female Depressive Symptomatology

47
(1) (2) (3) (4) (5) (6) (7)
EMOTIONAL SUPPORT
Family Emotional Support -0.242 -0.25
[0.144] [0.143]
Family Negative Interaction 0.494** 0.381*
[0.171] [0.160]
Church Emotional Support -0.107 -0.124
[0.165] [0.160]
Church Negative Interaction 0.423 0.462
[0.338] [0.334]
CONTROLS
Age -0.073
[0.047]
Age2 0.000
[0.000]
Cohabiting -0.415
[0.645]
Divorced/Separated/Widowed -0.088
[0.247]
Never Married -0.227
[0.287]
Intercept 7.795*** 10.742*** 28.404*** 22.678*** 21.099*** 20.463*** 23.598***
[1.006] [0.811] [1.219] [1.488] [1.736] [2.144] [1.932]
N 3386 3386 3342 3317 2771 2764 2764
R2
0.036 0.099 0.353 0.397 0.404 0.417 0.424
F 13.291 54.547 78.49 65.935 40.785 48.382 68.545
df 4 6 8 10 16 20 25
Standard errors in brackets. Statistics are weighted according to U.S. population.
* p<0.05, ** p<0.01, *** p<0.001. £ Reference category is Employed. ¥ Reference category is White.ξ Reference category is Reciprocal Relationship.
Ŧ Reference category is Married.
TABLE 2 (continued). Socioeconomic Status, Life Stressors, and Support Mechanisms
Regressed on Female Depressive Symptomatology

48
African
American
Afro-
Caribbean White
Difference
(p<0.05)
SOCIOECONOMIC STATUS
Poverty Index -0.013 0.027 -0.177
(0.045) (0.049) (0.105)
Education -0.092 -0.070 -0.028
(0.046) (0.083) (0.125)
Unemployed 0.860 * -1.861 -0.327 Ac
(0.421) (1.247) (1.135)
Not Working -0.017 -0.187 -0.325
(0.241) (0.311) (0.538)
PSYCHOLOGICAL RESOURCES
Self Esteem -0.281 *** -0.205 ** -0.262 **
(0.041) (0.061) (0.082)
Mastery -0.210 *** -0.226 ** -0.326 **
(0.038) (0.061) (0.100)
STRESSORS
Acute Stressors 0.678 *** 0.358 ** 0.176 Ac, Aw
(0.094) (0.113) (0.191)
Economic Hardship 0.291 *** 0.233 * 0.146
(0.062) (0.106) (0.168)
MATERIAL SUPPORT RECIPROCITYξ
Gave More to Family 0.225 0.636 0.138
(0.361) (0.676) (0.718)
Received More from Family 0.132 -0.031 0.446
(0.219) (0.397) (0.340)
Gave More to Friends 0.128 0.636 1.062
(0.380) (0.778) (0.889)
Received More from Friends 0.068 0.670 -0.304
(0.255) (0.607) (0.637)
Gave More to Church 0.708 1.406 * 0.794
(0.493) (0.673) (0.645)
Received More from Church -0.133 -0.090 0.212
(0.265) (0.434) (0.669)
Standard errors in parentheses. * p<0.05, **p<0.01, *p<0.001
Ac = African American - Caribbean Difference
Aw = African American-White Difference
Cw = Caribbean-White Difference
TABLE 3. Socioeconomic Status, Life Stressors, and Support Mechanisms Regressed on
Female Depressive Symptomatology for Each Group

49
African
American
Afro-
Caribbean White
Difference
(p<0.05)
EMOTIONAL SUPPORT
Family Emotional Support -0.119 -1.156 *** -0.441 Ac
(0.158) (0.307) (0.292)
Family Negative Interaction 0.368 * 0.606 0.760
(0.180) (0.357) (0.363)
Church Emotional Support 0.025 0.050 -0.366
(0.166) (0.335) (0.351)
Church Negative Interaction 0.122 0.241 1.287
(0.263) (0.317) (0.884)
Intercept 17.132 *** 17.43 *** 22.613 ***
(1.896) (2.340) (5.110)
N 1810 688 266
R2 0.41 0.365 0.407
F 40.335 36.34 .
df 18 18 15
Standard errors in parentheses. * p<0.05, **p<0.01, *p<0.001
Ac = African American - Caribbean Difference
Aw = African American-White Difference
Cw = Caribbean-White Difference
TABLE 3 (continued). Socioeconomic Status, Life Stressors, and Support Mechanisms
Regressed on Female Depressive Symptomatology for Each Group

50
APPENDIX A. Center for Epidemiological Studies – Depression Scale (CES-D) Items
# Item
Rarely of
none of the
time (Less
than 1 day)
Some or a
little of the
time (1-2
days)
Occasionally
or a
moderate
amont of time
(3-4 days)
Most or all
of the time
(5-7 days)
1.0 I had trouble keeping my mind on what I was doing.
2.0 I felt depressed.
3.0 I felt that people were unfriendly towards me.
4.0 My sleep was restless.
5.0 I was happy.
6.0 I enjoyed life.
7.0 I had crying spells.
8.0 I felt that people dislike me.
9.0 I could not get "going."
(Radloff 1977)
Below is a list of the ways you might have felt or behaved. Please tell me how often you have felt this way
in the last week.
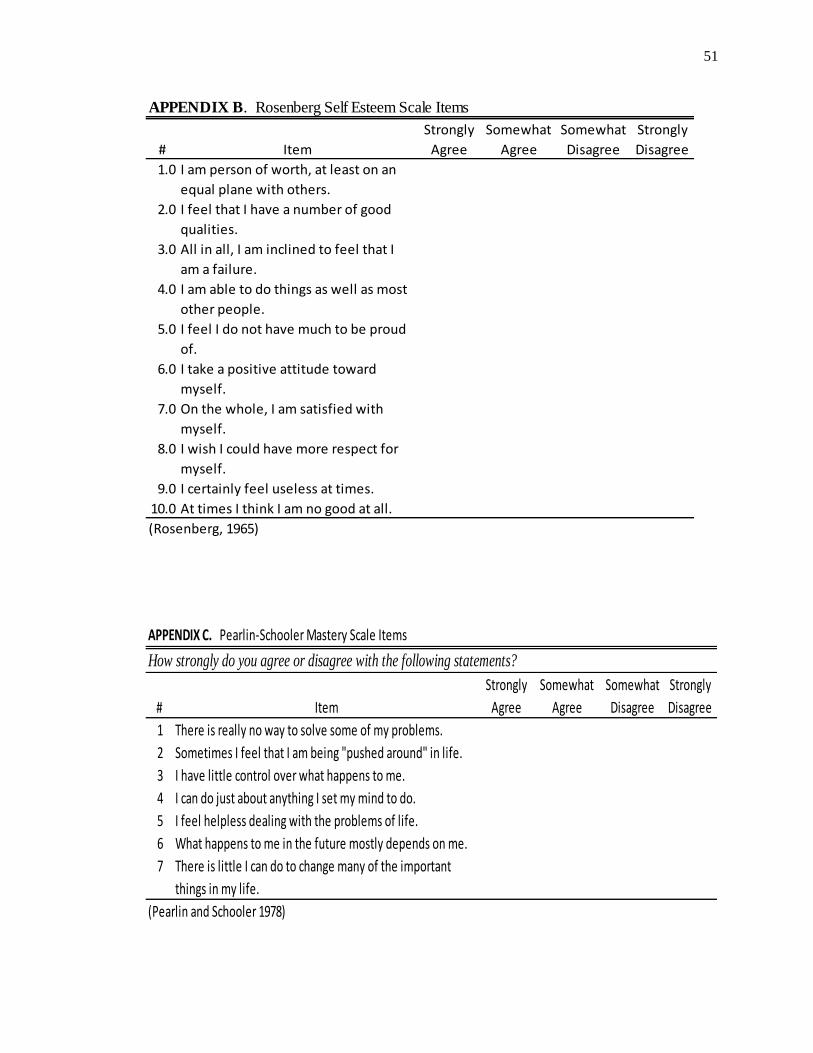
51
APPENDIX B. Rosenberg Self Esteem Scale Items
# Item
Strongly
Agree
Somewhat
Agree
Somewhat
Disagree
Strongly
Disagree
1.0 I am person of worth, at least on an
equal plane with others.
2.0 I feel that I have a number of good
qualities.
3.0 All in all, I am inclined to feel that I
am a failure.
4.0 I am able to do things as well as most
other people.
5.0 I feel I do not have much to be proud
of.
6.0 I take a positive attitude toward
myself.
7.0 On the whole, I am satisfied with
myself.
8.0 I wish I could have more respect for
myself.
9.0 I certainly feel useless at times.
10.0 At times I think I am no good at all.
(Rosenberg, 1965)
APPENDIX C. Pearlin-Schooler Mastery Scale Items
How strongly do you agree or disagree with the following statements?
# Item
Strongly
Agree
Somewhat
Agree
Somewhat
Disagree
Strongly
Disagree
1 There is really no way to solve some of my problems.
2 Sometimes I feel that I am being "pushed around" in life.
3 I have little control over what happens to me.
4 I can do just about anything I set my mind to do.
5 I feel helpless dealing with the problems of life.
6 What happens to me in the future mostly depends on me.
7 There is little I can do to change many of the important
things in my life.
(Pearlin and Schooler 1978)

52
APPENDIX E. Economic Hardship Scale Items
Item
Not At
All
Difficult
Not
Very
Difficult
Somewhat
Difficult
Very
Difficult
Extremely
Difficult
How difficult is it for
[(you/your family)] to meet
the monthly payments on
your [(family's)] bills?
APPENDIX D. Acute Stressors Scale Items
In the past month, have you had:
# Item Yes No
1 Health problems?
2 Money problems?
3 Job problems?
4 Problems with your children?
5 Family/marriage problems?
6 You or a family member been a victim of crime?
7 Police problems?
8 Problems in your love life?
9 You or a family member had race problems?
10 Gambling problems?
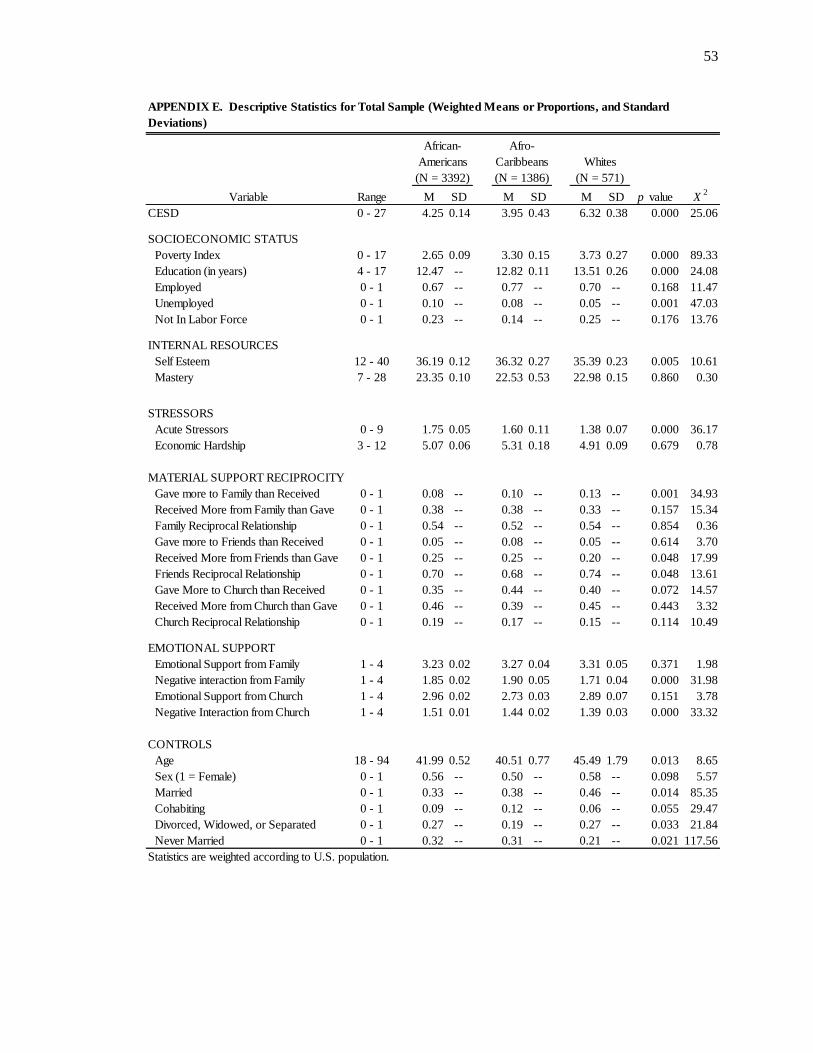
53
Variable Range M SD M SD M SD p value X2
CESD 0 - 27 4.25 0.14 3.95 0.43 6.32 0.38 0.000 25.06
SOCIOECONOMIC STATUS
Poverty Index 0 - 17 2.65 0.09 3.30 0.15 3.73 0.27 0.000 89.33
Education (in years) 4 - 17 12.47 -- 12.82 0.11 13.51 0.26 0.000 24.08
Employed 0 - 1 0.67 -- 0.77 -- 0.70 -- 0.168 11.47
Unemployed 0 - 1 0.10 -- 0.08 -- 0.05 -- 0.001 47.03
Not In Labor Force 0 - 1 0.23 -- 0.14 -- 0.25 -- 0.176 13.76
INTERNAL RESOURCES
Self Esteem 12 - 40 36.19 0.12 36.32 0.27 35.39 0.23 0.005 10.61
Mastery 7 - 28 23.35 0.10 22.53 0.53 22.98 0.15 0.860 0.30
STRESSORS
Acute Stressors 0 - 9 1.75 0.05 1.60 0.11 1.38 0.07 0.000 36.17
Economic Hardship 3 - 12 5.07 0.06 5.31 0.18 4.91 0.09 0.679 0.78
MATERIAL SUPPORT RECIPROCITY
Gave more to Family than Received 0 - 1 0.08 -- 0.10 -- 0.13 -- 0.001 34.93
Received More from Family than Gave 0 - 1 0.38 -- 0.38 -- 0.33 -- 0.157 15.34
Family Reciprocal Relationship 0 - 1 0.54 -- 0.52 -- 0.54 -- 0.854 0.36
Gave more to Friends than Received 0 - 1 0.05 -- 0.08 -- 0.05 -- 0.614 3.70
Received More from Friends than Gave 0 - 1 0.25 -- 0.25 -- 0.20 -- 0.048 17.99
Friends Reciprocal Relationship 0 - 1 0.70 -- 0.68 -- 0.74 -- 0.048 13.61
Gave More to Church than Received 0 - 1 0.35 -- 0.44 -- 0.40 -- 0.072 14.57
Received More from Church than Gave 0 - 1 0.46 -- 0.39 -- 0.45 -- 0.443 3.32
Church Reciprocal Relationship 0 - 1 0.19 -- 0.17 -- 0.15 -- 0.114 10.49
EMOTIONAL SUPPORT
Emotional Support from Family 1 - 4 3.23 0.02 3.27 0.04 3.31 0.05 0.371 1.98
Negative interaction from Family 1 - 4 1.85 0.02 1.90 0.05 1.71 0.04 0.000 31.98
Emotional Support from Church 1 - 4 2.96 0.02 2.73 0.03 2.89 0.07 0.151 3.78
Negative Interaction from Church 1 - 4 1.51 0.01 1.44 0.02 1.39 0.03 0.000 33.32
CONTROLS
Age 18 - 94 41.99 0.52 40.51 0.77 45.49 1.79 0.013 8.65
Sex (1 = Female) 0 - 1 0.56 -- 0.50 -- 0.58 -- 0.098 5.57
Married 0 - 1 0.33 -- 0.38 -- 0.46 -- 0.014 85.35
Cohabiting 0 - 1 0.09 -- 0.12 -- 0.06 -- 0.055 29.47
Divorced, Widowed, or Separated 0 - 1 0.27 -- 0.19 -- 0.27 -- 0.033 21.84
Never Married 0 - 1 0.32 -- 0.31 -- 0.21 -- 0.021 117.56
Statistics are weighted according to U.S. population.
Whites
(N = 571)
Afro-
Caribbeans
(N = 1386)
African-
Americans
(N = 3392)
APPENDIX E. Descriptive Statistics for Total Sample (Weighted Means or Proportions, and Standard
Deviations)

54
(1) (2) (3) (4) (5) (6) (7) (8)
SOCIOECONOMIC STATUS
Poverty Index -0.165** -0.232*** -0.214*** -0.117** -0.044 -0.058 -0.066 -0.036
[0.052] [0.050] [0.055] [0.043] [0.041] [0.044] [0.042] [0.046]
Education (years) -0.079 -0.157* -0.167** -0.030 -0.047 -0.049 -0.064 -0.090
[0.064] [0.062] [0.060] [0.052] [0.054] [0.048] [0.048] [0.051]
Unemployed£
1.571*** 1.774*** 1.733*** 0.797* 0.362 0.165 0.246 0.259
[0.309] [0.334] [0.331] [0.355] [0.348] [0.330] [0.328] [0.324]
RACE/ETHNICITY¥
Afro-Caribbean American -2.643*** -2.600*** -2.248*** -2.444*** -2.633*** -2.730*** -2.814***
[0.600] [0.612] [0.449] [0.403] [0.293] [0.292] [0.284]
African American -2.597*** -2.577*** -1.890*** -2.116*** -2.249*** -2.338*** -2.412***
[0.436] [0.442] [0.389] [0.348] [0.246] [0.260] [0.258]
SEX 0.558 0.662** 0.372 0.125 0.148 0.188
[0.294] [0.220] [0.215] [0.174] [0.175] [0.176]
PSYCHOLOGICAL RESOURCES
Self Esteem -0.347*** -0.291*** -0.305*** -0.293*** -0.286***
[0.024] [0.027] [0.033] [0.033] [0.031]
Mastery -0.287*** -0.227*** -0.205*** -0.197*** -0.211***
[0.029] [0.031] [0.035] [0.035] [0.036]
STRESSORS
Acute Stressors 0.585*** 0.596*** 0.525*** 0.501***
[0.063] [0.080] [0.083] [0.085]
Economic Hardship 0.187** 0.207*** 0.193** 0.182**
[0.058] [0.060] [0.057] [0.057]
MATERIAL SUPPORT RECIPROCITYξ
Received More from Family 0.388 0.273 0.393*
[0.205] [0.190] [0.189]
Gave More to Friends 0.627* 0.711* 0.846**
[0.287] [0.300] [0.291]
Received More from Church 0.485* 0.454* 0.376*
[0.228] [0.185] [0.181]
EMOTIONAL SUPPORT
Family Negative Interaction 0.479** 0.377*
[0.158] [0.158]
Intercept 6.400*** 9.203*** 8.961*** 25.720*** 20.709*** 20.501*** 19.841*** 20.448***
[0.744] [0.967] [1.030] [1.280] [1.503] [1.119] [1.516] [1.727]
N 5345 5345 5345 5287 5247 4194 4184 4184
R2
0.027 0.097 0.100 0.338 0.378 0.387 0.397 0.405
F 11.189 22.359 48.471 93.253 82.712 75.396 66.237 57.964
df 4 6 7 9 11 17 21 26
Standard errors in brackets. Statistics are weighted according to U.S. population.
* p<0.05, ** p<0.01, *** p<0.001. £ Reference category is Employed. ¥ Reference category is White.ξ Reference category is Reciprocal Relationship.
Ŧ Reference category is Married.
APPENDIX F. Socioeconomic Status, Life Stressors, and Support Mechanisms Regressed on Depressive
Symptomatology for Total Sample

55
African
American
Afro-
Caribbean White
Difference
(p<0.05)
SOCIOECONOMIC STATUS
Poverty Index 0.061 0.034 -0.42749 Aw,Cw
(0.041) (0.091) (0.115)
Education -0.115 -0.180 -0.05778
(0.055) (0.083) (0.097)
Unemployed 0.256 * 1.578 2.355557
(0.904) (1.328) (1.063)
Not Working 0.198 0.845 0.947108
(0.291) (0.546) (0.721)
PSYCHOLOGICAL RESOURCES
Self Esteem -0.325 *** -0.148 ** -0.27414 **
(0.048) (0.082) (0.053)
Mastery -0.132 *** -0.229 ** -0.41667 **
(0.037) (0.068) (0.062)
STRESSORS
Acute Stressors 0.602 *** 0.309 ** -0.17596 Aw
(0.124) (0.249) (0.229)
Economic Hardship 0.312 *** 0.083 * 0.215332
(0.084) (0.159) (0.149)
MATERIAL SUPPORT RECIPROCITYξ
Gave More to Family 0.158 1.295 -0.45858
(0.799) (1.027) (0.612)
Received More from Family 0.048 -1.733 1.381033 Ac, Aw,Cw
(0.255) (0.476) (0.557)
Gave More to Friends 0.741 1.084 1.398938
(0.556) (1.194) (1.067)
Received More from Friends 0.050 1.129 -0.90856
(0.287) (0.609) (0.517)
Gave More to Church 0.234 1.024 * 0.167745
(0.301) (0.325) (0.623)
Received More from Church 0.104 0.618 0.013263
(0.260) (0.393) (0.575)
Standard errors in parentheses. * p<0.05, **p<0.01, *p<0.001
Ac = African American - Caribbean Difference
Aw = African American-White Difference
Cw = Caribbean-White Difference
APPENDIX G. Socioeconomic Status, ife Stressors, and Support Mechanisms Regressed on
Total Sample Depressive Symptomatology for Each Group
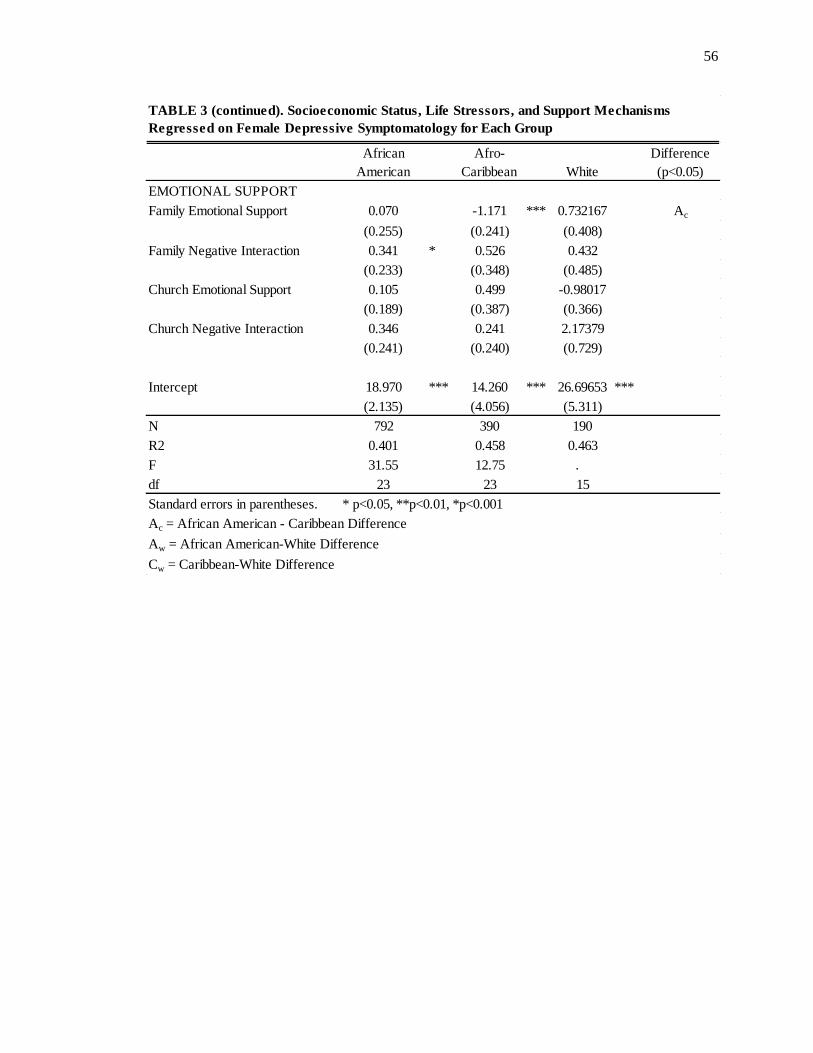
56
African
American
Afro-
Caribbean White
Difference
(p<0.05)
EMOTIONAL SUPPORT
Family Emotional Support 0.070 -1.171 *** 0.732167 Ac
(0.255) (0.241) (0.408)
Family Negative Interaction 0.341 * 0.526 0.432
(0.233) (0.348) (0.485)
Church Emotional Support 0.105 0.499 -0.98017
(0.189) (0.387) (0.366)
Church Negative Interaction 0.346 0.241 2.17379
(0.241) (0.240) (0.729)
Intercept 18.970 *** 14.260 *** 26.69653 ***
(2.135) (4.056) (5.311)
N 792 390 190
R2 0.401 0.458 0.463
F 31.55 12.75 .
df 23 23 15
Standard errors in parentheses. * p<0.05, **p<0.01, *p<0.001
Ac = African American - Caribbean Difference
Aw = African American-White Difference
Cw = Caribbean-White Difference
TABLE 3 (continued). Socioeconomic Status, Life Stressors, and Support Mechanisms
Regressed on Female Depressive Symptomatology for Each Group

57
Variable Range M SD M SD p value X2
CESD 0 - 27 5.02 0.18 5.92 0.48 0.003 141.96
SOCIOECONOMIC STATUS
Poverty Index 0 - 17 3.15 0.13 2.73 0.22 0.440 42.57
Economic Hardship 3 - 12 4.99 0.05 5.22 0.17 0.069 49.58
Education 4 - 17 12.95 0.12 12.38 0.25 0.322 33.07
Work Status
Employed 0 - 1 0.68 -- 0.73 -- 0.027 13.23
Unemployed 0 - 1 0.08 -- 0.13 -- 0.532 0.77
Not In Labor Force 0 - 1 0.24 -- 0.15 -- 0.004 20.76
RACE/ETHNICITY
African American 0 - 1 0.55 -- 0.59 -- 0.683 0.82
Afro-Caribbean 0 - 1 0.04 -- 0.03 -- 0.044 1.02
White 0 - 1 0.41 -- 0.38 -- 0.807 0.31
Self Esteem 12 - 40 35.92 0.13 35.33 0.42 0.176 81.49
Mastery 7 - 28 23.20 0.09 22.88 0.32 0.120 75.80
Acute Stressors 0 - 9 1.59 0.04 1.60 0.11 0.792 8.45
Economic Hardship 3 - 12 4.99 0.05 5.22 0.17 0.231 3.50
MATERIAL SUPPORT RECIPROCITY
Gave more to Family than Received 0 - 1 0.10 -- 0.16 -- 0.071 18.79
Received More from Family than Gave 0 - 1 0.36 -- 0.34 -- 0.299 1.36
Family Reciprocal Support 0 - 1 0.54 -- 0.50 -- 0.490 2.22
Gave more to Friends than Received 0 - 1 0.05 -- 0.02 -- 0.026 9.09
Received More from Friends than Gave 0 - 1 0.23 -- 0.24 -- 0.819 0.16
Friends Reciprocal Support 0 - 1 0.71 -- 0.74 -- 0.567 1.18
EMOTIONAL SUPPORT
Emotional Support from Family 1 - 4 3.28 0.02 3.11 0.06 0.021 54.97
NEGATIVE INTERACTION
Negative Interaction from Family 1 - 4 1.78 0.02 1.88 0.07 0.368 22.86
CONTROLS
Age 18 - 94 44.15 0.70 34.62 1.28 0.007 279.12
Married 0 - 1 0.40 -- 0.22 -- 0.001 35.52
Cohabiting 0 - 1 0.08 -- 0.11 -- 0.067 12.33
Divorced, Widowed or Separated 0 - 1 0.27 -- 0.18 -- 0.049 11.47
Never Married 0 - 1 0.25 -- 0.49 -- 0.000 60.51
Statistics are weighted according to U.S. population.
Has
attended
church
N=4920
Has not
attended
church
N=426
Appendix H. Descriptive Statististics by Church Attendance for Total Sample (Weighted
Means and Proportions, Standard Deviations)