variation of fluorescence with …etd.library.vanderbilt.edu/available/etd-03262010-093034/...often...
TRANSCRIPT

VARIATION OF FLUORESCENCE WITH TEMPERATURE IN HUMAN TISSUE
By
Daniel Barton Masters
Thesis
Submitted to the Faculty of the
Graduate School of Vanderbilt University
in partial fulfillment of the requirements
for the degree of
MASTER OF SCIENCE
in
Biomedical Engineering
May, 2010
Nashville, Tennessee
Approved:
Professor Anita Mahadevan-Jansen
Professor E. Duco Jansen

ii
ACKNOWLEDGEMENTS
I would like to thank Alex Walsh for assisting me in almost all of these
experiments. I would also like to thank Raiyan Zaman and Dr. A.J. Welch at the
University of Texas at Austin for the initial work on this project and their continued
expertise in this area.

iii
TABLE OF CONTENTS
Page
ACKNOWLEDGEMENTS ................................................................................................ ii
LIST OF FIGURES ............................................................................................................. v
Chapter
I. BACKGROUND AND PRELIMINARY EXPERIMENTS ........................................... 1
Introduction ............................................................................................................. 1
Fluorescence ............................................................................................................ 2
Fluorescence Quenching ............................................................................. 4
Optical Properties .................................................................................................... 5
Methods to Determine Optical Properties ................................................... 6
Effects of Optical Properties on Fluorescence .......................................... 10
Effects of Heat on Optical Properties ........................................................ 12
Other Thermal Considerations .................................................................. 13
Preliminary Experiments ....................................................................................... 13
Materials and Methods .............................................................................. 14
Results ....................................................................................................... 17
Discussion ................................................................................................. 23
Conclusion ................................................................................................. 25
Hypothesis and Objectives .................................................................................... 26
Bibliography .......................................................................................................... 28
II. VARIATION OF FLUORESCENCE WITH TEMPERATURE
IN HUMAN TISSUE ............................................................................................... 30
Introduction ........................................................................................................... 30
Materials and Methods .......................................................................................... 34
Instrumentation.......................................................................................... 34
In Vitro Methods ....................................................................................... 36
In Vivo Methods ........................................................................................ 37
Analysis ................................................................................................................. 38
Spectral Processing ................................................................................... 38
Data Extraction .......................................................................................... 38
Results ................................................................................................................... 40
In Vitro ...................................................................................................... 40
In Vivo ....................................................................................................... 45
Discussion ............................................................................................................. 47
In Vitro ...................................................................................................... 48
In Vivo ....................................................................................................... 51

iv
Overall ....................................................................................................... 52
Conclusions ............................................................................................... 54
Bibliography .......................................................................................................... 56
III. SUMMARY AND FUTURE DIRECTIONS ............................................................. 59
Summary ............................................................................................................... 59
Future Directions ................................................................................................... 60

v
LIST OF FIGURES
Page
1.1 Jablonski Diagram ............................................................................................. 3
1.2 Double Integrating Spheres ............................................................................... 6
1.3 Experimental Setup for Preliminary Experiments .......................................... 16
1.4 Fluorescence as a function of temperature for animal tissues ......................... 18
1.5 Fluorescence intensity as a function of temperature for animal tissues .......... 20
1.6 Reflectance intensity as a function of temperature for animal tissues ............ 21
1.7 Fluorescence reversibility of animal tissues.................................................... 22
2.1 Experimental Setup for Human Tissue Experiments ...................................... 35
2.2 Fluorescence as a function of temperature for human tissues ......................... 40
2.3 Fluorescence and optical properties as a function of temperature for skin
samples ...................................................................................................... 42
2.4 Fluorescence and optical properties as a function of temperature for adipose
tissue samples ............................................................................................ 43
2.5 Reversibility trends for human skin and human adipose tissue ...................... 44
2.6 Representative in vivo fluorescence intensity as a function of temperature ... 46
2.7 Mean slopes of in vitro and in vivo fluorescence intensity as a function of
temperature for human skin....................................................................... 47

1
CHAPTER I
BACKGROUND AND PRELIMINARY EXPERIMENTS
Introduction
The interaction of fluorescence, optical properties, and temperature in human
tissue is a fundamental scientific topic in biomedical optics. The field of biomedical
optics uses lasers and other optical techniques for scientific experimentation, treatment,
diagnosis, and the guidance of therapy. Thermal effects during these applications can
often present confounding experimental factors. Changes in tissue due to heat generated
by absorption of light is of vital importance during ablative procedures using lasers, but
the effect of temperature variation in optical diagnosis has received much less scrutiny.
The exact mechanism by which temperature affects fluorescence in tissue is not
completely understood or defined. It is known that temperature past a certain threshold
can cause coagulation, which creates a change in optical properties. Specifically,
coagulation causes an increase in scattering and increased opacity in some tissues [1].
These optical properties modulate fluorescence, and comprise part of the mechanism by
which temperature affects fluorescence. It is also known that increased temperature can
cause quenching, a change in molecular energy levels, a breakdown of fluorophores, and
other optical property changes distinct from coagulation. The understanding of these
2
mechanisms in tissue fluorescence would augment the effectiveness and accuracy of
fluorescence spectroscopy in biomedical applications.
Of the many variables which affect fluorescence in tissue, temperature is often
ignored. As fluorescence continues to gain popularity as a tool for diagnosis and
therapeutic guidance, it is being implemented in applications in which temperature is
often not constant. Fluorescence guidance has been applied to thermotherapies such as
radiofrequency ablation [2] and has potential for guidance in emerging thermotherapies
such as microwave ablation. In addition, fluorescence techniques examining specimens
in vitro are carried out at a different temperature than a potential in vivo application.
Thus, temperature effects are important in experimental planning and predictions when
transitioning from in vitro to in vivo.
Fluorescence
Fluorescence occurs when a molecule in its ground state absorbs energy and is
excited to an electronically excited state. From there, the molecule undergoes vibrational
relaxation and/or internal conversion in which energy is generally emitted as heat. Then,
from the lowest vibrational level in an excited electronic state, the molecule returns to its
ground state by emitting a photon. Since the molecule has undergone a non-radiative
decay (heat generation), the emitted photon has less energy than the incident photon. This
is known as a Stokes shift. Thus, fluorescence is only present at longer wavelengths than
the excitation, or incident, light. A diagram of fluorescence in terms of energy levels is
displayed in Figure 1.1, known as a Jablonski diagram. As can be seen in the Jablonski
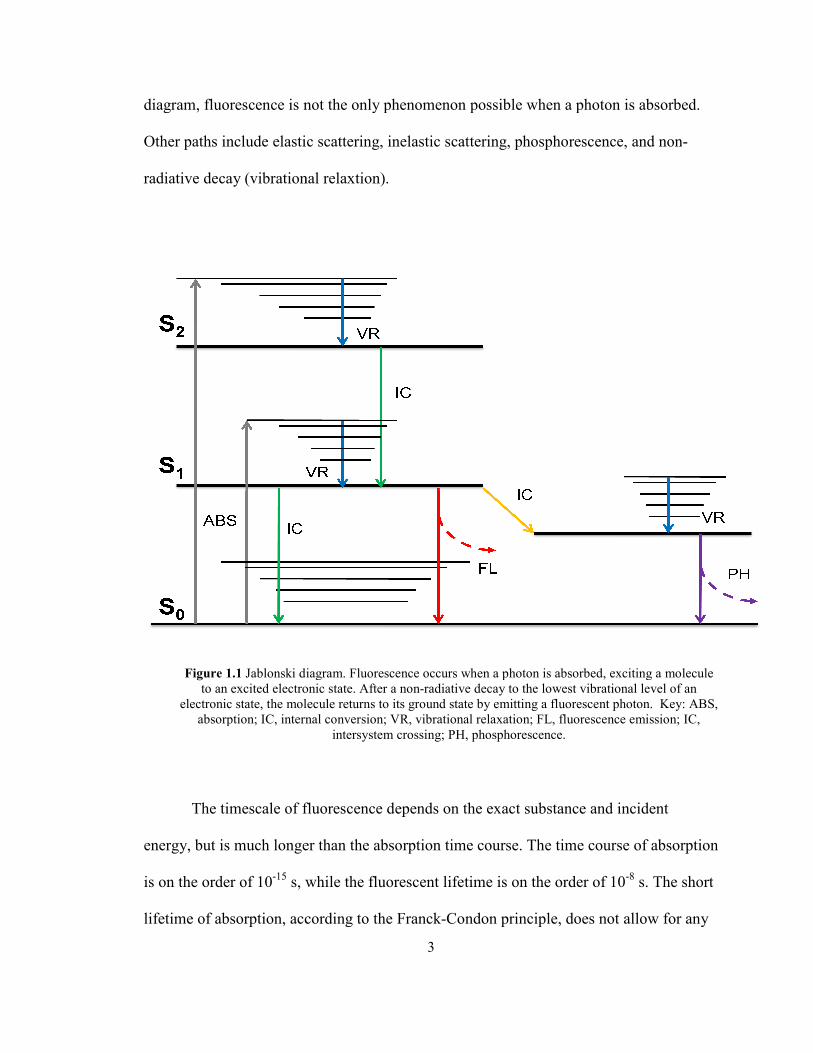
diagram, fluorescence is no
Other paths include elastic
radiative decay (vibrational
Figure 1.1 Jablonski dia
to an excited electron
electronic state, the molec
absorption; IC, interna
The timescale of flu
energy, but is much longer
is on the order of 10-15
s, w
lifetime of absorption, acco
3
e is not the only phenomenon possible when a photon
lastic scattering, inelastic scattering, phosphorescence
ational relaxtion).
ski diagram. Fluorescence occurs when a photon is absorbed, ex
ectronic state. After a non-radiative decay to the lowest vibratio
molecule returns to its ground state by emitting a fluorescent p
internal conversion; VR, vibrational relaxation; FL, fluorescenc
intersystem crossing; PH, phosphorescence.
of fluorescence depends on the exact substance and i
onger than the absorption time course. The time cours
, while the fluorescent lifetime is on the order of 10
n, according to the Franck-Condon principle, does not
hoton is absorbed.
scence, and non-
ed, exciting a molecule
ibrational level of an
cent photon. Key: ABS,
escence emission; IC,
e and incident
course of absorption
r of 10-8
s. The short
es not allow for any
4
molecular interactions during the process, while the longer relative lifetime of
fluorescence emission allows for a variety of other interactions [3].
Fluorescence Quenching
Fluorescence quenching refers to any process that decreases the intensity of
emitted fluorescent light. The most common form of quenching in fluorescence is
collisional quenching. This occurs when a certain molecule, or quencher, comes into
contact with the fluorophore in its excited state. This collision results in a non-radiative
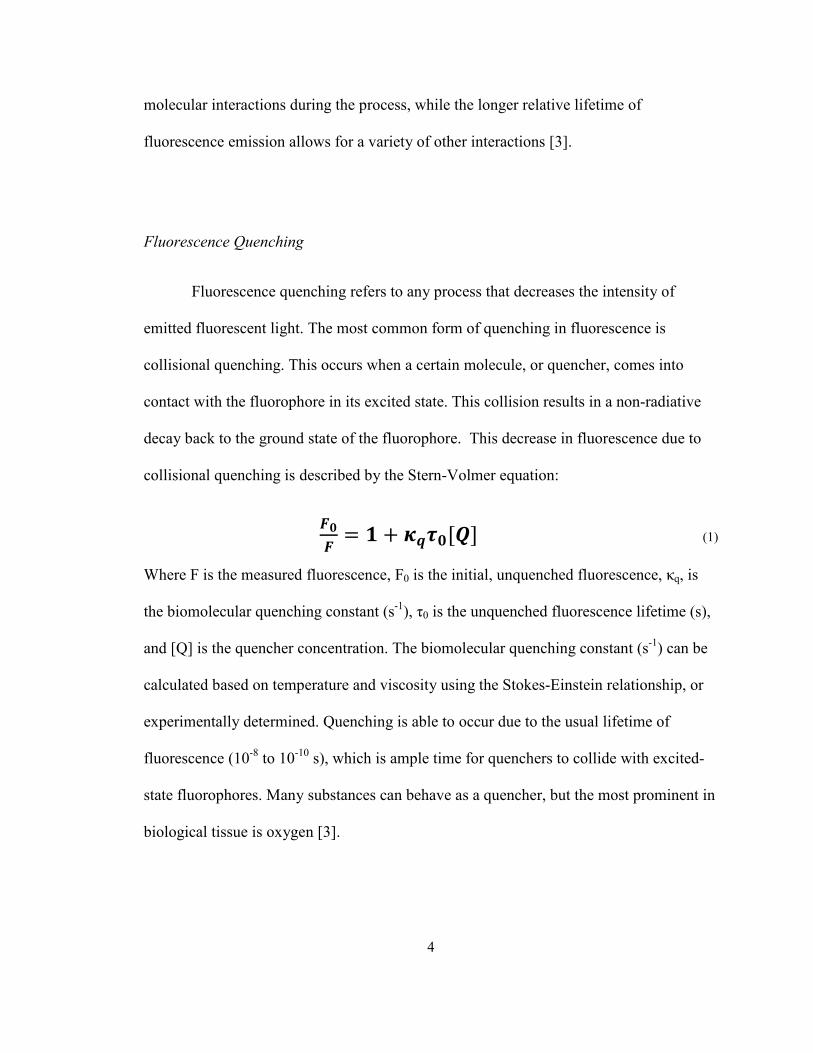
decay back to the ground state of the fluorophore. This decrease in fluorescence due to
collisional quenching is described by the Stern-Volmer equation:
= + [] (1)
Where F is the measured fluorescence, F0 is the initial, unquenched fluorescence, κq, is
the biomolecular quenching constant (s-1
), τ0 is the unquenched fluorescence lifetime (s),
and [Q] is the quencher concentration. The biomolecular quenching constant (s-1
) can be
calculated based on temperature and viscosity using the Stokes-Einstein relationship, or
experimentally determined. Quenching is able to occur due to the usual lifetime of
fluorescence (10-8
to 10-10
s), which is ample time for quenchers to collide with excited-
state fluorophores. Many substances can behave as a quencher, but the most prominent in
biological tissue is oxygen [3].

5
Optical Properties
When light interacts with tissue, a variety of events can occur. It is useful to
define light as a particle, or photon, for most tissue optics applications. When a photon is
incident upon a piece of tissue it can reflect off the surface, known as specular
reflectance, or enter into the tissue. Whether a photon is specularly reflected or enters into
the tissue is governed by Fresnel’s laws, which depend on the incident angle, incident
index of refraction, tissue index of refraction, and the polarization state of the incident
light. If the photon enters the tissue, it can be absorbed, elastically scattered, inelastically
scattered, or transmitted.
Due to the relatively complex molecular nature of tissue, these events are best
understood on a probabilistic and empirical level. The probability of a photon being
absorbed while traveling over an infinitesimal distance, dz (cm), is described by the
product of the absorption coefficient, µa (cm-1
), and the distance, dz (cm). The absorption
coefficient is related to light irradiance in a non-scattering medium through Beer’s Law:
= (2)
Where E0 is the incident irradiance (W/m2), µa is the wavelength dependent absorption
coefficient (cm-1
), z is the depth in the medium (cm), and E(z) is the irradiance at that
depth (W/m2). Similarly, the probability of a photon being scattered while traveling over
an infinitesimal distance, dz (cm), is described by the product of the scattering
coefficient, µs (cm-1
), and the distance, dz (cm). The angle at which the scattering occurs
is described by the anisotropy factor, g. The anisotropy represents the average cosine of

6
the scattering angle, where -1 represents total backscattering, 0 represents isotropic
scattering, and 1 represents total forward scattering. Tissue is highly forward scattering,
with g values between 0.7-0.99. The anisotropy and scattering coefficient can be
described by a single term known as the reduced scattering coefficient, and is defined as:
= 1 − (3)
This is often used if the exact values of and g are coupled, and their individual values
are not known.
Methods to Determine Optical Properties
Although several methods exist to determine µa, µs, and g in tissue, two methods
are particularly relevant to the work described here. A popular method includes the use of
two integrating spheres and an inverse-adding doubling algorithm (I.A.D.).
[4]
Figure 1.2 Double integrating sphere diagram. The sample is placed in between the two spheres, and
collimated light enters through a port in the first sphere and exits the port in the second sphere. Portions of
the light are reflected from the sample and gather by the first detector. Light that is transmitted through the
sample and scattered is detected by the second detector.

7
A complete description of the double integrating sphere method can be found in a paper
by Pickering et al. [4]. In short, the sample for which the optical properties are to be
determined is placed between two integrating spheres, the insides of which have a highly
diffuse and reflective coating. Collimated and monochromatic light enters the spheres
through a port in the first integrating sphere. Then, reflected and transmitted light is
measured by detectors in separate ports in each of the two spheres. Two detectors will
allow for the calculation of two optical properties, µa and µs’. Measurements are
wavelength dependent, and must be separately determined for each wavelength of
incident light. This method is also sensitive to light lost through the sides of the sample,
so an optically thin sample produces the most accurate results. In addition, the coating of
the spheres is not perfectly reflective, usually on the order of 99%, and must be corrected
for in the final calculations.
Detectors are calibrated with no sample present to determine baseline levels (0%)
of light present. Maximum reflectance values are measured by placing a reflective
standard (R=100%), similar to the sphere’s coating in the place of the sample and
measuring the value in the first detector. Maximum transmittance is measured by placing
the reflective standard (R=100%) at the exit port of the second sphere with no sample in
between the two spheres. When the sample is placed between the spheres, the intensities
are measured for each detector, and normalized as a percent based on the 0% and 100%
measurements. The final result yields a percent transmission (%T), percent reflectance
(%R), and possibly an unscattered percent transmission. These values, along with the
thickness of the sample, serve as an input into an inverse-adding doubling algorithm.

8
The inverse-adding doubling algorithm is described in complete detail by Prahl et
al. [5]. This method uses the adding-doubling method, which juxtaposes two identical
slabs of given optical properties with known reflectance (R) and transmittance (T). The R
and T values are added to obtain the reflectance and transmittance of the new slab, which
is twice as thick. The R and T values of the initial, thin slab, are calculated using single
scattering and Fresnel’s laws. This process is repeated until the thickness of the slab is
equivalent to the desired thickness. Thus, the adding-doubling method receives the
tissue’s optical properties and thickness, and yields the reflectance and transmittance of
the incident light.
In short, the inverse adding-doubling algorithm guesses a set of optical properties
and generates reflectance and transmission values from these using the adding-doubling
method. If µa, µs, and g are desired, the unscattered transmission from the integrating
spheres must be supplied in addition to the diffuse reflectance and transmittance values.
If only diffuse reflectance and transmittance values are given, the inverse adding-
doubling method yields µa and µs’. The calculated reflectance (R) and transmittance (T)
values are compared to those measured in the integrating spheres, and the process is
repeated until it converges to a unique solution for µa and µs’. If the scattering
anisotropy, g, is known, or the unscattered transmission is measured, a unique solution
exists using this method. In order to achieve accurate results, corrections must be made
for integrating sphere imperfections and the presence of glass slides. This method works
for almost any combination of optical properties, but is not guaranteed to converge. For
instance, the sample measured in the integrating spheres should be optically thin enough
9
to get a transmission measurement that is sufficiently greater than the noise of the
detectors.
Once the optical properties have been obtained, a probabilistic method such as
Monte Carlo simulation can be used to predict the propagation of light in tissue. Monte
Carlo uses a random walk method to trace the path of single photons in tissue. The
optical properties of the tissue are used to create probability distributions of what happens
to a photon at each point in the tissue. At any given point, a photon can pass through the
point with no interaction, undergo a scattering event, or be absorbed. The tissue is
organized into discrete grids, and a photon is launched into the tissue. The path of the
photon through each point and its termination point (i.e. where it is absorbed) are
recorded. Large numbers of photons are launched and recorded in this manner, usually on
the order of 108 photons. A sufficient number of photons yields information about how
light is reflected and transmitted within the tissue. Monte Carlo is advantageous, since it
works for any combination of optical properties, and can handle multiple layers with
different optical properties. Monte Carlo also assumes homogenous optical properties
within the layers. The disadvantage is that it can require long computation times to
generate enough photons for statistical certainty. This is generally not a problem with
modern computing capabilities.
In order to apply the I.A.D. method to obtain the tissue optical properties, both
reflectance and transmittance must be available to generate optical properties.
Transmittance measurements are not always available if the sample is too thick or if only
reflectance data is measured. The latter is often the case in probe-based fluorescence
10
measurements, where only reflectance measurements are available. In this case, the
inverse-adding doubling method may not be used due to the lack of transmission
measurements. However, an inverse Monte Carlo can be used to calculate the optical
properties based on a diffuse reflectance measurement. This consists of guessing a set of
optical properties, running a Monte Carlo simulation, and comparing the results to the
measured diffuse reflectance spectrum. This is continued until the generated diffuse
reflectance matches the measured diffuse reflectance. The optical properties used to
produce the final reflectance curve are provided as the optical properties of the tissue.
The accuracy of this method depends heavily on the initial guess, as the final calculated
optical properties are not unique. Thus, an educated guess of the initial optical properties
is essential for an accurate result. This method has been applied in tissue and is described
in detail by Palmer et al. [6, 7].
Effect of Optical Properties on Fluorescence
Fluorescence emission intensity is primarily a function of the concentration of a
certain fluorophore, the excitation wavelength, and the emission wavelength. In turbid
media, however, absorption and scattering modulate the fluorescence emission intensity.
This presents a problem for the use of fluorescence for diagnosis and therapeutic
guidance in tissue due to strong absorbers such as blood. The presence of scatterers and
absorbers can modulate fluorescent output for identical tissues, thus hindering the
reproducibility and reliability of fluorescence spectroscopy as a diagnostic tool. The
elimination of optical property modulation of fluorescence yields a fluorescence spectrum
11
that is solely a result of the intrinsic fluorophores and their concentrations, known as
intrinsic fluorescence. Two methods to extract instric fluorescence, which are applicable
in tissue in the UV-visible range, are discussed.
Gardner et al. developed an algorithm for extracting the intrinsic fluorescence
from tissue phantoms based on fluorescence measurements and known optical properties
[8]. This method was able to determine fluorophore concentration to within 15% in a
tissue phantom. Zhang et al. also developed an algorithm for the extraction of intrinsic
fluorescence, but their method did not require the prior knowledge of optical properties.
Instead, it required the assumption that fluorescence and reflectance would be modulated
similarly by optical properties, which is accurate if diffuse reflectance and fluorescence
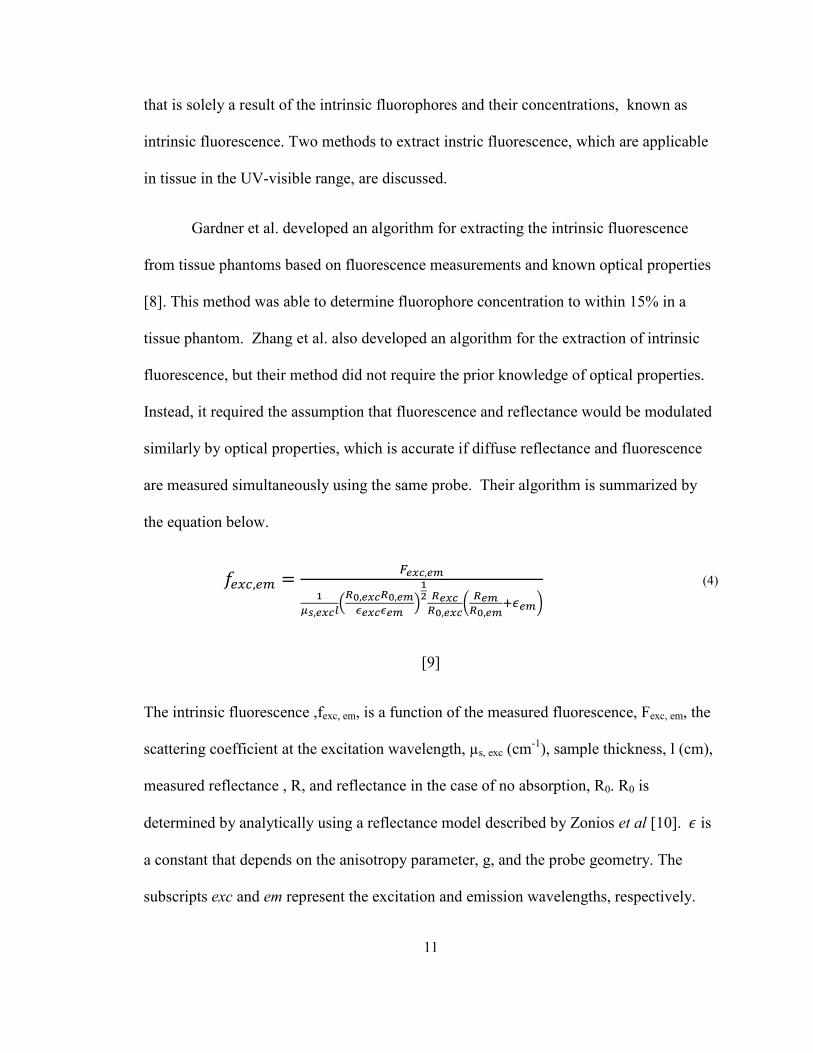
are measured simultaneously using the same probe. Their algorithm is summarized by
the equation below.
," = #$%&,$'(
)*,$%&+,-.,$%&-.,$'
/$%&/$' 0(1 -$%&
-.,$%&2 -$'-.,$'34$'5
(4)
[9]
The intrinsic fluorescence ,fexc, em, is a function of the measured fluorescence, Fexc, em, the
scattering coefficient at the excitation wavelength, µs, exc (cm-1
), sample thickness, l (cm),
measured reflectance , R, and reflectance in the case of no absorption, R0. R0 is
determined by analytically using a reflectance model described by Zonios et al [10]. 7 is
a constant that depends on the anisotropy parameter, g, and the probe geometry. The
subscripts exc and em represent the excitation and emission wavelengths, respectively.
12
Equation 3 shows the obvious dependence on scattering due to the µs term in the
denominator, but the reflectance terms (Rem, Rexc) represent a combined effect of both
scattering and absorption on intrinsic fluorescence. This method is not accurate in the
case of excess absorption, in which the intrinsic fluorescence is masked by absorption
beyond the point of recovery.
Effect of Heat on Optical Properties
Optical properties exhibit a known dependence due to thermal damage and
coagulation. The deposition of laser energy in tissue generally results in heating of the
tissue. This can result in vasodilation, which allows blood to act as a heat sink. If a large
enough amount of thermal energy is deposited or it is deposited over a very short time,
the heat can cause damage to the tissue, coagulation of the blood, dehydration,
denaturation, conformational changes, or any combination of these. Changes in scattering
and absorption are mediated by these different types of thermal damage [1, 4, 11, 12].
These changes are mostly irreversible, but show some reversible characteristics [12].
These studies, like most examining optical property changes due to thermal effects,
focused on coagulation and dehydration caused by an ablative laser. These parameters are
important for the effectiveness of laser ablation, but are mostly drastic, irreversible
changes.
Optical properties have been shown to be temperature dependent over a
physiological temperature range in the near-infrared region [13, 14] in certain types of
tissue. The effect of temperature on optical properties is less defined in the UV-visible
13
region, and has not been examined simultaneously with fluorescence. Optical properties
and their thermal dependencies are expected to vary from the near-infrared to the UV,
and expected to vary across different types of tissue, such as skin and fat. If optical
properties are temperature dependent in the UV-visible range, their temperature
dependency could be used to manipulate fluorescence in tissue or measure temperature
changes. It would also have important practical consequences for extracting intrinsic
fluorescence from tissues in vitro and in vivo.
Other Thermal Considerations
Thermal energy can affect the fluorophore itself. Certain proteins, such as
collagen, are important biological fluorophores. Proteins undergo denaturation and
conformational changes at temperatures above body temperature (37°C), and these
conformational changes can cause a change in fluorescence. Menter et al. considered the
change in collagen conformation due to temperature, as well as its eventual denaturation,
as a major factor in the change in fluorescence due to temperature [15]. Lipids also
undergo documented phase changes that affect optical properties and fluorescence at
temperatures above body temperature [14].

14
Preliminary Experiments: “Effect of Temperature on Fluorescence: An Animal
Study.”
In order to examine the effects of temperature on fluorescence, experiments on
animal tissue were performed. Porcine eyes, porcine cornea, and rat skin were all used in
these experiments. The first goal was to characterize the relationship between
fluorescence intensity and temperature in biological tissue in vitro. The second goal was
to determine if a change in optical properties was the only mechanism causing a
temperature dependent change in fluorescence intensity. Fluorescence and diffuse
reflectance measurements were made with varying temperature of 5 porcine eyes, 6
porcine corneas, and 5 rat skin samples. Changes in fluorescence intensity, emission peak
location, and overall fluorescence lineshape were examined. Diffuse reflectance was also
examined at every temperature to assess any changes in optical properties. Optical
property measurements were also made before and after each experimental run using a
spectrophotometer to obtain information about the starting and end points of the tissue.
Materials and Methods
A spectroscopic system was used to make fluorescence and diffuse reflectance
measurements. The probe-based system uses a 337 nm nitrogen laser for fluorescence
excitation (VSL 337, High Pressure Nitrogen Dye Laser; Oriel Corporation, Stratford,
Connecticut) pulsed at 20 Hz and a white light source (150 W halogen lamp; Fiber Lite,
Model180; Edmund Industrial Optics, Barrington, New Jersey) for reflectance
measurements. A fiber optic probe was used for light delivery and collection. The probe

15
consists of seven 300 µm diameter fibers in a six around one configuration. Illumination
was delivered by two fibers at the 6 o’clock and 12 o’clock positions on the outer ring,
while the other five were devoted to light collection. A 385 nm long-pass filter was
placed in the spectrometer to filter out the excitation light of the nitrogen laser. Input
from a thermal camera (FLIR A20, FLIR Systems Inc., Boston, Massachusetts) was
incorporated into the spectroscopic system through an analog to digital converter (A/DC)
used to measure the surface temperature of the sample. The temperature of the samples
submerged in PBS could not be measured directly with the thermal camera, but were
assumed to be in thermal equilibrium with the surrounding liquid due to their relatively
small volume. A LabVIEW program developed in house was used to control the system
and acquire both spectroscopic and thermal data during all experiments. A diagram of the
experimental setup is given in Figure 1.3.
16
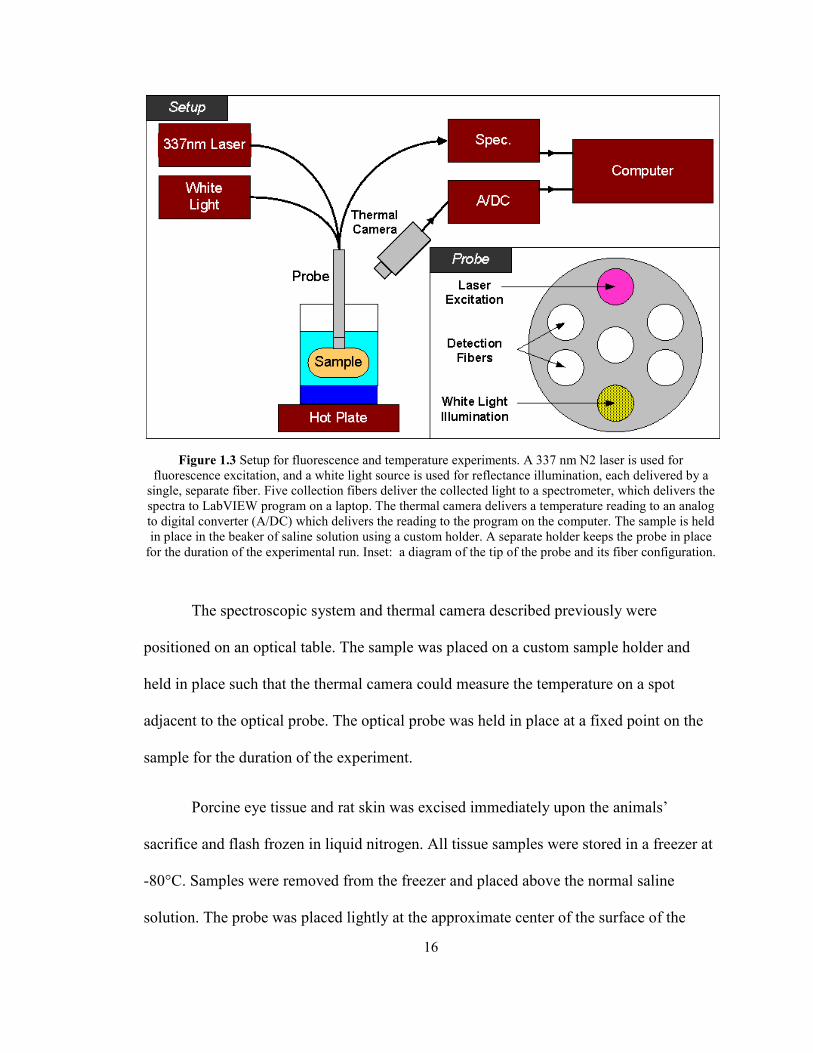
Figure 1.3 Setup for fluorescence and temperature experiments. A 337 nm N2 laser is used for
fluorescence excitation, and a white light source is used for reflectance illumination, each delivered by a
single, separate fiber. Five collection fibers deliver the collected light to a spectrometer, which delivers the
spectra to LabVIEW program on a laptop. The thermal camera delivers a temperature reading to an analog
to digital converter (A/DC) which delivers the reading to the program on the computer. The sample is held
in place in the beaker of saline solution using a custom holder. A separate holder keeps the probe in place
for the duration of the experimental run. Inset: a diagram of the tip of the probe and its fiber configuration.
The spectroscopic system and thermal camera described previously were
positioned on an optical table. The sample was placed on a custom sample holder and
held in place such that the thermal camera could measure the temperature on a spot
adjacent to the optical probe. The optical probe was held in place at a fixed point on the
sample for the duration of the experiment.
Porcine eye tissue and rat skin was excised immediately upon the animals’
sacrifice and flash frozen in liquid nitrogen. All tissue samples were stored in a freezer at
-80°C. Samples were removed from the freezer and placed above the normal saline
solution. The probe was placed lightly at the approximate center of the surface of the

17
sample, and locked into place for the remainder of the experiment. For excised porcine
eyes, the probe was placed at the center of the cornea’s exterior. A spot was chosen for
the thermal camera recordings such that the point was as close to the probe as possible
without encompassing the probe’s image. Spectroscopic measurements were made as
soon as the probe and thermal recording spot were set, usually beginning at about -20°C.
Each measurement acquired the temperature at that point, a baseline spectrum, a
reflectance spectrum, and a fluorescence spectrum. The temperature was allowed to
increase by no more than 5°C, and another measurement was taken. This process
continued until the sample passively heated to room temperature (23°C), which was equal
to the temperature of the normal saline below the sample. Additional saline at room
temperature was added until the sample was submerged. The PBS temperature in the
beaker was confirmed to be at room temperature before and after sample submersion
using the thermal camera before proceeding. Neither the probe nor the sample was moved
in this process. The normal saline solution with the submerged sample was then actively
heated using a hot plate to approximately 50°C or greater than 70°C. Measurements were
taken at approximately 5°C intervals while heating. Once the sample reached the target
temperature, the hot plate was turned off and the sample was allowed to passively cool to
room temperature and measurements were made at 5°C intervals as it passively cooled.
Results
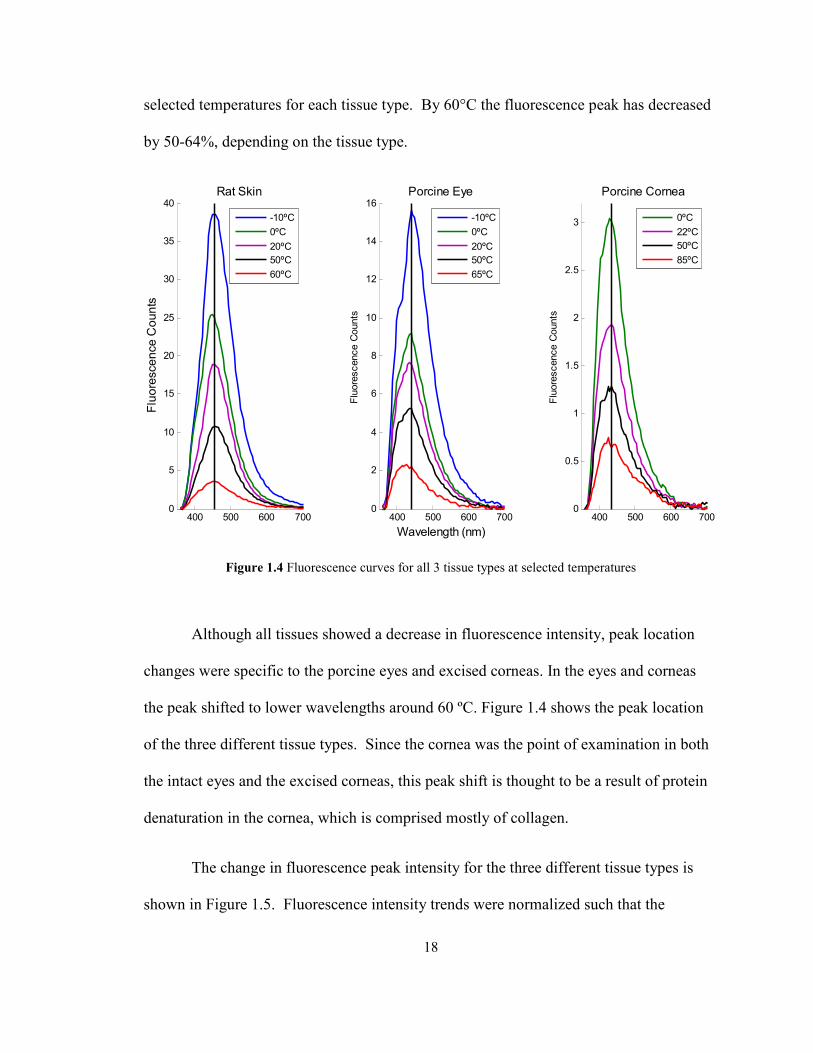
The results indicate that fluorescence intensity decreases with increasing
temperature for all three tissue sample types. Figure 1.4 displays fluorescence curves at
18
selected temperatures for each tissue type. By 60°C the fluorescence peak has decreased
by 50-64%, depending on the tissue type.
Figure 1.4 Fluorescence curves for all 3 tissue types at selected temperatures
Although all tissues showed a decrease in fluorescence intensity, peak location
changes were specific to the porcine eyes and excised corneas. In the eyes and corneas
the peak shifted to lower wavelengths around 60 ºC. Figure 1.4 shows the peak location
of the three different tissue types. Since the cornea was the point of examination in both
the intact eyes and the excised corneas, this peak shift is thought to be a result of protein
denaturation in the cornea, which is comprised mostly of collagen.
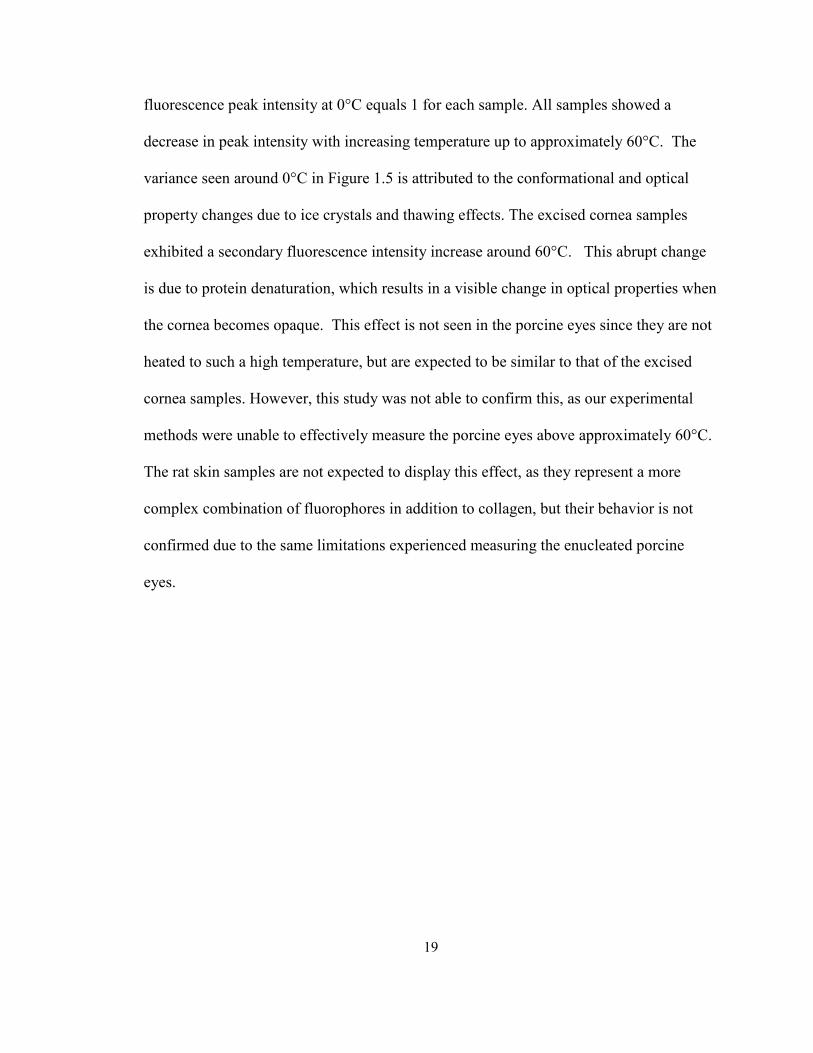
The change in fluorescence peak intensity for the three different tissue types is
shown in Figure 1.5. Fluorescence intensity trends were normalized such that the
400 500 600 7000
2
4
6
8
10
12
14
16
Wavelength (nm)
Fluorescence Counts
Porcine Eye
-10ºC
0ºC
20ºC
50ºC
65ºC
400 500 600 7000
5
10
15
20
25
30
35
40
Fluorescence Counts
Rat Skin
-10ºC
0ºC
20ºC
50ºC
60ºC
400 500 600 7000
0.5
1
1.5
2
2.5
3
Fluorescence Counts
Porcine Cornea
0ºC
22ºC
50ºC
85ºC
19
fluorescence peak intensity at 0°C equals 1 for each sample. All samples showed a
decrease in peak intensity with increasing temperature up to approximately 60°C. The
variance seen around 0°C in Figure 1.5 is attributed to the conformational and optical
property changes due to ice crystals and thawing effects. The excised cornea samples
exhibited a secondary fluorescence intensity increase around 60°C. This abrupt change
is due to protein denaturation, which results in a visible change in optical properties when
the cornea becomes opaque. This effect is not seen in the porcine eyes since they are not
heated to such a high temperature, but are expected to be similar to that of the excised
cornea samples. However, this study was not able to confirm this, as our experimental
methods were unable to effectively measure the porcine eyes above approximately 60°C.
The rat skin samples are not expected to display this effect, as they represent a more
complex combination of fluorophores in addition to collagen, but their behavior is not
confirmed due to the same limitations experienced measuring the enucleated porcine
eyes.
20
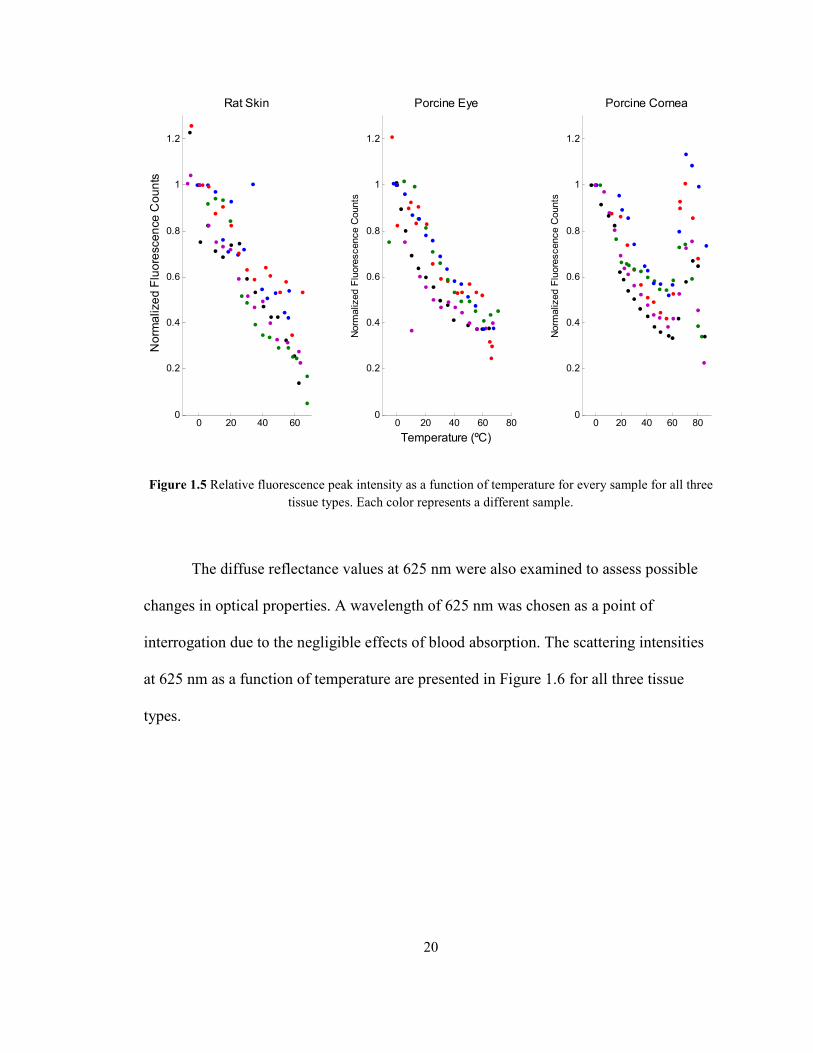
Figure 1.5 Relative fluorescence peak intensity as a function of temperature for every sample for all three
tissue types. Each color represents a different sample.
The diffuse reflectance values at 625 nm were also examined to assess possible
changes in optical properties. A wavelength of 625 nm was chosen as a point of
interrogation due to the negligible effects of blood absorption. The scattering intensities
at 625 nm as a function of temperature are presented in Figure 1.6 for all three tissue
types.
0 20 40 600
0.2
0.4
0.6
0.8
1
1.2
Rat Skin
Norm
alized Fluorescence C
ounts
0 20 40 60 800
0.2
0.4
0.6
0.8
1
1.2
Porcine Eye
Temperature (ºC)
Norm
alized Fluorescence Counts
0 20 40 60 800
0.2
0.4
0.6
0.8
1
1.2
Porcine Cornea
Norm
alized Fluorescence Counts
21
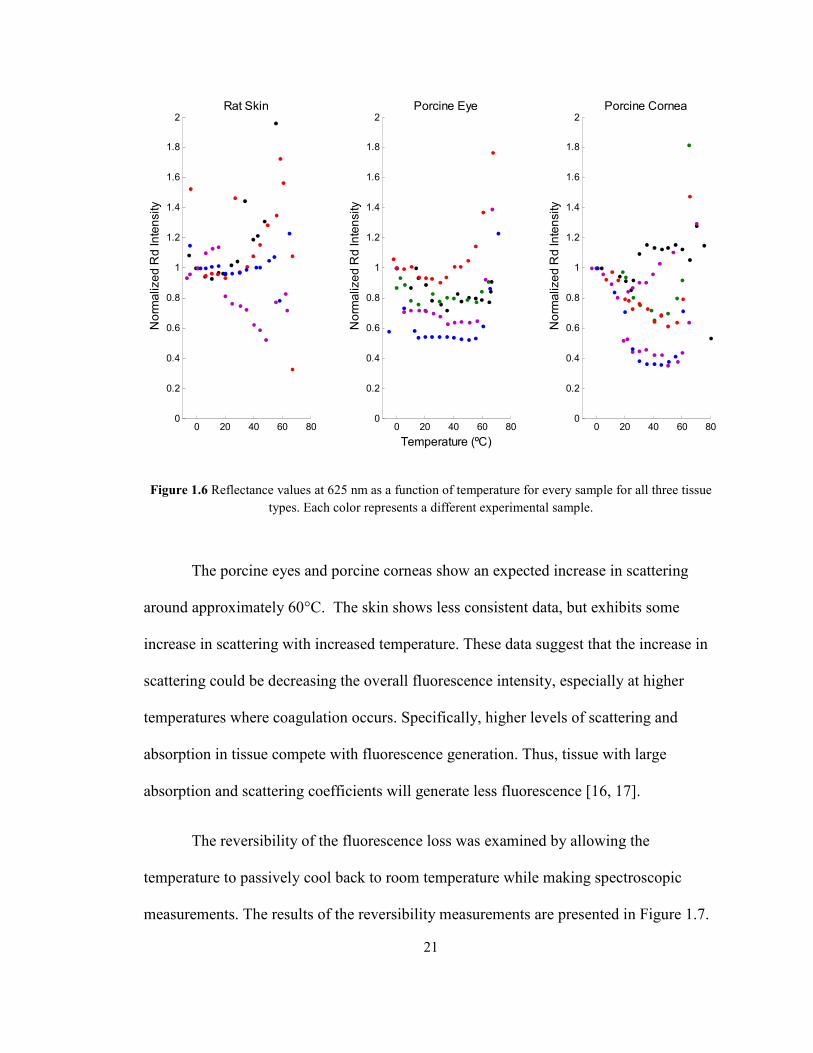
Figure 1.6 Reflectance values at 625 nm as a function of temperature for every sample for all three tissue
types. Each color represents a different experimental sample.
The porcine eyes and porcine corneas show an expected increase in scattering
around approximately 60°C. The skin shows less consistent data, but exhibits some
increase in scattering with increased temperature. These data suggest that the increase in
scattering could be decreasing the overall fluorescence intensity, especially at higher
temperatures where coagulation occurs. Specifically, higher levels of scattering and
absorption in tissue compete with fluorescence generation. Thus, tissue with large
absorption and scattering coefficients will generate less fluorescence [16, 17].
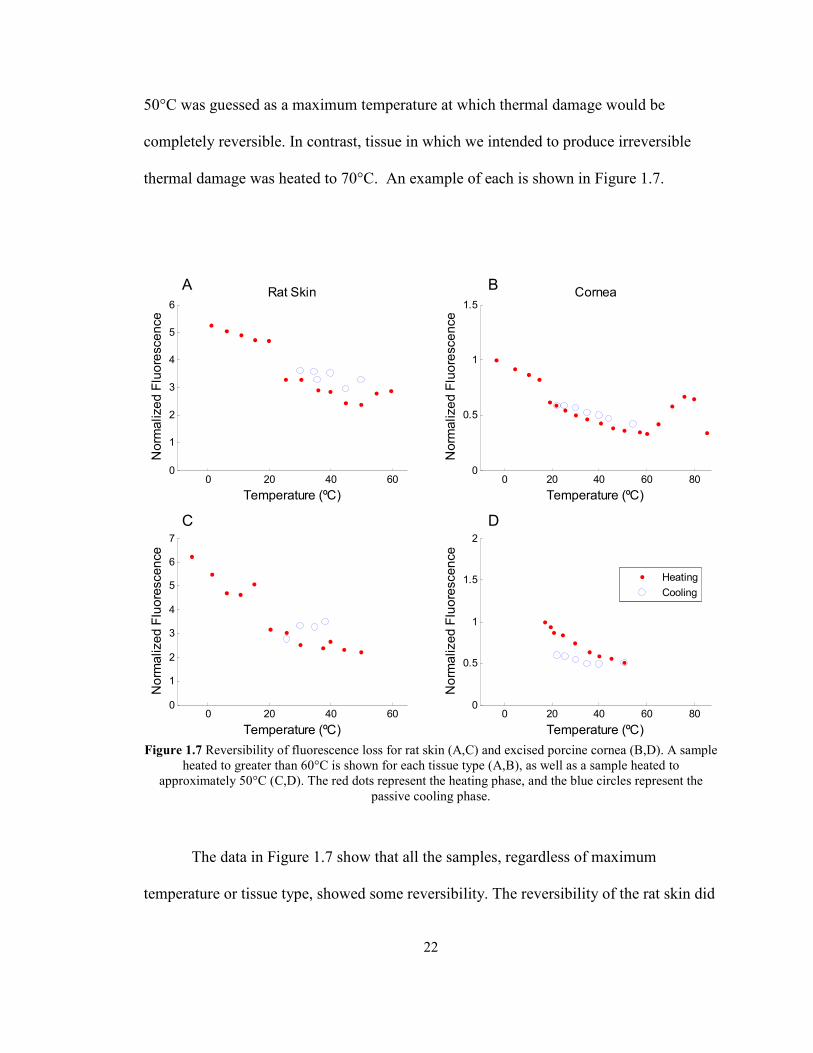
The reversibility of the fluorescence loss was examined by allowing the
temperature to passively cool back to room temperature while making spectroscopic
measurements. The results of the reversibility measurements are presented in Figure 1.7.
0 20 40 60 800
0.2
0.4
0.6
0.8
1
1.2
1.4
1.6
1.8
2Rat Skin
Norm
alized R
d Intensity
0 20 40 60 800
0.2
0.4
0.6
0.8
1
1.2
1.4
1.6
1.8
2Porcine Eye
Temperature (ºC)
Norm
alized R
d Intensity
0 20 40 60 800
0.2
0.4
0.6
0.8
1
1.2
1.4
1.6
1.8
2Porcine Cornea
Norm
alized R
d Intensity
22
50°C was guessed as a maximum temperature at which thermal damage would be
completely reversible. In contrast, tissue in which we intended to produce irreversible
thermal damage was heated to 70°C. An example of each is shown in Figure 1.7.
Figure 1.7 Reversibility of fluorescence loss for rat skin (A,C) and excised porcine cornea (B,D). A sample
heated to greater than 60°C is shown for each tissue type (A,B), as well as a sample heated to
approximately 50°C (C,D). The red dots represent the heating phase, and the blue circles represent the
passive cooling phase.
The data in Figure 1.7 show that all the samples, regardless of maximum
temperature or tissue type, showed some reversibility. The reversibility of the rat skin did
0 20 40 600
1
2
3
4
5
6Rat Skin
Temperature (ºC)
Norm
alized Fluorescence
0 20 40 600
1
2
3
4
5
6
7
Temperature (ºC)
Norm
alized Fluorescence
0 20 40 60 800
0.5
1
1.5Cornea
Temperature (ºC)
Norm
alized Fluorescence
0 20 40 60 800
0.5
1
1.5
2
Temperature (ºC)
Norm
alized Fluorescence
Heating
Cooling
A B
DC

23
not show substantial differences between maximum temperatures of 60°C and less than
50°C. The rat skin samples showed mostly reversible fluorescence loss in both situations.
The cornea behaved similarly to the rat skin. The cornea heated to 50°C and the cornea
heated above 80°C both showed some level of reversibility. In this instance, the cornea
heated above 80°C actually showed more reversibility than the sample heated to 50°C,
contrary to our expectations.
Discussion
The expected decrease of fluorescence with increasing temperatures was observed
in every animal tissue sample tested in vitro. In order to characterize these changes, peak
location, scattering, and reversibility were also observed. The intent of these analyses
was to determine what mechanisms might be responsible for the fluorescence increase.
The examination of peak intensity served to confirm the inverse relationship between
temperature and fluorescence in tissue. The examination of peak location as a function of
temperature was necessary to see if any changes in the fluorophore or conformational
changes were contributing to a change in fluorescence. The extraction of diffuse
reflectance values was intended to yield information on scattering in the tissue, and thus
implicate any changes in optical properties that may contribute to fluorescence changes.
Finally, the reversibility was examined to see if permanent thermal damage was
contributing to the decrease in measured fluorescence intensity, and to see if it was
possible to create a completely reversible fluorescence decrease.
24
Although most of the results and analyses are straightforward, the use of diffuse
reflectance to make inferences about optical properties requires further consideration.
Diffuse reflectance can be used to determine optical properties, but is not a pure measure
of optical properties. The diffuse reflectance spectra yield information about the
scattering and absorption properties that are coupled. The mixture of these two optical
properties is impossible to separate without making assumptions or using complex
analytical methods. The raw reflectance information, however, can be useful if analyzed
carefully. For instance, this study examined diffuse reflectance at 625nm, a region in
which most of the absorption in tissue (due primarily to blood at 420 nm, 540 nm, and
580 nm) is not present. In the case of the cornea, where no blood is present, 625 nm was
chosen to be consistent with the skin and enucleated eyes. Thus, we are able to assume
that the scattering contributes to the majority of the information provided in that region of
the diffuse reflectance spectrum.
In order to understand how optical properties affect fluorescence, optical
properties must be understood at the excitation wavelength (337 nm) and emission
wavelength of interest. The reflectance at 625 nm provides information about the overall
scattering in the sample, but the exact modulation of fluorescence by optical properties
would require information from both the peak location wavelength and excitation
wavelength. Diffuse reflectance from the fluorescence peak location is available from the
data in this study, but no data is available at the excitation wavelength due to the 385 nm
longpass filter in the spectrometer.

25
The reversibility trends do not show the expected results. Our hypothesis was that
the fluorescence loss would be irreversible beyond 50°C, or at least expected to be
irreversible beyond 70°C. However, the discrepancy between expectations and results
may be due to the fact that thermal effects in tissue rely on both temperature and time.
Thermal damage in tissue has been described using an Arrhenius damage model. This
model uses the Arrhenius integral to quantify thermal damage as a function of
temperature and time. Using this method, thermal damage is described using the
following equation:
Ω 9 = : ; <= > ?@A BC DEF
(5)
Where Ω is the degree of thermal damage, A is a frequency factor (s-1
), τ is the total
heating time (s), Ea is the activation energy barrier, R is the universal gas constant, and T
is the absolute temperature (°K). Values for A and Ea must be empirically determined
[18]. Since we heated the tissue in such a way that the temperature was always
increasing, there was very little time spent at a constant temperature. Thus, temperature
alone was examined as an independent variable in these experiments.
Conclusion
These experiments have shown that fluorescence intensity is inversely related to
temperature in animal tissue in vitro. In the porcine cornea, whether in an intact eye or
excised, a peak location change is seen due to increasing temperature, suggesting a
change in the primary fluorophore conformation of these tissues. In this study, the
26
respective contributions of optical properties and fluorophore denaturation are not
entirely clear, but they both contribute to the fluorescence decrease in some way as a
function of temperature, prompting further investigation. The loss in fluorescence was at
least partially reversible in all the tissue types examined up to maximum temperatures of
60-80°C. The fluorescence change in temperature ranges below denaturation
temperatures in which the diffuse reflectance values are roughly constant suggest that
other processes may be involved.
Hypothesis and Objectives
In order to more robustly understand the effects of temperature on fluorescence
spectroscopy, this study will examine the effects of temperature on fluorescence and
optical properties in human tissue both in vitro and in vivo. We hypothesize that the
inverse relationship between temperature and fluorescence intensity can be shown in
human tissue both in vivo and in vitro. We further hypothesize that the fluorescence loss
due to temperature is not caused solely by a change in optical properties due to
coagulation and dehydration.
The results of the preliminary study suggest that the fluorescence change due to
temperature is a combination of optical properties, fluorophore degradation, and a non-
radiative decay mechanism. In order to further investigate these possibilities, similar
experiments will be performed in human tissue in vitro, and additional experiments will
be performed in human tissue in vivo. The diffuse reflectance results of the previous
study also suggest that optical properties are temperature dependent, but the optical
27
properties are not extracted from the reflectance curves. This study will calculate the
absorption coefficient and reduced scattering coefficient from the reflectance curves to
explicitly examine the temperature dependence of optical properties and how they affect
fluorescence. Thus, there are 4 main objectives to this study. The first is to demonstrate
the inverse relationship between fluorescence intensity and temperature in vitro in two
different tissue types: skin and adipose tissue. The second objective is to show how the
optical properties change as a function of temperature and how these correlate to the
simultaneous changes in fluorescence. We also intend to examine the reversibility of the
fluorescence loss by taking spectroscopic measurements in both heating and cooling
stages. Variable maximum temperatures will also be used for the samples to see if a
threshold for reversibility is present. Finally, we will see if the fluorescence changes
observed in vitro can be reproduced in vivo.
The overall goal of this study is to understand how temperature affects
fluorescence both in vitro and in vivo. Once understood, this phenomenon could aid in the
use of fluorescence spectroscopy for guidance in thermotherapies such as radiofrequency
and microwave ablation. In addition, this phenomenon could possibly be manipulated to
yield better fluorescence signals if tissue temperature could be intentionally varied. From
a scientific standpoint, this study will also increase our knowledge of the mechanism
causing fluorescence changes due to temperature. Specifically, this study should
determine if fluorescence changes due to temperature are more sensitive to thermal
variation than coagulation induced optical property changes.

28
Bibliography
1. Kim, B., et al., Nonlinear finite-element analysis of the role of dynamic changes
in blood perfusion and optical properties in laser coagulation of tissue. Selected
Topics in Quantum Electronics, IEEE Journal of, 1996. 2(4): p. 922-933.
2. Buttemere, C.R., et al., In vivo assessment of thermal damage in the liver using
optical spectroscopy. Journal of Biomedical Optics, 2004. 9(5): p. 1018-1027.
3. Lakowicz, J.R. and B.R. Masters, Principles of Fluorescence Spectroscopy, Third
Edition. Journal of Biomedical Optics, 2008. 13(2): p. 029901-2.
4. Pickering, J.W., et al., Double-integrating-sphere system for measuring the
optical properties of tissue. Appl. Opt., 1993. 32(4): p. 399-410.
5. Prahl, S.A., M.J.C. van Gemert, and A.J. Welch, Determining the optical
properties of turbid media by using the adding-doubling method. Appl. Opt.,
1993. 32(4): p. 559-568.
6. Palmer, G.M. and N. Ramanujam, Monte Carlo-based inverse model for
calculating tissue optical properties. Part I: Theory and validation on synthetic
phantoms. Appl. Opt., 2006. 45(5): p. 1062-1071.
7. Palmer, G.M., et al., Monte Carlo-based inverse model for calculating tissue
optical properties. Part II: Application to breast cancer diagnosis. Appl. Opt.,
2006. 45(5): p. 1072-1078.
8. Gardner, C.M., S.L. Jacques, and A.J. Welch, Fluorescence spectroscopy of
tissue: recovery of intrinsic fluorescence from measured fluorescence. Appl. Opt.,
1996. 35(10): p. 1780-1792.
9. Zhang, Q., et al., Turbidity-free fluorescence spectroscopy of biological tissue.
Opt. Lett., 2000. 25(19): p. 1451-1453.
10. Zonios, G., et al., Diffuse Reflectance Spectroscopy of Human Adenomatous
Colon Polyps In Vivo. Appl. Opt., 1999. 38(31): p. 6628-6637.
11. Çilesiz, I.F. and A.J. Welch, Light dosimetry: effects of dehydration and thermal
damage on the optical properties of the human aorta. Appl. Opt., 1993. 32(4): p.
477-487.
12. Lin, W.-C., M. Motamedi, and A.J. Welch, Dynamics of tissue optics during laser
heating of turbid media. Appl. Opt., 1996. 35(19): p. 3413-3420.
29
13. Khalil, O.S., et al., Temperature modulation of the visible and near infrared
absorption and scattering coefficients of human skin. Journal of Biomedical
Optics, 2003. 8(2): p. 191-205.
14. Laufer, J., et al., Effect of temperature on the optical properties of ex vivo human
dermis and subdermis. Physics in Medicine and Biology, 1998. 43(9): p. 2479.
15. Menter, J.M., Temperature dependence of collagen fluorescence. Photochemical
& Photobiological Sciences, 2006. 5(4): p. 403-410.
16. Müller, M.G., et al., Intrinsic fluorescence spectroscopy in turbid media:
disentangling effects of scattering and absorption. Appl. Opt., 2001. 40(25): p.
4633-4646.
17. Wu, J., M.S. Feld, and R.P. Rava, Analytical model for extracting intrinsic
fluorescence in turbid media. Appl. Opt., 1993. 32(19): p. 3585-3595.
18. Lin, W.C., C. Buttemere, and A. Mahadevan-Jansen, Effect of thermal damage on
the in vitro optical and fluorescence characteristics of liver tissue's. IEEE Journal
of Selected Topics in Quantum Electronics, 2003. 9(2): p. 162-170.

30
CHAPTER II
VARIATION OF FLUORESCENCE WITH TEMPERATURE IN HUMAN TISSUE
Introduction
Fluorescence spectroscopy has been demonstrated in a variety of applications to
discriminate diseased tissue and provide therapeutic guidance [1-4]. Despite its
prevalence in biomedical research, the relationship between fluorescence and temperature
in tissue is not explicitly defined. In many instances, the temperature at which
fluorescence is measured in tissue is held constant, usually at body temperature in vivo or
room temperature in vitro. In contrast, there are instances in which temperature varies
greatly as a result of therapy or surgery, such as radio-frequency [5-7] or laser ablation
[8-10]. A thorough understanding of the effect of temperature on fluorescence in tissue is
required in order to consistently apply fluorescence techniques to these types of
procedures.
It has long been known that fluorescence varies with temperature in a variety of
substances. Bowen and Sahu showed that the fluorescence yield of some fluorescent
solutions varied inversely with temperature [11]. The fluorescence dependence on
temperature has been attributed to intersystem crossing, or temperature dependent
internal conversion, a process that competes with fluorescence to return excited
molecules back to their ground state [12]. Romano et al. used the temperature
31
dependence of fluorescence as a type of thermometry, using a fluorescent film to measure
temperature to within 1°C. In addition, they found that the film required heating above
55°C immediately before being used as a temperature sensor. They explained that the
initial, brittle state of the film was dominated by quenching similar to that seen in
crystals, but after heating to 55°C, the film transitioned to a softer state in which viscosity
quenching dominated. This resulted in a hysteretic fluorescence behavior in the film, with
its characteristics changing after being heated to 55°C [13]. Additional studies have
shown the inverse relationship between fluorescence intensity and temperature in non-
biological samples [14-17]. In tissue, a linear decrease in fluorescence intensity with
increasing temperature was found in retinal pigment epithelium, suggesting that
fluorescence could be used to detect the interior temperature of the eye [18]. This
relationship is sometimes described as a function of increased internal conversion and
decreased fluorescence lifetime at higher temperatures [19-21].
The effects of temperature on fluorescence depend on the material being observed
[22]. Although an inverse relationship between temperature and fluorescence intensity is
most common [19], this is not always the case. For example, laser induced fluorescence
in nitric oxide shows temperature dependence when quenched by H2O, but not when
quenched by O2 , presumably due to differences in long range attractive and repulsive
forces between the quencher and the fluorophore [23]. When fluorescence dependence
on temperature exists, the cause is not always clear [24, 25]. Due to the different possible
dependencies on temperature, each material must be individually examined. However,
examining human tissue further complicates the process, as it represents a complex
combination of many different molecules. Due to a variety of possible fluorescence

32
dependencies on temperature, the dependence of fluorescence on temperature in human
tissue must be experimentally determined.
In addition to temperature dependent changes in fluorescence quantum yield or
quenching, heating human tissue results in a change in optical properties, both reversible
and irreversible. Optical properties heavily influence the spatial distribution of
fluorescence excitation and emission in tissue. When a photon enters tissue, it can travel
through the tissue unaffected, be absorbed, or undergo one or more scattering events.
When a molecule absorbs a photon its electrons can be brought to an excited state and
decay back to the ground state. The absorption and decay process can yield a photon
(fluorescence) or may result in the conversion of potential energy into heat. If a photon is
absorbed and followed by internal conversion, or scattered, it does not generate
fluorescence. Thus, tissue with high absorption or scattering coefficients will generate
less fluorescence [26, 27]. The optical properties themselves (µa, µs’,n ) are altered by
changes in temperature [28, 29]. Fluorescence and diffuse reflectance spectroscopy has
been shown to detect changes in optical properties in tissue due to thermal damage in
vitro [28] and in vivo [29]. A recent study by Zaman et al. examined the fluorescence
dependence on temperature in rhodamine dye, enucleated porcine eyes, in vivo hamster
skin, and in vivo forearm skin up to 42°C. They found an inverse relationship between
fluorescence intensity and temperature in all cases. These findings were explained as a
degradation of the primary fluorophores and a disturbance of their natural states. Since
their study only examined temperatures up to 42°C, their analysis did not consider optical
property changes [30].

33
In a different study, we investigated the effects of temperature on fluorescence in
animal tissue in vitro. Enucleated porcine eyes, porcine cornea, and excised rat skin were
examined using fluorescence and diffuse reflectance over a temperature range of -20°C to
over 85°C. Generally, the inverse relationship between fluorescence intensity and
temperature was verified. Diffuse reflectance was also measured concurrently with
fluorescence to assess changes in optical properties. It was found that the diffuse
reflectance changed due to temperature variation, suggesting temperature dependent
changes (reversible and irreversible) in tissue optical properties. We also found that
fluorescence changed even when reflectance remained relatively constant. Also, the
fluorescent lineshape changed due to temperature increase in tissues composed mostly of
collagen, such as excised porcine cornea. The change in fluorescence was suggested to be
a combination of fluorophore denaturation and some other temperature dependent decay
mechanism competing with fluorescence [31].
A number of questions arose from this study concerning the mechanism of the
change in fluorescence due to temperature. Specifically, this study did not directly
examine the role of optical properties in the fluoresecence dependence on temperature.
Rather, inferences were indirectly made about optical properties from reflectance data.
The exact mechanism that mediates the change in fluorescence may include optical
property changes, which can occur due to coagulation. Coagulation or thermal damage
can also cause fluorophore degradation, possibly in the form of denaturation if the
fluorophore is a protein. Collisional quenching or other non-radiative decay mechanisms
are also possible. The combined presence of these mechanisms and their interaction in
tissue at physiological temperatures is yet to be determined. The goal of this study is to

34
observe the effect of temperature on fluorescence and optical properties in human tissue.
In vitro samples include human skin and adipose tissue. In vivo samples include human
skin from the lateral forearm. We demonstrate the overall decrease of fluorescence
intensity with temperature and examine optical property changes. In vitro temperatures
range from -20°C to greater than 70°C in order to capture any trends over a broad range.
In vivo experiments encompass a temperature range of 15°C to 40°C.
Materials and Methods
Instrumentation
A portable spectroscopic system was used to measure fluorescence and diffuse
reflectance from in vitro and in vivo samples. This system has been described in previous
publications [32-34]. The probe-based system uses a 337 nm nitrogen laser for
fluorescence excitation (VSL 337, High Pressure Nitrogen Dye Laser; Oriel Corporation,
Stratford, Connecticut) pulsed at 20 Hz and a white light source (150 W halogen lamp;
Fiber Lite, Model 180; Edmund Industrial Optics, Barrington, New Jersey) for diffuse
reflectance measurements. A fiber optic probe was used for light delivery and collection.
The probe consists of seven 300 µm diameter, fibers in a six around one configuration.
White light illumination was delivered by one fiber at the 6 o’clock position on the outer
ring, and laser excitation was delivered by one fiber at the 12 o’clock position on the
outer ring. The other five fibers were devoted to light collection. A 385 nm long-pass
35
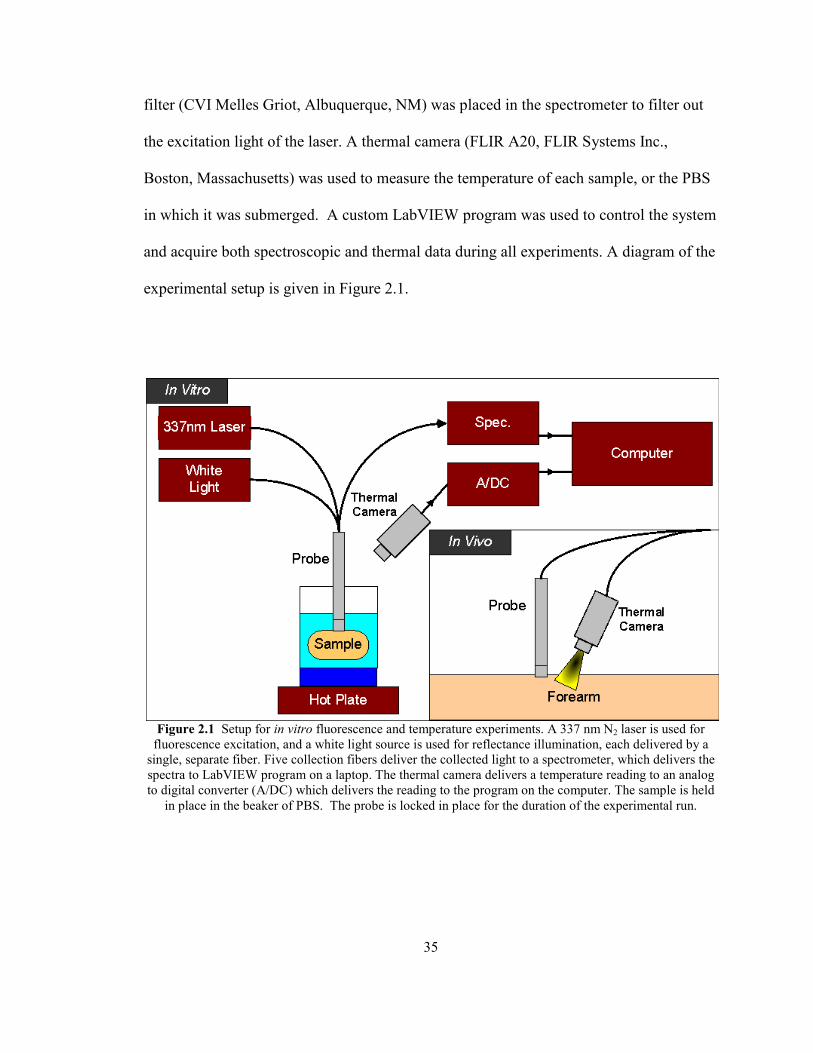
filter (CVI Melles Griot, Albuquerque, NM) was placed in the spectrometer to filter out
the excitation light of the laser. A thermal camera (FLIR A20, FLIR Systems Inc.,
Boston, Massachusetts) was used to measure the temperature of each sample, or the PBS
in which it was submerged. A custom LabVIEW program was used to control the system
and acquire both spectroscopic and thermal data during all experiments. A diagram of the
experimental setup is given in Figure 2.1.
Figure 2.1 Setup for in vitro fluorescence and temperature experiments. A 337 nm N2 laser is used for
fluorescence excitation, and a white light source is used for reflectance illumination, each delivered by a
single, separate fiber. Five collection fibers deliver the collected light to a spectrometer, which delivers the
spectra to LabVIEW program on a laptop. The thermal camera delivers a temperature reading to an analog
to digital converter (A/DC) which delivers the reading to the program on the computer. The sample is held
in place in the beaker of PBS. The probe is locked in place for the duration of the experimental run.

36
In Vitro Methods
For the in vitro experiments, the spectroscopic system and thermal camera were
positioned above the sample, which was placed on a sample holder. The thermal camera
was positioned to measure the sample’s temperature on a spot adjacent to the optical
probe, as close to the probe as possible without encompassing the probe’s image. The
optical probe was held in place at a fixed point on the sample for the duration of the
experiment. A total of 8 skin samples and 4 adipose tissue samples were measured.
Samples were obtained from the Cooperative Human Tissue Network (CHTN)
with prior IRB (Internal Review Board) approval. Skin and adipose tissue samples were
obtained from liposuction or breast-reduction surgeries. Immediately upon the samples’
surgical excision, they were flash frozen in liquid nitrogen, transported to a -80°C freezer,
and kept there until time for the experiments. Samples were removed from the -80°C
freezer and placed in a custom probe holder above a room temperature phosphate
buffered saline (PBS) solution. The probe was placed at the center of the sample’s
surface, and locked into place for the remainder of the experiment. Spectroscopic
measurements were made as soon as the probe and thermal recording spot were set,
usually beginning at about -20°C. At each measurement point, the temperature, a
baseline spectrum, a reflectance spectrum, and a fluorescence spectrum were measured.
Every 2.5°C, a measurement was taken. This process continued until the sample
passively heated to the temperature of the PBS temperature below the sample. Additional
PBS at room temperature was added until the sample was submerged. After submersion
of the sample, the thermal camera was only able to provide temperature readings from the

37
surface of the PBS. Due to the small size of the samples, the samples were assumed to be
at the same temperature as the PBS for the remainder of the experiment. Neither the
probe nor the sample was moved in this process. The PBS solution containing the sample
was then actively heated using a hot plate to a maximum temperature. Once the sample
reached the target temperature, the hot plate was turned off and the sample was allowed
to passively cool to room temperature while measurements were made at 5°C intervals.
In Vivo Methods
This in vivo study was approved and performed in accordance with the regulations
of the Institutional Review Board of Vanderbilt University. Measurements were made on
the lateral forearm of 7 different volunteers. Before any measurements were made, a
circle was drawn with a felt tipped pen in order to obtain consistent measurements at a
single spot. A cold pack was removed from a -20°C freezer and placed on the volunteer’s
lateral forearm and held there for 3 minutes. The volunteer then placed his or her forearm
in position under the thermal camera and probe. The probe was placed at the marked spot
and the thermal camera position was adjusted appropriately. As the skin passively
warmed, spectroscopic and thermal measurements were made until the skin was at
normal body temperature (approximately 33°C for forearm skin). Then, a heat pack was
placed on the forearm and held in place for 3 minutes. This was removed, and the probe
was repositioned at the marked spot. Spectroscopic and thermal measurements were
made as the skin cooled back to an equilibrium temperature. Practically, this method
allowed for the measurement of skin temperatures from 10°C up to 40°C.
38
Analysis
Spectral Processing
Each reflectance and fluorescence spectrum was background subtracted.
Fluorescence spectra were corrected for the spectral response of the detection system
using calibration factors determined using a National Institute of Standards and
Technology (NIST) calibrated tungsten-ribbon filament lamp. Reflectance spectra were
calibrated using factors obtained from the reflectance measurement of a known standard
(Spectralon 20% Reflectance Standard, Labsphere, North Sutton, NH). The spectra were
median filtered and binned in 5 nm intervals over the spectral range of 400-800nm.
Data Extraction
For the fluorescence spectra, peak height was examined as a function of
temperature. For each individual sample in vitro, the fluorescent values were normalized
such that the peak height at 0°C would be equal to one. For the in vivo experiments, the
intensity value at 0°C was calculated using a linear fit of the data. Fluorescence emission
peak position was also examined as a function of temperature. The reflectance data was
used to assess the change in optical properties in the in vitro experiments. An inverse
Monte Carlo program was used to calculate the optical property changes as a function of

39
temperature. This algorithm was adapted to our collection geometry from a program used
by Palmer et al. [35, 36] to predict µa and µs’. The measured diffuse reflectance was used
as input for the inverse Monte Carlo algorithm, and optical property measurements of
similar samples from a spectrophotometer were used to produce initial guesses in order to
ensure model convergence and a unique inverse solution. In order to quantify the
fluorescence change, linear regression was performed on the fluorescence peak height
data as a function of temperature. The in vitro regression was restricted to the
temperature range of 15°C to 40°C. This temperature range was chosen to correspond to
the in vivo data collected. The means of these slopes and their standard deviations were
compared using a Mann-Whitney U-test to determine if the trends were significantly
different.

40
Figure 2.2 Representative fluorescence spectra as a function of temperature for the skin (A) and adipose
tissue (B). All spectra shown are decreasing in intensity with increasing temperature.
Results
In Vitro
Figure 2.2 shows a decrease in fluorescence intensity with increasing temperature
for both tissue types in this in vitro experiment. The fluorescence spectra in Figure 2.2
show no change in lineshape in the skin samples. In addition to the decrease in
fluorescence intensity, the adipose fluorescence spectra exhibit a lineshape change as the
400 450 500 550 600 650 7000
50
100
150
200
Fluorescence Intensity (a.u.)
Skin
2°C
21°C
38°C
56°C
70°C
400 450 500 550 600 650 7000
5
10
15
20
wavelength (nm)
Adipose Tissue
-20°C
4°C
25°C
48°C
69°C
B
A
41
samples approach 0°C. As the adipose tissue samples approached 0°C, the fluorescent
peak values around 500 nm disappeared. This fluorescent lineshape change was not seen
in any of the skin samples.
In order to examine the relationship between optical properties and fluorescence,
the reduced scattering and absorption coefficients, calculated using the inverse Monte
Carlo simulations, are displayed with the fluorescence peak intensities as a function of
temperature. The results of two skin samples (Figure 2.3) and two adipose tissue samples
(Figure 2.4) are shown.

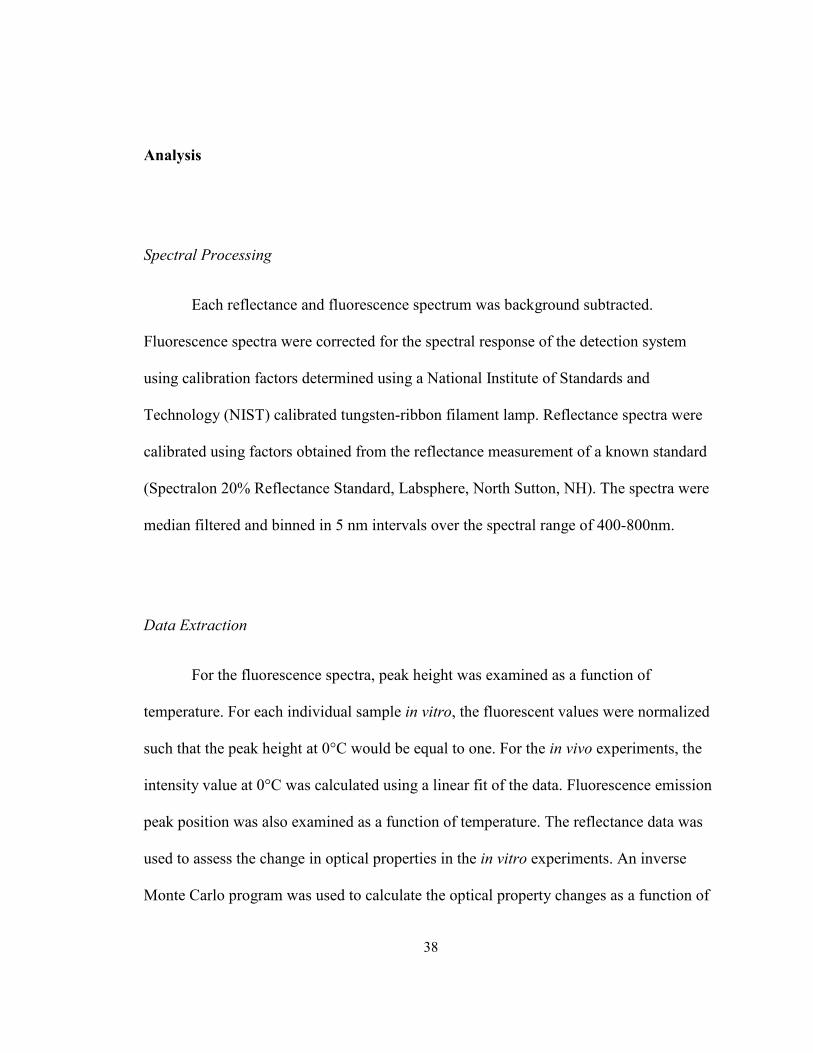
42
Figure 2.3 Fluorescence and optical property trends of two skin samples, one heated to a maximum of
70°C (red) and one heated to a maximum of 50°C (blue). The maximum fluorescence intensity (A), µs’ (B),
and µa (C) are displayed for each temperature. Averages of all samples (n=8) for the skin are shown by a
solid line for each type of data.
Two representative skin samples and the averages of all the skin samples are
displayed in Figure 2.3. They show a monotonic decrease in fluorescence intensity with
increasing temperature. The reduced scattering coefficient in the skin tends to decrease
initially starting at 0°C, and then increase at approximately 60°C. The absorption
coefficient in the skin showed a slight increase due to temperature, but the change was on
a much smaller scale than the reduced scattering coefficient changes.
0 10 20 30 40 50 60 70 80
0.4
0.6
0.8
1
Fl. Peak H
eight (a.u.) Skin
heated to 70οC max.
heated to 50οC max.
Average
0 10 20 30 40 50 60 70 80
40
50
60µs′ (cm
-1)
0 10 20 30 40 50 60 70 801
1.5
2
2.5
3
µa (cm
-1)
temperature °C
A
B
C

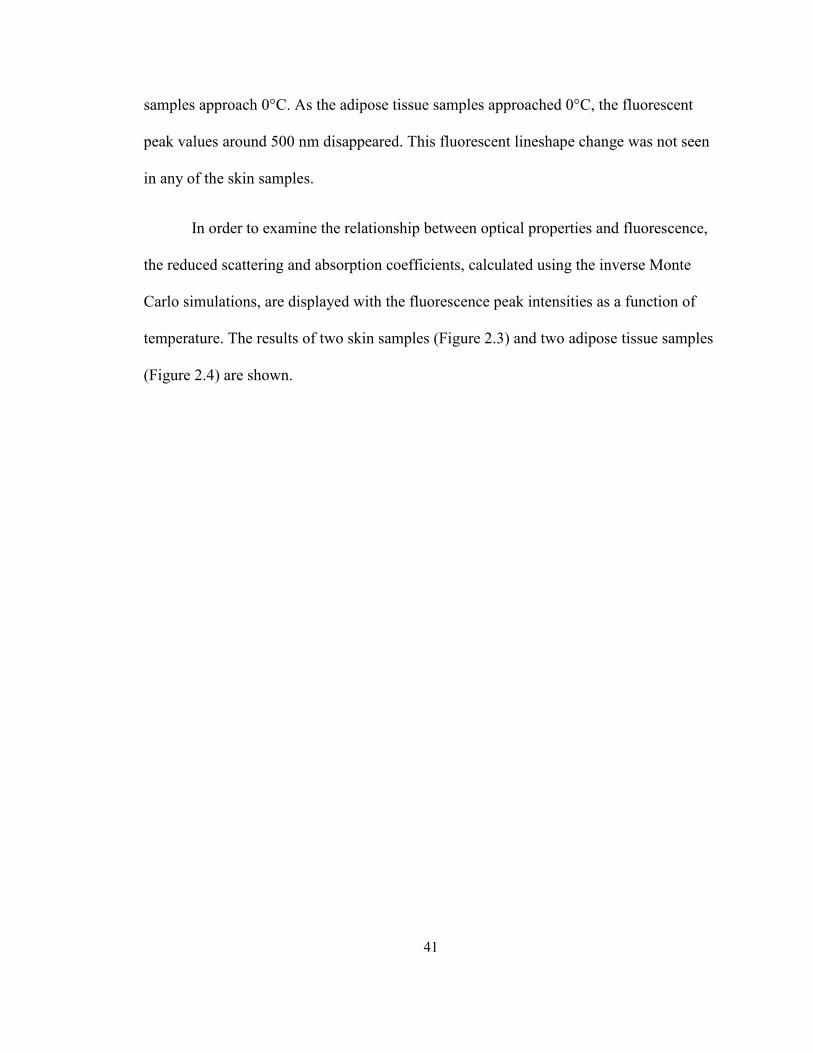
43
Figure 2.4 Fluorescence and optical property trends of two adipose tissue samples, one heated to a
maximum of 70°C (red) and one heated to a maximum of 50°C (blue). The maximum fluorescence
intensity (A), µs’ (B), and µa (C) are displayed for each temperature. Averages of all samples (n=4) for the
adipose tissue are shown by a solid line for each type of data.
Two representative adipose tissue samples and the averages of all the adipose
samples are displayed in Figure 2.4. The adipose tissue samples show a consistent
decrease in fluorescence intensity with increasing temperature. An initial increase in the
reduced scattering coefficient is seen around 10°C, followed by a decrease up to around
60°C. The adipose samples heated to 70°C show an increase in the reduced scattering
coefficient around 60°C. The absorption coefficient initially increased to approximately
5°C before steadily decreasing to approximately 40°C. The adipose tissue showed
virtually no absorption at temperatures higher than 40°C.
0 10 20 30 40 50 60 70 80
0.4
0.6
0.8
1
Fl. Peak H
eight (a.u.)
Adipose
heated to 70οC max.
heated to 50οC max.
Average
0 10 20 30 40 50 60 70 806
8
10
12
µs′ (cm
-1)
0 10 20 30 40 50 60 70 800
2
4
6
µa (cm
-1)
temperature °C
C
B
A

44
All of the in vitro data display a decrease in maximum fluorescence intensity as a
function of increasing temperature as shown in Figures 2.2-2.4. The fluorescence
intensity versus temperature monotonically decreases over the range of 20-70°C. Some
samples show a slight increase in fluorescence intensity over the temperature range of -
20°C to 20°C. There is also no shift in emission peak location in the in vitro skin data.
Figure 2.5 Reversibility trends for two skin samples and two adipose tissue samples. Each tissue type has
a sample heated to a maximum of 70°C (A) and one heated to a maximum of 50°C (B). The heating phase
(filled circles) and cooling phase (crosses) are displayed for each sample.
Representative heating and cooling fluorescence trends for the samples are
displayed in Figure 2.5. Fluorescent peak heights of two skin samples heated to 50°C and
0 10 20 30 40 50 60 70 800
0.5
1
1.5
2
Fl. Peak Height (a.u.)
0 10 20 30 40 50 60 70 800
0.2
0.4
0.6
0.8
1
Fl. Peak H
eight (a.u.)
temperature °C
Skin Heating
Skin Cooling
Adipose Heating
Adipose Cooling
A
B
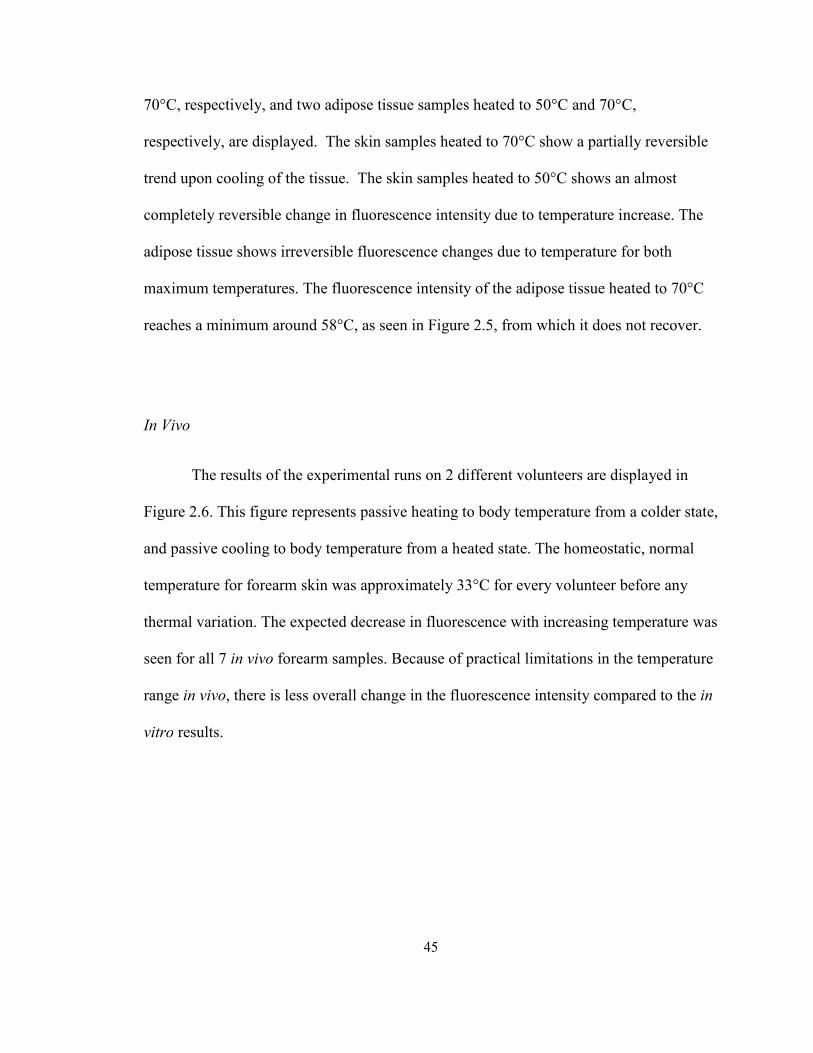
45
70°C, respectively, and two adipose tissue samples heated to 50°C and 70°C,
respectively, are displayed. The skin samples heated to 70°C show a partially reversible
trend upon cooling of the tissue. The skin samples heated to 50°C shows an almost
completely reversible change in fluorescence intensity due to temperature increase. The
adipose tissue shows irreversible fluorescence changes due to temperature for both
maximum temperatures. The fluorescence intensity of the adipose tissue heated to 70°C
reaches a minimum around 58°C, as seen in Figure 2.5, from which it does not recover.
In Vivo
The results of the experimental runs on 2 different volunteers are displayed in
Figure 2.6. This figure represents passive heating to body temperature from a colder state,
and passive cooling to body temperature from a heated state. The homeostatic, normal
temperature for forearm skin was approximately 33°C for every volunteer before any
thermal variation. The expected decrease in fluorescence with increasing temperature was
seen for all 7 in vivo forearm samples. Because of practical limitations in the temperature
range in vivo, there is less overall change in the fluorescence intensity compared to the in
vitro results.

46
Figure 2.6 Two representative in vivo experimental runs are displayed, representing two different
volunteers. Fluorescence peak height is plotted versus temperature for the forearm skin region. The average
line obtained from the linear regression of all samples is also shown (solid line).
The fluorescence trends of the in vitro skin samples were compared to the
fluorescence trends of the in vivo skin samples. For every sample, the slopes of the
fluorescence decrease as a function of temperature were calculated between 15°C and
40°C using linear regression. This temperature range was chosen to represent the
approximate range of in vivo temperatures examined. The average slope of the
fluorescence versus temperature trend from 15°C to 40°C was slightly larger for in vivo
skin than for in vitro skin. A Mann-Whitney U-test was performed on the slopes of the
skin samples, and no significant difference was found (p=0.15) between the in vitro skin
trends and the in vivo skin trends, suggesting that we successfully reproduced the in vitro
fluorescence changes in vivo. The average slopes with standard deviations are presented
10 15 20 25 30 35 40
0.4
0.5
0.6
0.7
0.8
0.9
1
temperature (°C)
Fl. Peak Intensity (a.u.)
Sample 1
Sample 2
Average

47
in Figure 2.7. The vertical axis represents the magnitude of the mean slope between 15°C
and 40°C obtained from linear regression.
Figure 2.7 Mean slopes and standard deviations are displayed for the collective in vitro skin samples and
the in vivo experimental runs. The y-axis represents the magnitude of the negative slope obtained from
linear regression on all the samples in the appropriate category. The bars represent the mean slope
magnitudes and the error bars represent 1 standard deviation. The difference is not statistically significant
(p=0.15).
Discussion
The fluorescence intensity in all of the samples decreased with increasing
temperature from 20°C to 70°C, but a variety of mechanisms could be causing this
relationship. In previous studies, the fluorescence dependence on temperature has been
attributed to intersystem crossing or temperature dependent internal conversion [12]. The
relationship is sometimes described as a function of decreased fluorescence lifetime at
higher temperatures [19-21]. In addition, optical properties are known to be temperature
dependent and affect fluorescence. The effects of temperature on optical properties in
0
0.002
0.004
0.006
0.008
0.01
0.012
0.014
0.016
In Vivo In Vitro
Mean Slope (- ∆
F/ ∆T)

48
tissue have previously been examined in the near-infrared region. Optical properties in ex
vivo human dermis and sub-dermis were found to be temperature dependent in the
spectral region of 650 – 1000 nm. Specifically, the reduced scattering coefficient was
found to increase with increased temperature from 25°C to 40°C for the dermis, and
decrease for the sub-dermis. The absorption coefficient showed no significant
dependence on temperature [37]. In vivo experiments on the human forearm have
reported similar temperature dependencies for the reduced scattering coefficient at 590
nm. The absorption coefficient’s dependence on temperature in vivo was not entirely
clear, but it was suggested that changes in absorption were due to the pooling of blood in
the skin’s capillaries [38].
In Vitro
Although the reduced scattering coefficient in vitro is temperature dependent, it
does not account for the fluorescence intensity decrease. For instance, the skin samples in
Figure 2.3 show relatively constant reduced scattering coefficient values from 20°C to
about 50°C, but the fluorescence intensity continues to decrease. The initial decrease in
the reduced scattering coefficient in skin at lower temperatures is not entirely understood,
but may be due to the thawing of the tissue. While the adipose tissue in Figure 2.4 shows
reduced scattering coefficient values that are variable from 20°C to 50°C, they do not
correspond to changes that would result in a fluorescence decrease. That is, a reduction
in the reduced scattering coefficient should yield more fluorescence, but the opposite is
seen in Figure 2.4. The only reduced scattering coefficient trend that could cause a

49
decrease in fluorescence is seen above 60°C in both tissue types, when scattering
increases, presumably due to coagulation. The regions from 20°C to 50°C, despite the
relative low variability in optical properties, still exhibit a fluorescence decrease
consistent with the overall fluorescence trend. This suggests that while the reduced
scattering coefficient may be contributing to the fluorescence decrease, the mechanism is
a combination of optical property changes and fluorescence effects sensitive to
temperature.
The absorption coefficient in vitro does not account for the fluorescence intensity
increase in the skin or the adipose tissue. Although the absorption coefficient shows
temperature dependence in the adipose tissue, it does not correspond to a decrease in
fluorescence intensity. The absorption coefficient decreases with increasing temperature
in the adipose tissue while the fluorescence intensity also decreases. Similar to the
reduced scattering coefficient trends in the adipose tissue, if the absorption coefficient
was causing the fluorescence decrease, an increase in the absorption coefficient would be
expected, but the opposite is seen in Figure 2.4. The absorption coefficient in the skin
samples shown in Figure 2.3 shows a slight trend with temperature, but this trend is on a
much smaller scale than the reduced scattering coefficient changes. Since the primary
absorber in tissue is blood [26], the small absorption coefficient values for our in vitro
tissue samples previously rinsed with saline are expected. In addition, the placement of
the samples in PBS further removed blood from the sample as time in the PBS increased.
Thus, the slight increase in the absorption coefficient in skin is likely not physically
relevant, and does not contribute to any fluorescence changes.
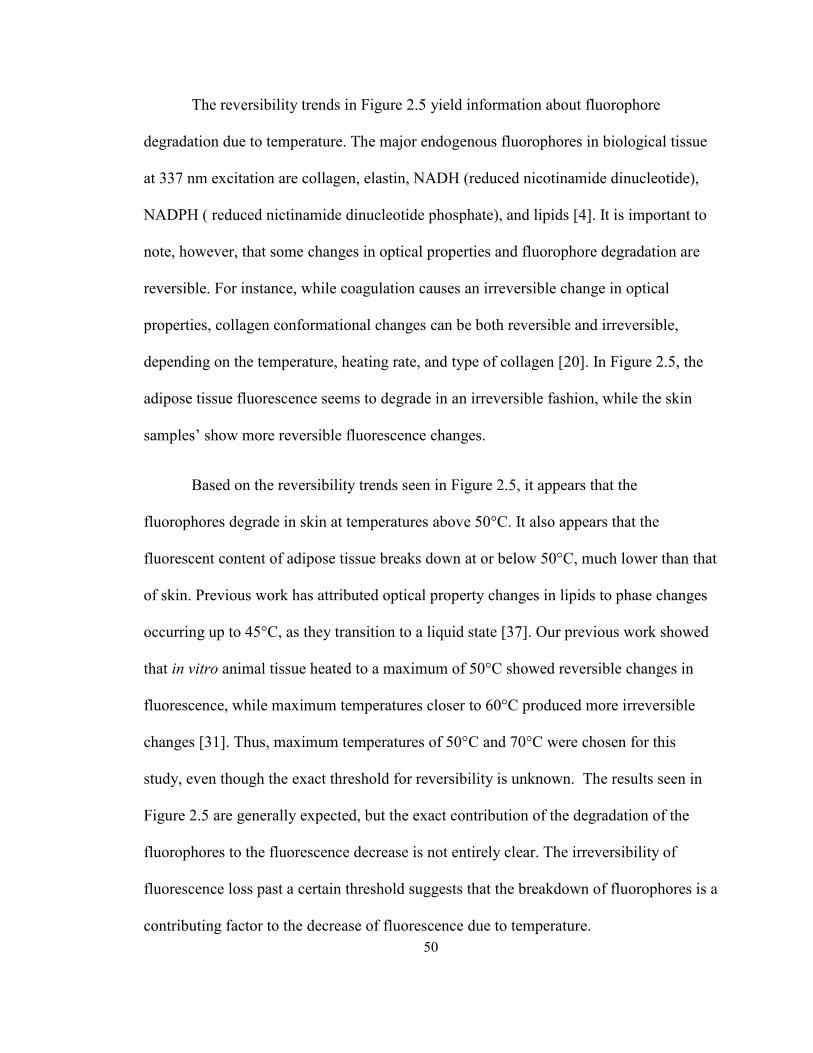
50
The reversibility trends in Figure 2.5 yield information about fluorophore
degradation due to temperature. The major endogenous fluorophores in biological tissue
at 337 nm excitation are collagen, elastin, NADH (reduced nicotinamide dinucleotide),
NADPH ( reduced nictinamide dinucleotide phosphate), and lipids [4]. It is important to
note, however, that some changes in optical properties and fluorophore degradation are
reversible. For instance, while coagulation causes an irreversible change in optical
properties, collagen conformational changes can be both reversible and irreversible,
depending on the temperature, heating rate, and type of collagen [20]. In Figure 2.5, the
adipose tissue fluorescence seems to degrade in an irreversible fashion, while the skin
samples’ show more reversible fluorescence changes.
Based on the reversibility trends seen in Figure 2.5, it appears that the
fluorophores degrade in skin at temperatures above 50°C. It also appears that the
fluorescent content of adipose tissue breaks down at or below 50°C, much lower than that
of skin. Previous work has attributed optical property changes in lipids to phase changes
occurring up to 45°C, as they transition to a liquid state [37]. Our previous work showed
that in vitro animal tissue heated to a maximum of 50°C showed reversible changes in
fluorescence, while maximum temperatures closer to 60°C produced more irreversible
changes [31]. Thus, maximum temperatures of 50°C and 70°C were chosen for this
study, even though the exact threshold for reversibility is unknown. The results seen in
Figure 2.5 are generally expected, but the exact contribution of the degradation of the
fluorophores to the fluorescence decrease is not entirely clear. The irreversibility of
fluorescence loss past a certain threshold suggests that the breakdown of fluorophores is a
contributing factor to the decrease of fluorescence due to temperature.
51
In Vivo
The in vivo data show an overall decrease in fluorescence due to temperature as
can be seen in Figure 2.6. These results show that the decrease in fluorescence due to
increased temperature in vitro can be reproduced in vivo over a physiologically relevant
temperature range. Since no permanent tissue damage was done in the in vivo study due
to the physiological temperatures used, it can be inferred that the loss in fluorescence is
completely reversible over this temperature range. The temperature range of the in vivo
portion precludes coagulation as possible mechanisms for the fluorescence decrease. The
reversibility and absence of permanent damage also limit the possible causes of the
fluorescence decrease. If fluorophore breakdown or optical property changes are causing
the fluorescence change, they are doing so in a completely reversible manner. Other
factors, such as a non-radiative decay mechanism, may be responsible for changes in
fluorescence in vivo.
In general, the in vivo fluorescence trends show greater inter-sample and intra-
sample variability than the in vitro experiments. A variety of factors may contribute to
the increased variability in vivo. Primarily, it is more difficult to accurately control
temperature in vivo than in vitro. For the in vitro samples, the exact PBS solution
temperature could be actively controlled while making spectroscopic and thermal
measurements. For the in vivo experiments, instrumental requirements restricted the
spectroscopic and thermal measurements to be made during the passive heating and
cooling phases, when the thermal pack was not covering the interrogation spot. The
human body actively controls temperature, while our method of thermal variation was

52
passive. Thus, the window of passive heating and cooling passed very quickly and was
not easily controlled. Despite these challenges, the fluorescence decrease due to increased
temperature was reproduced in all 7 volunteers in vivo.
Overall
Although the average slopes for the in vitro skin samples and the in vivo skin
samples differ slightly, this difference is not statistically significant in this study
(p=0.15). The non-parametric Mann-Whitney U-test was used on the skin in vitro (n=8)
and the in vivo forearm skin (n=7). This suggests that although a variety of factors
influence the change in fluorescence, these factors are mostly similar in vitro and in vivo
over the small temperature range surrounding normal body temperature. The results of
the in vivo experiments suggest that the fluorescence of human tissue can be manipulated
using temperature in vivo without causing any damage to the tissue. A larger sample size
of both in vivo and in vitro samples would allow for a more powerful statistical test if
these trends are similar.
All of these experiments relied on the relationship between temperature and
fluorescence in tissue, but the time maintained at a certain temperature is also a variable
influencing tissue’s response to heat. Specifically, thermal damage in tissue depends
exponentially on temperature and linearly on time [28, 39]. Achieving a consistent
heating rate is especially difficult if samples vary in size, as they did in this study.
Despite variable heating rates and optical property changes, the fluorescence intensity
change was consistent for all samples due to temperature changes.

53
Other mechanisms should also be considered when observing fluorescence and
temperature relationships. These experiments suggest that the fluorescence decrease due
to temperature is not a function of optical property changes and coagulation over the
physiological temperature range. The presence of a temperature dependent non-radiative
decay mechanism seems plausible in the in vivo experiments, since the fluorescence
decrease occurs without any permanent changes to the tissue. Even the in vitro samples
show fluorescence decreases in the physiological temperature range similar to those in
vivo. Therefore, collisional quenching is a likely non-radiative decay mechanism that is
temperature dependent. Collisional quenching would contribute to the fluorescence
decrease with increased temperature by causing more molecules to quench the excited
fluorophores. This results in the return of the molecule to its ground state before the
radiative, fluorescent decay can occur, resulting in a shorter fluorescence lifetime and
lower fluorescence emission. In biological tissue, the most prevalent quencher is oxygen
[40]. Further work including time-resolved fluorescence spectroscopy would be
necessary to demonstrate the presence of collisional quenching.
These results suggest that fluorescence may be an accurate indicator of tissue
temperature, with little dependence on optical properties in the physiological temperature
range. A fluorescence mechanism that is more sensitive to temperature than a change in
optical properties would have significant implications. The understanding of such a
mechanism would enable fluorescence to be used as an accurate indicator of tissue
temperature. In addition to being able to distinguish between coagulated tissue and native
tissue, fluorescence could be used to indicate relative tissue temperature, the state of the
fluorophore, or thermally-mediated cell death [28, 29]. The ability to detect cell death

54
prior to coagulation could reduce the time needed for thermal ablative therapies and
reduce the unnecessary vaporization of tissue.
As fluorescence is increasingly used for guidance and diagnosis in medical
applications, the effect of temperature on such techniques must be considered. Thermal
ablation is a frequently used surgical technique that involves drastic changes in
temperature. If fluorescence is used in conjunction with this type of technique, the effects
of temperature must be taken into account. In addition, those using fluorescence in
laboratory and animal research must also consider the effects of temperature if there is
any thermal variability present. For example, a research study attempting to reproduce
results from an animal model in a human subject should consider any differences in body
temperature, and carefully maintain body temperature in anesthetized small rodents.
Studies attempting to reproduce in vitro fluorescence results in vivo should also consider
the change from room temperature to body temperature. Further investigation of the
precise mechanism influencing the effects of temperature on fluorescence could yield
both a deeper scientific understanding of light-tissue interaction and practical applications
to photonics in medicine.
Conclusions
The results of the in vitro experiments show that fluorescence decreases with
increasing temperature in human tissue. The change in fluorescence due to temperature is
partly reversible and partly irreversible, depending on the maximum temperature reached
in the tissue and tissue type. The in vivo results confirm that reversible changes in

55
fluorescence can be obtained in human tissue using temperature variation over a small
range surrounding body temperature. The inverse relationship between fluorescence
intensity and temperature is due to a combination of factors. Based on the changes in
fluorescence when the reduced scattering coefficient is mostly unchanged, it appears that
optical properties have minimal influence over fluorescence changes due to temperature
in the physiological temperature range. The results of this study suggest that fluorescence
may be more sensitive to temperature changes than optical properties, and could be
utilized to measure tissue temperature.

56
Bibliography
1. Gebhart, S.C., R.C. Thompson, and A. Mahadevan-Jansen, Liquid-crystal tunable filter
spectral imaging for brain tumor demarcation. Appl Opt, 2007. 46(10): p. 1896-910.
2. Kanter, E.M., et al., Effect of hormonal variation on Raman spectra for cervical disease
detection. Am J Obstet Gynecol, 2009. 200(5): p. 512 e1-5.
3. Keller, M.D., S.K. Majumder, and A. Mahadevan-Jansen, Spatially offset Raman
spectroscopy of layered soft tissues. Opt Lett, 2009. 34(7): p. 926-8.
4. Ramanujam, N., Fluorescence spectroscopy of neoplastic and non-neoplastic tissues.
Neoplasia, 2000. 2(1-2): p. 89-117.
5. Dinerman, J.L., R.D. Berger, and H. Calkins, Temperature Monitoring During
Radiofrequency Ablation. Journal of Cardiovascular Electrophysiology, 1996. 7(2): p.
163-173.
6. Goldberg, S.N., G.S. Gazelle, and P.R. Mueller, Thermal Ablation Therapy for Focal
Malignancy: A Unified Approach to Underlying Principles, Techniques, and Diagnostic
Imaging Guidance. Am. J. Roentgenol., 2000. 174(2): p. 323-331.
7. Lencioni, R. and L. Crocetti, Radiofrequency Ablation of Liver Cancer. Techniques in
Vascular and Interventional Radiology, 2007. 10(1): p. 38-46.
8. Jansen, E.D., T.H. Le, and A.J. Welch, Excimer, Ho:YAG, and Q-switched Ho:YAG
ablation of aorta: a comparison of temperatures and tissue damage in vitro. Appl. Opt.,
1993. 32(4): p. 526-534.
9. Lindner, U., et al., Focal Laser Ablation for Prostate Cancer Followed by Radical
Prostatectomy: Validation of Focal Therapy and Imaging Accuracy. Eur Urol. In Press.
10. Papazoglou, T.G., et al., Control of excimer laser aided tissue ablation via laser-induced
fluorescence monitoring. Appl. Opt., 1990. 29(33): p. 4950-4955.
11. Bowen, E.J. and J. Sahu, The Effect of Temperature on Fluorescence of Solutions. The
Journal of Physical Chemistry, 1959. 63(1): p. 4-7.
12. Haynes, D.R., A. Tokmakoff, and S.M. George, Temperature-Dependent Absolute
Fluorescence Quantum Yield of C-60 Multilayers. Chemical Physics Letters, 1993.
214(1): p. 50-56.
13. Romano, V., et al., Time-resolved thermal microscopy with fluorescent films. Applied
Physics B: Lasers and Optics, 1989. 49(6): p. 527-533.
14. Connors, R.E., et al., Temperature dependence of aryl butatriene fluorescence: barrier to
twisting on S-1 for 1,1,4,4-tetraphenylbutatriene. Journal of Molecular Structure, 1998.
443(1-3): p. 107-113.
57
15. Law, K.Y., Squaraine Chemistry - Effects of Solvent and Temperature on the
Fluorescence Emission of Squaraines. Journal of Photochemistry and Photobiology a-
Chemistry, 1994. 84(2): p. 123-132.
16. Park, T.R., The temperature dependence of the fluorescence intensity and a nonradiative
de-excitation process in sodium cryptand sodide. Journal of Physics-Condensed Matter,
1996. 8(4): p. 405-418.
17. Lee, J. and G.W. Robinson, Indole - A Model System for One-photon Threshold
Photoionization in Polar Media. Journal of Chemical Physics, 1984. 81(3): p. 1203-
1206.
18. Framme, C., et al., Temperature dependent fluorescence of A2-E, the main fluorescent
lipofuscin component in the RPE. Current Eye Research, 2009. 29(4-5): p. 287-291.
19. Allison, S.W. and G.T. Gillies, Remote thermometry with thermographic phosphors:
Instrumentation and applications. Review of Scientific Instruments, 1997. 68(7): p.
2615-2650.
20. Menter, J.M., Temperature dependence of collagen fluorescence. Photochemical &
Photobiological Sciences, 2006. 5(4): p. 403-410.
21. Oliver, A.E., et al., Effects of temperature on calcium-sensitive fluorescent probes.
Biophysical Journal, 2000. 78(4): p. 2116-2126.
22. Drake, M.C. and J.W. Ratcliffe, High-Temperature Quenching Cross-sections for
Nitric-Oxide Laser-induced Fluorescence Measurements. Journal of Chemical
Physics, 1993. 98(5): p. 3850-3865.
23. Raiche, G.A. and D.R. Crosley, Temperature-dependent Quenching of the A2-
Sigma+ and B2-Pi States of NO. Journal of Chemical Physics, 1990. 92(9): p. 5211-
5217.
24. Gai, F., R.L. Rich, and J.W. Petrich, Monophotonic Ionizations of 7-Azaindole,
Indole, and their Derivatives and the Role of Overlapping Excited-states. Journal
of the American Chemical Society, 1994. 116(19): p. 8859-8859.
25. Brancaleon, L., P.R. Crippa, and D. Diemmi, Anomalous Temperature Fluorescence
Quenching of N-TRP Terminal Peptides. Biopolymers, 1995. 36(6): p. 723-733.
26. Müller, M.G., et al., Intrinsic fluorescence spectroscopy in turbid media: disentangling
effects of scattering and absorption. Appl. Opt., 2001. 40(25): p. 4633-4646.
27. Wu, J., M.S. Feld, and R.P. Rava, Analytical model for extracting intrinsic fluorescence
in turbid media. Appl. Opt., 1993. 32(19): p. 3585-3595.
28. Lin, W.C., C. Buttemere, and A. Mahadevan-Jansen, Effect of thermal damage on the in
vitro optical and fluorescence characteristics of liver tissue's. IEEE Journal of Selected
Topics in Quantum Electronics, 2003. 9(2): p. 162-170.
58
29. Buttemere, C.R., et al., In vivo assessment of thermal damage in the liver using optical
spectroscopy. Journal of Biomedical Optics, 2004. 9(5): p. 1018-1027.
30. Zaman, R.T., et al., Variation of Fluorescence in Tissue with Temperature. Lasers in
Surgery and Medicine. Submitted.
31. Walsh, A., et al., The Effect of Temperature on Fluorescence: An Animal Study. Journal
of Biomedical Optics. Submitted.
32. Gebhart, S.C., S.K. Majumder, and A. Mahadevan-Jansen, Comparison of spectral
variation from spectroscopy to spectral imaging. Appl Opt, 2007. 46(8): p. 1343-60.
33. Lin, W.-C., et al., In Vivo Brain Tumor Demarcation Using Optical Spectroscopy.
Photochemistry and Photobiology, 2001. 73(4): p. 396-402.
34. Toms, S.A., et al., Intraoperative optical spectroscopy identifies infiltrating glioma
margins with high sensitivity. Neurosurgery, 2007. 61(1 Suppl): p. 327-35.
35. Palmer, G.M. and N. Ramanujam, Monte Carlo-based inverse model for calculating
tissue optical properties. Part I: Theory and validation on synthetic phantoms. Appl.
Opt., 2006. 45(5): p. 1062-1071.
36. Palmer, G.M., et al., Monte Carlo-based inverse model for calculating tissue optical
properties. Part II: Application to breast cancer diagnosis. Appl. Opt., 2006. 45(5): p.
1072-1078.
37. Laufer, J., et al., Effect of temperature on the optical properties of ex vivo human dermis
and subdermis. Physics in Medicine and Biology, 1998. 43(9): p. 2479.
38. Khalil, O.S., et al., Temperature modulation of the visible and near infrared absorption
and scattering coefficients of human skin. Journal of Biomedical Optics, 2003. 8(2): p.
191-205.
39. Pearce, J. and S. Thomsen, Rate Process Analysis of Thermal Damage, in Optical-
Thermal Response of Laser-Irradiated Tissue, A.J. Welch and M.J.C. Van Gemert,
Editors. 1995, Plenum: New York. p. 561-606.
40. Lakowicz, J.R. and B.R. Masters, Principles of Fluorescence Spectroscopy, Third
Edition. Journal of Biomedical Optics, 2008. 13(2): p. 029901-2.

59
CHAPTER III
SUMMARY AND FUTURE DIRECTIONS
Summary
This study has shown that the inverse relationship between fluorescence intensity
and temperature is present in human tissue both in vivo and in vitro. Combined with the
preliminary study described in Chapter I, the exact dependence of fluorescence on
temperature depends on the tissue type (skin, adipose, cornea, eye), but exhibits an
overall inverse relationship with temperature over the temperature range of 20°C to
70°C.
This study shows strong evidence that optical properties are not the only
mechanism, evidenced by fluorescence changes in thermal regions where there is little or
no optical property variation. This study also shows fluorescence changes at temperatures
well below coagulation or fluorophore degradation, implicating an additional mechanism.
One possible mechanism includes collisional quenching due to the presence of oxygen or
other quenchers. Further work would be needed to prove this.
The in vivo portion of this study has shown that the fluorescence decrease due to
temperature recorded in vitro can be reproduced in vivo over a smaller temperature range.
This shows that fluorescence can be varied using thermal manipulation of in vivo tissue

60
without causing coagulation or damage. It also shows that the fluorescence decrease due
to heat is completely reversible in in vivo human tissue over a small temperature range.
The statistical test used in Chapter II demonstrated that there was no significant
difference between the decrease in fluorescence in vitro and in vivo over the temperature
range of 15°C to 40°C for the samples in this study. In order to conclude that the trends
are fundamentally similar, larger numbers of both in vitro and in vivo experiments would
need to be performed in order to apply a more powerful, parametric statistical test.
Future Directions
In order to confirm or refute the presence of collisional quenching as a
mechanism of fluorescence decrease, specific experiments targeting this phenomenon
would need to be conducted. The only way to prove or disprove the presence of
collisional quenching is to perform time-resolved fluorescence measurements. Since
collisional quenching works by decreasing the fluorescent lifetime and thus decreasing
the overall fluorescence [1], a time-resolved method would detect this occurrence if it is
present. In addition, the samples could be placed in a non-polar solvent instead of water,
saline, or PBS. Polar solvents are known to increase the occurrence of quenching. Since
oxygen is the most ubiquitous known quencher, a solvent that contained no oxygen could
also be used in further experiments to see if the same amount of fluorescence decrease
occurs.
61
Although the data showed clear trends in most cases, the spectroscopic system has
an inherent variability in fluorescence excitation that could be improved. This is due to
the lack of synchronization between the laser pulses (20 Hz) and the acquisition of the
spectrometer. This is usually remedied by taking three or more measurements at a time
and averaging them to obtain a single spectrum. This method of averaging is mostly
effective in in vitro situations, but in in vivo situations where the induced temperature
returns to body temperature very quickly, there is not enough time to take three
measurements for every desired data point. Previous work with this system (unpublished)
has shown that proper timing between the laser pulses and the spectrometer can decrease
the fluorescence intensity variance by as much as an order of magnitude. Making these
instrumental corrections would greatly increase the confidence and consistency of any
future in vivo experiments.
In order to extract optical properties, an inverse Monte Carlo algorithm was used.
This method required diffuse reflectance spectra as input and predicted the reduced
scattering coefficient and absorption coefficient over the available spectral range. The
available spectral range for the system we used was approximately 400-800 nm.
Wavelengths below 400 nm begin to undergo powerful attenuation due to the presence of
a 385 nm longpass filter placed in the spectrometer. This filter is intended to filter out the
laser excitation light for fluorescence measurements, but it also filters the diffuse
reflectance light since it is inside the spectrometer. In order to determine exactly how
optical properties modulate fluorescence, optical properties must be known at both the
excitation wavelength (337 nm) and the emission wavelength (400-800 nm). Our current
study only extracts information about optical properties from 400-800 nm, but the

62
behavior at the excitation wavelength is unknown. If a different method of filtering was
used that filtered the excitation laser for fluorescence, but not during diffuse-reflectance,
a complete picture of the optical properties affecting fluorescence could be obtained.
Larger numbers of samples for both the in vitro and in vivo portions are needed to
form any definite conclusions about the similarity between in vivo and in vitro
experimental runs. With less than 10 samples in each group of skin examined, a non-
parametric test was required to test for significance. Larger sample numbers would not
only increase confidence about reproducibility, but allow for more powerful statistical
tests to be performed.
Finally, a major hindrance to the in vivo experiments was the thermal influence of
probe contact on the skin. The thermal properties of the probe are different from those in
the skin, and contact between the two causes the temperature of the skin being
interrogated to return to body temperature more rapidly than the tissue surrounding it.
The method of temperature measurement further augments this problem, as the thermal
camera interrogates a spot directly adjacent to, but not underneath, the probe. Thus, the
skin being spectroscopically interrogated may be at a different temperature than the skin
being thermally interrogated. The best solution to this problem would be to employ a
non-contact method of spectroscopic measurement. A fluorescence imaging system could
be coupled to the thermal camera in much the same way as the spectroscopic system used
in this study. This approach would not cause any undesirable temperature changes due to
probe contact.

63
Bibliography
1. Lakowicz, J.R. and B.R. Masters, Principles of Fluorescence Spectroscopy, Third
Edition. Journal of Biomedical Optics, 2008. 13(2): p. 029901-2.