variation in the yearly and seasonal abundance of juvenile...
TRANSCRIPT

VARIATION IN THE YEARLY AND SEASONAL ABUNDANCE OF JUVENILE ATLANTIC SALMON IN A LONG-TERM MONITORING PROGRAMMEMethodology, status of stocks and reference points
EERONIEMELÄ
Finnish Game and FisheriesResearch Institute,
Department of Biology,University of Oulu
OULU 2004


EERO NIEMELÄ
VARIATION IN THE YEARLY AND SEASONAL ABUNDANCE OF JUVENILE ATLANTIC SALMON IN A LONG-TERM MONITORING PROGRAMMEMethodology, status of stocks and reference points
Academic Dissertation to be presented with the assent ofthe Faculty of Science, University of Oulu, for publicdiscussion in Kuusamonsal i (Auditorium YB210),Linnanmaa, on May 28th, 2004, at 12 noon.
OULUN YLIOPISTO, OULU 2004

Copyright © 2004University of Oulu, 2004
Reviewed byProfessor R. John GibsonDoctor Lars Petter Hansen
ISBN 951-42-7369-9 (nid.)ISBN 951-42-7370-2 (PDF) http://herkules.oulu.fi/isbn9514273702/
ISSN 0355-3191 http://herkules.oulu.fi/issn03553191/
OULU UNIVERSITY PRESSOULU 2004
Niemelä, Eero, Variation in the yearly and seasonal abundance of juvenile Atlanticsalmon in a long-term monitoring programme. Methodology, status of stocks andreference pointsFinnish Game and Fisheries Research Institute, River Tenojoki Fisheries Research Station, , FIN-99980 Utsjoki, Finland, Department of Biology, University of Oulu, P.O.Box 3000, FIN-90014University of Oulu, Finland 2004Oulu, Finland
AbstractThe long-term monitoring programme for the River Teno Atlantic salmon (Salmo salar L.) stocks hascovered the juvenile densities (25 yr) and the abundance and characteristics of the returning adults(31 yr). The feasibility of the programme was examined by studying the interrelationships betweenthe yearly catches and juvenile salmon densities, performance and reliability of the electrofishingmethod, and the effects of fishing regulations on the salmon stocks. Finally, juvenile salmonabundances were related to the available fluvial habitat and reference levels were defined by usinghabitat models.
Extensive seasonal variation in juvenile salmon density was apparent. The densities of fry and parrshowed an increase from early summer towards late August and a subsequent decline towards theautumn. Long-term electrofishing monitoring is recommended to be carried out in as standardized aform as possible in order to reduce variations in catchability.
Over the 25-year monitoring period, the abundance of parr (1+) increased in one sampling sitecluster out of nine clusters and declined in one cluster. Fry densities increased in seven clusters.Juvenile densities exhibited considerable temporal and spatial variation. Similarly, the salmoncatches varied extensively, and the numbers of 1-2SW salmon and previous spawners increased.
The numbers of 1–2SW female salmon in the catches and the subsequent juvenile densities weresignificantly related, as regression models explained 19–44% of the variation in juvenile abundance.The juvenile monitoring allows evaluation of the relative spawner abundance in preceding years,confirming the information provided by catch statistics.
Juvenile salmon densities explained 23–41% of the variation in subsequent 1–2SW salmoncatches. Significant correlations were detected with a lag of one year between the subsequent sea-agegroups of salmon in the catches. Thus, these relationships can be used for forecasting future salmonabundances.
Large areas of high habitat quality in the River Teno system fail to meet their expected juveniledensities, and factors others than physical habitat characteristics, such as a lack of spawners, restrictthe juvenile abundance. More than 50% of the permanent sampling sites where habitat would predicthigh densities (≥ 50 parr per 100 m2) had observed densities in the mid (10–49) or low densitycategory (< 10).
It was expected that the densities should increase after regulatory measures implemented in1989–1990, but results indicate that the reference levels of parr densities have not been attained andthe densities have not increased, whereas a general increase in salmon fry densities was detected.Nonetheless, the management measures have succeeded in maintaining the River Teno salmonstocks, which still today enable and support diversified fisheries.
Keywords: density, electrofishing, long-term monitoring, Salmo salar, spatial and temporalvariability, trends

Acknowledgements
This work was carried out in subarctic northern Finland at the Finnish Game and Fisher-ies Research Institute’s River Tenojoki Research Station in Utsjoki. At the beginning oflong-term monitoring of the status of Atlantic salmon stocks during the 1980s, studieswere conducted from the Kevo Subarctic Station of the University of Turku. I wish tohonour Professor Paavo Kallio (in memorandum), the founding father of the Kevo Sta-tion, for his encouraging support in my research on Atlantic salmon biology with the aimof finding ecological arguments for maintaining and enhancing the valuable salmonresources in the River Teno system. I also thank Matti Sulkinoja, Saini Heino, Heli Hur-me, Lasse Iso-Iivari, Ritva Kyrö and Heikki Nurminen at the Kevo station. I am indebtedto Professor Petri Suuronen, the Head of Fisheries Research of the Finnish Game andFisheries Research Institute, for allowing me the time to write this thesis. The long-termmonitoring of juvenile salmon densities became possible through the fisheries agreementbetween Finland and Norway in 1979, which defined the obligation to assess the status ofsalmon stocks. I thank Professor Pekka Tuunainen for his help in establishing long-termresearch within the River Teno system. Through all these years the Ministry of Agricul-ture and Forestry provided funding and officials Harri Dahlström, Jouni Kitti, Pekka Nis-kanen, Pentti Munne and Raimo Ruokonen took good care of the continuation of theyearly funding. Many thanks go to Eero Kekomäki for his encouraging viewpoints andespecially for his opinion that successful regulatory management needs high quality dataand long-term research. I also thank Sirkka-Liisa Vuomajoki at the employment agencyof the Utsjoki municipality for offering considerable financial support to carry out exten-sive fieldwork and laboratory analyses. Local fishermen in the valleys of the River Tenosystem helped in the collection of biological samples from their salmon catches, forwhich I am grateful to them all. I thank Tom Clayhills from the School of Fisheries inParainen for his help in financing and delivering eager students to participate in the elec-trofishing. My good colleague and my very best friend in Norway, Kjell Moen (in memo-randum), gave great support and high priority to cooperation and he also financed the col-lection of biological material with the aim of better understanding the ecology of ourcommon salmon resource in the boundary river. I thank Sturla Brørs and Bente Chris-tiansen at the Environmental Office of County Governor in Finnmark, Norway, for theirgood cooperation and financial support. In addition, my earlier colleagues in Norway,

Anton Rikstad, Knut Kristoffersen and Brynjulf Ferman, are owed my deepest thanks. Ithank Roy Siddall for language revision. A lot of eager researchers, students and assis-tants have electrofished hard and carefully when studying juvenile salmon within theRiver Teno system. I would especially like to thank Veikko Aikio, Pauli Aro, Heikki andMikko Erkinaro, Säde Guttorm, Jari Haantie, Reijo Magga, Roy Lynn McComas, TeemuMäkinen, Jorma Ollila, Tero Saari, Ari Savikko, Arto Selkee, Markku Seppänen, AnttiSujala and Asko Suomenrinne for their help. At the Tenojoki Research Station I thankEsa Hassinen, Jorma Kuusela, Pirkko Kärki, Matti Kylmäaho and Maija Länsman fortheir kind help through all these years. I especially thank my co-authors, Professor Jaak-ko Erkinaro, my supervisor, and researcher Markku Julkunen, for their enthusiasm andsupport through all these years.
Oulu, March 2004 Eero Niemelä

List of original papers
The thesis is based on the following original papers, which are referred to in the text bytheir Roman numerals:
I Niemelä E, Julkunen M & Erkinaro J. (1999) Revealing trends in densities of juve-nile Atlantic salmon, Salmo salar L., in the subarctic River Teno using cluster analy-sis on long-term sampling data. Fish Manage Ecol 6: 207–220.
II Niemelä E, Julkunen M & Erkinaro J. (1999) Densities of the juvenile Atlanticsalmon (Salmo salar L.) in the subarctic Teno River watercource, northern Finland.Bor Envir Res 4: 125–136.
III Niemelä E, Julkunen M & Erkinaro J. (2000) Quantitative electrofishing for juvenilesalmon densities: assessment of the catchability during a long-term monitoring pro-gramme. Fish Res 48: 15–22.
IV Niemelä E, Julkunen M, Erkinaro J & Mäkinen TS. (2001) Seasonal variation indensity of juvenile Atlantic salmon in fluvial shoreline habitats of a large subarcticriver. J Fish Biol 59: 555–568.
V Niemelä E, Erkinaro J, Julkunen M & Hassinen E. Do salmon catches predict subse-quent juvenile abundance or vice versa? Perspectives from a long-term monitoringprogramme. Manuscript.
VI Erkinaro J, Niemelä E, Julkunen M & Mäki-Petäys A Evaluating the use of habitatmodels in defining reference levels for juvenile Atlantic salmon abundance. Manu-script.


Contents
Abstract Acknowledgements List of original papers Contents 1 Introduction . . . . . . . . . . . . . . . . . . . . . . . . . . . . . . . . . . . . . . . . . . . . . . . . . . . . . . . . 112 Material and methods . . . . . . . . . . . . . . . . . . . . . . . . . . . . . . . . . . . . . . . . . . . . . . . . 15
2.1 Geographical location and natural conditions of the River Teno system . . . . . 152.2 The Atlantic salmon . . . . . . . . . . . . . . . . . . . . . . . . . . . . . . . . . . . . . . . . . . . . . 172.3 The Atlantic salmon stocks in the River Teno system and the
fisheries exploiting them . . . . . . . . . . . . . . . . . . . . . . . . . . . . . . . . . . . . . . . . . 182.4 Field methods and collection of samples . . . . . . . . . . . . . . . . . . . . . . . . . . . . . 272.5 Mathematical methods . . . . . . . . . . . . . . . . . . . . . . . . . . . . . . . . . . . . . . . . . . . 29
3 Results and discussion . . . . . . . . . . . . . . . . . . . . . . . . . . . . . . . . . . . . . . . . . . . . . . . . 313.1 Monitoring juvenile abundance with electrofishing in the River Teno
system in assessing the status of salmon stocks . . . . . . . . . . . . . . . . . . . . . . . . 313.2 Abundance of juvenile salmon . . . . . . . . . . . . . . . . . . . . . . . . . . . . . . . . . . . . . 343.3 Seasonal variation in the abundance of juvenile salmon . . . . . . . . . . . . . . . . . 363.4 Relationships between catches and juvenile densities and status
of salmon stocks . . . . . . . . . . . . . . . . . . . . . . . . . . . . . . . . . . . . . . . . . . . . . . . . 373.5 Reference levels for juvenile Atlantic salmon abundance . . . . . . . . . . . . . . . . 41
4 Management implications and research recommendations . . . . . . . . . . . . . . . . . . . . 43References


1 Introduction
The wild Atlantic salmon (Salmo salar L.) still has a special position among fish speciesas a profitable target for professional fishermen and a desirable objective for recreationalfishermen. Wild salmon also have aesthetic significance, being a symbol of undamagedriver habitats and of unpolluted water. Healthy wild salmon stocks also offer a source ofgenetic biodiversity when maintaining and developing the quality of salmon used inaquaculture. Throughout Europe and North America, recreational salmon fishing hasdeveloped into an important economy for landowners and tourism entrepreneurs. How-ever, the Atlantic salmon as a species is now extinct, or in a critical condition, in over27% of the salmon rivers of the world, and endangered or vulnerable in a further 30 rivers(WWF 2001). During recent decades, salmon stocks have widely declined or being extir-pated due to overfishing and habitat degradation in the North Atlantic region (Saksgård &Heggberget 1990, Parrish et al. 1998) or due to a lethal parasite, Gyrodactylus salaris, inNorway (Jensen & Saksgård 1987). The increasing numbers of escaped farmed salmonwithin the distribution area of wild salmon, associated with an increase in salmon cageculture, have further affected wild salmon populations and negatively impacted on theconservation of local stocks and their special characteristics (Youngson et al. 1998,McDowell 2002, McGinnity et al. 2003). Escaped salmon comprise from about one-thirdto more than 80% of the spawning stock of many southern and western Norwegian rivers(Fiske & Lund 1999).
During the last 20 years, salmon fishing has undergone significant changes at sea inthe Northeast Atlantic and in rivers flowing into it. In spite of many plans directed at con-serving especially multi-sea-winter (MSW) salmon stocks, catches of Atlantic salmonhave continued to decline throughout most of the species' range in the North Atlantic(ICES 2002). Concerns relating to the declining salmon abundance and internationalresponsibility for the highly exploited salmon stocks at sea resulted in the establishmentof the North Atlantic Salmon Conservation Organization (NASCO) in 1984 (Windsor &Hutchingson 1994). Through this convention, salmon fishing on the high seas has beenclosed and is only permitted in the Faeroes fishing zone in the Northeast Atlantic accord-ing to yearly catch limits. Norway banned drift net fishing in coastal areas in 1989 withthe aim of strengthening the weakened salmon stocks (ICES 1990). However, at the sametime as salmon fishing at sea was regulated or even closed in the 1980s and 1990s, the

12
culture of salmon in sea cages increased tremendously. The increased cage culture andlow price of farmed salmon has resulted in a low price for wild salmon, which in turn canreduce their exploitation at sea. It is most probable that the commercial fishing effort forsalmon at sea will decline during the next decades, coinciding with the expansion ofaquaculture. The decline of salmon fishing in the Faeroes since the mid-1990s (ICES2002) is an example of a fishery at sea becoming unprofitable following the start ofsalmon cage culture in the Faeroes and the decline in the price of wild salmon.
Increasing salmon cage culture will most likely increase the number of escapedsalmon. It is estimated that some two million salmon escape each year in the North Atlan-tic region, accounting for c. 50% of the total pre-fishery abundance of wild salmon in thearea (see McGinnity et al. 2003). Concern has been raised about the potential detrimentalgenetic and other changes that may take place in wild populations when escaped farmedsalmon enter rivers and interact with wild salmon.
The objectives of the monitoring of salmon stocks can be divided into two categories:scientific and management. Scientific objectives focus entirely on learning and develop-ing an understanding of the dynamics of the salmon stocks, and monitoring programmesdesigned to aid management provide information that is useful in making informed man-agement decisions (Yoccoz et al. 2001). To succeed in the management of wild salmonstocks with the aim of sustaining and enhancing them, it is necessary to obtain thoroughlong-term data on the stocks to help in understanding the stock dynamics. Typical featuresof most salmon stocks include yearly fluctuations in the abundance of returning salmonand the relative proportions of different sea-age groups (Gee & Miller 1980). These indi-cate the effects of environmental changes at sea, which are largely responsible for regulat-ing salmon stock dynamics (Scarnecchia et al. 1989a,b, Dempson 1992, Friedland &Reddin 1993, Friedland et al. 1993, Reddin & Friedland 1993, Antonsson et al. 1996,Friedland 1998, Friedland et al. 1998). Monitoring must therefore be long-term to iden-tify trends in measured variables because salmon stocks are renewed slowly, especially inthe northern part of the distribution area. In addition, natural long-term trends in the abun-dance of salmon stocks and environmental fluctuations can mask the effects of regulatorymeasures on both catches and juvenile production.
Valuable indicators of salmon stocks include spawning escapement, the age distribu-tion of spawners, the number of smolts migrating to the sea and juvenile abundance. Inlarge rivers, long-term monitoring of the size of salmon stocks is difficult. In most cases,there are no possibilities to accurately estimate the number of ascending salmon or thespawning escapement, and the reported catch is therefore used as an index of abundanceand spawning escapement (Chadwick 1985, Saltveit 1996). It is also generally acceptedthat the catch data describes the fluctuations and development of fisheries (see referencesin Hansen 1988). Managers would like to know the yearly number of smolts migratingfrom rivers, indicating the earlier spawning escapement. Smolt estimates would alsoallow the prediction of trends in subsequent adult catches. In the case of low smolt pro-duction, managers have a possibility to regulate the fishery in advance. However, thenumber of rivers in the North Atlantic in which long-term smolt counting takes place islimited to a small number of index rivers, mainly with 1SW salmon stocks (ICES 2002).
Electrofishing is a widely employed research and monitoring technique used to detectchanges in abundance as an outcome of fishery management strategies or in the recruit-ment of the Atlantic salmon at different spawning levels (Chadwick & Randall 1986), or
13
to monitor long-term trends in juvenile fish production as an index of changes in naturalconditions (Bohlin et al. 1989). A significant positive relationship has been shownbetween the abundance index of salmon fry and the subsequent smolt production,although the predictive ability decreased as smolt age increased, suggesting the influenceof density-independent mortality (Crozier & Kennedy 1995). Thus, juvenile salmon den-sities can provide a direct measure of juvenile salmon production that can be converted tosmolt output estimates if necessary (ICES 2003b).
The monitoring of juvenile salmon densities can include specification of the referencelevels, i.e. the target abundance of juvenile salmon, which are based on the available habi-tat and can be defined by the site, habitat type or river (VI). However, the exact targetabundance or the maximum density (reference points) in sites or habitats might be diffi-cult to determine because densities are temporary and fluctuate throughout the summer(IV, Saksgård et al. 1992). Juvenile salmon density estimates allow evaluation of the rela-tive spawner abundance in previous years, and confirmation of the stock status informa-tion provided by catch statistics. On the other hand, significant deviations in juvenileabundance from what is predicted by the catch estimate would indicate changes in theexploitation rate in river fisheries.
The large River Teno system in the northernmost distribution area of the Atlanticsalmon is at present probably the most productive Atlantic salmon river in the world interms of the annual run and catches of wild salmon. The river valleys and aquatic habitatsare virtually pristine and the only notable human impact affecting the salmon stocks isfishing. In addition, variation in natural mortality causes fluctuation in the salmon stocks(Dempson 1992).
Under a bilateral agreement between Finland and Norway regulating the fishery in theRiver Teno with the objective of maintaining and enhancing wild salmon stocks, a jointmonitoring programme on the status and development of the salmon stocks was initiatedat the end of the 1970s. The long term monitoring programme includes annual collectionof catch statistics and catch samples and estimation of juvenile salmon abundance byelectrofishing. To monitor the annual and long-term variation in densities of juvenilesalmon, permanent electrofishing sites have been sampled annually in the main stem ofthe River Teno and its two major tributaries, Utsjoki and Inarijoki, since 1979. Such along time series in juvenile salmon monitoring is rare.
In this thesis the results of the long-term monitoring of the juvenile salmon densities inthe River Teno system are analysed (I, II) and factors affecting the performance and reli-ability of the electrofishing method are assessed (III, IV). Moreover, variation in juvenilefish production was expected to reflect changes in salmon fishery management strategiesthat took place in 1989–1990 (see above; I, II, V). Juvenile salmon abundances are alsorelated to the available fluvial habitat by using habitat models in defining reference levels(VI). As the monitoring programme also includes assessment of the adult salmon returnsthrough catch statistics, the possibility of using the juvenile data to predict subsequentcatches, and the use of adult salmon estimates in predicting subsequent juvenile abun-dance, is studied (V).
The main questions addressed in this study were:1. Do long-term changes in juvenile salmon abundance take place in the River Teno sys-
tem and could they be linked with major changes in salmon fishing regulations in theriver and at sea?

14
2. Are the electrofishing methods used in the long-term monitoring reliable?3. Are the long-term catch and juvenile estimates linked, i.e. is it possible to use juvenile
salmon abundance as a predictor of subsequent catches, or catches in predicting sub-sequent juvenile abundance?
4. Are the juvenile salmon densities in the River Teno system comparable to the estima-ted production capacity of the available habitat?
2 Material and methods
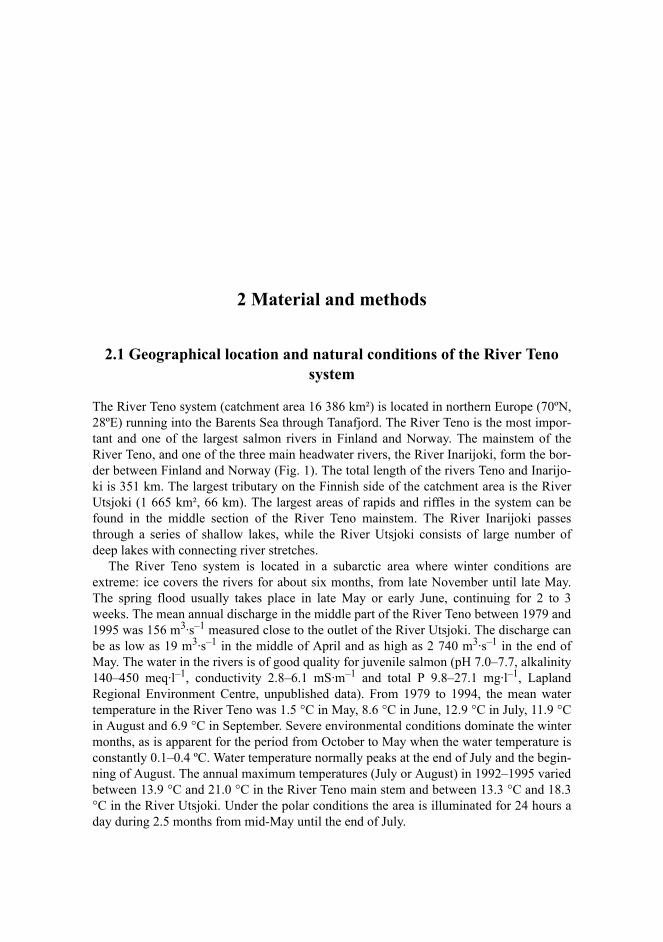
2.1 Geographical location and natural conditions of the River Teno system
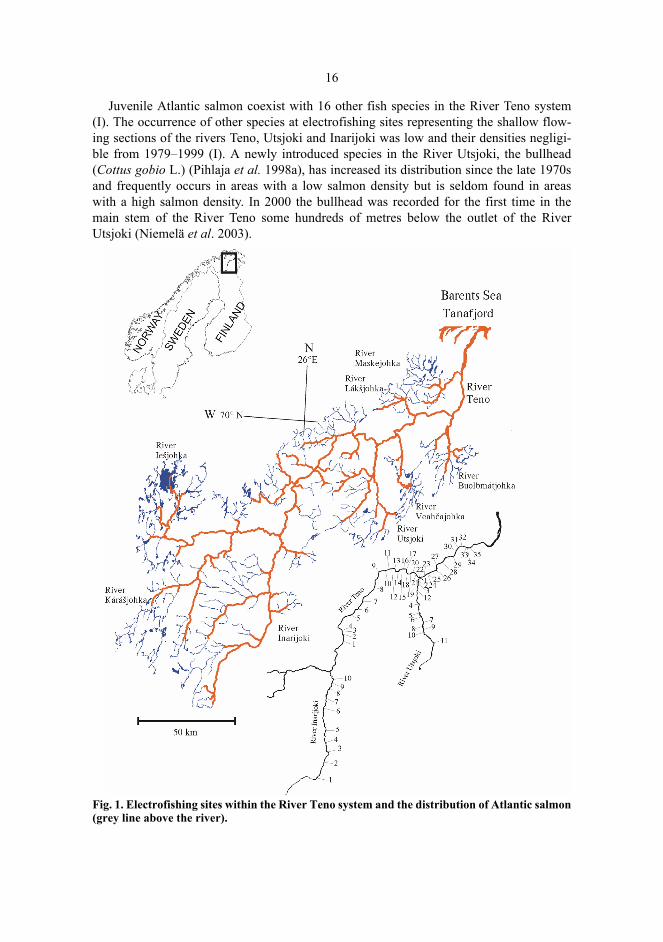
The River Teno system (catchment area 16 386 km²) is located in northern Europe (70ºN,28ºE) running into the Barents Sea through Tanafjord. The River Teno is the most impor-tant and one of the largest salmon rivers in Finland and Norway. The mainstem of theRiver Teno, and one of the three main headwater rivers, the River Inarijoki, form the bor-der between Finland and Norway (Fig. 1). The total length of the rivers Teno and Inarijo-ki is 351 km. The largest tributary on the Finnish side of the catchment area is the RiverUtsjoki (1 665 km², 66 km). The largest areas of rapids and riffles in the system can befound in the middle section of the River Teno mainstem. The River Inarijoki passesthrough a series of shallow lakes, while the River Utsjoki consists of large number ofdeep lakes with connecting river stretches.
The River Teno system is located in a subarctic area where winter conditions areextreme: ice covers the rivers for about six months, from late November until late May.The spring flood usually takes place in late May or early June, continuing for 2 to 3weeks. The mean annual discharge in the middle part of the River Teno between 1979 and1995 was 156 m3·s–1 measured close to the outlet of the River Utsjoki. The discharge canbe as low as 19 m3·s–1 in the middle of April and as high as 2 740 m3·s–1 in the end ofMay. The water in the rivers is of good quality for juvenile salmon (pH 7.0–7.7, alkalinity140–450 meq·l–1, conductivity 2.8–6.1 mS·m–1 and total P 9.8–27.1 mg·l–1, LaplandRegional Environment Centre, unpublished data). From 1979 to 1994, the mean watertemperature in the River Teno was 1.5 °C in May, 8.6 °C in June, 12.9 °C in July, 11.9 °Cin August and 6.9 °C in September. Severe environmental conditions dominate the wintermonths, as is apparent for the period from October to May when the water temperature isconstantly 0.1–0.4 ºC. Water temperature normally peaks at the end of July and the begin-ning of August. The annual maximum temperatures (July or August) in 1992–1995 variedbetween 13.9 °C and 21.0 °C in the River Teno main stem and between 13.3 °C and 18.3°C in the River Utsjoki. Under the polar conditions the area is illuminated for 24 hours aday during 2.5 months from mid-May until the end of July.
16
Juvenile Atlantic salmon coexist with 16 other fish species in the River Teno system(I). The occurrence of other species at electrofishing sites representing the shallow flow-ing sections of the rivers Teno, Utsjoki and Inarijoki was low and their densities negligi-ble from 1979–1999 (I). A newly introduced species in the River Utsjoki, the bullhead(Cottus gobio L.) (Pihlaja et al. 1998a), has increased its distribution since the late 1970sand frequently occurs in areas with a low salmon density but is seldom found in areaswith a high salmon density. In 2000 the bullhead was recorded for the first time in themain stem of the River Teno some hundreds of metres below the outlet of the RiverUtsjoki (Niemelä et al. 2003).
Fig. 1. Electrofishing sites within the River Teno system and the distribution of Atlantic salmon(grey line above the river).
17
2.2 The Atlantic salmon
The Atlantic salmon (Salmo salar L.) is typically an anadromous fish species that repro-duces and spends juvenile phases in freshwater and grows to reach maturity at sea (Jones1959, Thorpe 1988, Mills 1989, Thorpe 1994). Freshwater residency provides a refugefrom potential predators and relatively stable survival conditions for eggs and juveniles(Chaput et al. 1998). There are also some non-anadromous populations, land-lockedsalmon, that have become isolated from the anadromous salmon populations, such as dur-ing the period of rapid land-upheaval after the last ice age, and they have adapted tospending their entire life in freshwater (Berg 1985 and references therein). The Atlanticsalmon shows remarkable plasticity within and between populations in its reproductivelife cycle in terms of the age at sexual maturity, the age at which the juveniles migrate tosea, the years spent at sea, and the ability to recondition to undergo successive reproduc-tion (Saunders & Schom 1985).
In Atlantic salmon, males and females have adopted different life history strategies interms of the age at sexual maturation. There are certain special characteristics indicatingstrong adaptation to various environments and the plasticity of life history strategies, e.g.the early maturation of juveniles before seaward migration to form so-called precociousmales, which are usually found in all salmon populations (Jones 1959, Thorpe & Morgan1980, Saunders et al. 1982). In the River Teno system, precocious males comprise 5–10%of the population and this phenomenon has been detected in all age groups between 1–6years (Elo et al. 1995, Heinimaa & Erkinaro 2004). Some male parr mature repeatedly,while others mature once or not at all (Saunders & Schom 1985). Precocious females arerare (Bagliniere & Maisse 1985) and are not typically found in northern salmon popula-tions.
The juvenile period lasts 1–8 years before transition to the smolt stage (Power 1981).The freshwater growth rate is lower at higher latitudes (Power 1981, L’Abee-Lund et al.1989, Metcalfe & Thorpe 1990), resulting in a greater seaward migration age (Dahl 1910,Prouzet 1990). In southern distribution areas under optimal growing conditions, juvenilesgenerally migrate to the sea after a one-summer residency in freshwater. For example, themean smolt age range is between 1 and 1.4 years in some salmon rivers in France(Prouzet 1990), whereas in northern areas juvenile salmon generally reach the migrationphase after 3–5 years in the river (Økland et al. 1993, Niemelä et al. 2000). Under condi-tions of extreme cold, juveniles need up to 7–8 years before smoltification, as in UngavaBay in Northern Canada (Power 1969), glacial rivers in Norway (Jensen & Johnsen1986), the Russian Kola Peninsula (Kuzmin & Smirnov 1982) and also in some parts ofthe River Teno (Englund et al. 1999, Niemelä et al. 2000).
The sea migration takes 1–5 years before salmon reach the age and size of maturity atwhich homing can take place. Salmon tend to return to their natal river (Hansen & Jons-son 1994) and even to the same spawning sites within a watershed that they occupied asjuveniles (Heggberget et al. 1986). However, homing is not perfect, and some salmonstray into foreign rivers where they may spawn and produce progeny (e.g., Mills 1989).Salmon usually spawn in the year when homing takes place (Jones 1959), but in somecases so-called late running salmon first overwinter in freshwater and then reproduce aftera one and a half year stay in the river, as occurs in the rivers Ponoi (Whoriskey et al.1996) and Varzuga (Lysenko 1997) in the Kola Peninsula and in some rivers in Scotland
18
(Shearer 1992). Such late-running salmon are also common in the River Teno, but theircontribution to juvenile production is unknown. Some salmon survive spawning andeither return to the sea soon afterwards in the autumn (Jonsson et al. 1991), or spend theentire winter in freshwater and then migrate to sea with the spring flood, as in the riversAlta (Berg et al. 1988) and Teno (Niemelä et al. 2000). Survival following the firstspawning and subsequent repeat spawning enables a particular year class to geneticallycontribute to the salmon stock over a number of years, as some salmon may spawn asmany as six times (Ducharme 1969), and in the River Teno system up to four times.
The total salmon catch in the North Atlantic has markedly declined since the beginningof the 1970s, from 11 000 tonnes to 3000 tonnes in 2002, which was amongst the loweston record, although catches in several countries were above the 5 year and 10 year aver-ages (ICES 2002). The reduction in catches in recent years has largely resulted from alower exploitation rate within the high-seas area of fisheries jurisdiction of NASCO (theNorth Atlantic Salmon Conservation Organization), and can also be accounted for bymanagement plans that have reduced the fishing effort in the home waters of severalcountries. The pre-fishery abundance of salmon at sea has also markedly declined, indi-cating drastic changes in marine survival (ICES 2002). However, the pre-fishery abun-dance of multi-sea-winter salmon, especially in Northern Europe, has slightly increased inrecent years (ICES 2002). The growth in salmon aquaculture in the North Atlantic mayalso have affected the decline in commercial fishing. Fluctuations in salmon catches canbe substantial and commonly occur over wide geographical areas (Dempson et al. 1998).This oscillation can follow a longer cycle of 20–30 years (Bielak & Power 1986) or ashorter cycle of between 8 and 9 years, as in the north-eastern rivers Teno and Näätämö-joki.
2.3 The Atlantic salmon stocks in the River Teno system and the fisheries exploiting them
The River Teno salmon show very diverse life history traits, including exceptionally largevariation in the freshwater residence time, age at maturity and the extent of ocean migra-tion. There are 28 smolt age (2–8) and sea age (1–5) combinations for virgin salmon and68 combinations of previous spawning salmon. This variation is among the widest in asingle river system in the distribution area of the species, if not the widest. Salmon catch-es mainly consist of virgin salmon, but repeat spawners contribute a significant supple-ment to the catch, especially at the beginning of the season and in the spawning escape-ment (Figs. 4 and 7, Niemelä et al. 2000).
The considerable variability in life history, i.e. individuals from a given year class canspawn during several years and can breed with salmon from other year-classes, is a safe-guard against occasional reproductive failure, since nonspawning individuals in the riveror at sea could spawn in subsequent years (e.g., Saunders & Schom 1985). This type oflife history strategy is ecologically necessary for the survival of salmon, especially in riv-ers where the exploitation is high, as in the River Teno system, or where extreme environ-mental drawbacks such as the destruction of spawning grounds by ice blocks during the
19
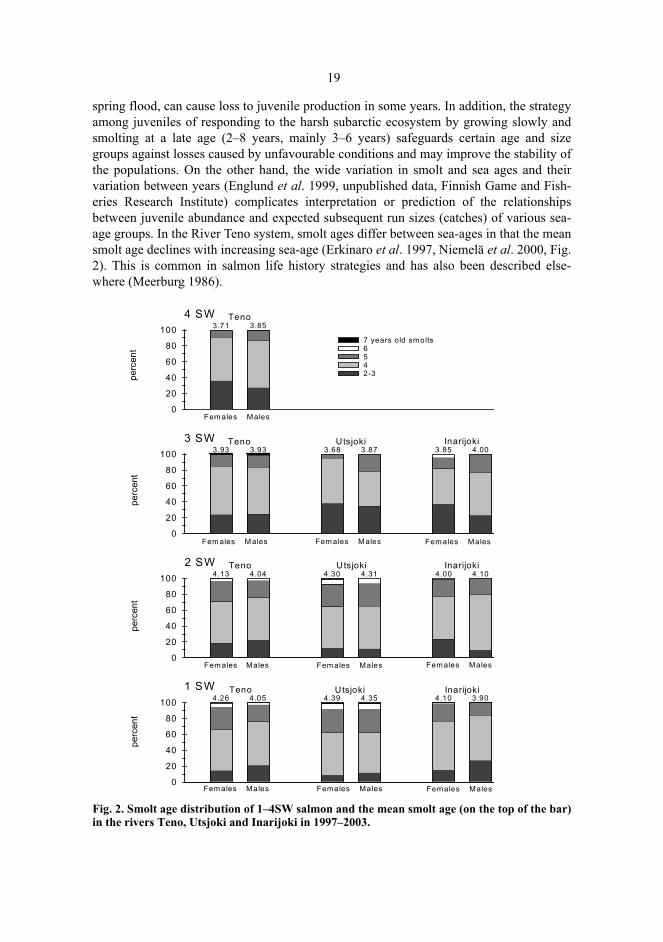
spring flood, can cause loss to juvenile production in some years. In addition, the strategyamong juveniles of responding to the harsh subarctic ecosystem by growing slowly andsmolting at a late age (2–8 years, mainly 3–6 years) safeguards certain age and sizegroups against losses caused by unfavourable conditions and may improve the stability ofthe populations. On the other hand, the wide variation in smolt and sea ages and theirvariation between years (Englund et al. 1999, unpublished data, Finnish Game and Fish-eries Research Institute) complicates interpretation or prediction of the relationshipsbetween juvenile abundance and expected subsequent run sizes (catches) of various sea-age groups. In the River Teno system, smolt ages differ between sea-ages in that the meansmolt age declines with increasing sea-age (Erkinaro et al. 1997, Niemelä et al. 2000, Fig.2). This is common in salmon life history strategies and has also been described else-where (Meerburg 1986).
Fig. 2. Smolt age distribution of 1–4SW salmon and the mean smolt age (on the top of the bar)in the rivers Teno, Utsjoki and Inarijoki in 1997–2003.
1 SW
0
20
40
60
80
100
2 SW
0
20
40
60
80
100
3 SW
0
20
40
60
80
100
4 SW
0
20
40
60
80
100
Teno Utsjoki Inarijoki
Teno Utsjoki Inarijoki
Teno Utsjoki Inarijoki4.054.26
4.13
3.93
3.71
4.04
3.93
3.85
4.35
4.31
3.87
4.39
4.30
3.68
3.90
4.10
4.00
4.10
4.00
3.85
Teno
Fem ales Males
Fem ales Males Fem ales Males Fem ales Males
Fem ales Males Females Males Females Males
Fem ales M ales Fem ales Males Fem ales Males
2-34567 years old smolts
perc
ent
perc
ent
perc
ent
perc
ent
20
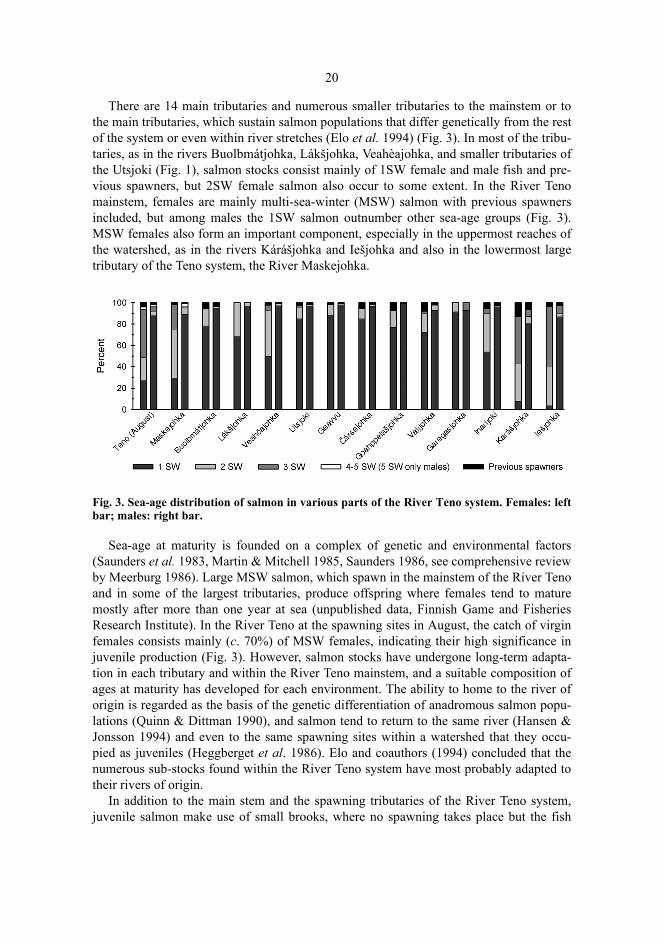
There are 14 main tributaries and numerous smaller tributaries to the mainstem or tothe main tributaries, which sustain salmon populations that differ genetically from the restof the system or even within river stretches (Elo et al. 1994) (Fig. 3). In most of the tribu-taries, as in the rivers Buolbmátjohka, Lákšjohka, Veahèajohka, and smaller tributaries ofthe Utsjoki (Fig. 1), salmon stocks consist mainly of 1SW female and male fish and pre-vious spawners, but 2SW female salmon also occur to some extent. In the River Tenomainstem, females are mainly multi-sea-winter (MSW) salmon with previous spawnersincluded, but among males the 1SW salmon outnumber other sea-age groups (Fig. 3).MSW females also form an important component, especially in the uppermost reaches ofthe watershed, as in the rivers Kárášjohka and Iešjohka and also in the lowermost largetributary of the Teno system, the River Maskejohka.
Fig. 3. Sea-age distribution of salmon in various parts of the River Teno system. Females: leftbar; males: right bar.
Sea-age at maturity is founded on a complex of genetic and environmental factors(Saunders et al. 1983, Martin & Mitchell 1985, Saunders 1986, see comprehensive reviewby Meerburg 1986). Large MSW salmon, which spawn in the mainstem of the River Tenoand in some of the largest tributaries, produce offspring where females tend to maturemostly after more than one year at sea (unpublished data, Finnish Game and FisheriesResearch Institute). In the River Teno at the spawning sites in August, the catch of virginfemales consists mainly (c. 70%) of MSW females, indicating their high significance injuvenile production (Fig. 3). However, salmon stocks have undergone long-term adapta-tion in each tributary and within the River Teno mainstem, and a suitable composition ofages at maturity has developed for each environment. The ability to home to the river oforigin is regarded as the basis of the genetic differentiation of anadromous salmon popu-lations (Quinn & Dittman 1990), and salmon tend to return to the same river (Hansen &Jonsson 1994) and even to the same spawning sites within a watershed that they occu-pied as juveniles (Heggberget et al. 1986). Elo and coauthors (1994) concluded that thenumerous sub-stocks found within the River Teno system have most probably adapted totheir rivers of origin.
In addition to the main stem and the spawning tributaries of the River Teno system,juvenile salmon make use of small brooks, where no spawning takes place but the fish
21
enter from the spawning grounds of the main stems (Erkinaro 1995, Erkinaro et al. 1997).The growth of salmon parr is better in tributaries than the main stems (Erkinaro &Niemelä 1995), and the role of salmon production in these secondary habitats is estimatedto be notable (Erkinaro et al 1997, Erkinaro et al. 1998a). Juvenile salmon are also foundin the lakes of some tributaries, especially in the River Utsjoki (Erkinaro et al. 1995,1998b, Jørgensen et al. 1999)
To date there have been no estimates of the yearly smolt production from the entirewatershed, but it is thought vary between 1 and 1.5 million smolts.
The significance of the River Teno system to the entire wild salmon production in theregion is exceptional. The total salmon production of the River Teno system, includingboth sea and river catches and the spawning escapement, is estimated to be up to 600tonnes (NOU 1999), out of which an average of 139 tonnes has been caught annually(range 93–250 tonnes in 1972–2003). The annual salmon catch in the River Teno systemis the highest single river catch within the distribution area of Atlantic salmon, and it hasaccounted for up to 15% of all riverine Atlantic salmon harvests in Europe from 1995 to2001 and as much as 22% in 2001 (ICES 2002). The salmon catch of 213 tonnes from theRiver Teno in 2002 accounted for 33% of the total Atlantic salmon catch in all Norwegianrivers.
Since the closure of the Norwegian marine drift net fishery in 1989, salmon of theRiver Teno system have still been subjected to marine exploitation with numerous bagnets and bend nets during its feeding and homing migration along the Northern Norwe-gian coastline, including the Tanafjord just before the fish enter the river. This was clearlyindicated by smolt tagging experiments in the River Teno mainstem in the 1970s, when45% of recaptures of adult salmon were taken from the sea (10% from Tanafjord, 35%mainly in other coastal areas, unpublished data, Finnish Game and Fisheries ResearchInstitute). In Tanafjord there are approximately 300 sites designated for marine salmonfisheries with bag nets and bend nets (Henriksen & Moen 1997). These fisheries targetstocks from the River Teno and other rivers, especially those east of the River Teno (Riks-tad 1982, Erkinaro et al. 1999).
There has been a steady decline in effort in the Norwegian coastal fisheries. For exam-ple, the number of gear units in operation on the northernmost coast in Finnmark hasdeclined by c. 25% over the last decade. In the Tanafjord, there were 219 bag nets andbend nets operating in the salmon fishery in 2003, whereas the annual average in 1994–1996 was 294 sets of gear. At the same time, however, the coastal salmon catches inFinnmark have roughly doubled (Sturla Brørs, County Governør in Finnmark, Norway,personal information).
Another characteristic of the Norwegian coastal fishery is its size-selectivity. Smolttagging in the 1970s indicated that marine salmon fishing at sea outside Tanafjord alsomainly targeted 2SW salmon (58%) and to a lesser extent 1SW (23%), 3SW (17%) and4SW (2%) salmon (unpublished data, Finnish Game and Fisheries Research Institute),which is in accordance with other studies (NOU, 1999). After the drift net fishery wasprohibited in 1989 the number of 2SW salmon increased in catches from the River Tenosystem (Fig. 4). Smolt tagging experiments indicate that coastal fishing in Tanafjordexploited more MSW salmon (2SW 35%, 3SW 20%) than small salmon (1SW 45%),while in the River Teno, 1SW, 2SW and 3SW salmon comprised 65%, 13% and 22% ofthe catch, respectively. Moreover, recent information collected in 2003 in the Tanafjord
22
and in the River Teno salmon fisheries indicates that sea fishing in coastal areas harvestsrelatively more large salmon than fishing in the River Teno. The marine exploitation rateselsewhere in the North Atlantic area also indicate that MSW salmon have especially beensubjected to excessive harvesting (NOU 1999, Dempson et al. 2001 and referencestherein).
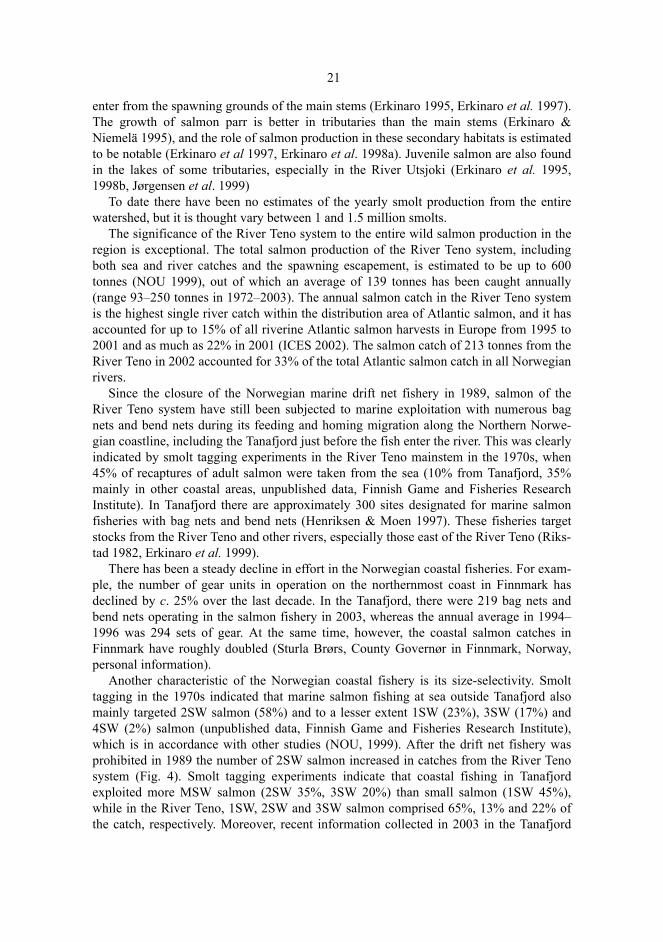
Fig. 4. Estimated number of female and male salmon caught in the River Teno system (upperfigure), and estimated number of female and male salmon caught in relation to sea-age (lowerfigure).
Despite the decline in catches within most of the salmon distribution areas, the total salm-on catch has increased within the River Teno system during last few years, as in manyother rivers in the Barents and White Sea areas, which are the northernmost distributionareas of salmon (ICES 2002). However it is notable that the catch of 1SW salmon hasespecially increased from very low numbers at the end of the 1970s and beginning of the1980s to high levels at the beginning and end of the 1990s. By contrast, the catches of3SW salmon, especially females, declined from the mid-1970s until 2000, but in 2001 itpeaked at a level as high as 11500 fish (Fig. 4).
Salmon catches in the River Teno system have fluctuated over periods of 8–9 yearsfrom 1972–2003, when statistics have been collected systematically (Figs 4 and 5). Aplausible reason for the low catches before the 1970s (Fig. 5) is the lack of precise infor-mation describing catches from the entire Teno system. However this historical catchinformation suggests that salmon populations have always been characterized by consid-erable fluctuations in abundance. The salmon catch in the River Teno system is believedto be a crude measure of the abundance of salmon stocks and partly used as such indescribing the status of stocks (e.g., ICES 2002).
1 SW 2 SW 3 SW 4-5 SW (5 SW only males) Previous spawners
Females
1975 1980 1985 1990 1995 20000
500010000150002000025000300003500040000
Males
1975 1980 1985 1990 1995 20000
500010000150002000025000300003500040000
1975 1980 1985 1990 1995 20000
10000
20000
30000
40000
50000
60000
70000
MalesFemales
Estim
ated
num
ber o
f sal
mon
in th
e ca
tch
Est
imat
ed n
umbe
r of s
alm
on in
the
catc
h
23
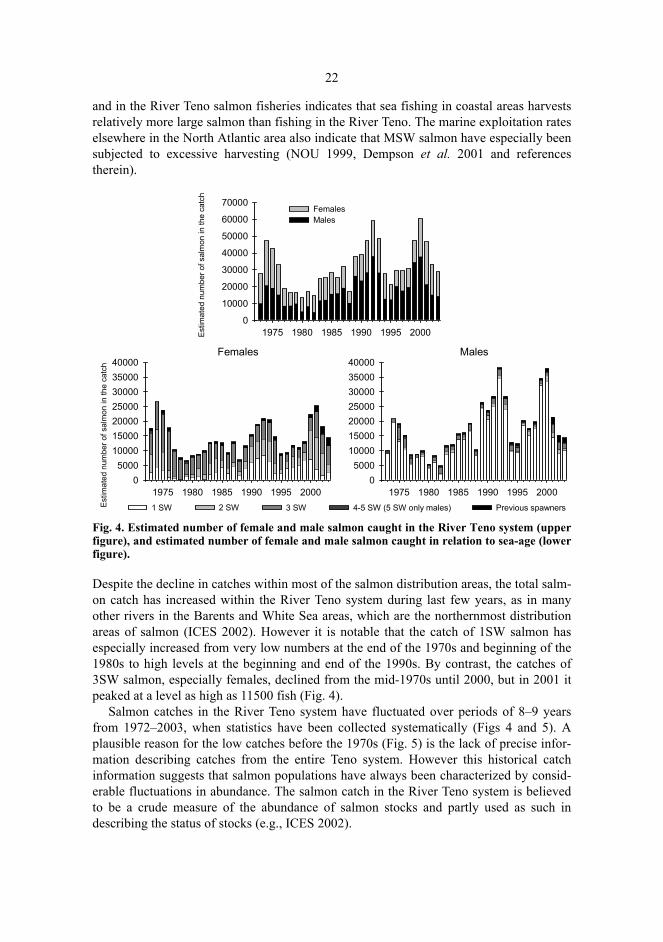
Fig. 5. The catch (kg) of salmon in the River Teno system. Catches until the year 1971 are onlypartial and include only reported catches in the Norwegian side of the river system (upperpanel). Since 1972, catches have included both Finnish and Norwegian catches. Catches until1974 are not divided according to the fishing method (black bars). The upper figure illustratescatches in the entire catchment and the lower figures catches in Finland and in Norway. (Anon.1969, Niemelä et al. 1996, Maija Länsman, Finnish Game and Fisheries Research Institute andSturla Brørs, County Governør in Finnmark, Norway, personal information).
The River Teno salmon stocks are exploited in the river using various fishing methods,including weirs, gill nets, seines, drift nets and hook and line. The net fisheries are prac-ticed by local people, mostly native Sami, and are based on special fishing rights relatedto land ownership or inherited rights. Within the entire river system, including tributaries,the average proportions of salmon (in weight) captured by different methods in 1980–2003 have been 58% for hook and line, 20% for weirs, 9% for gill nets and 13% for driftnets (Fig. 5). In both Finland and Norway the proportion of salmon caught by hook andline fishing has increased since the 1980s, whereas over the past two decades the propor-tion of fish captured by gill net fishing in Finland in drift net fishing in Norway hasdecreased (Fig. 5).
Fluctuations in the salmon catches of recreational fishermen, as in all fisheries, are atleast partly dependent on the fishing effort (Fig. 6). Because the number of recreationalfishermen is unlimited and no quota or bag limit policies are practiced either in sport fish-ing or with different net fishing methods used by local fishermen, at least some sub-stockscould be overexploited, especially when the stock abundance is at its lowest. However,there is typically a positive relationship between the salmon stock abundance and theeffort of recreational fishermen, even though their fishing effort has generally increased inlong-term (Fig. 6).
1880 1890 1900 1910 1920 1930 1940 1950 1960 1970 1980 1990 20000
50000
100000
150000
200000
250000
300000All methodsHook and lineWeirGill netWeir and gill netDrift net
Finland
1975 1980 1985 1990 1995 20000
25000
50000
75000
100000
125000
150000
175000
200000Norway
1975 1980 1985 1990 1995 20000
25000
50000
75000
100000
125000
150000
175000
200000
Cat
ch (k
g)C
atch
(kg)
24
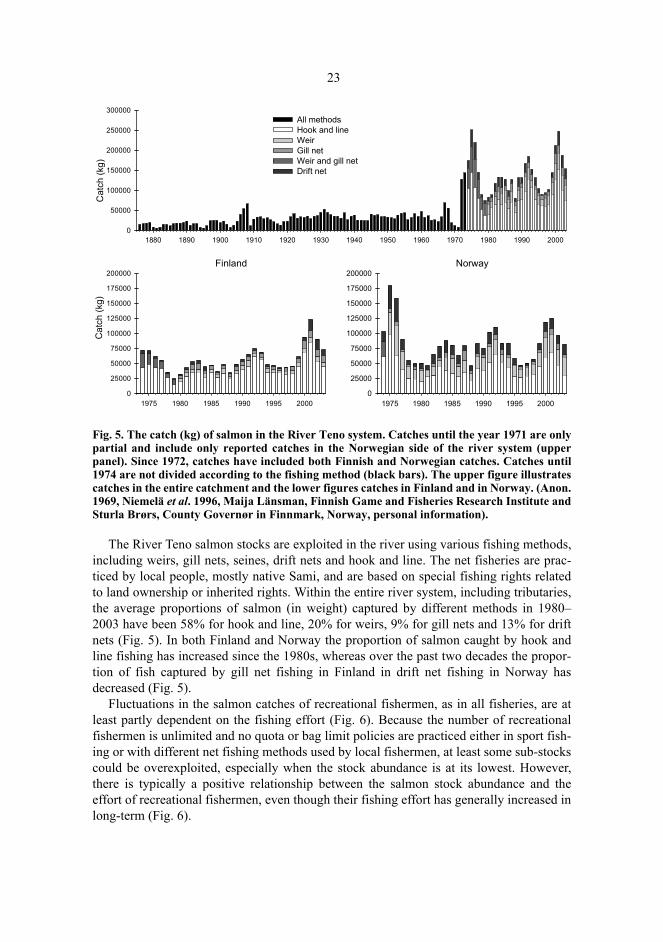
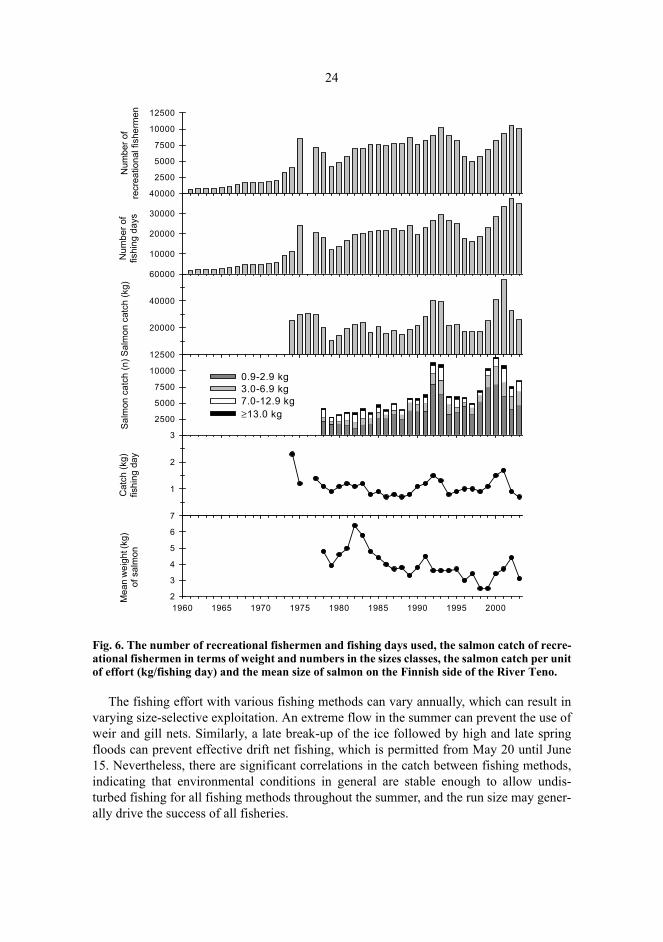
Fig. 6. The number of recreational fishermen and fishing days used, the salmon catch of recre-ational fishermen in terms of weight and numbers in the sizes classes, the salmon catch per unitof effort (kg/fishing day) and the mean size of salmon on the Finnish side of the River Teno.
The fishing effort with various fishing methods can vary annually, which can result invarying size-selective exploitation. An extreme flow in the summer can prevent the use ofweir and gill nets. Similarly, a late break-up of the ice followed by high and late springfloods can prevent effective drift net fishing, which is permitted from May 20 until June15. Nevertheless, there are significant correlations in the catch between fishing methods,indicating that environmental conditions in general are stable enough to allow undis-turbed fishing for all fishing methods throughout the summer, and the run size may gener-ally drive the success of all fisheries.
recreational fishermen
2500
5000
7500
10000
12500
fishing days
10000
20000
30000
40000
Salm
on catch (kg)
20000
40000
60000
Salm
on catch (n)
2500
5000
7500
10000
12500
0.9-2.9 kg3.0-6.9 kg7.0-12.9 kg≥13.0 kg
Catch (kg) /
fishing day
1
2
3
1960 1965 1970 1975 1980 1985 1990 1995 2000
Mean w
of salmon
2
3
4
5
6
7
Sal
mon
cat
ch (n
) Sal
mon
cat
ch (k
g)N
umbe
r of
recr
eatio
nal f
ishe
rmen
Num
ber o
f fis
hing
day
sM
ean
wei
ght (
kg)
of s
alm
onC
atch
(kg)
fishi
ng d
ay

25
Salmon catch data from 1997–2003 provide the most reliable and comprehensivedescription of the run timing and the exploitation of salmon of different sea-ages through-out the summer in the River Teno (Fig. 7). This was made possible by a special intensiveprogramme using logbooks and catch sampling throughout the system, including the low-ermost part of the river in Norway. The substrate below the lowermost riffle section inTana Bru (38 km from the sea) is completely dominated by moving sand, with no spawn-ing areas or pools for resting, and hence salmon prefer to move rapidly upstream. There-fore, fishing within the lower section of the mainstem can be used as an indicator of theactual run timing of salmon into the river (Fig. 7).
The run of MSW females and males was followed by a run of 1SW salmon in thelower section (section 1). This temporal pattern could also be observed in the catches inthe upper section (section 2, Fig. 7). Although the peak migration of MSW salmon intothe River Teno is short and takes place over 4–5 weeks in the lower section, they wereexploited during the entire season in the upper section. Fishing in the lower section is inthe form of a mixed-stock fishery that continues throughout the season, whereas in theupper section mixed-stock fishing extends until the second half of July (Fig. 7), whenstocks from the tributaries have predominantly ascended to their spawning rivers. In theupper section, fishing in August is directed to sub-stocks reproducing mainly in the mainstem. Very few spawners ascend the River Teno in September and October, and their con-tribution to the spawning escapement is unknown. Generally, the timing of the migrationin the River Teno follows the typical pattern, where older individuals return earlier in theseason than the younger ones (Dunkley 1986, Shearer 1992, see also Niemelä et al.2000).
Salmon fishing in the River Teno system has been regulated since 1873 by bilateralagreements between Finland and Norway. A general fishery agreement has been con-cluded between the governments of Finland and Norway, and this agreement primarilyregulates the local fisheries and their fishing rights. Tourist angling is regulated byregional authorities in both countries, and these regulations can be amended on a yearlybasis. The latest general agreement, concluded in 1990, states that the fishing season com-mences on 20 May and terminates on 31 August. Net fishing is allowed for three days perweek and drift net fishing can take place only from the beginning of the season until 15June. All fishing is prohibited for one day per week.
The River Teno salmon fishery has also been regulated outside the river by the prohibi-tion of high seas salmon fishing in the North Atlantic since 1984. This was implementedthrough the NASCO convention with the aim of enhancing and conserving various stocks(Windsor & Hutchinson 1994). Norway has taken further steps to improve salmon stocksby entirely closing the drift net fishery at sea in 1989 (ICES 1990) and by limiting coastalfishing in fjords.

26
Fig. 7. The timing of the catch of salmon of different sea-ages in Tanafjord in 2003 and in twosections of the River Teno over five-day intervals in 1997–2003. Section one represents an areacovering the lowermost 38 km of the river and indicates the timing of the salmon run into theRiver Teno. Section two represents an area extending over 136 km, between 70 km and 206 kmfrom the estuary, and indicates the timing of the catch at spawning sites in the mainstem. (un-published data from Finnish Game and Fisheries Research Institute and Sturla Brørs, CountyGovernor in Finnmark, Norway)
1 SW 2 SW 3 SW 4-5 SW(5 SW only males)
Previous spawners
MalesTanafjord
0
10
20
30
40
50
FemalesTanafjord
Num
ber
0
5
10
15
20
25
30
FemalesSection 1
Num
ber
0
100
200
300
400
500
600
June July August
June July August June July August
MalesSection 1
0
200
400
600
800
1000
1200
June July August
FemalesSection 2
0
200
400
600
800
1000
1200
June July August
MalesSection 2
0
200
400
600
800
1000
1200
1400
June July August
Num
ber
Num
ber
Num
ber
27
Even though the weekly fishing time and the length of the fishing season has beenreduced over the years since the first regulations were implemented in 1873, technicaldevelopment has improved the net fishing methods. The fishing effort in the River Tenoon the Finnish side has particularly increased for hook and line fishing due to theincreased numbers of recreational fishermen from 200 anglers in 1953 to 10500 anglers in2002. Angler fishing days have increased from c. 600 in 1953 to 37 500 in 2002. A simi-lar development has taken place on the Norwegian side, where angler fishing days haveincreased from 1500 in 1980 to 8300 in 2002. As a result of the overall intensified fish-ing, the historical distribution area of adult salmon in the River Teno system (c. 1 270 km)has declined and today covers 860 km, indicating excessive exploitation especially inspawning areas in the uppermost tributaries and headwaters. Some stocks adapted to theuppermost distribution areas have probably become extinct. MSW salmon have mainlydisappeared from smaller tributaries when compared to their historical distribution, and1SW salmon currently form the main component in populations.
The economic value of salmon in the 1970s and 1980s and even until early 1990s forpeople living in the Teno river valleys was extremely high, resulting in great interest infishing and extensive exploitation, as indicated by salmon tagging experiments (Rikstad1982, Erkinaro et al. 1999). However, there has been an obvious trend in salmon harvest-ing in recent years as many local commercial salmon fishermen have shifted to earningtheir incomes through recreational fishing by renting out fishing boats and fishing campsand by offering rowing services. At the same time, the price of wild salmon has signifi-cantly declined and effort in traditional net fishing methods, gill nets and weirs, hasdecreased accordingly.
2.4 Field methods and collection of samples
Most of the data on juvenile salmon densities used in this work stems from a long-termmonitoring programme started in 1979 (I). This programme includes 35 sampling sites inthe River Teno mainstem, 12 in the River Utsjoki and 10 in the River Inarijoki (Fig. 1).Each site was fished with standardized methods once a year in a strict rotation, so that thefishing took place on almost the same date in successive years. When choosing the sites,the habitat characteristics, especially the substratum, were taken into account so that thevarying water level would have a minimum effect on the habitat, although it may causethe actual shoreline to move. Special attention was paid to selecting the sampling sites sothat both ideal sites (loose, coarse substrate, lots of hiding places) and less favourableones (solid, compact, fine substrate, with few hiding places) were represented.
In 1991–1995 at two sites in the River Teno and at six sites in the River Utsjoki, sea-sonal variation in the densities of juveniles was studied throughout the open water seasonbetween June and October (IV). These sites were chosen to represent homogenousstretches of favourable habitat in terms of depth, water velocity and size and shape of thesubstratum.
Data on juvenile salmon densities and habitat characteristics comprise 49 permanentsites of the River Teno, Inarijoki and Utsjoki juvenile salmon long-term monitoring pro-gramme, 12 additional sampling sites in 1997 from the River Utsjoki, 31 additional sites

28
in 1999 from the River Teno and 21 sites from the monitoring programme of the RiverNäätämöjoki (Niemelä et al. 2001), the neighbouring river system south-east of the Teno(VI). The new sites in the River Utsjoki and the River Teno and the sites in the RiverNäätämöjoki have been selected to represent favourable, shallow shoreline habitats repre-senting primary salmon parr habitat (VI). The physical characteristics were describedalong four equidistant transects on each electrofishing site, including measurements orestimates of depth, surface flow velocity, substrate and aquatic vegetation. All the siteswere rectangular in shape and aligned with the shoreline, and were of a maximum depthof 70 cm.
Electrofishing (900V, 0.2A pulsed DC current) in the long-term monitoring pro-gramme started around 20 July each year, when the spring flood was over, and the newlyemerged fry were evenly distributed over their nursery area (I,II). When studying sea-sonal variation in densities, fishing started in late June and continued in two-week inter-vals until the middle of October (IV). Surround nets were used at all the sites until 1986,when they were found unnecessary (III), a conclusion also reached by Bohlin et al. (1989)and Julkunen & Niemelä (1997). When studying the seasonal variation in densities, sur-round nets were not in use (IV).
The same standardized removal fishing method was used (Bohlin et al. 1989) and thenumber of successive passes was usually between one and three, with a duration of 20 to30 minutes. A given site was fished only once if the number of salmon was 5 or less (15or less since 1996), but if the number was greater than 5 (>15 since 1996) the site wasusually fished three times with a 30-minute pause between passes. Sites with low num-bers of fish were left without further removals due to problems in calculating estimatesand/or large error connected with low densities (III, Julkunen & Niemelä 1997).
The electrofishing team consisted of three experienced crew members with one usingthe anode and the other two using dipnets to capture the fish. The sites were fished in anupstream direction, each site being combed carefully with two-metre anode strokes in adownstream direction, after which 50 cm sideways steps were taken (I–VI).
All the fish were measured (total length to the nearest 1 mm) following capture and ascale sample was taken from the area between the lateral line and the adipose fin from allfish greater than 45 mm in length so that they could be classified as fry or parr. Salmonless than 55 mm in length were classified as fry if scale analysis was impossible. The fishwere not anaesthetized and were returned to the river alive after sampling.
Scale samples for age determination were collected from adult salmon catches of netand angling fisheries throughout the fishing season in the rivers Teno, Utsjoki and Inari-joki in 1972–2003. The weight of yearly salmon catches was estimated based on postalquestionnaires sent to local fishermen and tourist anglers. Weight was converted intonumbers of fish using the sea-age distribution of yearly catch samples.
All fish were aged by scale reading using a microfiche reader (30× magnification) forjuveniles, or a semi-automatic scale reading equipment for adult salmon (Kuusela 1996).
29
2.5 Mathematical methods
A three-pass removal method and the Moran–Zippin maximum likelihood calculationwere used to estimate the density of fry (0+), 1+ parr and ≥1+ parr (Moran 1951, Zippin1956, Seber 1982). In the later application of this method (see Bohlin et al. 1989) thecatchability of successive electric fishings is estimated by iterative calculation from suc-cessive catches. The population size at a given sampling site was calculated from theequation N = (total catch)/(1–(1–p)k), where k is the number of successive fishings andcatchability p is the probability of capture of an individual (Seber 1982). Finally, thenumber of fish at a given electrofished site was estimated as juvenile density (ind. 100 m–2). The total catch was used as a minimum estimate if only one sampling took place, or inthe case of two or three fishings, if 1.96 × S.E. of the estimate was greater than the esti-mate itself. Natural log (ln) transformations of densities were used in the analyses to pro-vide a better fit to the normal distribution and additivity assumptions applying to the sta-tistical methods (Stewart-Oaten et al. 1992).
Cluster analysis was used to identify sites with similar densities (II). The cluster analy-sis was carried out separately for fry and parr in the three rivers, the clusters being dividedinto high (cluster 1), intermediate (cluster 2) and low (cluster 3) density ones on the basisof the mean density. Initially, the data were arranged in an n×p matrix with sites in therows and ln transformed densities as variables in the columns, so that each column repre-sented one year (1979–1994). Similar sites were combined in stages, using simple Euclid-ean distance as the distance measure, to form resemblance matrices. The resulting clustertree (SYSTAT 1996) designates the location of individual sites based on fish density andits variation. In general, cluster analysis assigned the sampling sites in decreasing densityorder, but there were some cases where the yearly variation at a site was more similar tothat found in another cluster than in the one which the site seemed to belong based on itsdensity (II).
The differences in mean catchabilities in electrofishing between the periods 1979–1987 and 1988–1996 were assessed in order to compare years when surround nets wereused (1979–1987) and those when they were not (1988–1996). Regression analysis wasused to study the existence of linear changes in catchability over time. Regression analy-sis was used also to study the relationship between catchability and density (III).
A general pattern in the seasonal variation of juvenile salmon abundance was analysedby combining the sampling sites and years for the rivers Teno and Utsjoki (IV). Whencomparing the densities between mid-summer and the beginning of autumn, which ismost frequently the preferred period for electrofishing, the sampling times were presentedin four periods, two periods per month (late July, early August, late August, early Septem-ber), and separate years. In this more detailed approach, an analysis of variance forrepeated measures (rANOVA) was employed. The rANOVA model included as trial fac-tors the year (1991 and 1993–1995) and period. A significant interaction for the termsyear and period indicates differences in the seasonal profiles of annual densities. If theinteraction of year and period was significant in the univariate test, single degree-of-free-dom polynomial tests with one to six orders were carried out to reveal different seasonal-ity between years in details (SYSTAT 1996).
Estimated yearly adult salmon catches in numbers were related to the yearly mean den-sities of fry (n+1 year) and of 1+ parr (n+2 years) by regression analysis (V) Likewise,
30
the annual densities of fry and 1+ parr were related to the subsequent numbers of 1SW,2SW and 3SW salmon belonging to the same year classes in the salmon catches (V). Thedensities were either averages over all sites combined or those of the three clusters in therivers Teno, Utsjoki and Inarijoki. Examination of potential temporal trends in the abun-dance of adult and juvenile salmon (log10 (x+1) transformed) was carried out by regres-sion analyses. Cross–correlation analysis was used to identify the concurrence of abun-dance (catches) between consecutive sea age groups.
Two methods were used to assess the predictability of the relationship between habitatand juvenile salmon abundance (VI). Firstly, discriminant analysis was used to build amodel describing the relationship between juvenile salmon densities and habitat charac-teristics of the electrofishing sites with varying habitat types. An independent test data setconsisting of a subjectively chosen favourable salmon habitat was used to assess the per-formance of the model. Secondly, earlier established microhabitat preference curves(Mäki-Petäys et al. 2002) were used to assess the habitat-parr density-relationship in thetest data set. Habitat models were used for crude classification of monitoring sites intoexpected density categories and assessing the attainment of these reference levels (VI).
3 Results and discussion
3.1 Monitoring juvenile abundance with electrofishing in the River Teno system in assessing the status of salmon stocks
Long-term monitoring is important to understand ecological phenomena driven by slowprocesses, rare or episodic events and highly variable, subtle or complex processes (Fran-klin 1989, Elliott 1990). In addition, the spatial extent of sampling should be selected toenable inference for generalization to the entire area of interest (Yoccoz et al. 2001).
To succeed in the management of wild salmon stocks with the aim of sustaining andenhancing them, it is necessary to obtain thorough long-term data on the stocks to under-stand the long-term stock dynamics. Assessment of the status of the Atlantic salmon pop-ulations in the River Teno system is based on a 25-year monitoring programme for juve-nile salmon abundance employing electrofishing, and on more than 30 years of monitor-ing of the estimated yearly numbers of captured salmon (V). The long-term monitoring ofthe River Teno salmon stocks has aimed at developing an understanding of the dynamicsof these exceptionally diverse salmon stocks representing the most variable sea and riverage combinations within the distribution area of the species, and one of the few remainingabundant large wild salmon stock complexes. Sufficient long-term data can facilitate themaking of appropriate management decisions in a river system, where the slow regenera-tion of salmon stocks highlights the importance of long-term monitoring in distinguish-ing and interpreting the considerable annual variation in catch estimates and juvenileabundances and their relationships (cf., Hilborn & Walters 1992).
In the River Teno system, juvenile salmon densities have been used as an indicator ofthe size of the prior spawning escapement (I, II, V), and they have also been used to pre-dict the subsequent salmon catches (V). Although electrofishing is an important andwidely used method in assessing juvenile salmonid abundance in running waters (see ref-erences in Cowx 1990), there are several uncertainty factors that can affect the reliabilityof the electrofishing method (III, Jensen & Johnsen 1988, Bohlin et al. 1989).
When analysing changes in juvenile salmon densities in large rivers like the Teno,Utsjoki and Inarijoki, it is vital to consider the fact that the sampling sites have beenrestricted to shallow areas close to the river banks, and thus only a small proportion of the
32
biotope inhabited by the juveniles has been studied (I, II, see also Saksgård et al. 1992).In spite of the wide range of smolt ages in the River Teno system (see above, chapter 2.3),relatively few older (age ≥3+) salmon parr have typically been captured in the juvenilemonitoring programme (I, II, V, Erkinaro 1995). One explanation for the small propor-tion of older parr could be that the deeper habitats of the large parr were probably not rep-resented. The monitoring programme in the River Teno system, however, covers habitatswith depths down to 0.7 m, and it has been shown that large fluvial salmon parr also pre-fer depths of 0.2–0.5 m in the summer (Heggenes et al. 1991), while habitats deeper than0.7 m are little used (e.g., Heggenes 1996). A proportion of the older juveniles in the riv-ers Teno, Utsjoki and Inarijoki migrate from their natal rivers to small brooks (Erkinaro1995, Erkinaro & Niemelä 1995, Erkinaro et al. 1998a) or lakes (Erkinaro et al. 1998b),or some individuals have already migrated to the sea as smolts (Niemelä et al. 2000). Forinstance, in the River Teno, c. 20% of parr smoltify at the age of 3 years (Fig. 2, Niemeläet al. 2000).
In the River Teno there are 35 electrofishing areas representing habitats over an 80 kmstretch of the main stem and covering 0.02% of the total area suitable for juvenile produc-tion. The corresponding figures for the tributary rivers Utsjoki and Inarijoki are 0.19%and 0.01%, respectively. In the rivers Utsjoki and Inarijoki the numbers of electrofishingareas are 12 and 10, respectively, covering habitats over a 50 km and 60 km stretch of therivers. Although the spatial coverage is low in terms of site numbers in relation to thelengths of the rivers, it should be noted that an increase in the number of sites from thepresent might increase the temporal changes in densities (IV) and thus reduce comparabil-ity between years. In similar programmes in some other large rivers in Northern Europe,the number of electrofishing sites in relation to river length has been 14 sites over 46 kmin the River Alta (Norway) (Saksgård et al. 1992), 27 sites over 70 km in the RiverNäätämöjoki (the boundary river between Finland and Norway) (Niemelä et al. 2001),and 60 sites over 500 km in the most important Baltic wild salmon river, the Tornionjoki(boundary river between Finland and Sweden) (Haikonen et al. 2003).
In a large river system like the River Teno with distinct salmon stocks in dozens oftributaries and in different parts of the main stem, it is important to monitor the salmonstocks in individual stock components (Elo et al. 1994, see also Heggberget et al. 1986).The limited movements of younger juveniles (Saunders & Gee 1964, Crisp 1995) suggestthat their abundance at a site or group of sites reflects the size of the local spawning popu-lation in different parts of the river system (V, VI). If an electrofishing survey is concen-trated on the smaller tributaries where electrofishing is easier to complete, and the largemain stem is omitted, the most important component of the MSW salmon of the RiverTeno system would also be excluded from the monitoring programme (Fig. 3).
Electrofishing is the only satisfactory method for obtaining a quick, comprehensivepicture of the status of the juvenile salmon population and hence of the spawning stockescapement within different fluvial habitats. One of the most difficult questions in plan-ning an electrofishing programme is whether to devote the limited resources to more sam-pling sites, or to more frequent sampling of a limited number of sites (Bohlin et al. 1989).Juvenile abundance data provides detailed information on fish stocks at specific sites forone point in time and are important when precise numerical information is required. Sinceit is impossible to sample streams along their entire length, it is necessary to sample dis-crete sites, which requires an extrapolation of the site results to the rest of the stream, i.e.
33
the number and location of sites must allow an extrapolation to be made on a statisticalbasis (Winstone 1993). In most studies where juvenile abundance has been monitored toestimate subsequent smolt production (Crozier & Kennedy 1995), or to examine the rela-tionship between fry and parr numbers (Bagliniere & Champigneulle 1986) or betweenspawning escapement and fry abundance (Chadwick 1985), electrofishing has been car-ried out only once each summer. In the River Teno system the short period for field workcombined with the restricted manpower for electrofishing has only allowed the assess-ment of juvenile salmon abundance once a summer. The annual sampling starts after theemergence of fry at the end of July and is typically completed at the end of August (I, II).
Juvenile salmon abundances in the River Teno system are normally expressed in twoways: as the annual mean density of fish within the river combining all electrofishingsites (I) or as the mean annual density for areas grouped into density classes (II, V). Clus-tering sites with similar annual densities into site groups allows a reduction of the spatialvariability in order to analyse temporal variability by statistical methods. The adequacy ofthe method appeared to be good enough in the high-density (cluster 1) and intermediate-density (cluster 2) classes, as their mean densities were above the level that Bohlin andcoauthors (1989) deemed necessary for achieving sufficient precision of monitoring bymeans of electrofishing by the removal method. The low-density clusters (cluster 3) cre-ate a problem in monitoring in that their density estimates are not accurate enough andexcessive variation hampers the detection of possible trends (see also Bohlin et al. 1989).
Combining the densities of all sites in a river is the most frequently used method,which gives abundance estimates for the general comparison of juvenile productionbetween rivers. However, the calculation of mean density does not allow the detection offiner scale spatial changes in densities, and possible patterns in subpopulations are notaccounted for when using this method. One possible approach to monitoring fish densitiesin a river would be to compare mean values for stream sections representing similar habi-tats. This method has drawbacks with respect to long-term monitoring in a northern riverbecause the habitat properties of a site can be altered by floods and ice erosion, whichthereby influence juvenile salmon densities through habitat changes. Local events maycause serial correlation between yearly densities at a given site and may invalidate the sta-tistical analysis of the influence of the actual impact of interest (Stewart-Oaten et al.1992), such as the measures taken to regulate fishing. Bohlin and coauthors (1989) hasproposed the selection of sampling sites annually on a random basis, but this had beenfound to lead to twice the spatial standard deviation in parr densities in the River Utsjokirelative to permanent monitoring sites (II).
In a long-term programme monitoring juvenile abundance, at least some methodologi-cal changes are almost inevitable. To be able to detect changes in the variables beingmonitored, it is of great importance to assess the impact of the methodological changesover time. In the River Teno system, where a quantitative three-pass removal method hasbeen used in electrofishing and Moran–Zippin maximum likelihood calculations in esti-mating the population size, the use of surround nets was discontinued as the same time asthe transformer was changed. As a result of these changes, the mean catchability for fryand parr declined (III). Several environmental variables such as water temperature, depth,conductivity and habitat type affect the efficiency (catchability) of electrofishing (e.g.Randall 1990, Zalewski & Cowx 1990, Borgstrøm & Skaala 1993). Nevertheless, there isgood evidence that the estimation method compensates for variation and bias in catchabil-
34
ity and density estimation if the basic criteria and assumptions (i.e. constant capture prob-ability for all individuals, constant catchability within removals and sufficient number offish) are fulfilled to a sufficient extent (Seber 1982, Bohlin et al. 1989). The use of sur-round nets in electrofishing has not been considered a necessity in large river systemssuch as the River Teno, where sampling sites are restricted to the near-shore zone and assuch can represent only a small proportion of the river’s entire cross-section (Bohlin et al.1989).
The age and size of the fish has been found to affect catchability in the River Teno sys-tem, where the catchability of fry was less than that of parr (III). A larger size usuallyleads to increased catchability in fish (Borgstrøm & Skaala 1993), although Crozier andKennedy (1994a) conclude that the higher mobility of parr leads to a lower catching effi-ciency and larger parr are often transported outside the electrical field in strong currentsbefore they can be caught. It has been indicated on several occasions that density esti-mates are most often negatively biased due to a decline in catch efficiency with succes-sive sampling (Schnute 1983, Peterson & Cederholm 1984, Bohlin et al. 1989, Bohlin1990, Bohlin & Cowx 1990, Riley et al. 1993). This may happen because fish that havebeen frightened or shocked may become less catchable in subsequent passes, or becausethe assumption of equal capture probability among individuals has not been met. It is pos-sible that actual capture probabilities decreased with each pass in the River Teno systemafter surround net use was discontinued. This potential bias is, however, negative and thecorresponding abundance estimates therefore conservative and “safer” in providingadvice for management.
A relationship was detected between the density and catchability of parr, in that catch-ability decreased with density, but the predictability was weak (III). During successiveremovals the number of fish becomes rather small in the second and third catch if catcha-bility is high and the population size is small. An essential prerequisite in electrofishing isthat the total population size in the sampling area should be more than 50 (see also Bohlinet al. 1989) and catchability should be at least 0.2 for the removal method to be valid, andgreater than 0.4 for consistently reliable results (Seber 1982). The catchabilities in theRiver Teno watershed for both age groups fulfilled Seber’s criteria (III). The electrofish-ing results from the River Teno system indicate that for monitoring purposes, the assump-tion of equal catchability in three removals leads to density estimates in which the bias issufficiently small.
Based on the experience of the present work, electrofishing in long-term monitoring isrecommended to be carried out in as standardized a form as possible: at permanent sites,on the same dates each year, within the shortest possible time span, and maintaining thesame sampling schedule every year, in order to reduce variations in catchability that stemfrom non-standardised sampling.
3.2 Abundance of juvenile salmon
The abundance of juvenile salmon displays considerable temporal and spatial variationamong river stretches and sites within the River Teno system (I, II). In the rivers Teno,Utsjoki and Inarijoki the average fry densities in 1979–2003 were 26, 39 and 28 fish per
35
100 m2 and parr densities were 18, 31 and 23 fish per 100 m2, respectively (Table I).When comparing these results with juvenile salmon densities in some other northernsalmon rivers, the present figures fall within the general range. In the River Alta (North-ern Norway) in 1981–1991, parr densities were 12, 24 and 37 fish per 100 m 2 in the low-er, in the middle and in the upper part of the main stem, respectively (Saksgård et al.1992), but higher densities have been found in later years as the general range varied forthe entire river between 32 and 61 fish per 100 m 2 in 1993 and 1995 (Jensen et al. 1997).The River Ponoi (Kola Peninsula, Russia) has yielded large catches of salmon annually,despite mean parr densities as low as 1.5 fish per 100 m2 and fry densities of only 2.2 fishper 100 m2 in the main stem (Whoriskey et al. 1996). However, Whoriskey (1998)reported increasing juvenile salmon densities in recent years after the closure of the com-mercial fishery in the river mouth. In the rivers Kola and Varzuga (Kola Peninsula, Rus-sia), where commercial or brood stock fisheries still exist, the mean densities have beensimilar to those of the River Teno, where net fishing methods are permitted in addition tohook and line fishing.
In some cases even the northernmost salmon rivers are able to produce considerabledensities of juvenile salmon. In the lower part of the River Näätämöjoki (Northern Nor-way), where gill net fishing is prohibited, the average density of parr between 1990 and1998 has been as high as 80 fish per 100 m2 and even 110–120 fish per 100 m2 at certainsites (Niemelä et al. 2001). The high densities of juvenile salmon in some areas in theRiver Teno system, especially in the lower part of the River Utsjoki (60–70 parr per 100m2, I, V), point to an exceptionally strong local spawning stock. In the lower Utsjoki, 2–3SW female salmon ascend to the spawning grounds from the River Teno late in Septem-ber after the fishing season thus avoiding part of the fishing pressure (Kylmäaho et al.1996). Juvenile densities in the lower part of the River Utsjoki offer a good example ofpermanently high production and could be used as reference levels for certain habitattypes. Similar types of site are included in the long-term monitoring programme else-where in the River Teno system, but in most cases their densities have been much lower,indicating permanently low local spawning escapement (V, VI).
There was a distinct decline in parr densities in the middle part of the River Utsjoki inthe early phase of the monitoring (II). This development could not, however, be attrib-uted to the introduction and subsequent dispersal of the non-indigenous bullhead, Cottusgobio L., into the River Utsjoki in the 1970s (Pihlaja et al. 1998b), but rather to the highexploitation and low stock abundance of salmon. Bullhead in the River Utsjoki mainlyoccupy riffle sections not far from the lakes and short rapids between lakes, but they wereabsent from the principal habitats of salmon parr (Jørgensen et al. 1999). However, parrdensities have recently increased in the middle of the River Utsjoki, which might be areflection of increased spawning escapement (V, Table I).
When long-term trends in juvenile salmon densities were analysed up to 1995 (II), itwas shown that parr (1+) densities decreased significantly in one cluster containing 45%of the sites studied in the river Utsjoki, whereas the densities increased significantly inone cluster in the river Teno and in one cluster in the river Inarijoki containing 38% of thesites in the these rivers. Fry densities increased significantly in two clusters containing16% of all the sites studied in all three rivers. When the time interval was extended to2003, comprising 25 years of monitoring (V), there was still the one declining trend in theRiver Utsjoki, but only one increasing trend, that of the highest density cluster in the
36
River Inarijoki, in the case of parr. However, there was a major difference in fry densitytrends between the periods in that fry densities increased significantly in all clusters in theRiver Inarijoki and in two clusters both in the River Utsjoki and in the River Tenobetween 1979–2003 (V).
The increasing trend in fry densities was mainly driven by the strong increase in threelast years (2001–2003) and the generally low densities at the beginning of the monitoringperiod. However, parr densities did not increase in most cases, probably because the highfry densities in recent years have not yet induced an increasing trend in parr densities orprobably because fry densities did not show correlations with parr densities in the subse-quent year at individual sites (II). In addition, the mean fry densities (all sites combined)increased significantly in the rivers Teno, Utsjoki and Inarijoki and 1+ parr densities (allsites combined) increased significantly in the rivers Teno and Inarijoki between 1979–2003 (V).
3.3 Seasonal variation in the abundance of juvenile salmon
Extensive seasonal variation in the density and age distribution of juvenile salmon wasapparent in the rivers Teno and Utsjoki. The densities of fry and parr showed an increasefrom early summer towards late August and a subsequent decline towards the autumn(IV). The stream dwelling juveniles of Atlantic salmon have traditionally been consid-ered typical resident fluvial salmonids that exhibit only restricted movements during theirfreshwater period (e.g., Keenleyside & Yamamoto 1962, Saunders & Gee 1964).However, many recent studies have revealed extensive movements among juvenile Atlan-tic salmon before their oceanic migration, often induced by factors such as the obtainingof better food resources and growth possibilities and the avoidance of unfavourable envi-ronmental conditions (Erkinaro 1997 and references therein). Seasonal changes in habitatuse should therefore be taken into consideration when interpreting juvenile salmon densi-ty data between and within rivers.
Fluctuations in water levels and differences in the timing of the summer season havebeen found to have an impact on juvenile salmon densities (Jensen & Johnsen 1988).Accordingly, Bohlin and coauthors (1989) suggested that quantitative electrofishingshould be carried out yearly under similar environmental conditions, especially at a simi-lar water level. The same practice was suggested by Saksgård and Heggberget (1990),who detected a significant negative correlation between juvenile salmon abundance andwater flow. In the rivers Teno and Utsjoki the water level varied between years during thesame sampling times. However, normal summer time variation in water level (extremehigh water levels excluded) did not explain the variation in catchability and juvenilesalmon abundance, although a seasonal pattern in juvenile salmon abundance wasdetected (IV). Seasonal variation in densities of juvenile salmon has also been recorded inthe River Alta (Saksgård et al. 1992). However, Saunders and Gee (1964) suggested thatjuvenile salmon normally follow the water course during water-level fluctuations, whentheir territories are destroyed/disturbed which could decrease the effect of fluctuatingwater level on the habitat use.

37
The seasonal pattern of parr density was more distinct than that of fry between lateJuly and early September (IV). This reflects a difference in their population dynamics, inthat fry do not emerge until mid-July and gradually disperse from the spawning areasafter that, whereas the habitat selection of parr may be more stable during this period.Within individual sites in different years, density peaked in different weeks from the mid-dle of June to the beginning of September for parr and from the last week of July to themiddle of September for fry. To avoid overestimated and misleading fry densities, sam-pling times should be chosen in such a way that juvenile salmon of all age-groups areevenly distributed in their respective biotopes.
At a few sites in the River Teno system, high fry densities resulted in high parr densi-ties during the following year, but usually the association between these age groups wasweak (I). This might indicate age-dependent selection of different habitats, where theproperties of microhabitats are important parameters dictating the spatial distribution ofjuvenile salmon (Morantz et al. 1987). However, the significant variation in the frequencyof parr age groups (ages 1+, 2+ and ≥³3+), combined with the considerable fluctuation inparr densities between samplings throughout the season in the rivers Teno and Utsjoki(IV), indicated that habitat preference was changing within short time intervals and juve-niles were not stationary or keeping their territories for a long time.
In a long-term monitoring programme, the best way to minimise the effect of seasonalvariation in density is, as indicated above, to standardize the sampling protocol and datesas strictly as possible.
3.4 Relationships between catches and juvenile densities and status of salmon stocks
The 25-year monitoring programme in the River Teno revealed positive relationshipsbetween salmon catches and subsequent juvenile abundance, and vice versa (V). Thevariation in the numbers of 2SW female salmon explained 28–38% of the variation insubsequent fry abundance and 26–34% of the variation in parr abundance (V). Theserelationships between the catches and juvenile abundance were most obvious for fry at allelectrofishing sites combined and at sites with medium (cluster 2) and low (cluster 3) frydensities, and for 1+ parr at all electrofishing sites combined and at sites with high (clus-ter 1) and medium (cluster 2) parr densities. Regression models did not explain the rela-tionships between the numbers of 1SW and 3SW female salmon and fry and 1+ parr den-sities in the River Teno. In the tributary river Inarijoki, the number of 2SW female salm-on in the catch also had a significant relationship with the subsequent fry and 1+ parrdensities of all electrofishing sites combined and at areas with high (cluster 1) and medi-um (cluster 2) densities, where the regression model explainend 19–44% of the variationin juvenile abundance. In the River Inarijoki, regression models also explained signifi-cant relationships between the number of 1SW female salmon and the subsequent 1+ parrdensity of all sites combined and of sites with high densities (clusters 1) and low densi-ties (cluster 3) (r2 = 0.26–0.30) (V).
38
Similar relationships between the salmon catch and abundance of juveniles have alsobeen found in other rivers (Saltveit 1996, Chadwick 1985). In the absence of true stock-recruitment data, which is the case in most salmon rivers of the world, the reported catchor some similar data have been used as an index of abundance (V, Chadwick 1985). Theestimated numbers of salmon caught yearly is believed to indicate realistic variations inabundance between years, as no catch quotas have been set for either the net fisheries orthe rod fishery. In this study the juvenile abundance has been used as an index of recruit-ment. To understand how juvenile abundance responds at different levels of spawningstock size, the stock must be observed over a sufficient range with enough observationsnear the extremes of the ranges to overcome the time-series bias effects (Hilborn &Walters 1992).
Female salmon abundance showed a significant relationship with subsequent juvenileabundance at sites of high and medium density, and this relationship was almost linear, atleast within most of the ranges experienced during the 25-year monitoring period (V).This suggests that the best habitats have not yet reached the production capacity (VI) andtheir parr density closely follows the abundance of the spawning population. Based on thestock (catch) recruitment (parr density) curves, Chadwick and Randall (1986) also con-cluded that juvenile abundance was low and below the inflexion point.
The annual juvenile density surveys in the River Teno system allow evaluation of thespawner abundance one and two years earlier, and they also confirm the stock statusinformation provided by earlier catch statistics. On the other hand, significant deviationsin juvenile abundance from what is predicted by the catch estimates would indicatechanges in the exploitation rate in river fisheries. These observed relationships betweenthe catch components and subsequent juvenile abundance suggest that the monitoringprogramme included feasible and biologically relevant variables and proper methodolo-gies.
In the River Teno, juvenile densities were positively related to the subsequent catchesof salmon of the same year classes (V). Significant relationships were detected betweenfry densities of all sites combined and of those sites with a high density (cluster 1), andthe numbers of 1SW salmon in the River Teno (r2 = 0.31, 0.41). The same was truebetween fry densities (sites combined, clusters 1 and 2) and the numbers of 2SW salmonin the subsequent catch (r2 = 0.20–0.24). Similarly, parr densities (sites combined, clusters1 and 2) were significantly related to the numbers of 1SW and 2 SW salmon in the subse-quent catches (1SW: r2 = 0.24–0.38, 2SW: r2 = 0.26–0.28). In the River Inarijoki, regres-sion models explained 24–39% of the relationships between the densities of 1+ parr andthe numbers of 1SW salmon in the subsequent catch. These regression models explained24–41% of the variation in the River Teno salmon catches in relation to the preceding parrabundances, and the predictive power is reasonably high when bearing in mind thatcatches of 1SW and 2SW salmon included smolt ages of 2–6 years, i.e., one year classproduced catches over five consecutive years. Combined with variable sea ages (1–5) andrepeated spawning runs, the effects of changes in juvenile abundance are slowly reflectedin the subsequent salmon catches. Similar documented relationships between salmon fryor parr and subsequent adult salmon abundance are rarely available from other largesalmon rivers, whereas other relationships, including those between fry and parr abun-dance (Bagliniere & Champigneulle 1986), fry abundance and the number of smolts (Cro-zier & Kennedy 1995) and the relationships between the numbers of smolts and ascend-
39
ing salmon (Paloheimo & Elson 1974, Chadwick et al. 1978, Jonsson et al. 1998) indicateclear positive relationships in all the above studies. In the River Teno system, where noannual smolt production estimates are available to predict the subsequent number ofascending salmon, the positive relationships between the abundance of juveniles and thesubsequent numbers of salmon in the catch offer a reasonable tool to predict the catchesof especially 1SW and 2SW salmon, as these comprise an average of 70% of the totalcatch in numbers.
Positive and significant cross-correlations were found between the numbers of 1SWand 2SW, 2SW and 3SW, and 3SW and 4SW salmon in the catches in the River Teno sys-tem, especially with a 1-year lag (V). This indicates that the survival of post smolts dur-ing the first summer and winter is crucial in dictating the abundances of all later sea ageclasses (see also Scarnecchia 1984b). Such relationships have been used successfullyelsewhere as a basis for forecasting the yield and escapement of 2SW salmon from theyield and escapement of 1SW salmon in the preceding year (Power 1981, Scarnecchia1984b, Bielak & Power 1986, Jonsson et al. 1998).
The 25-year monitoring programme in the River Teno has covered four generations of1SW and 2SW salmon. The slow regeneration of the northern salmon stocks highlightsthe importance of long-term monitoring in distinguishing and interpreting the consider-able annual variation in juvenile abundance and in catch estimates and their relationships(cf,. Hilborn & Walters 1992). These predictive relationships have statistical power onlyif sufficient time series data are available, because short-term data usually lack the statis-tical power to detect responses in long-term processes, as the variance can be large com-pared with the magnitude of the trend (Elliot 1994).
Salmon catches and juvenile densities showed considerable annual variation over themonitoring period in the River Teno system (I, II, V). The mean annual salmon catch inthe River Teno system in 1972–2002 was 139 t (SD 48), with a maximum of 250 t in1975 and 2001 and a minimum of 74 t in 1979 (V, see chapter 2.3, Fig. 5). A significantincreasing trend in the estimated numbers of salmon in the catch in 1977–2002 wasdetected for both sexes of 1SW and 2SW salmon and for previous spawners (see chapter2.3, Fig. 4). The only significant declining trend detected was in the numbers of 4SWfemales, and there was no trend in the numbers of 3SW fish (V).
The general declining trends in catches of salmon have been found during 1980s and1990s throughout its whole distribution area, being most pronounced in multi-sea-wintersalmon (ICES 2002). Specific reasons for the continued decline are often unclear, butmultiple factors, including overfishing, altered oceanic conditions and freshwater habitatdegradation, are probably responsible (e.g., Dempson et al. 1998, Parrish et al. 1998,Hutchinson et al. 2002). High rates of exploitation in ocean fisheries have been associatedwith many stock declines, but the abundance of many stocks nevertheless continues tofall, despite great reductions in marine salmon fisheries during the past couple of decades(Windsor & Hutchingson 1994, Parrish et al. 1998, Dempson et al. 2001, ICES 2002).Marine exploitation rates have been estimated in the range of 70 to 90% for multi-sea-winter (MSW) components, while 1SW stocks have been commonly harvested at 40 to60% (e.g., Hansen 1988, Dempson et al. 2001). The decline of multi-sea-winter salmonstocks in North Atlantic has been a general phenomenon and marine exploitation ratesillustrate that elsewhere in North Atlantic these fishes have predominantly also been sub-ject area to exceedingly high rates of harvesting (NOU 1999, Dempson et al. 2001 and
40
references therein). In the River Teno the exploitation rate of the river fisheries can alsoapproach 70% (Erkinaro et al. 1999), having a significant influence on juvenile densitiesat least in years with low stock abundance. However, some stocks, such as those in therivers Teno, Näätämöjoki and Kola in the Northeastern Atlantic, fluctuate in a cyclic man-ner with no general declining trend (Niemelä et al. submitted). The prohibition of the driftnet fishing since 1989 along the Norwegian coastline has been reported to increase 1SWsalmon catches or escapement in rivers in Northern Norway (Jenssen et al. 1999), whichis one reason for the increased catches of 1SW and 2SW salmon in the River Teno sys-tem, too. In recent years the improved pre-fishery abundance of the northern stocks (ICES2003a) combined with the new management measures introduced in 1990 in the RiverTeno system have also allowed stocks to increase in the tributaries of the River Teno.However natural long-term trends in the abundance of salmon stocks and environmentalfluctuations can mask the effects of regulatory measures of both catches and juvenilesalmon production.
The increased juvenile abundances suggest that the management measures introducedat sea and in the River Teno system have played an important role, together with favour-able circumstances in the marine environment, in increasing the catch of 1SW and 2SWsalmon in the River Teno system. However, the size and variation of the run is highlydependent on the preceding smolt output (Paloheimo & Elson 1974, Chadwick et al.1978, Jonsson et al. 1998), fluctuations in natural mortality during the marine phase(Dempson 1992, Friedland 1998, Friedland et al. 1993) and marine fishing mortality(Crozier & Kennedy 1994b, 1999). Fluctuations in the abundance of salmon are appar-ently strongly affected by annually varying environmental conditions at sea (Scarnecchia1984a, Scarnecchia et al. 1989a,b, Reddin & Friedland 1993, Antonsson et al. 1996,Friedland et al. 1998), especially in areas where marine salmon fisheries have beengreatly reduced or are now prohibited (Friedland & Reddin 1993, Parrish et al. 1998,Walters & Ward 1998, Dempson et al. 2001). Oscillations in abundance can follow a longperiod of between 20 and 30 years of high catches (Bielak & Power 1986) or a shorterperiod of eight or nine years, as in the River Teno system (see chapter 2.3, Fig. 4), andcan also commonly occur over wide geographical areas (Dempson et al. 1998).
Hansen and Jonsson (1989) and McCormick and coauthors (1998) have concluded thata late smolt migration can cause a low return rate of adults. In general, the first monthsand first winter following migration to the sea are critical periods that influence the subse-quent growth, survival and ultimately the abundance of salmon (Hansen & Quinn 1998,Friedland et al. 2003). An exceptionally late smolt run (peak in August) in Northern Nor-way in 1962 resulted in high post smolt mortality and thereafter in a low return of 1SW,2SW and 3SW salmon in subsequent years (Abrahamsen 1968). This is in accordancewith the anecdotal reports of poor salmon catches in the mid 1960s in the River Teno sys-tem (see chapter 2.3, Fig. 5). The timing of the smolt run, or smolt “window”, is consid-ered to be crucial for the survival of salmon (Hansen 1987). In the tributaries of the RiverTeno system the timing of the smolt run has varied considerably between years, forinstance from early June to mid July in 1989–1996 (Kylmäaho & Niemelä 1996). Thisvariation is caused by the timing of the ice break-up (Niemelä et al. 2000) and variable,unpredictable water temperature regimes afterwards. If the smolt migration is delayed,outmigrating smolts can meet an unfavourable sea environment and suffer increased mor-
41
tality, and thereby the predictability of future salmon catches can be poor even if juvenileabundance had been high in the river in preceding years.
3.5 Reference levels for juvenile Atlantic salmon abundance
It is essential for efficient management of salmon stocks to understand the effects ofphysical, chemical and biological factors in the rearing environment on juvenile abun-dance. Therefore, habitat models have been developed for juvenile salmonids to explainthe spatial variation in fish abundance. In the present work, habitat models were used todevelop methods for defining reference levels of juvenile salmon densities using theannual data from the long-term electrofishing monitoring in the River Teno system (VI).Discriminant analysis was used to build a model describing the relationship betweenjuvenile salmon densities and habitat characteristics of electrofishing sites with varyinghabitat types. The permanent electrofishing sites were classified into expected densityclasses (VI). This method allows a yearly inspection of whether the observed parr densi-ties attain the reference levels. This evaluation implies that more than half of the sam-pling sites where habitat characteristics would predict fish densities in the highest catego-ry ( 50 parr per 100 m2) showed observed densities in the mid (10–49 parr per 100 m2) orlow density category (<10 parr per 100 m2). In addition, earlier established microhabitatpreference curves (Mäki-Petäys et al. 2002) were used to assess the habitat–parr densityrelationship in the test data set (HPC method). Similarly, this method also pointed outcertain areas with high-quality habitats that failed to attain the predicted density levels(VI).
The data from these analyses covered the years 1988–1999, a period after the prohibi-tion of the drift net fishery in the coastal area of Norway (since 1989) and after the newfishing regulatory measures introduced in the River Teno system (since 1990). It wasexpected (II) that the densities would increase as a result of the major new regulatorymeasures, but the results indicate that neither have the reference levels of parr densitiesbeen attained nor the parr densities increased (V). The density levels recorded suggestthat large areas of high quality habitat in the River Teno system fail to meet the expecteddensities of juvenile salmon, and factors others than physical habitat characteristics, suchas a lack of female spawners, restrict the juvenile salmon abundance (VI).
Even though some habitat models have succeeded in explaining up to 70–90% of thevariation in juvenile salmonid population densities, many models tend to ignore temporalvariation (e.g., Armstrong et al. 2003). Extensive temporal variation in the densities ofjuvenile salmon at individual sites occurred between years and throughout the summerdue to variation in the spawning escapement in preceding years (V) and due to diurnal,seasonal and ontogenetic habitat shifts within the same stretch of a river (Gibson 1966,Rimmer et al. 1983, Bremset & Berg 1997, Erkinaro et al. 1997). In the River Teno sys-tem, parr densities in different years have been found to peak at individual sites in differ-ent weeks from the middle of June to the beginning of September, and large variation hasalso been found in the frequency different parr age groups between sampling periodsthroughout the typical electrofishing season (IV). In general, parr densities increased fromearly summer towards late August (IV). In spite of these changes in densities observed at
42
individual sites in the River Teno, the predictive ability of the habitat models applied wasgenerally moderate, although the modelling data comprised long-term mean densitiesfrom more than 10 years (VI). When habitat models have been transferred to other riversystems or stream types, their applicability and predictive power typically decreases(Shirvell, 1989, but see Mäki-Petäys et al. 2002). Here, the habitat preference criteriadeveloped by Mäki-Petäys and coauthors (2002) for the River Teno salmon and the HPCmethod based on this were successfully transferred to the neighbouring River Näätämö-joki system (VI). In the case of the River Näätämöjoki, the removal of a subset of data(upper Finnish territory) significantly improved the predictive power of the habitat model.This implies that in certain areas of the river system, high quality juvenile salmon habitatis occupied by parr at very low densities (VI).
Other methods have also been used in assessing the freshwater habitat characteristicsdetermining the juvenile salmon production capacity. Amiro (1993) used the stream gra-dient as a predictor and Grant and Kramer (1990) calculated the percent habitat satura-tion (PHS) as the sum of the predicted territory areas of individual fish in a river. Boththese methods require detailed information on the habitats, and the electrofishing sam-pling design in the PHS method differs from that used in the annual juvenile monitoringin the River Teno system.

4 Management implications and research recommendations
A large amount of information and knowledge is required to manage salmon stocks suc-cessfully, including the number of salmon that can be produced in each river, the numberof spawners required for this production, the movements of salmon at sea and their sur-vival rates. It is equally important to know when and where each stock is harvested, howmany fish are caught and how much effort is required to catch these fish. The monitoringprogramme for the River Teno salmon stocks covers both the juvenile phase in the riverand the abundance and characteristics of the returning adult salmon. In addition to thelong-term monitoring programme of the River Teno, a new index river monitoring pro-gramme has been started in recent years in the River Utsjoki, the largest tributary of theRiver Teno in Finland. Here, the numbers of ascending salmon and descending smolts arebeing estimated with the aid of video cameras. This study aims at creating a long-termdata set to assess the stock-recruitment relationship in the subarctic river, information thatis badly needed especially for healthy northern salmon populations. In addition, the elec-trofishing monitoring programme could be expanded to further facilitate defining refer-ence points and to cover some additional important tributaries.
The management measures that have been implemented in the past have succeeded inmaintaining the River Teno salmon stocks, which still today enable and support diversi-fied fisheries, including coastal net fisheries and combined net and rod fisheries in theriver. The bilateral agreement covering the River Teno fishery in 1979 made the monitor-ing of salmon stocks obligatory for Finland and Norway with the aim to produce scien-tific data on the status of the salmon stocks, including catch statistics, in order to maintainand enhance them by appropriate fishing regulations.
Two highly important fishery regulations affecting the stocks in the River Teno sys-tem took place almost simultaneously: the prohibition of drift net fishing in the coastalarea of Norway since 1989 and new regulatory measures introduced in the River Tenofisheries in 1990. When analysing the long term time series in two periods, 1977–1988and 1989–2003, the estimated mean annual numbers of 1SW and 2SW salmon and previ-ous spawners in the catches were significantly higher after the new measures were imple-mented (Table I). In addition, the numbers of 1SW and 2SW salmon and previous spawn-ers have increased over the entire period from 1977–2003, but the number of 4SWsalmon has declined (Table I). Although the numbers of 1SW salmon indicated a signifi-
44
cant increasing trend in the period before the prohibition of drift net fishing, no trend wasdetected during the later period.
When the abundance of salmon parr (1+ year old) was analysed during the same peri-ods, only one sampling site cluster (in the River Inarijoki) showed higher densities afterthe introduction of the regulatory measures (Table II). The mean fry abundance was sig-nificantly higher during the later period in two out of nine clusters. During the laterperiod, after the prohibition of drift net fishing at sea, parr densities declined significantlyin three and increased in one out of nine clusters, and fry densities increased in three outof nine clusters (Table II). The major regulatory measures in 1989–1990 appear to haveresulted in higher densities of fry, although corresponding trends have been more prob-lematic to detect in parr.
A high juvenile abundance leads to stable and high smolt production, which is essen-tial for healthy, self-sustaining salmon stocks (Jonsson et al. 1998). To increase the smoltproduction and thus the number of salmon returning to the River Teno, spawning escape-ment could still be improved in general and especially in certain areas of the river system(VI). As a single sea age group, 3SW females are the most important individuals forreproduction, accounting for more than 40% of the spawning population (V), and theircontribution to egg deposition is even greater due to their high fecundity (Erkinaro et al.1997). There are certain management measures that could be used to improve the MSWfemale component in the River Teno salmon stock complex. One of the key elements isthe fishing pressure early in the summer, when a large majority of the early run consists ofMSW females (Chapter 2.3, Fig. 7). A reduction in the drift net fishing season or otherlimitations on the drift net effort should be considered to ensure sufficient egg deposition.Similar regulations for the early season coastal net fisheries in Northern Norway wouldhave similar effects as a considerable number of multi-sea-winter salmon originatingfrom the River Teno system are caught there. For instance, the start of the coastal net fish-eries in Troms County, west of Finnmark, has recently been postponed to the mid-June toallow more MSW spawners to enter the rivers (K. Kristoffersen, personal information).One possibility to reduce the fishing mortality of large MSW females is to close the fish-ing season in August earlier than today. A large proportion (c. 20%) of catches in Augustconsist of MSW females (V). At this time just prior to the spawning season, their eco-nomic value is very low whereas their reproductive value is at its highest level during thefishing season.
Wild salmon stocks need to be abundant and genetically diverse to buffer the negativeeffects of escaped farmed salmon (e.g., McGinnity et al. 2003). The current juvenile mon-itoring programme does not distinguish whether the juveniles are progeny of wild orfarmed salmon. To avoid misleading interpretation concerning the relationships betweenthe number of wild salmon in the catch and subsequent juvenile abundance or variationsin juvenile abundance, genetic studies should be started to screen the genetic backgroundof juvenile salmon throughout the River Teno system. In addition, studies prior to thespawning period (August and September) should be intensified to assess the numbers orproportions of escaped salmon in spawning populations.
Rod fishing in tributaries on the Finnish side of the River Teno system has intensifiedin recent years, and there are currently no up-to-date data indicating the status of manytributary stocks. All fishing in the River Teno system takes place without catch quotas andin addition there are practically no limitations on the licences issued or the numbers of
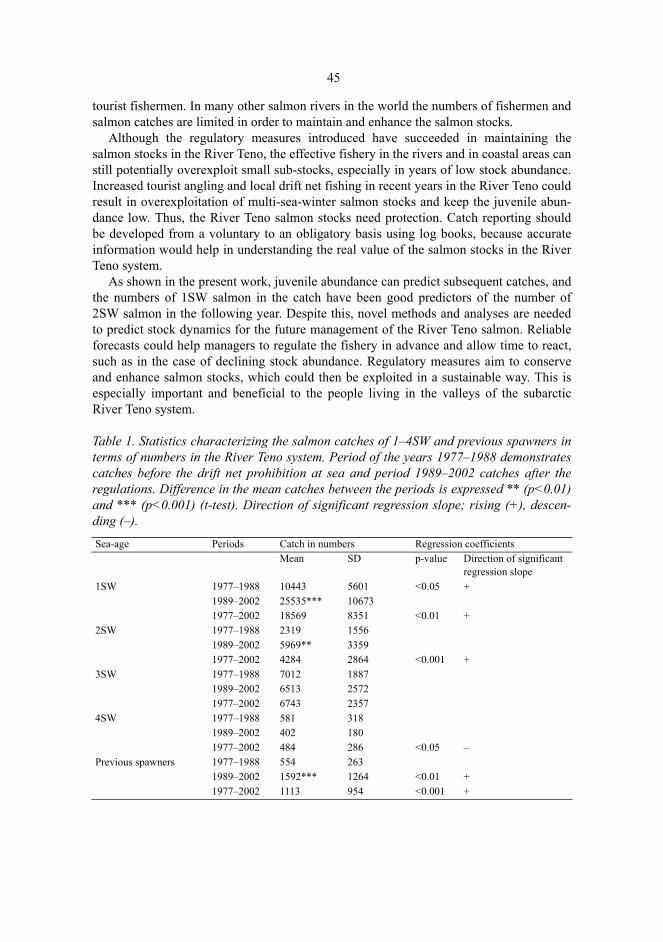
45
tourist fishermen. In many other salmon rivers in the world the numbers of fishermen andsalmon catches are limited in order to maintain and enhance the salmon stocks.
Although the regulatory measures introduced have succeeded in maintaining thesalmon stocks in the River Teno, the effective fishery in the rivers and in coastal areas canstill potentially overexploit small sub-stocks, especially in years of low stock abundance.Increased tourist angling and local drift net fishing in recent years in the River Teno couldresult in overexploitation of multi-sea-winter salmon stocks and keep the juvenile abun-dance low. Thus, the River Teno salmon stocks need protection. Catch reporting shouldbe developed from a voluntary to an obligatory basis using log books, because accurateinformation would help in understanding the real value of the salmon stocks in the RiverTeno system.
As shown in the present work, juvenile abundance can predict subsequent catches, andthe numbers of 1SW salmon in the catch have been good predictors of the number of2SW salmon in the following year. Despite this, novel methods and analyses are neededto predict stock dynamics for the future management of the River Teno salmon. Reliableforecasts could help managers to regulate the fishery in advance and allow time to react,such as in the case of declining stock abundance. Regulatory measures aim to conserveand enhance salmon stocks, which could then be exploited in a sustainable way. This isespecially important and beneficial to the people living in the valleys of the subarcticRiver Teno system.
Table 1. Statistics characterizing the salmon catches of 1–4SW and previous spawners interms of numbers in the River Teno system. Period of the years 1977–1988 demonstratescatches before the drift net prohibition at sea and period 1989–2002 catches after theregulations. Difference in the mean catches between the periods is expressed ** (p<0.01)and *** (p<0.001) (t-test). Direction of significant regression slope; rising (+), descen-ding (–).
Sea-age Periods Catch in numbers Regression coefficientsMean SD p-value Direction of significant
regression slope1SW 1977–1988 10443 5601 <0.05 +
1989–2002 25535*** 106731977–2002 18569 8351 <0.01 +
2SW 1977–1988 2319 15561989–2002 5969** 33591977–2002 4284 2864 <0.001 +
3SW 1977–1988 7012 18871989–2002 6513 25721977–2002 6743 2357
4SW 1977–1988 581 3181989–2002 402 1801977–2002 484 286 <0.05 –
Previous spawners 1977–1988 554 2631989–2002 1592*** 1264 <0.01 +1977–2002 1113 954 <0.001 +
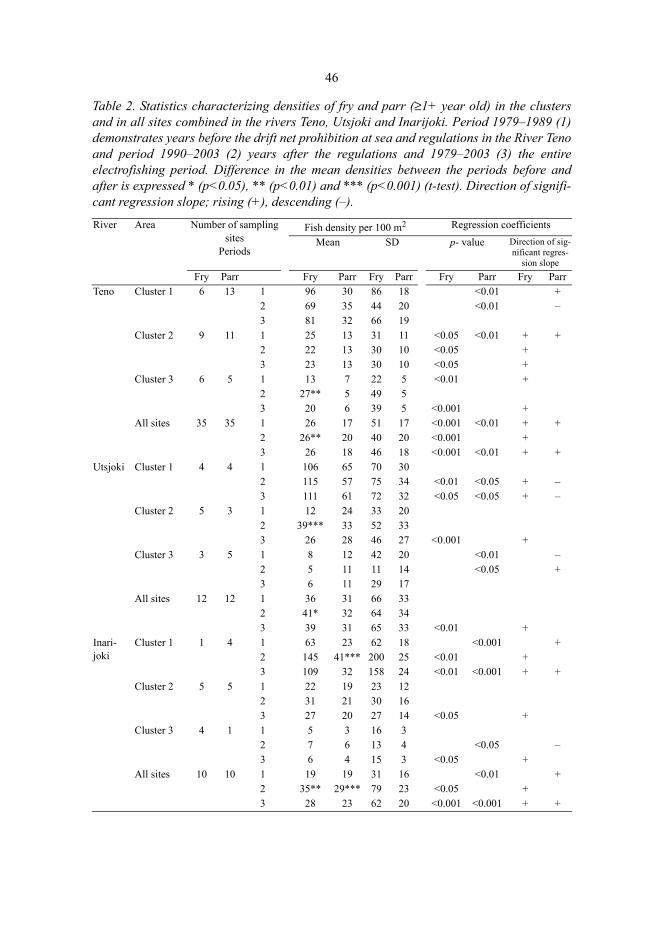
46
Table 2. Statistics characterizing densities of fry and parr (≥1+ year old) in the clustersand in all sites combined in the rivers Teno, Utsjoki and Inarijoki. Period 1979–1989 (1)demonstrates years before the drift net prohibition at sea and regulations in the River Tenoand period 1990–2003 (2) years after the regulations and 1979–2003 (3) the entireelectrofishing period. Difference in the mean densities between the periods before andafter is expressed * (p<0.05), ** (p<0.01) and *** (p<0.001) (t-test). Direction of signifi-cant regression slope; rising (+), descending (–).
River Area Number of sampling sites
Periods
Fish density per 100 m2 Regression coefficients
Mean SD p- value Direction of sig-nificant regres-
sion slopeFry Parr Fry Parr Fry Parr Fry Parr Fry Parr
Teno Cluster 1 6 13 1 96 30 86 18 <0.01 +2 69 35 44 20 <0.01 –3 81 32 66 19
Cluster 2 9 11 1 25 13 31 11 <0.05 <0.01 + +2 22 13 30 10 <0.05 +3 23 13 30 10 <0.05 +
Cluster 3 6 5 1 13 7 22 5 <0.01 +2 27** 5 49 53 20 6 39 5 <0.001 +
All sites 35 35 1 26 17 51 17 <0.001 <0.01 + +2 26** 20 40 20 <0.001 +3 26 18 46 18 <0.001 <0.01 + +
Utsjoki Cluster 1 4 4 1 106 65 70 302 115 57 75 34 <0.01 <0.05 + –3 111 61 72 32 <0.05 <0.05 + –
Cluster 2 5 3 1 12 24 33 202 39*** 33 52 333 26 28 46 27 <0.001 +
Cluster 3 3 5 1 8 12 42 20 <0.01 –2 5 11 11 14 <0.05 +3 6 11 29 17
All sites 12 12 1 36 31 66 332 41* 32 64 343 39 31 65 33 <0.01 +
Inari-joki
Cluster 1 1 4 1 63 23 62 18 <0.001 +2 145 41*** 200 25 <0.01 +3 109 32 158 24 <0.01 <0.001 + +
Cluster 2 5 5 1 22 19 23 122 31 21 30 163 27 20 27 14 <0.05 +
Cluster 3 4 1 1 5 3 16 32 7 6 13 4 <0.05 –3 6 4 15 3 <0.05 +
All sites 10 10 1 19 19 31 16 <0.01 +2 35** 29*** 79 23 <0.05 +3 28 23 62 20 <0.001 <0.001 + +

References
Abrahamsen B (1968) Undersøkelser over laks i Finnmark. Sœrtrykk av Jakt-Fiske-Friluftsliv 9: 1–12.
Amiro PG (1993) Habitat measurement and population estimation of juvenile Atlantic salmon (Salmosalar). In: Gibson RJ & Cutting RE (eds) Production of Juvenile Atlantic Salmon, Salmo salar, inNatural Waters. Can Spec Publ Fish Aquat Sci 118: 81–97.
Anon. (1969) Salmon and sea trout fisheries 1876–1968. Official statistics of Norway. Oslo-Kongsvinger, Central Bureau of Statistics, Norway.
Antonsson T, Gudbergsson G & Gudjonsson S (1996) Environmental continuity in fluctuation of fishstocks in the North Atlantic Ocean, with particular reference to Atlantic Salmon. N Am J FishManage 16: 540–547.
Armstrong JD, Kemp PS, Kennedy GJA, Ladle M & Milner NJ (2003) Habitat requirements of At-lantic salmon and brown trout in rivers and streams. Fish Res 62: 143–170.
Bagliniere JL & Maisse G (1985) Precocious maturation and smoltification in wild Atlantic salmonin the Armorican Massif, Aquaculture 45: 249–263.
Bagliniere J-L & Champigneulle A (1986) Population estimates of juvenile Atlantic salmon, Salmosalar, as indices of smolt production in the R. Scorff, Brittany. J Fish Biol 29: 467–482.
Berg OK (1985) The formation of non-anadromous populations of Atlantic salmon, Salmo salar L.,in Europe. J Fish Biol 27: 805–815.
Berg M, Hagala P & Berg OK (1988) Merking av utgytt laks i Altaelva, Finnmark. Rapport Direk-toratet for Naturforvaltning 7.
Bielak AT & Power G (1986) Change in mean weight, sea-age composition, and catch per unit-effortof Atlantic salmon (Salmo salar) angled in the Godbout River, Quebec 1859–1983. Can J FishAquat Sci 43: 281–287.
Bohlin T (1990) Estimation of population parameters using electric fishing: aspects of the samplingdesigh with emphasis on salmonids in streams. In: Cowx IG (ed) Developments in Electric Fish-ing. Blackwell Scientific Publications, Oxford, 156–173.
Bohlin T, Hamrin S, Heggberget TG, Rasmussen G & Saltveit SJ (1989) Electrofishing – Theory andpractice with special emphasis on salmonids. Hydrobiologia 173: 9–43.
Bohlin T & Cowx IG (1990) Implication of unequal probability of capture by electric fishing on theestimation of population size, In: Cowx IG (ed) Developments in Electric Fishing . Blackwell Sci-entific Publications, Oxford, 145–155.
Borgstrøm R & Skaala Ø (1993) Size-dependent catchability of brown trout and Atlantic salmon parrby electrofishing in a low conductivity stream. Nord J Freshw Res 68: 14–21.
48
Bremset G & Berg OK (1997) Density, size-at-age and distribution of young Atlantic salmon (Salmosalar) and brown trout (Salmo trutta) in deep pools. Can J Fish Aquat Sci 54: 2827–2836.
Chaput G, Allard J, Caron F, Dempson JB, Mullins CC & O’Connel MF (1998) River-specific targetspawning requirement for Atlantic salmon (Salmo salar) based on a generalized smolt productionmodel. Can J Fish Aquat Sci 55: 246–261.
Chadwick EMP (1985) The influence of spawning stock on production and yield of Atlantic salmon,Salmo salar L., in Canadian rivers. Aquaculture 1: 111–119.
Chadwick, E.M.P., Porter, T.R. & Downton, P. (1978) Analysis of growth of Atlantic salmon (Salmosalar) in a small Newfoundland river. J Fish Res Bd Can 35: 60–68.
Chadwick EMP & Randall RG (1986) A stock-recruitment relationship for Atlantic salmon in the Mi-ramichi and Restigouche Rivers, New Brunswick. N Am J Fish Manage 6: 200–203.
Cowx IG (ed) (1990) Development in electric fishing. Fishing News Books, Blackwell ScientificPublications, Oxford.
Crisp DT (1995) Dispersal and growth rate of 0-group salmon (Salmo salar L.) from point-stockingtogether with some information from scatter-stocking. Ecol Freshw Fish 4: 1–8.
Crozier WW & Kennedy GJA (1994a) Application of semi-quantitative electrofishing to juvenile sal-monid stock surveys. J Fish Biol 45: 159–164.
Crozier WW & Kennedy GJA (1994b) Marine exploitation of Atlantic salmon (Salmo salar L.) fromthe River Bush, Northern Ireland. Fish Res 19: 141–155.
Crozier WW & Kennedy GJA (1995) The relationship between a summer fry (0+) abundance index,derived from semi-quantitative electrofishing, and egg deposition of Atlantic salmon, in the RiverBush, Northern Ireland. J Fish Biol 47: 1055–1062.
Crozier WW & Kennedy GJA (1999) Relationship between marine growth and marine survival ofone sea winter Atlantic salmon, Salmo salar L., from the River Bush, Northern Ireland. Fish Man-age Ecol 6: 89–96.
Dahl K (1910) Age and growth of salmon and trout in Norway as shown by their scales. Salmon TroutAssoc. IX. London.
Dempson JB (1992) Status of Atlantic salmon populations of Conne river, Newfoundland, in 1991.Canadian Atlantic Fisheries Advisory Committee Research Document 92/4.
Dempson JB, Reddin DG, O’Connel MF, Helbig J, Bourgeois CE, Mullis C, Porter TR, Lilly G, Car-cadden J, Stenson GB & Kulka D (1998) Spatial and temporal variation in Atlantic salmon in theNewfoundland-Labrador region with emphasis on factors that may have contributions to low re-turns in 1997. Department of Fisheries and Oceans, Canadian Stock Assessment Secretariat Re-search Document 98/114.
Dempson JB, Schwarz CJ, Reddin DG, O’Connel MF, Mullins CC & Bourgeois CE (2001) Estima-tion of marine exploitation rates on Atlantic salmon (Salmo salar L.) stocks in Newfoundland,Canada. ICES J Mar Sci 58 (1): 331–341.
Ducharme LJA (1969) Atlantic salmon returning for their fifth and sixth consecutive spawning trips.J Fish Res Bd Can 26: 1661–1664.
Dunkley D (1986) Changes in the timing and biology of salmon runs. In: Jenkins D & Shearer WM(eds) The status of Atlantic salmon in Scotland. I.T.E. Symp. 15: 20–27.
Elliot JM (1990) Long-term research and the future of the aquatic environment. Freshwater Biology23: 1–164.
Elliot JM (1994) Quantitative ecology and the brown trout. Oxford University Press, Oxford.Elo K, Vuorinen JA & Niemelä E (1994) Genetic resources of Atlantic salmon (Salmo salar L.) in
Teno and Näätämö Rivers, northernmost Europe. Hereditas 120: 19–28.Elo K, Erkinaro J, Vuorinen JA & Niemelä E (1995) Hybridization between Atlantic salmon (Salmo
salar) and Brown trout (S.trutta) in the Teno and Näätämö River Systems, northernmost Europe.Nordic J Freshw Res 70: 56–61.

49
Englund V, Niemelä E, Länsman M & Heino M (1999) Variations in Atlantic salmon, Salmo salarL., smolt age in tributaries of the River Teno, Finland. Fish Manage Ecol 6: 83–86.
Erkinaro J (1995) The age structure and distribution of Atlantic salmon parr, Salmo salar L., in smalltributaries and main stem of the subarctic river Teno, northern Finland. Ecol Freshw Fish 4: 53–61.
Erkinaro J (1997) Habitat shifts of juvenile Atlantic salmon in northern rivers. Migration patterns, ju-venile production and life histories. Doctoral Dissertation. Acta Universitatis Ouluensis A 293Oulu.
Erkinaro J & Niemelä E (1995) Growth differences between the Atlantic salmon parr, Salmo salar,of nursery brooks and natal rivers in the River Teno watercourse in northern Finland. Environ BiolFish 42: 277–287.
Erkinaro J Shustov Yu & Niemelä E (1995) Enhanced growth and feeding rate in Atlantic salmonparr occupying a lacustrine habitat in the River Utsjoki, northern Scandinavia. J Fish Biol 47:1096–1098.
Erkinaro J, Dempson JB, Julkunen M & Niemelä E (1997) Importance of ontogenetic habitat shiftsto juvenile output and life history of Atlantic salmon in a large subarctic river: an approach basedon analysis of scale characteristics. J Fish Biol 51: 1174–1185.
Erkinaro J, Julkunen M & Niemelä E. (1998a) Migration of juvenile Atlantic salmon Salmo salar insmall tributaries of the subarctic River Teno, northern Finland. Aquaculture 16: 105–119.
Erkinaro J Niemelä E Saari A Shustov Y & Jørgensen L (1998b) Timing of habitat shift by Atlanticsalmon parr from fluvial to lacustrine habitat: analysis of age distribution, growth, and scale char-acteristics. Can J Fish Aquat Sci 55: 2266–2273.
Erkinaro J, Økland F, Moen K & Niemelä E (1999) Return migration of the Atlantic salmon in theTana River: distribution and exploitation of radiotagged multi-sea-winter salmon. Bor EnvironRes 4: 115–124.
Fiske P & Lund RA (1999) Escapes of reared salmon in coastal and riverine fisheries in the period1989–1998. NINA Oppdragsmelding 603.
Franklin JF (1989) Importance and justification of long-term studies in ecology. In: Likens GE (ed)Long-term studies in ecology. Springer-Verlag, New York, 3–9.
Friedland KD (1998) Oceanic climate influences on critical Atlantic salmon (Salmo salar) life historyevents. Can J Fish Aquat Sci 55(Suppl. 1): 180–190.
Friedland KD & Reddin DG (1993) Marine survival of Atlantic salmon from indices of post-smoltgrowth and sea temperature. In: Mills DH (ed) Salmon in the Sea and New Enhancement Strate-gies. Oxford: Fishing News Books, 119–138.
Friedland KD, Reddin DG & Kocik JF (1993) Marine survival of North American and European At-lantic salmon: effects of growth and environment. ICES, J Mar Sci 50: 481–492.
Friedland KD, Hansen LP & Dunkley DA (1998) Marine temperatures experienced by postsmoltsand the survival of Atlantic salmon (Salmo salar L.) in the North Sea area. Fish Oceanog 7: 22–34.
Friedland KD, Reddin DG & Castonguay M (2003) Ocean thermal conditions in the post-smolt nurs-ery of North American Atlantic salmon. ICES J Mar Sci 69: 343–355.
Gee AS & Miller NJ (1980) Analysis of 70-year catch statistics for Atlantic salmon (Salmo salar) inthe River Wye and implications for management of stocks. J Appl Ecol 17: 41-57.
Gibson RJ (1966) Some factors influencing the distribution of brook trout and young Atlantic salmon.J Fish Res Bd Can 23: 1977–1980.
Grant JWA & Kramer DL (1990) Terrotory size as a predictor of the upper limit to population densityof juvenile salmonids in streams. Can J Fish Aquat Sci 47: 1724–1737.
Haikonen A, Romakkaniemi A, Keinänen M, Mäntyniemi S & Vatanen S (2003) Monitoring of thesalmon and trout stocks in the River Tornionjoki in 2002. Riista- ja kalatalouden tutkimuslaitos,Kala- ja riistaraportteja nro 275. Helsinki.
50
Hansen LP (1987) Growth, migration and survival of lake released juvenile anadromous Atlanticsalmon Salmo salar L. Fauna Norw Ser A, 8: 29–34.
Hansen LP (1988) Status of exploitation of Atlantic salmon in Norway. In: Mills D & Piggins D (eds)Atlantic salmon: Planning for the Future. Croom Helm, London & Sydney, Timber Press, PortlandOregon, 143–161.
Hansen LP & Jonsson B (1989) Salmon ranching experiments in the River Imsa: effects of timing ofAtlantic salmon (Salmo salar) smolt migration on survival to adults. Aquaculture 82: 367–373.
Hansen LP & Jonsson B (1994) Homing of Atlantic salmon: effects of juvenile learning on transplant-ed post-spawners. Anim Behav 47: 220–222.
Hansen LP & Quinn TP (1998) The marine phase of the Atlantic salmon (Salmo salar) life cycle, withcomparisons to Pacific salmon. Can J Fish Aquat Sci 55 (Suppl. 1): 104–118.
Heggberget TG, Lund RA, Ryman N & Ståhl G (1986) Growth and genetic variation of Atlantic salm-on (Salmo salar) from different sections of the River Alta, North Norway. Can J Fish Aquat Sci43: 1828–1835.
Heggenes J (1996) Habitat selection by brown trout (Salmo trutta) and young Atlantic salmon (Salmosalar) in streams: static and dynamic hydraulic modelling. Regul Riv 12: 155–169.
Heggenes J, Bradrand Å & Saltveit SJ (1991) Microhabitat use by brown trout, Salmo trutta L. andAtlantic salmon, S.salar L., in a stream: a comparative study of underwater and river bank obser-vations. J Fish Biol 38: 259–266.
Heinimaa S & Erkinaro J (2004) Characteristics of mature male parr in the northernmost Atlanticsalmon populations. J Fish Biol 64: 1–8.
Henriksen G & Moen K (1997) Interactions between seals and salmon fisheries in Tana river and Tan-afjord, Finnmark, North Norway, and possible consequences for the harbour seal (Phoca vitulina).Fauna Norv Ser A 18: 21–31.
Hilborn R & Walters CJ (1992) Quantitative fisheries stock assessment: choice, dynamics and uncer-tainty. Chapman and Hall, New York.
Hutchinson P, Welch D, Boehlert G & Whelan K (2002) A synthesis of the joint meeting: Causes ofmarine mortality of salmon in the North Pacific and North Atlantic oceans and in the Baltic Sea.N Pac Anadrom Fish Comm Tech Rep 4: 93–96.
ICES (1990) Report of the Working Group on North Atlantic salmon. ICES CM 1990/Assess: 11.ICES (2002) Report of the working group on North Atlantic Salmon. ICES CM 2002/Assess: 14.ICES (2003a) Report of the working group on North Atlantic Salmon. ICES CM 2003/Assess: 19.ICES (2003b) Report of the Baltic Salmon and Trout Assessment Working Group. ICES CM 2003/
ACFM:20.Jensen AJ & Johnsen BO (1986) Different adaptation strategies of Atlantic salmon (Salmo salar)
population to extreme climates with special reference to some cold Norwegian rivers. Can J FishAquat Sci 43: 980–984.
Jensen AJ & Johnsen BO (1988) The effect of river flow on the results of electrofishing in a large,Norwegian salmon river. Verh Internat Verein Limnol 23: 1724–1729.
Jensen AJ & Saksgård L (1987) Fiskeribiologiske undersøkelser i lakseførende deler av Beiarelva,Saltdalselva, Lakselva of Ranaelva, Nordland, 1978–1985, Direktoratet for naturforvaltning, DN-rapport, Gul serie 9-1987, Trondheim.
Jensen AJ, Zubchenko A, Hvidsten NA, Johnsen BO, Kashin E, Kuzmin O & Naesje TF (1997) Acomparative study of life histories of Atlantic salmon in two Norwegian and two Russian rivers,NINA-NIKU Project Report 7.
Jensen AJ, Zubchenko AV, Heggberget TG, Hvidsten NA, Johnsen BO, Kuzmin O, Loenko AA,Lund RA, Martynov VG, Nœsje TF, Sharov AF and Økland F (1999) Cessation of the Norwegiandrift net fishery: changes observed in Norwegian and Russian populations of Atlantic salmon.ICES J Mar Sci 56: 84–95.
Jones JW (1959) The Salmon. Collins, London.
51
Jonsson N, Hansen LP & Jonsson B (1991) Variation in age, size and repeat spawning of adult At-lantic salmon in relation to river discharge. J Anim Ecol 60: 937–947.
Jonsson N, Jonsson B & Hanssen LP (1998) The relative role of density-dependent and density-inde-pendent survival in the life cycle of Atlantic salmon, Salmo salar. J Anim Ecol 67: 751–762.
Jørgensen L, Amundsen P-A, Gabler H-M, Halvorsen M, Erkinaro J & Niemelä E 1999. Spatial dis-tribution of Atlantic salmon parr (Salmo salar L.) and bullhead (Cottus gobio L.) in lotic and lentichabitats of a diversiform watercourse in northern Fennoskandia. Fish Res 41: 201–211
Julkunen M & Niemelä E (ed) (1997) Electrofishing as a mehod of density estimation of salmon ju-veniles in the River Teno. Assessment and development of the method for a monitoring pro-gramme, Finnish Game and Fisheries Research Institute, Kalatutkimuksia – Fiskundersökningar135, Helsinki.
Keenleyside MHA & Yamamoto FT (1962) Territorial behaviour of juvenile Atlantic salmon (Salmosalar). Behaviour 19: 139–169.
Kuusela, J. 1996: SUOMU II – A new machine vision aided scale reading system. Machine Vision1992–1996. Final Report. TEKES, Technology Programme Report 15/96: 79–80.
Kuzmin OG & Smirnov Yu A (1982) Environmental factors and growth of young Atlantic salmon,Salmo salar (Salmonidae), in small rivers of the Kola Peninsula. J Ichthyol 22: 42–51.
Kylmäaho M, Niemelä E, Karppinen P, Erkinaro J & Moen K (1996) Tuloksia Tenojoen ja Näätämö-joen vesistöalueilla vuonna 1995 tehdyistä tutkimuksista, Riista- ja kalatalouden tutkimuslaitos,Kala- ja riistaraportteja nro 72, Helsinki.
L’Abee-Lund JH, Jonsson B, Jensen AJ, Sœttem LM, Heggberget TG, Johnsen BO & Nœsje TF(1989) Latitudinal variation in life-history characteristics of sea-run migrant brown trout (Salmotrutta). J Anim Ecol 58: 525–542.
Lysenko LR (1997) On females of Salmo salar of the Varzuga River returning to the river in the yearof downstream migration. J Ichthyol 5: 409–410.
Martin JHA & Mitchell KA (1985) Influence of sea temperature upon the numbers of grilse and mul-ti-sea-winter Atlantic salmon (Salmo salar) caught in the vicinity of the River Dee (Aberdeen-shire). Can J Fish Aquat Sci 42: 1513–1521.
McCormick SD Hansen LP Quinn TP & Saunders RL (1998) Movement, migration and smolting ofAtlantic salmon (Salmo salar) Can J Fish Aquat Sci 55: 77–92.
McDowell N (2002) Stream of escaped farm fish raises fears for wild salmon. Nature 416: 571.McGinnity P, Prodöhl P, Ferguson A, Hynes R, Maoileidigh NO, Baker N, Cotter D, O’hea B, Cooke
D, Rogan G, Taggart J & Cross T (2003) Fitness reduction and potential extinction of wild popu-lations of Atlantic salmon, Salmo salar, as a result of interactions with escaped farm salmon. ProcR Soc Lond, Doi 10.1098/rspb.2003.2520
Meerburg DJ (ed) (1986) Salmonid age at maturity. Can Spec Publ Fish Aquat Sci 89: 118 p.Metcalfe NB & Thorpe JE (1990) Determinants of geograhpical variation in the age of seaward-mi-
grating salmon, Salmo salar. J Anim Ecol 59: 135–145.Mills DH (1989) Ecology and management of Atlantic salmon. Chapman and Hall, London.Moran P A P (1951) A mathematical theory of animal trapping. Biometrica 38: 307–311.Morantz DL, Sweeney RK, Shirwell CS & Longard DA (1987) Selection of microhabitat in summer
by juvenile Atlantic salmon (Salmo salar). Can J Fish Aquat Sci 44: 120–129.Mäki-Petäys, A., Huusko, A., Erkinaro, J. & Muotka, T. 2002: Transferability of habitat suitability
criteria of juvenile Atlantic salmon (Salmo salar) Can J Fish Aquat Sci 59: 218–228.Niemelä E, Mäkinen TS, Moen K, Hassinen E, Erkinaro J, Länsman M & Julkunen M (2000) Age,
sex ratio and timing of the catch of kelts and ascending Atlantic salmon in the subarctic RiverTeno. J Fish Biol 56: 974–985.
Niemelä E, Erkinaro J, Kylmäaho M, Julkunen M & Moen K (2001) Näätämöjoen lohen poikastiheysja kasvu. Riista- ja kalatalouden tutkimuslaitos. Kalantutkimuksia nro 176. Helsinki

52
Niemelä E, Länsman M, Erkinaro J, Kylmäaho M & Brørs S (2003) Lohikantojen tila Teno- jaNäätämöjoen vesistöissä vuosina 1998–2000. Riista- ja kalatalouden tutkimuslaitos, Kala- ja riis-taraportteja nro 292, Helsinki.
NOU (1999) Til laks åt alle kan ingen gjera? Statens tryking, Oslo.Paloheimo JE & Elson PF (1974) Reduction of Atlantic salmon (Salmo salar) catches in Canada at-
tributed to the Greenland fishery. J Fish Res Bd Can 31: 1467–1480.Parrish DG, Behnke RJ, Gephard SR, McCormick SD & Reeves GH (1998) Why aren`t there more
Atlantic salmon (Salmo salar)? Can J Fish Aquat Sci 51 (Suplement 1): 281–287.Peterson NP & Cederholm CJ (1984) A comparison of the removal method and mark-recapture meth-
ods of population estimation for juvenile coho salmon in a small stream. N Am J Fish Managem4: 99–102.
Pihlaja O, Niemelä E & Erkinaro J (1998a) Introduction and dispersion of the bullhead, Cottus gobioL., in a sub-Arctic salmon river in northern Finland. Fish Manage Ecol 5: 139–146.
Pihlaja O, Julkunen M, Niemelä E & Erkinaro J (1998b) Changes in the density of introduced bull-head, Cottus gobio L., and its impact on juvenile Atlantic salmon, Salmo salar L., densities in asub-Arctic salmon river in northern Finland. Fish Manage Ecol 5: 189–199.
Power G (1969) The salmon of Ungava Bay. Arctic Institute of North America Technical Papers 22,1–73.
Power G (1981) Stock characteristics and catches of Atlantic salmon (Salmo salar) in Quebec, andNewfoundland and Labrador in relation to environmental variables. Can J Fish Aquat Sci 38:1601–1611.
Prouzet P (1990) Stock characteristics of Atlantic salmon (Salmo salar) in France: a review. AquatLiving Resour 3: 85–97.
Quinn TP & Dittman AH (1990) Pacific salmon migrations and homing: mechanisms and adaptivesignificance. Trend Ecol Evol 5: 174–177.
Randall RG (1990) Effects of water temperature, depth, conductivity and survey area on the catcha-bility of juvenile Atlantic salmon by electric fishing in New Brunswick streams. In: Cowx IG (ed.)Developments in Electric Fishing. Blackwell Scientific, Oxford, 79–90.
Reddin DG & Friedland KF (1993) Marine environmental factors influencing the movement andsurvival of Atlantic salmon. In: Mills D (ed.) Salmon in the sea. Blackwell Scientific Publications,London, 79–103.
Rikstad A (1982) Merking av voksen laks Salmo salar i Tanafjorden i perioden 1977–1980. Rapportfra Fiskerikonsulenten i Finnmark, Lakselv, Nr 1.
Riley SC, Haedrich RL & Gibson RJ (1993) Negative bias in removal estimates of Atlantic salmonparr relative to stream size. J Freshw Ecol 8: 97–101.
Rimmer DM, Paim U & Saunders RL (1983) Autumnal habitat shift of juvenile Atlantic salmon (Sal-mo salar) in a small river. Can J Fish Aquat Sci 40: 671–680.
Saksgård LM & Heggberget TG (1990) Estimates of density of presmolt Atlantic salmon (Salmosalar) in a large north Norwegian river. In: Cowx IG (ed) Developments in Electric fishing. Black-well Scientific Publication, Oxford, 102–108.
Saksgård LM, Heggberget TG, Jensen AJ & Hvidsten NA (1992) Utbygging av Altaelva – virkningerpå laksebestanden. NINA. Forskningsrapport 34.
Saltveit S J (1996) Fiskeribiologisk uttalelse begroing og ungfisk. Laboratorium for ferskvannsøko-logi og innlandsfiske. Zoologisk Museum, Universitetet i Oslo. Rapport 162.
Saunders RL (1986) The scientific and management implications of age and size at sexual maturityin Atlantic salmon (Salmo salar). In: Meerburg DJ (ed) Salmonid age at maturity. Can Spec PublFish Aquat Sci. 89: 3–6.
Saunders RL & Gee JH (1964) Movements of young Atlantic salmon in a small stream. J Fish ResBoard Can 21: 27–36.
53
Saunders RL, Henderson EB & Glebe BD (1982). Precocious sexual maturation and smoltificationin male Atlantic salmon (Salmo salar). Aquaculture 28: 15–22.
Saunders RL, Henderson EB, Glebe BD & Loudenslager EJ (1983) Evidence of a major environmen-tal component in determination of the grilse:larger salmon ratio in Atlantic salmon (Salmo salar).Aquaculture 33: 107–118.
Saunders RL & Schom CB (1985) Importance of the variation in life history parameters of Atlanticsalmon (Salmon salar). Can J Fish Aquat Sci 42: 615–618.
Scarnecchia DL (1984a) Climatic oceanic variations affecting yield of Icelandic stocks of Atlanticsalmon. Can J Fish Aquat Sci 41: 917–945.
Scarnecchia, D.L. (1984b). Forecasting yields of two-sea-winter Atlantic salmon (Salmo salar) fromIcelandic rivers. Can J Fish Aquat Sci 41: 1234–1240.
Scarnecchia DL, Isaksson A & White SA (1989a) Effects of oceanic variations and the West Green-land fishery on age at maturity of Icelandic west coast stocks of Atlantic salmon (Salmo salar).Can J Fish Aquat Sci 46: 16–27.
Scarnecchia DL, Isaksson A & White SA (1989b) Ocean and riverine influence on variations in yieldamong Icelandic stocks of Atlantic salmon. Trans Am Fish Soc 118: 482–494.
Schnute J (1983) A new approach to estimating populations by the removal method, Can J Fish AquatSci 40: 2153–2169.
Seber GAF (1982) The estimation of animal abundance and related parameters. C. Griffin and Co.Ltd., 2nd ed. London.
Shearer WM (1992) The Atlantic Salmon: Natural History, Exploitation and future Management.Fishing News Books, Blackwell, Oxford.
Shirvell CS (1989) Habitat models and their predictive capability to infer habitat effects on stock size.In Levings CD, Holtby LB & Henderson MA (eds) Proceedings of the National Workshop of Ef-fects of Habitat Alteration on Salmonid Stocks. Can Spec Publ Fish Aquat Sci 105: 173–179.
Stewart-Oaten A, Bence JR & Osenberg CW (1992) Assessing effects of unreplicated perturbations:no simple solutions. Ecology 73: 1396–1404.
SYSTAT (1996) SYSTAT 6.0 for windows: Statistics, SPSS Inc., Chicago.Thorpe JE (1988) Salmon migration. Science Progress Oxford 72: 345–370.Thorpe JE (1994) Reproductive strategies in Atlantic salmon, Salmo salar L. Aquaculture 25: 77–87.Thorpe JE & Morgan RIG (1980) Growth-rate and smolting-rate of progeny of male Atlantic salmon
parr, Salmo salar L. J Fish Biol.17: 451–460.Walters C & Ward B (1998). Is solar radiation responsible for declines in marine survival rates of
anadromous salmonids that rear in small streams? Can J Fish Aquat Sci 55: 2533–2538.Whoriskey FG (1998) 1997 Ponoi river program. Annual report, Atlantic Salmon Federation, St. An-
drews, NB, iv + 5 pp. + figures and tables.Whoriskey FG, Kuzhmin O & Goodhart D (1996) Monitoring of sport fishing catches of Atlantic
salmon (Salmo salar L.) of the Ponoi River, Russia, to document population characteristics. PolArch Hydrobiol 43: 167–177.
Windsor ML & Hutchinson P (1994) International management of Atlantic salmon, Salmo salar L.,by the North Atlantic Salmon Conservation Organization, 1984–1994. Fish Manage Ecol 1:31–44.
Winstone, A.J. (1993). Juvenile salmon stock assessment and monitoring by the national rivers au-thority-a review. In: Gibson RJ & Cutting RE (eds) Production of juvenile Atlantic salmon, Salmosalar, in natural waters Can Spec Publ Fish Aquat Sci 118: 123–126.
WWF (2001) The status of wild Atlantic salmon: a river by river assessment. Available: http://www.wwf.org.uk/filelibrary/pdf/atlanticsalmon.pdf.
Zalewski M & Cowx IG (1990). Factors affecting the efficiency of electric fishing. In: Cowx IG &Lamarque P (eds) Fishing with Electricity. Application in Freshwater Management, BlackwellScientific Publications, Oxford, 89–111.

54
Zippin C (1956) An evaluation of the removal method of estimating animal populations. Biometrics12: 163–189.
Yoccoz NG, Nichols JD & Boulinier T (2001) Monitoring of biological diversity in space and time.Trends Ecol Evol 8: 446–453.
Youngson AF & Verspoor E (1998) Interactions between wild and introduced Atlantic salmon (Sal-mo salar). Can J Fish Aquat Sci 55 (Suppl. 1): 153–160.
Økland F, Jonsson B, Jenssen AJ & Hansen LP (1993) Is there a threshold size regulating seawardmigration of brown trout and Atlantic salmon. J Fish Biol 42: 541–550.