variation in quality and characteristics of the salted ... · production of salted fish in the...
TRANSCRIPT
Production of salted fish in the Nordic countries Variation in quality and characteristics of the salted products
Kristín Anna Þórarinsdóttir Ingebrigt Bjørkevoll Sigurjón Arason
Vinnsla, virðisaukning og eldi Skýrsla Matís 46-10 Desember 2010 ISSN 1670-7192

Titill / Title Production of salted fish in the Nordic countries. Variation in quality and characteristics of the salted products.
Höfundar / Authors Kristín Anna Þórarinsdóttir1), Ingebrigt Bjørkevoll2), Sigurjón Arason1) 1Matís, 2Møreforsking Marin Ålesund
Skýrsla / Report no. 46‐10 Útgáfudagur / Date: Desember 2010
Verknr. / project no. 2002‐1925 Project name: Standard for saltfisk
Styrktaraðilar / funding: NORA (Journal nr. 510‐036).
Summary in English:
The Nordic countries are the largest exporters of salted gadoid products, whereas countries in South‐Europe and Latin America are the biggest importers. In Norway, Iceland and Faroe Islands, cod is primarily used for the production. The characteristics of the salted fish, such as commercial quality and weight yield vary between the countries and between producers. These attributes are influenced by differences in catching methods, handling and salting methods. This report summarises the variation in these procedures, and in addition, the market segmentation of salted products, from the different countries.
English keywords: Salted cod, seasonal variation, fish processing, market,
Ágrip á íslensku:
Meginhluti saltfiskframleiðslu í heiminum fer fram innan norrænu landanna en stærsti neytendahópurinn er í S‐Evrópu og S‐Ameríku. Þorskur er megin hráefnið en einnig er framleiddur saltfiskur úr öðrum skyldum tegundum, s.s. ufsa, löngu, ýsu og keilu. Eiginleikar saltfiskafurð, svo sem gæði og nýting, eru breytilegir milli framleiðslulanda og framleiðenda. Þessir breytur eru háðar veiðiaðferðum, hráefnismeðhöndlun og söltunaraðferðum. Skýrslan er samantekt á breytileika í þessum þáttum milli framleiðslulanda, ásamt úttekt á hlutdeild þeirra á saltfiskmörkuðum.
Lykilorð á íslensku: Saltfiskur, árstíðasveiðflur, fiskvinnsla, markaður © Copyright Matís ohf / Icelandic Food and Biotech R&D
PREFACE
This report is a deliverable in the project ”Standard for saltfisk” which was funded by NORA (Journal
nr. 510-036).
The aim of the project was to collect relevant data on saltfish production in the Nordic countries
Iceland, Faroe Islands and Norway in order to establish a Nordic standard for salted fish production.
The collected information involved different parties from catch to consumer, e.g. fishermen, producers
and sellers. In this report, the current variation in catching methods, in salting procedures, in the
characteristics and market segmentation of salted products between the Nordic countries, is described.
It serves as a basis for forthcoming projects on the salting and curing of cod, where guidelines for
evaluation of a raw material, salting procedures and storage conditions will be set.
TABLE OF CONTENTS
1 THE PRODUCTION OF SALTED COD ....................................................................................................... 1
1.1 GLOBAL PRODUCTION ..................................................................................................................................... 1
1.2 SUPPLIERS AND CONSUMERS ............................................................................................................................ 3
1.3 WHY DO CONSUMER LIKE SALTED COD? ............................................................................................................. 5
2 CLASSIFICATION OF SALTED COD .......................................................................................................... 8
3 CHEMICAL COMPOSITION OF SALT USED IN THE PRODUCTION ............................................................. 9
4 BIOLOGICAL VARIATION IN THE RAW MATERIAL ................................................................................. 11
5 PROCEDURES IN DIFFERENT COUNTRIES ............................................................................................. 12
5.1 PRODUCTION OF SALTED FISH IN ICELAND ......................................................................................................... 12
5.1.1 Markets ......................................................................................................................................... 13
5.1.2 Species, catch volumes and condition of the raw material ........................................................... 15
5.1.3 Seasonal variation in the raw material ......................................................................................... 18
5.1.4 Salting procedures and curing conditions ..................................................................................... 20
5.1.5 Commercial quality rating in Iceland ............................................................................................. 22
5.2 PRODUCTION OF SALTED FISH IN NORWAY ........................................................................................................ 23
5.2.1 Markets ......................................................................................................................................... 24
5.2.2 Species, catch volumes and condition of the raw material ........................................................... 25
5.2.3 Salting procedures, curing conditions and storage ....................................................................... 31
5.2.4 Commercial quality rating in Norway............................................................................................ 32
5.3 PRODUCTION OF SALTED FISH IN FAROE ISLANDS ................................................................................................ 33
5.3.1 Catching methods and volumes .................................................................................................... 38
5.3.2 Salting procedures ......................................................................................................................... 40
5.3.3 Curing and storage conditions....................................................................................................... 40
5.3.4 Commercial quality rating in Faroe Islands ................................................................................... 40
5.4 PRODUCTION OF SALTED FISH IN GREENLAND .................................................................................................... 41
6 CONCLUDING REMARKS ..................................................................................................................... 42
7 REFERENCES ....................................................................................................................................... 43

1
1 THE PRODUCTION OF SALTED COD
1.1 Global production
Total global export of salted and dried cod products in 2005 was 330.000 tonnes (net weight) and
approximately $US 2 billion. Norway (100-120 thousand tonnes) and Iceland (~60 thousand tonnes)
are the biggest producers and exporters, whereas Portugal and Spain, followed by Brazil, are the
largest importers (MRA 2007; UN Comtrade 2010). The South Europe import of salted fish was on
average 160 thousand tonnes per annum in 1999 to 2008.
Approximately, 15-25% of the production in Norway is exported as wet salted products, whereas this
category accounts for ca. 40% of the production in Iceland and ca. 25% in Faroe Islands. In the last
years, the export volumes (tonnes) of wet salted cod products from Norway and Iceland have been
similar, in the range of 20 to 25 thousand tonnes but around 3-5 thousand tonnes from Faroe Islands
(Figure 1).
Figure 1. Export of wet salted cod products from Norway, Iceland and Faroe Islands. The data
represents data reported under HS030562: Cod salted or in brine not dried or smoked (Statistics Iceland
2010; UN ComTrade 2010).
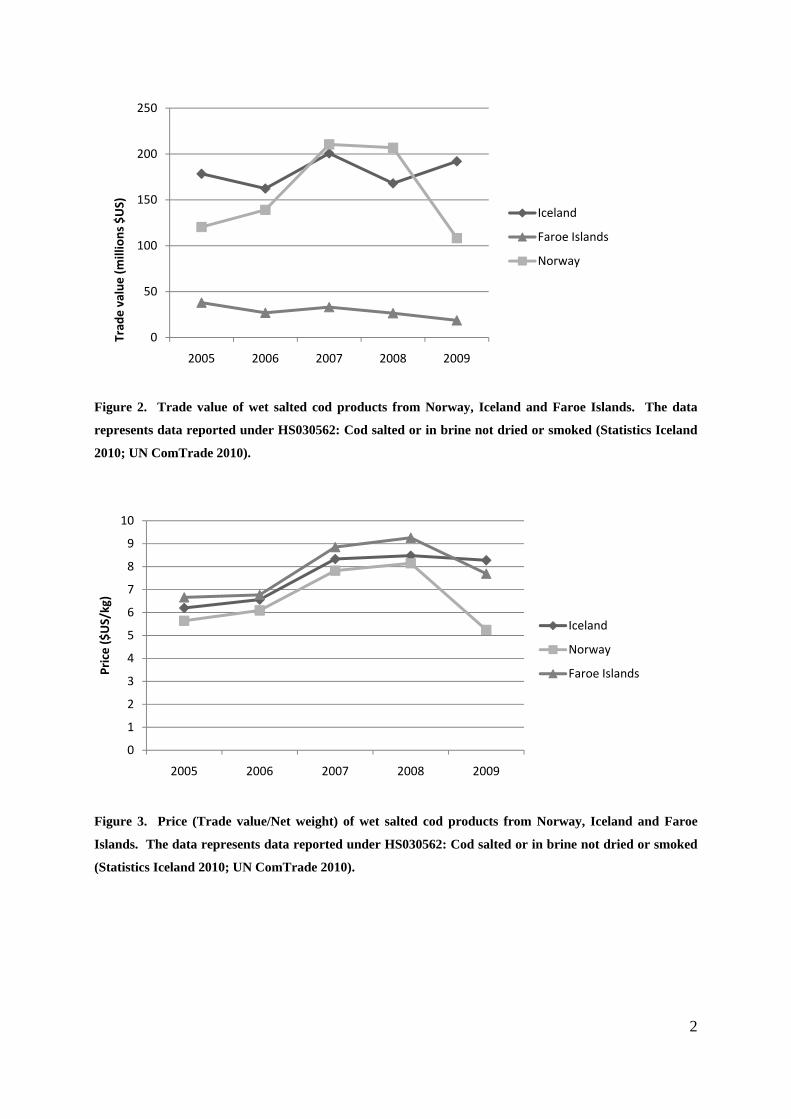
The trade value of wet salted cod products is presented in Figure 2. The price per kg increased in
following order, Norway < Iceland < Faroe Islands in the years 2005 to 2008. In 2009, the price of
Icelandic products was slightly higher than of products from Faroe Islands.
0
5
10
15
20
25
30
35
2005 2006 2007 2008 2009
Net weight (thou
sand
tonn
es)
Iceland
Faroe Islands
Norway
2
Figure 2. Trade value of wet salted cod products from Norway, Iceland and Faroe Islands. The data
represents data reported under HS030562: Cod salted or in brine not dried or smoked (Statistics Iceland
2010; UN ComTrade 2010).
Figure 3. Price (Trade value/Net weight) of wet salted cod products from Norway, Iceland and Faroe
Islands. The data represents data reported under HS030562: Cod salted or in brine not dried or smoked
(Statistics Iceland 2010; UN ComTrade 2010).
0
50
100
150
200
250
2005 2006 2007 2008 2009
Trad
e value (m
illions $US)
Iceland
Faroe Islands
Norway
0
1
2
3
4
5
6
7
8
9
10
2005 2006 2007 2008 2009
Price ($US/kg)
Iceland
Norway
Faroe Islands

3
1.2 Suppliers and consumers
Iceland (IS) and Faroe Islands (FI) have a strong market position on the Spanish market (Figure 4 and
Figure 5), where the highest price for salted cod products is paid. The reason for their strong position
on the market is that producers in IS and FI, have been more dynamic in processing development,
identifying opportunities for alterations and in a way also influenced changes in consumer preferences.
The products from Iceland and Faroe Islands are whiter, thicker and juicier than products from
Norway, attributes that are in high favour by Spanish consumers (Aftenposten, 2010).
In IS and FI, salting procedures have been changing rapidly in the last decade, wet salting, i.e. brining
and injection are increasingly used. These methods result in stronger water retention of the fish
muscle, due to different effects on proteins and microstructure of the muscle in comparison to the old
kench salting method (Thorarinsdottir, 2010). In addition, many producers in IS and FI, have been
adding phosphates to the brine at the beginning of the salting process. The purpose is to reduce the
risk of yellow discolouration of the salted products. Phosphates have chelating effects on metals that
may be present in the salt and thereby reduce oxidation of lipids, which is the reason for the
yellow/darker colour of products. However, the present status is that polyphosphates are not allowed
for use in salted fish production. Meanwhile the food legislation remains the same, producers will
have to find alternative antioxidants that are approved in salt fish or face the risk of producing darker
fish.
Figure 4. Main suppliers and consumers of salted cod products (Gallart-Jornet and Lindkvist, 2007)

4
Figure 5. Importation pattern for salted cod in 2007 (Gallart-Jornet and Lindkvist, 2007)
The recent changes in salting procedures and curing conditions have altered the characteristics of the
salted products on the market, increased weight yields and improved the commercial quality
(Lindkvist and others, 2008). The shorter curing time and lower temperature during curing and
storage conditions have resulted in milder curing flavours and a whiter appearance (Barat and others,
2003; Lindkvist and others, 2008). Another important factor is that the raw material is of better
quality than in the last century due to improved catching, handling and storage techniques.
According to Norwegian and Canadian studies, the success of Icelandic producers is related to
following factors:
• Management of fishing quotas – the biggest producers own their own quotas, which is an
important variable with regard to controlling the supply and quality of the catch over time.
• Improvement in catching methods and handling of the raw material from catch to processing.
• The use of harmonised standards in quality and size grading for the market, designed by the
original Union of Icelandic Salt Fish producers (SÍF). These standards are still in use,
although the main export is managed by each producer instead of a single union.
• Investment in processing systems to increase yield, throughput and quality and at the same
time, reduce the labour cost which is high in Iceland (Lindkvist, 2008; MRA, 2007).
Now, in 2010, the Norwegian export council in co-operation with scientists has launched an extensive
marketing campaign in Spain:
5
• “IN2Spain – Norsk Saltfisk til Spania”: In Madrid Innovation Norway (IN) and the Norwegian
Seafood Export council (NSEC) decided to join their forces to fight the negative trends that
we have seen during the last years in the export of Norwegian salted cod to Spain. Icelandic
producers have taken great market shares and the position as a high quality supplier. Their
product is whiter and thicker than the Norwegian product due to additives such as phosphate.
The Norwegian, natural cured salted cod is now totally dependent on the Portuguese market, a
situation we must change!” (Innovasjon Norge, 2010).
The budget used for this campaign is large, paid from both the industrial and governmental sources.
The campaign will strengthen the position of salted cod in the food market in general, which all
producers will gain from.
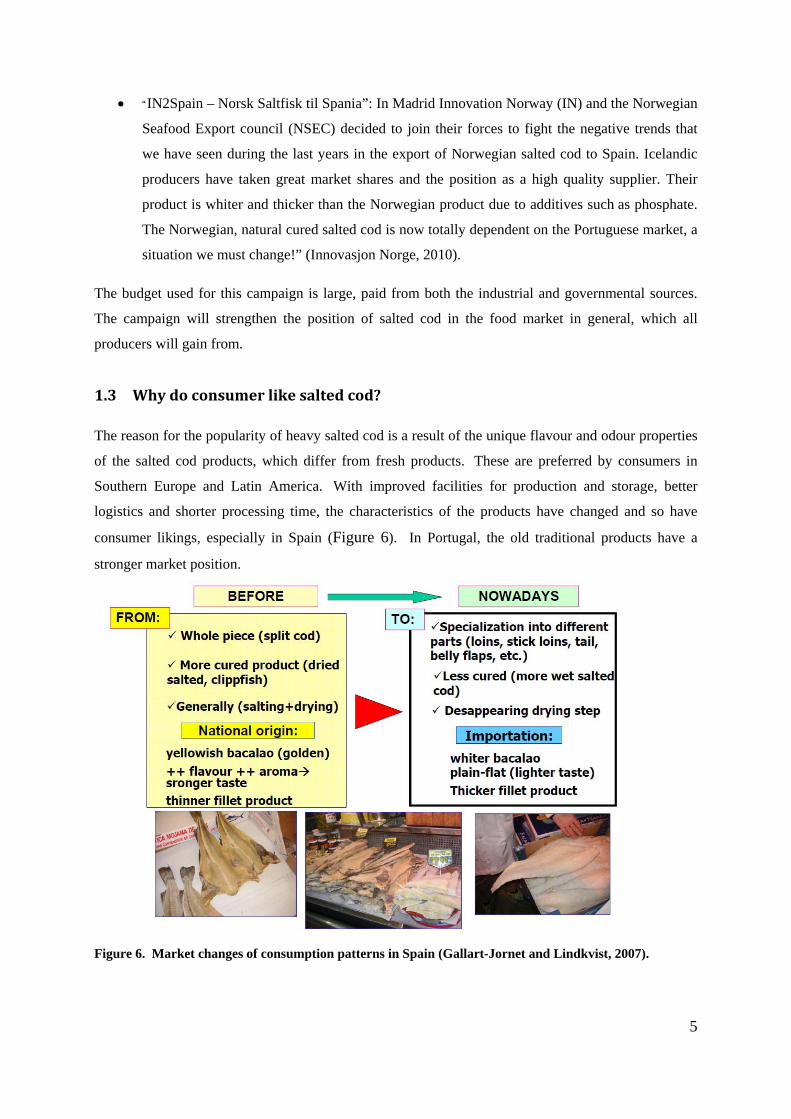
1.3 Why do consumer like salted cod?
The reason for the popularity of heavy salted cod is a result of the unique flavour and odour properties
of the salted cod products, which differ from fresh products. These are preferred by consumers in
Southern Europe and Latin America. With improved facilities for production and storage, better
logistics and shorter processing time, the characteristics of the products have changed and so have
consumer likings, especially in Spain (Figure 6). In Portugal, the old traditional products have a
stronger market position.
Figure 6. Market changes of consumption patterns in Spain (Gallart-Jornet and Lindkvist, 2007).

6
The rehydration of the heavy salted fish is time-consuming, and younger consumers aim for faster
food preparation and in some cases also simpler and cheaper food. A new product, light salted cod
fillets with only ~2% salt content, which was launched on the market 15-20 years ago, fitted well to
these preferences. The process and characteristics of the light salted products vary considerably from
the traditional bacalao (Figure 7). The light salted products are only injected and/or brined and then
stored as frozen. Therefore, the characteristic flavour and texture, which are formed as proteins and
fats are degraded during the traditional curing of heavy salted cod, are missing.
Figure 7. Market for cod products in Spain (Gallart-Jornet and Lindkvist, 2007).
The distribution and consumption of these products, have increased rapidly over the last decade. The light salted products are sold as bacalao in Spain but still the heavy salted cod products have
maintained their market share, according to interviews with Icelandic producers. Existing market
segmentation is based on differences in product characteristics and prices between the light salted and
heavily salted products.
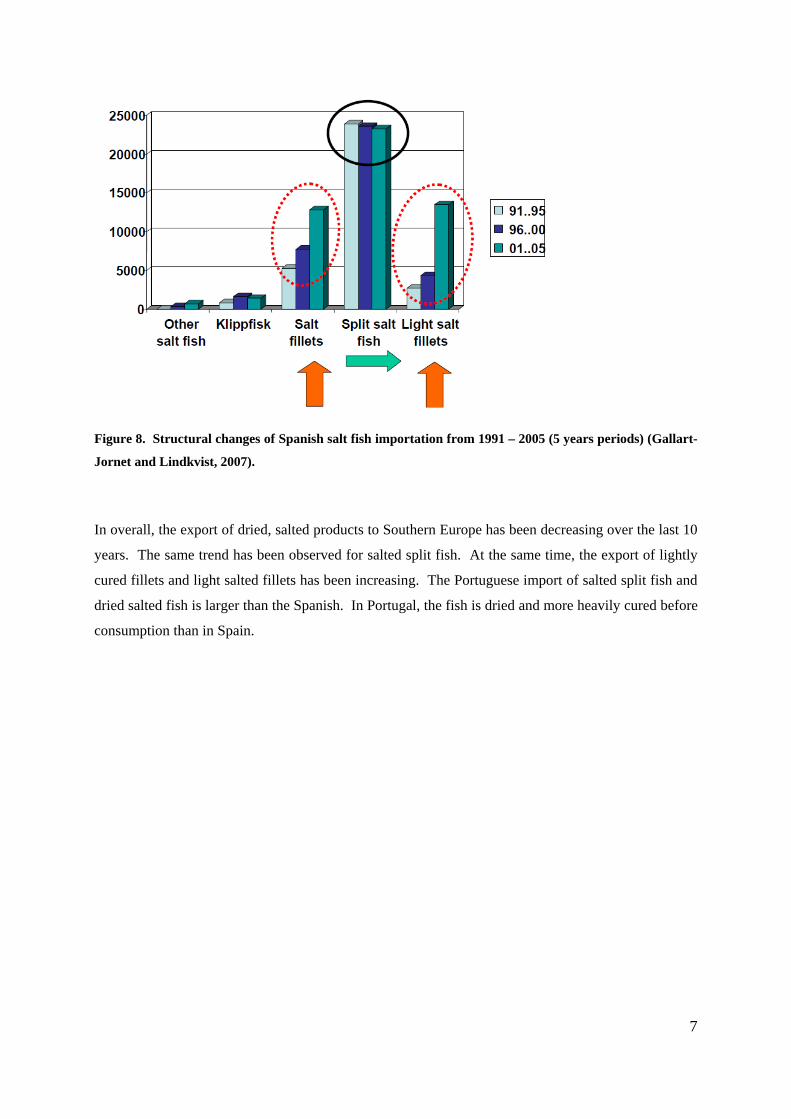
The demand for salted cod fillets has been increasing at the same time as the consumption of light
salted fish fillets, has increased (Figure 8). On the other hand, the import of split salt fish in Spain has
stagnated (Gallart-Jornet and Lindkvist, 2007; Lindkvist and others, 2008).
7
Figure 8. Structural changes of Spanish salt fish importation from 1991 – 2005 (5 years periods) (Gallart-
Jornet and Lindkvist, 2007).
In overall, the export of dried, salted products to Southern Europe has been decreasing over the last 10
years. The same trend has been observed for salted split fish. At the same time, the export of lightly
cured fillets and light salted fillets has been increasing. The Portuguese import of salted split fish and
dried salted fish is larger than the Spanish. In Portugal, the fish is dried and more heavily cured before
consumption than in Spain.

8
2 CLASSIFICATION OF SALTED COD
The main classification of cod is according to the size of the fish, processing method (split/fillets),
whether it is dried or not and quality of the products. The quality of the final product depends on many
factors, such as the condition of the raw material, processing method and equipment, and salting
technique used. The salting procedures vary with post-salting treatment. That is, whether the fish is
dried or not. Injection or addition of phosphates to products is not accepted by buyers who dry the
products, due to higher water content and therefore, longer drying time of the products.
The commercial quality rating takes place at packing or before export. Rating of the quality is carried
out by trained quality assessors, mainly by visual appearance of the product, like colour (whiteness,
yellowness), thickness and the presence of gaping/cracks, bruises and blood stains. The guidelines
used for quality grading vary with both export and import countries. For example, different standards
are used in Norway and Iceland. In Spain, consumer preferences are generally more related to
juiciness and whiteness of products than in Portugal. In addition, regional differences exist with each
country (Gallart-Jornet and Lindkvist, 2007; Lindkvist and others, 2008).
Variation in chemical content of salted products was different when the fish was only kench salted. It
was basically due to curing time, the frequency of restacking and drying procedures (Table 1).
Nowadays, it is affected by salting procedures and use of additives. Generally, the water and salt
content have increased by the addition of a pre-salting step (injection and/or brining) prior to dry
salting. In all cases, the water phase of the salted muscle is salt saturated. During the salting period,
the muscle loses water due to the strong protein aggregation as the salt content exceeds 8-12% (Duerr
and Dyer, 1952).
Table 1. Water and salt content of heavy salted cod products at different curing stages. Values for fresh,
light salted and rehydrated cod muscle are shown for comparison. These values are presented to give a
basic reference, although no official standards are available in Iceland.
Product Water (%) Salt (%) Fresh fish 80‐82 0.2‐0.3
Light salted cod (not cured) 82‐85% 2‐2.5%
Lightly cured/wet salted (Tandurfiskur) 55‐58 18‐21 Medium cured 53‐54 19‐21 Fully cured 50‐52 20‐22 Ordinary cured 44‐50 20‐23 Semi‐dried (Cura Corrente 7/8*) 40‐44 (42‐43) 22‐24 Dried 36‐40 22‐25 Extra dried* 30(‐35) 23‐25
Rehydrated 82‐84 0.9‐1.5 *(Eiríksson & Guðmundsson, 1982; Jónas Bjarnason, 1986)
9
3 CHEMICAL COMPOSITION OF SALT USED IN THE PRODUCTION
Salt fish producers in the Nordic countries are mainly using coarse sea salt imported from Southern
Europe (Spain) and Northern Africa (Tunis). Earth salt from Brasilia is also used to some extent.
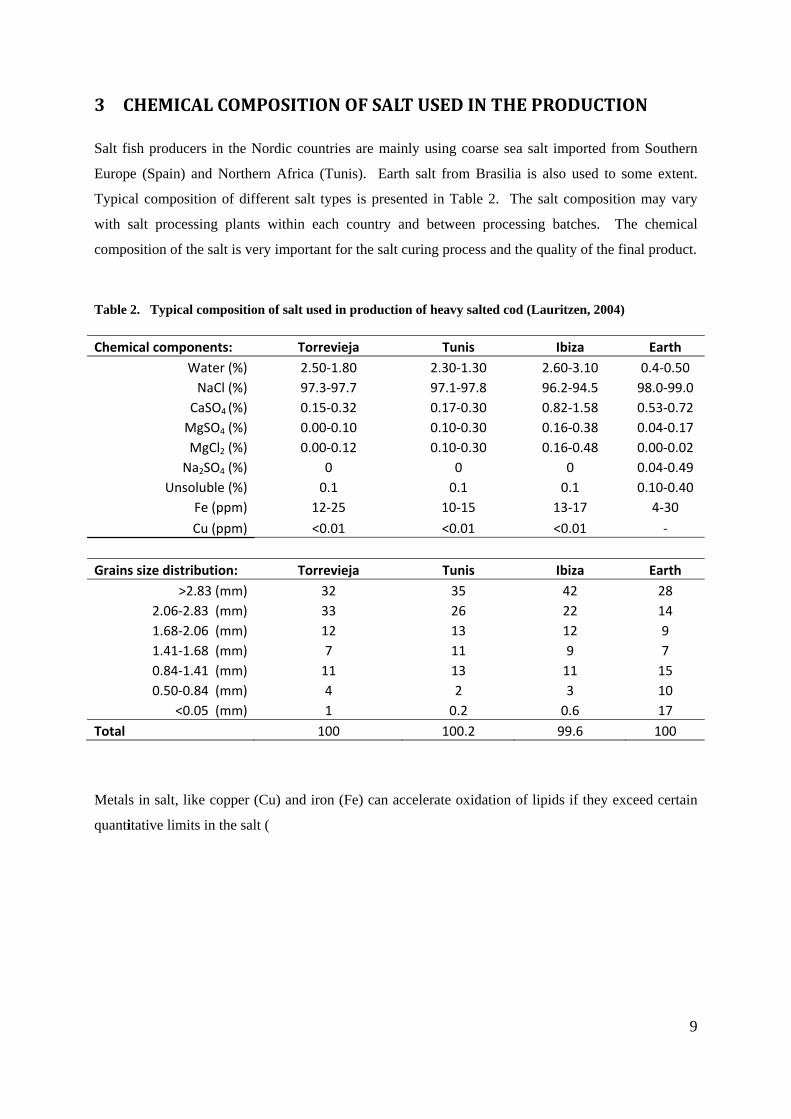
Typical composition of different salt types is presented in Table 2. The salt composition may vary
with salt processing plants within each country and between processing batches. The chemical
composition of the salt is very important for the salt curing process and the quality of the final product.
Table 2. Typical composition of salt used in production of heavy salted cod (Lauritzen, 2004)
Chemical components: Torrevieja Tunis Ibiza Earth Water (%) 2.50‐1.80 2.30‐1.30 2.60‐3.10 0.4‐0.50 NaCl (%) 97.3‐97.7 97.1‐97.8 96.2‐94.5 98.0‐99.0 CaSO4 (%) 0.15‐0.32 0.17‐0.30 0.82‐1.58 0.53‐0.72 MgSO4 (%) 0.00‐0.10 0.10‐0.30 0.16‐0.38 0.04‐0.17 MgCl2 (%) 0.00‐0.12 0.10‐0.30 0.16‐0.48 0.00‐0.02 Na2SO4 (%) 0 0 0 0.04‐0.49
Unsoluble (%) 0.1 0.1 0.1 0.10‐0.40 Fe (ppm) 12‐25 10‐15 13‐17 4‐30
Cu (ppm) <0.01 <0.01 <0.01 ‐
Grains size distribution: Torrevieja Tunis Ibiza Earth >2.83 (mm) 32 35 42 28
2.06‐2.83 (mm) 33 26 22 14 1.68‐2.06 (mm) 12 13 12 9 1.41‐1.68 (mm) 7 11 9 7 0.84‐1.41 (mm) 11 13 11 15 0.50‐0.84 (mm) 4 2 3 10
<0.05 (mm) 1 0.2 0.6 17 Total 100 100.2 99.6 100
Metals in salt, like copper (Cu) and iron (Fe) can accelerate oxidation of lipids if they exceed certain
quantitative limits in the salt (
10
Table 3). Other metals, like cobalt (Co), manganese (Mn) that are present in the salt, have also pro-
oxidant effects, but limits for these compounds in salt standards have not been set.
Metals catalyse the decomposition of lipid hydro-peroxides into free radicals, which initiate further
oxidation of unsaturated fatty acid derivatives. The oxidation results eventually in yellow
discolouration of the fish. Yellow discolouration leads to lower quality and value of the products.
11
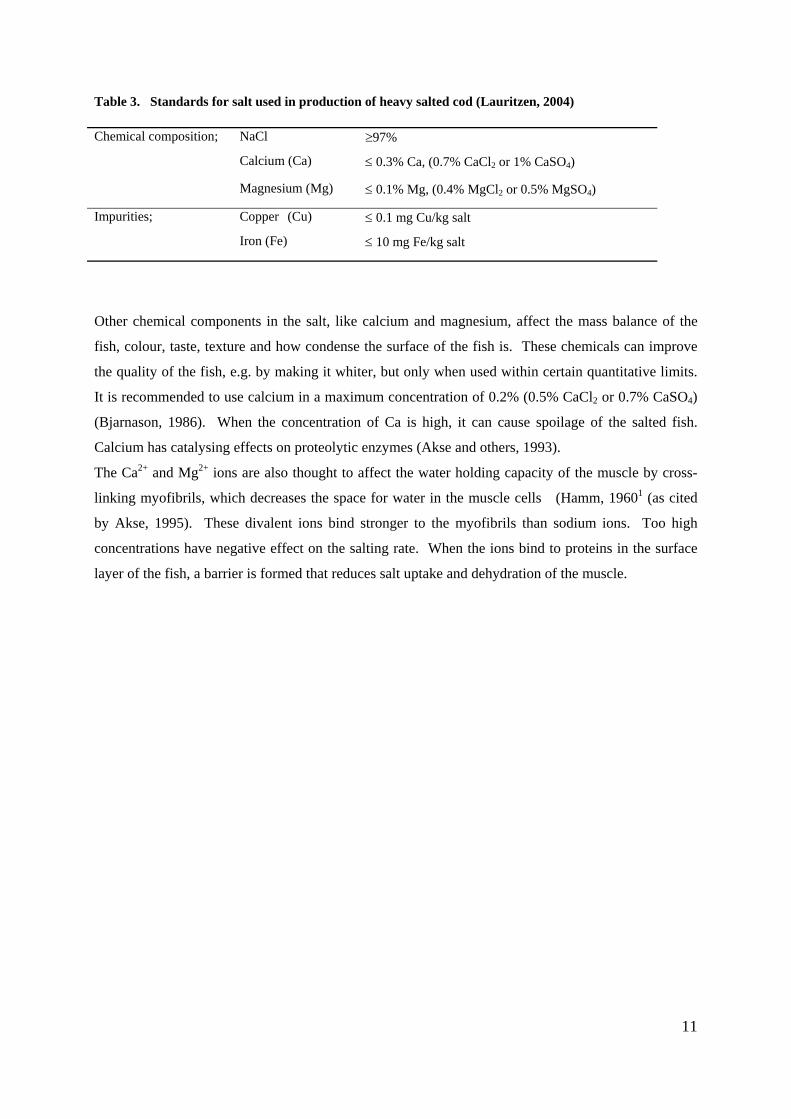
Table 3. Standards for salt used in production of heavy salted cod (Lauritzen, 2004)
Chemical composition; NaCl ≥97%
Calcium (Ca) ≤ 0.3% Ca, (0.7% CaCl2 or 1% CaSO4)
Magnesium (Mg) ≤ 0.1% Mg, (0.4% MgCl2 or 0.5% MgSO4)
Impurities; Copper (Cu) ≤ 0.1 mg Cu/kg salt
Iron (Fe) ≤ 10 mg Fe/kg salt
Other chemical components in the salt, like calcium and magnesium, affect the mass balance of the
fish, colour, taste, texture and how condense the surface of the fish is. These chemicals can improve
the quality of the fish, e.g. by making it whiter, but only when used within certain quantitative limits.
It is recommended to use calcium in a maximum concentration of 0.2% (0.5% CaCl2 or 0.7% CaSO4)
(Bjarnason, 1986). When the concentration of Ca is high, it can cause spoilage of the salted fish.
Calcium has catalysing effects on proteolytic enzymes (Akse and others, 1993).
The Ca2+ and Mg2+ ions are also thought to affect the water holding capacity of the muscle by cross-
linking myofibrils, which decreases the space for water in the muscle cells (Hamm, 19601 (as cited
by Akse, 1995). These divalent ions bind stronger to the myofibrils than sodium ions. Too high
concentrations have negative effect on the salting rate. When the ions bind to proteins in the surface
layer of the fish, a barrier is formed that reduces salt uptake and dehydration of the muscle.
12
4 BIOLOGICAL VARIATION IN THE RAW MATERIAL
The characteristics and condition of the raw material are important with regard to processing and
characteristics of the salted products, including yield and quality. These factors vary with fishing
grounds and fishing stocks. The attributes affected are, for example, chemical content, water holding
capacity, gaping and texture of the products. Comparison on the chemical composition of cod from
different fishing grounds (Faroe Bank and Aberdeen Bank) have shown that fish from the Faroe Bank
was fatter, mainly due to higher contents of phospholipids (Love, 1980). The formation of off-
flavours during storage at -30°C was strongest in fish from the Faroe Bank, in comparison to other
fishing grounds (Faroe Bank, Faroe Plateau, Aberdeen Bank, SE Iceland, NW Iceland). This was
explained by higher fat content and therefore, higher oxidation in the Faroe Bank fish (Love, 1975).
On the other hand, the content of heam pigments in the dark muscle in cod from the Faroe Bank is low
compared to Spitzbergen and Bear Island cod (Love and others, 1974).
In the 20th century, the Fisheries Research Board of Canada published several studies on biological
variation in cod lipids. It was found that the belly flap tissue in cod had higher fat content, than the
rest of the fillet. The tail section was 25% richer in lipid than the centre or head section. That was
explained by a higher proportion (8%) of dark muscle in the tail in comparison to other parts of the
fillet, like the middle section (1%) (Dambergs, 1963; Fraser and others, 1961). The content of
organically bound iron was higher in the dark muscle than the ordinary white muscle, predisposing the
dark muscle to more rapid development of rancidity. However, the white muscle in the tail section
was also more sensitive to copper-catalysed oxidation than in other parts of the fish. Therefore, the
function or composition of the lipids in the tail was assumed to be different from the rest of the fillet
(Castell and Maclean, 1963). On the other hand, the lipid content in the tail remained relatively
constant over the year, whereas seasonal variation was observed in the head and centre parts of the
fillets (Dambergs, 1964).
The development of rancidity due to copper addition showed seasonal variation. It developed faster in
winter caught fish in comparison to summer caught fish. Castell and Maclean (1963) found that the
seasonal differences were mainly connected to the induction period in the development of rancidity.
The degree of rancidity (TBA-values) in fish caught in April and June, became similar with storage
time (Castell and Maclean, 1963).
The stability of lipids is presumed to vary seasonally due to differences in lipid unsaturation and
content of natural antioxidants between seasons. The content of natural antioxidants in the muscle is
highest in the summer, whereas the degree of unsaturation is highest in the winter, before spawning
(Ackman, 1967; Bragadóttir, 2001; Castell and Maclean, 1963).
13
5 PROCEDURES IN DIFFERENT COUNTRIES
5.1 Production of salted fish in Iceland
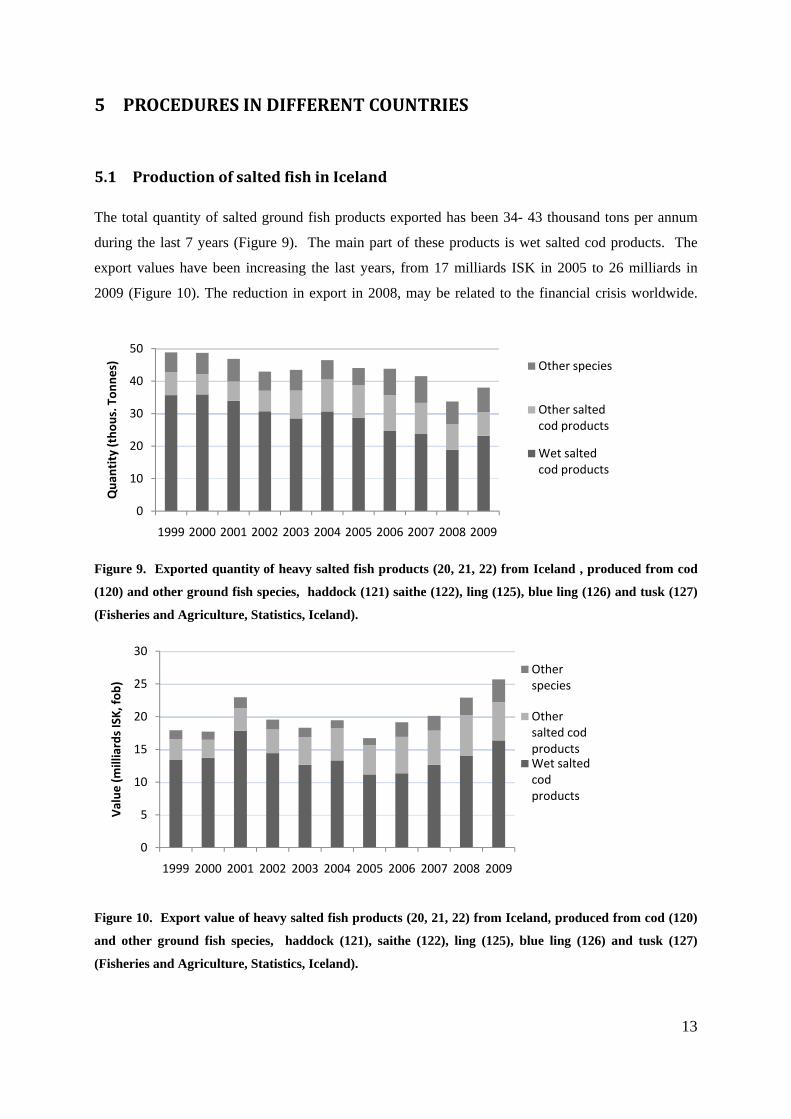
The total quantity of salted ground fish products exported has been 34- 43 thousand tons per annum
during the last 7 years (Figure 9). The main part of these products is wet salted cod products. The
export values have been increasing the last years, from 17 milliards ISK in 2005 to 26 milliards in
2009 (Figure 10). The reduction in export in 2008, may be related to the financial crisis worldwide.
Figure 9. Exported quantity of heavy salted fish products (20, 21, 22) from Iceland , produced from cod
(120) and other ground fish species, haddock (121) saithe (122), ling (125), blue ling (126) and tusk (127)
(Fisheries and Agriculture, Statistics, Iceland).
Figure 10. Export value of heavy salted fish products (20, 21, 22) from Iceland, produced from cod (120)
and other ground fish species, haddock (121), saithe (122), ling (125), blue ling (126) and tusk (127)
(Fisheries and Agriculture, Statistics, Iceland).
0
10
20
30
40
50
1999 2000 2001 2002 2003 2004 2005 2006 2007 2008 2009
Qua
ntity (tho
us. Ton
nes) Other species
Other salted cod products
Wet salted cod products
0
5
10
15
20
25
30
1999 2000 2001 2002 2003 2004 2005 2006 2007 2008 2009
Value
(milliards ISK, fo
b)
Other species
Other salted cod productsWet salted cod products
14
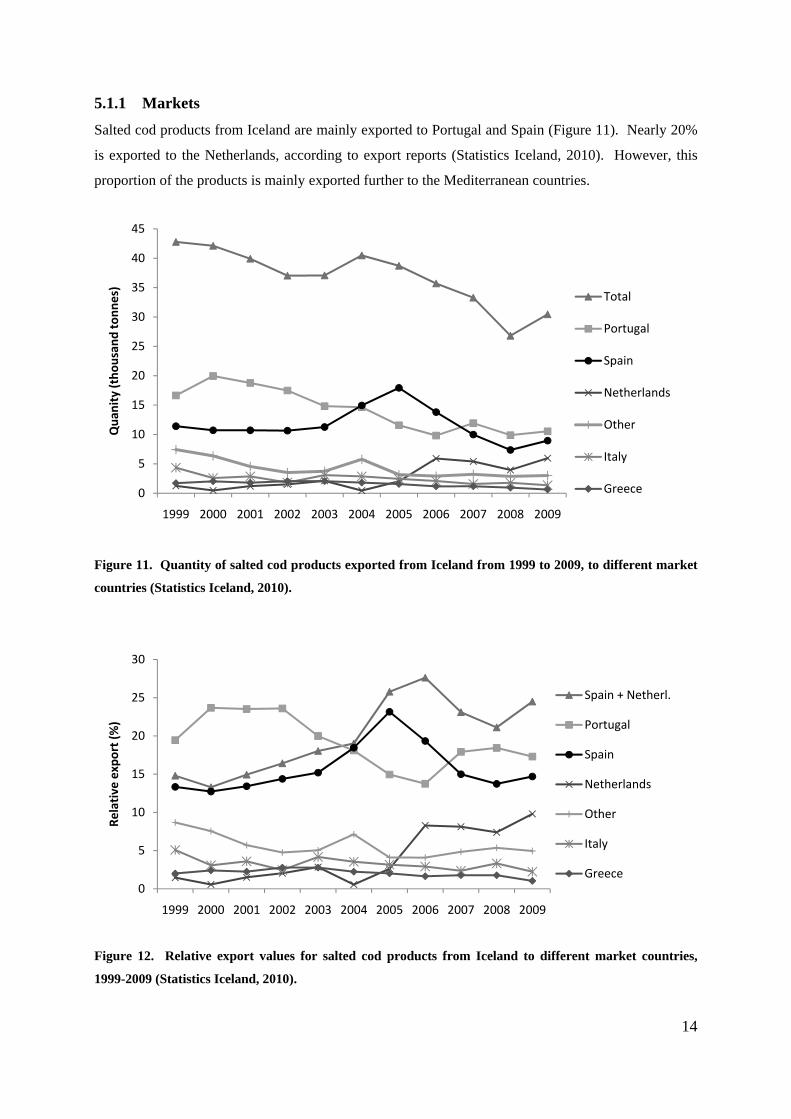
5.1.1 Markets
Salted cod products from Iceland are mainly exported to Portugal and Spain (Figure 11). Nearly 20%
is exported to the Netherlands, according to export reports (Statistics Iceland, 2010). However, this
proportion of the products is mainly exported further to the Mediterranean countries.
Figure 11. Quantity of salted cod products exported from Iceland from 1999 to 2009, to different market
countries (Statistics Iceland, 2010).
Figure 12. Relative export values for salted cod products from Iceland to different market countries,
1999-2009 (Statistics Iceland, 2010).
0
5
10
15
20
25
30
35
40
45
1999 2000 2001 2002 2003 2004 2005 2006 2007 2008 2009
Qua
nity (tho
usan
d tonn
es)
Total
Portugal
Spain
Netherlands
Other
Italy
Greece
0
5
10
15
20
25
30
1999 2000 2001 2002 2003 2004 2005 2006 2007 2008 2009
Relative export (%)
Spain + Netherl.
Portugal
Spain
Netherlands
Other
Italy
Greece
15
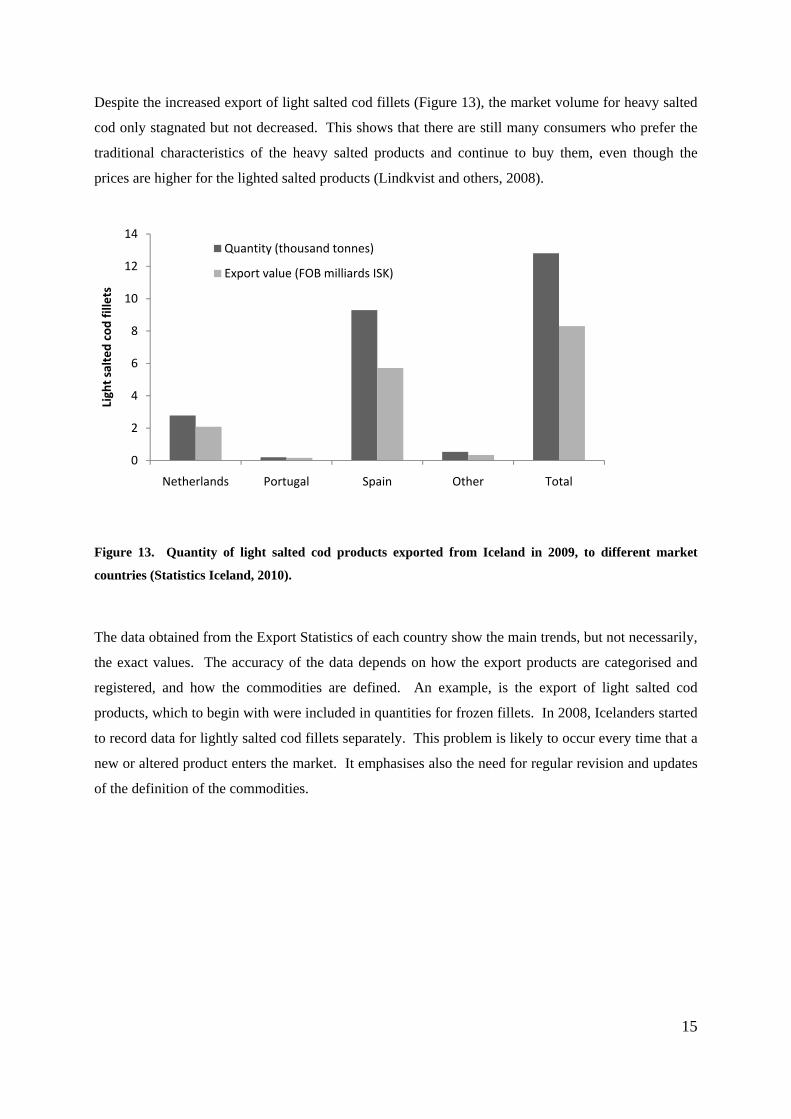
Despite the increased export of light salted cod fillets (Figure 13), the market volume for heavy salted
cod only stagnated but not decreased. This shows that there are still many consumers who prefer the
traditional characteristics of the heavy salted products and continue to buy them, even though the
prices are higher for the lighted salted products (Lindkvist and others, 2008).
Figure 13. Quantity of light salted cod products exported from Iceland in 2009, to different market
countries (Statistics Iceland, 2010).
The data obtained from the Export Statistics of each country show the main trends, but not necessarily,
the exact values. The accuracy of the data depends on how the export products are categorised and
registered, and how the commodities are defined. An example, is the export of light salted cod
products, which to begin with were included in quantities for frozen fillets. In 2008, Icelanders started
to record data for lightly salted cod fillets separately. This problem is likely to occur every time that a
new or altered product enters the market. It emphasises also the need for regular revision and updates
of the definition of the commodities.
0
2
4
6
8
10
12
14
Netherlands Portugal Spain Other Total
Light salted cod fillets
Quantity (thousand tonnes)
Export value (FOB milliards ISK)
16
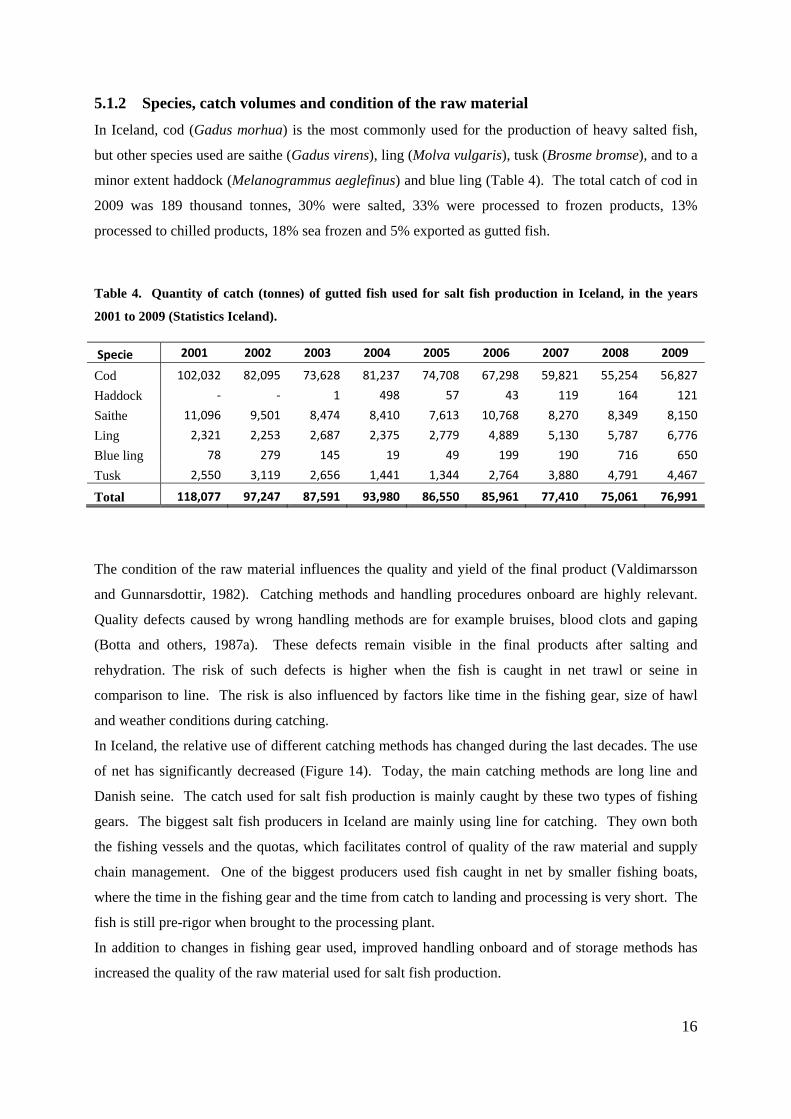
5.1.2 Species, catch volumes and condition of the raw material
In Iceland, cod (Gadus morhua) is the most commonly used for the production of heavy salted fish,
but other species used are saithe (Gadus virens), ling (Molva vulgaris), tusk (Brosme bromse), and to a
minor extent haddock (Melanogrammus aeglefinus) and blue ling (Table 4). The total catch of cod in
2009 was 189 thousand tonnes, 30% were salted, 33% were processed to frozen products, 13%
processed to chilled products, 18% sea frozen and 5% exported as gutted fish.
Table 4. Quantity of catch (tonnes) of gutted fish used for salt fish production in Iceland, in the years
2001 to 2009 (Statistics Iceland).
Specie 2001 2002 2003 2004 2005 2006 2007 2008 2009
Cod 102,032 82,095 73,628 81,237 74,708 67,298 59,821 55,254 56,827
Haddock ‐ ‐ 1 498 57 43 119 164 121
Saithe 11,096 9,501 8,474 8,410 7,613 10,768 8,270 8,349 8,150
Ling 2,321 2,253 2,687 2,375 2,779 4,889 5,130 5,787 6,776
Blue ling 78 279 145 19 49 199 190 716 650
Tusk 2,550 3,119 2,656 1,441 1,344 2,764 3,880 4,791 4,467
Total 118,077 97,247 87,591 93,980 86,550 85,961 77,410 75,061 76,991
The condition of the raw material influences the quality and yield of the final product (Valdimarsson
and Gunnarsdottir, 1982). Catching methods and handling procedures onboard are highly relevant.
Quality defects caused by wrong handling methods are for example bruises, blood clots and gaping
(Botta and others, 1987a). These defects remain visible in the final products after salting and
rehydration. The risk of such defects is higher when the fish is caught in net trawl or seine in
comparison to line. The risk is also influenced by factors like time in the fishing gear, size of hawl
and weather conditions during catching.
In Iceland, the relative use of different catching methods has changed during the last decades. The use
of net has significantly decreased (Figure 14). Today, the main catching methods are long line and
Danish seine. The catch used for salt fish production is mainly caught by these two types of fishing
gears. The biggest salt fish producers in Iceland are mainly using line for catching. They own both
the fishing vessels and the quotas, which facilitates control of quality of the raw material and supply
chain management. One of the biggest producers used fish caught in net by smaller fishing boats,
where the time in the fishing gear and the time from catch to landing and processing is very short. The
fish is still pre-rigor when brought to the processing plant.
In addition to changes in fishing gear used, improved handling onboard and of storage methods has
increased the quality of the raw material used for salt fish production.

17
Figure 14. Total catch of cod by fishing gear 1987-2009 (Statistics Iceland)
Figure 15. Relative catch of cod by fishing gear 1987-2009 (Statistics Iceland)
In Iceland, fresh fish is used for salt fish production, frozen fish rarely. Usually, the fish is processed
post-rigor after 2-5 days storage in ice (plate ice or drained liquid ice), from catch. Bleeding, gutting
and washing takes place onboard. Beheading and filleting are carried out before salting.
The cod is mainly caught early winter before spawning (Figure 16). After spawning (in April/May),
the fish is in bad condition, the risk of quality defects like gaping, is higher and the water holding
capacity of the muscle is lower than at other seasons, resulting in lower weight yields and reduced
quality.
0
20
40
60
80
100
120
140
1992
1993
1994
1995
1996
1997
1998
1999
2000
2001
2002
2003
2004
2005
2006
2007
2008
2009
Total catch of cod
(tho
usan
d tonn
es)
Line
Net
Handline
Bottom trawl
Danish seine
Other fishing gear
0
10
20
30
40
50
60
1992
1993
1994
1995
1996
1997
1998
1999
2000
2001
2002
2003
2004
2005
2006
2007
2008
2009
Relative cod
catch by fishing
gear (%
)
Line
Net
Handline
Bottom trawl
Danish seine
Other fishing gear
18
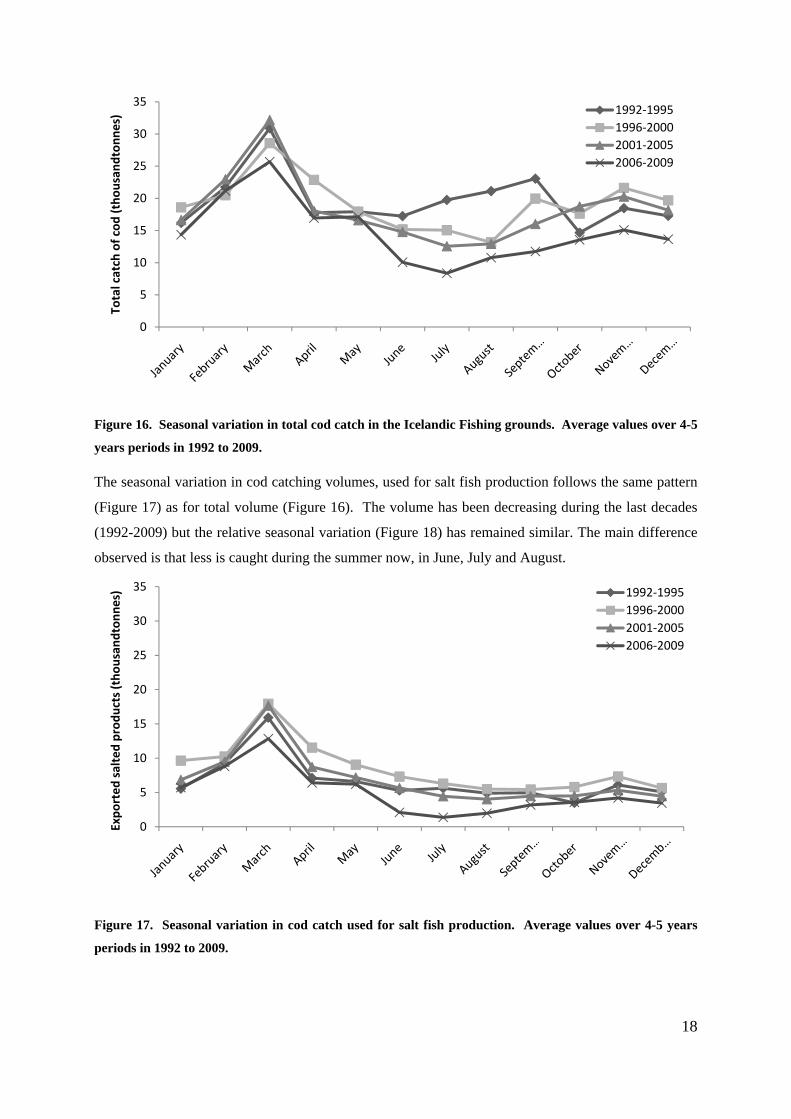
Figure 16. Seasonal variation in total cod catch in the Icelandic Fishing grounds. Average values over 4-5
years periods in 1992 to 2009.
The seasonal variation in cod catching volumes, used for salt fish production follows the same pattern
(Figure 17) as for total volume (Figure 16). The volume has been decreasing during the last decades
(1992-2009) but the relative seasonal variation (Figure 18) has remained similar. The main difference
observed is that less is caught during the summer now, in June, July and August.
Figure 17. Seasonal variation in cod catch used for salt fish production. Average values over 4-5 years
periods in 1992 to 2009.
0
5
10
15
20
25
30
35To
tal catch of cod
(tho
usan
dton
nes)
1992‐19951996‐20002001‐20052006‐2009
0
5
10
15
20
25
30
35
Expo
rted
salted prod
ucts (tho
usan
dton
nes) 1992‐1995
1996‐20002001‐20052006‐2009

19
Figure 18. Relative seasonal variation in cod catch (%) used for salt fish production, in 1992 to 2009.
5.1.3 Seasonal variation in the raw material
Cod is a lean (<1% lipids) fish specie, in which the depot fat is stored in the liver. Therefore, the
seasonal variation in fat content is not as high as in fatty species, like herring (Ackman, 1967). In a
study carried out by Ingolfsdottir and others (1998), on seasonal variation in cod muscle
characteristics, the fat content (diethyl ether extraction-Soxhlet) varied from less than 0.15% in
autumn to higher than 0.35% in late spring. The results were in harmony with older studies (Botta and
others, 1987b; Castell and Bishop, 1973; Dambergs 1964). The extraction procedure used influences
the quantity of fat extracted and measured. Higher values are obtained by Bligh and Dyer than by the
Soxhlet method (Bligh and Dyer, 1959). Analysis of lipid extracts with Bligh and Dyer have shown a
lipid content of 0.60-0.75% in the white muscle and 1.8-2.2% in the dark muscle (Bligh and Scott,
1966). The fat content and how it varies with season is also influenced by the size/age of the fish
(Figure 19). In a study carried out at Matis ohf, it was observed that the fat content in 50-60 cm fish
(1-1.5 kg) caught in April was lower than in June and November, whereas in 60-70 cm fish (2-2.5 kg
and 70-80 cm fish (3-4 kg) the lowest values were obtained in November (Kristín Anna Þórarinsdóttir
and others, 2005).
0
5
10
15
20
25Re
lativey mon
tly cath fo
r salt fish prod.
(%)
1992‐1995
1996‐2000
2001‐2005
2006‐2009

20
Figure 19. Seasonal variation (April, June, November) in the fat content (Soxhlet) of cod fillet processed
from cod of different lengths (50-60, 60-70 and70-80 cm) and other gadiod species. Pooled samples were
analysed: cod, saith and ling (n=14-16); tusk and haddock (n=20-21) (Kristín Anna Þórarinsdóttir and
others, 2005).
The seasonal variation in water content tended to be highest in the smallest fish but in general it was in
the range of 81-81% (Figure 20).
Figure 20. Seasonal variation (April, June, November) in the water content of cod fillet processed from
cod of different lengths (50-60, 60-70 and70-80 cm) and other gadiod species. Pooled samples were
analysed: cod, saith and ling (n=14-16); tusk and haddock (n=20-21) (Kristín Anna Þórarinsdóttir and
others, 2005).

21
The pH in the fish muscle varies with the season of year and size of the fish. The pH drops during a
short period in spring or early summer due to heavy feeding of the fish after spawning. Generally, the
pH decreases with size of the fish (Ingolfsdottir and others, 1998; Love, 1979) as was confirmed in
later studies on cod from the Icelandic fishing grounds (Kristín Anna Þórarinsdóttir and others, 2005).
Figure 21. Seasonal variation (April, June, November) in pH of cod fillet processed from cod of different
lengths (50-60, 60-70 and70-80 cm) and other gadiod species. Pooled samples were analysed: cod, saith
and ling (n=14-16); tusk and haddock (n=20-21) (Kristín Anna Þórarinsdóttir and others, 2005).
After spawning (in April/May), the texture of the muscle is worse and water holding capacity is lower
than at other seasons. Values for hardness and cohesiveness, fall in March to May, compared to the
winter and summer values. Another drop for cohesiveness has been observed in the autumn. The
concentration of protein content reaches its minimum shortly after the spawning period (Ingolfsdottir
and others, 1998).
5.1.4 Salting procedures and curing conditions
The processes used for salting have been changing rapidly over the past decades. Originally, the fish
was only pile salted, i.e. the split fish was stacked with alternating layers of coarse salt. This procedure
is also termed kench or dry salting. It was restacked several times to obtain an even pressure and
curing of the fish. Today, the process can be divided into several steps, pre-salting, dry salting and
finally curing during storage of the heavy salted products. Salting of the fish starts after filleting or
splitting (butterfly filleting) when salt and possibly other ingredients are added to the products.
22
In the late 20th century, Icelandic producers started to pre-salt fish before the pile salting step, using
pickling (from ~1980) and brining (from ~1990). The main difference between pickling and pile
salting is that pickling is carried out in closed tubs, in some cases with an addition of water/brine. On
the other hand, the brine formed during pile salting is allowed to drain away. Exporters started to
control the ambient temperature in storage, which made it possible to shorten the salting process and
produce lightly cured products. The fish was only pile salted for 10 to 12 days after pre-salting and
packed as lightly/wet cured. This curing stage of the products is known in Iceland as “tandurfiskur”.
Today, different combinations of injection, brining, pickling and dry salting/pile salting/stacking are
used, varying with producers and production countries. The composition of the brine also varies with
producers. The salt concentration (NaCl) used can be in the range of 12 to 24%. Polyphosphates have
been used in salt fish products, to some extent, due to retarding effects on oxidation. Therefore, the
product remains whiter and the risk of yellow discoloration is lower. However, the use of phosphates
as additives in salted cod products is not accepted, according to the European food legislation.
After dry salting, the products are graded according to size and visual appearance (commercial
quality), packed into waxed cardboard boxes and stored. Curing of the fish continues after packing,
during storage and transport of products. Further processing and curing time depend on the markets.
For some segments of the market, the fish is dried and cured, especially for the Portuguese consumers.
Changes in salting procedures and shortening of the curing time have resulted in higher water content
and increased weight yields of the salted products. These changes are accompanied by a higher uptake
of salt, which is the prerequisite for salt saturation of the liquid phase in the muscle and the long shelf
life of the salted products. The temperature and humidity during storage have to be controlled
carefully to retard to the growth of halophilic bacteria and remain weight yields. It must be kept in
mind that some microorganisms and enzymes are still active despite the high salt content and chilled
storage conditions (Pedro and others, 2004; Rodrigues and others, 2003). The temperature has to be
kept below 8°C through processing and curing to minimize the risk of the growth of halophilic
bacteria and oxidation. The growth of halophilic bacteria results in pink discolouration of the surface
of the fillets, whereas oxidation can result in yellow/brownish discolouration.
To minimize weight changes during storage, it is also important to maintain equilibrium between the
water activity (aw) in the salted fish and the relative humidity (RH) in the air where the fish is stored.
When the RH is higher than aw (0.75) in fully salted muscle, the salted fillets absorb water and gain
weight, whereas the opposite is observed when RH < aw (Doe and others, 1982).
Before consumption the products are rehydrated, that is soaked in water, which results in water uptake
and desalting of the muscle. The shelf life of rehydrated products is short at refrigerated conditions
but can be stored for several weeks when frozen after rehydration.

23
5.1.5 Commercial quality rating in Iceland
At packing, the salted products are graded according to size and commercial quality (PORT/SPIG).
PORT refers to export of the products to Portugal and SPIG to Spain, Italy and Greece. Some basic
rules for quality rating are described below, but the experience and training of the grader are essential
factors for harmonised performance with time and between producers. The appearance or colour of
the fish is the most important variable. Higher standards are used for SPIG fish; it is supposed to be
whiter and thicker than the PORT fish.
Within the SPIG category are three quality grades, I, II and III:
• SPIG I: Fillets should be thick with light appearance but no defects (PORT AB may have
small defects and a slightly darker colour).
• SPIG II: Fillets are similar to SPIG I, except that minor defects are allowed.
• SPIG III: Fillets are allowed to have more gaping than fish in SPIG II and minor defects due
to heading and filleting machines.
Three quality grades are usually used for assessing the PORT fish, A, B and C:
• PORT A: Fillets that are light in colour, thick, without blood stains; only minor gaping is
allowed (gaping may appear as openings or ruptures between the myotomes because of the
weakening of the connective tissue).
• PORT B: Fillets that are not of grade A quality because of small defects. The colour is darker
and the fillets are thinner or with long gaps along the fillets.
• PORT C: Fillets that have quality defects, like gaping or other apparent mechanical defects in
the fish flesh. The colour of the fillets is too dark to be graded as B quality. Fillets that have
been washed due to slight red discolouration of the fillets (caused by the growth of halophilic
bacteria).
• PORT AB: Fillets of A and B grade can be packaged together. The maximum ratio of B fillets
is 50% in each unit.
• PORT CD and E: Grades D and E are sometimes also used. Then C and D fillets are
packaged together. Fillets of grade D are of lower quality than C due to stronger gaping,
discolouration or other visible defects. Fillets of grade E have great defects but are yet
suitable for human consumption. The parts of the fillets with visible defects can be cut away.
Fillets having yellow discolouration, caused by metal-catalysed oxidation of fat, must be sorted from
fillets of other quality grades. The metals, such as copper and iron, are present as impurities in the salt
used or come in contact with raw materials, for examples as parts of processing equipment.
Pink/reddish pink discolouration of the products, results from growth of halophilic bacteria that are
present in the salt. The risk is minimised if the salted products are kept at a temperature below 8°C.
At the initial stages, the growth influences mainly the appearance but with time it leads to degradation
of the muscle and spoilage of the products.
24
5.2 Production of salted fish in Norway
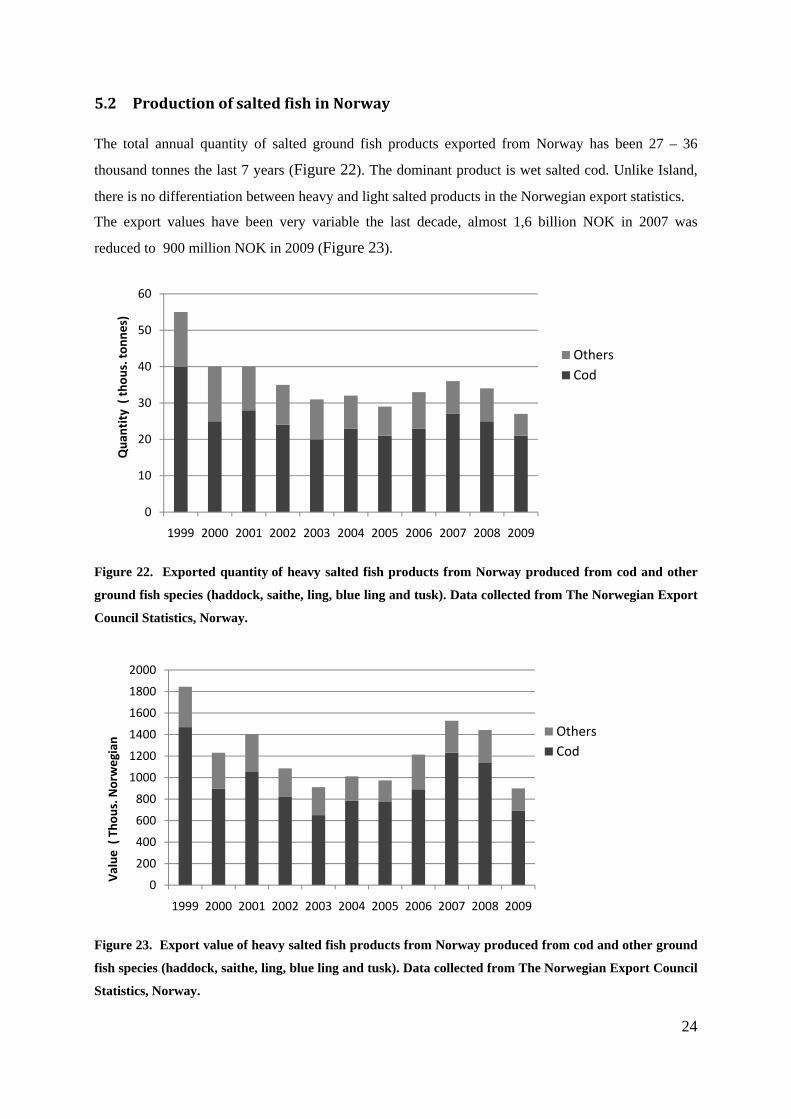
The total annual quantity of salted ground fish products exported from Norway has been 27 – 36
thousand tonnes the last 7 years (Figure 22). The dominant product is wet salted cod. Unlike Island,
there is no differentiation between heavy and light salted products in the Norwegian export statistics.
The export values have been very variable the last decade, almost 1,6 billion NOK in 2007 was
reduced to 900 million NOK in 2009 (Figure 23).
Figure 22. Exported quantity of heavy salted fish products from Norway produced from cod and other
ground fish species (haddock, saithe, ling, blue ling and tusk). Data collected from The Norwegian Export
Council Statistics, Norway.
Figure 23. Export value of heavy salted fish products from Norway produced from cod and other ground
fish species (haddock, saithe, ling, blue ling and tusk). Data collected from The Norwegian Export Council
Statistics, Norway.
0
10
20
30
40
50
60
1999 2000 2001 2002 2003 2004 2005 2006 2007 2008 2009
OthersCod
Qua
ntity ( thou
s. to
nnes)
0
200
400
600
800
1000
1200
1400
1600
1800
2000
1999 2000 2001 2002 2003 2004 2005 2006 2007 2008 2009
OthersCod
Value
( Tho
us.N
orwegian

25
5.2.1 Markets
Almost half of the Norwegian salted fish production is exported to Portugal (Figure 24). Nearly 20%
is exported to Spain, according to Norwegian export reports (The Norwegian Export Council). Italy
and Greece both imports about 10% of the annual Norwegian salt fish production while the rest of the
volume (15%) is exported to 33 different nations.
Figure 24. Quantity of salted products exported from Norway from 1999 to 2009, to different market
countries. Data collected from The Norwegian Export Council Statistics, Norway.
During the last decade the total export quantity of salted products have been reduced to the half.
Mainly, the decline in the export volume is explained by the Portuguese market. The Spanish market
has been stable around 5000 to 7000 tonnes per year in this period. The export of salted cod (Figure
25) has a similar course as the total export of heavy salted products. Since year 2000 the cod export
volumes have been relatively stable in total and for Portugal (20-25 thous. tonnes), Spain (4-6 thous.
tonnes) and Italy (1-2 thous. tonnes), while the Greece market has experienced a 50% decline from 3.6
to 1.7 thousand tonnes.
0
5
10
15
20
25
30
35
40
45
50
55
60
1999 2000 2001 2002 2003 2004 2005 2006 2007 2008 2009
Total
Portugal
Spain
Italy
Greece
Canada
France
Other
Qua
ntity (tho
usan
dtonn
es)
26
Figure 25. Quantity of salted cod products exported from Norway from 1999 to 2009, to different market
countries. Data collected from The Norwegian Export Council Statistics, Norway.
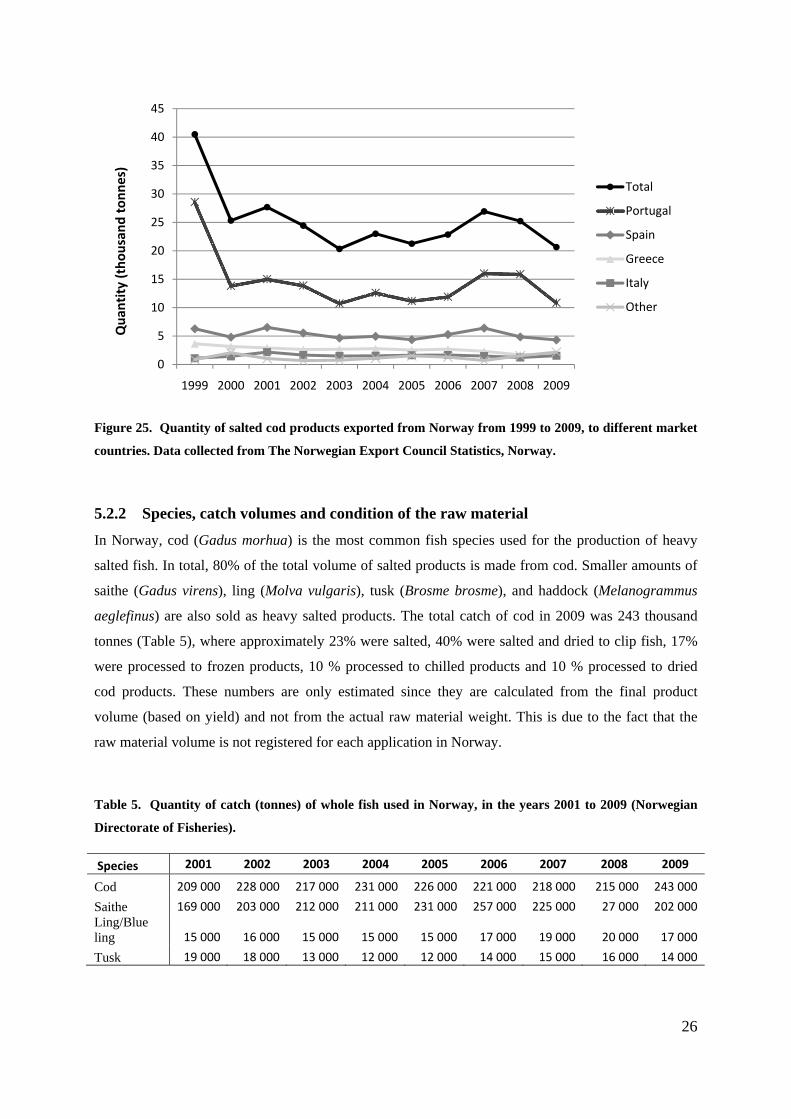
5.2.2 Species, catch volumes and condition of the raw material
In Norway, cod (Gadus morhua) is the most common fish species used for the production of heavy
salted fish. In total, 80% of the total volume of salted products is made from cod. Smaller amounts of
saithe (Gadus virens), ling (Molva vulgaris), tusk (Brosme brosme), and haddock (Melanogrammus
aeglefinus) are also sold as heavy salted products. The total catch of cod in 2009 was 243 thousand
tonnes (Table 5), where approximately 23% were salted, 40% were salted and dried to clip fish, 17%
were processed to frozen products, 10 % processed to chilled products and 10 % processed to dried
cod products. These numbers are only estimated since they are calculated from the final product
volume (based on yield) and not from the actual raw material weight. This is due to the fact that the
raw material volume is not registered for each application in Norway.
Table 5. Quantity of catch (tonnes) of whole fish used in Norway, in the years 2001 to 2009 (Norwegian
Directorate of Fisheries).
Species 2001 2002 2003 2004 2005 2006 2007 2008 2009
Cod 209 000 228 000 217 000 231 000 226 000 221 000 218 000 215 000 243 000
Saithe 169 000 203 000 212 000 211 000 231 000 257 000 225 000 27 000 202 000 Ling/Blue ling 15 000 16 000 15 000 15 000 15 000 17 000 19 000 20 000 17 000
Tusk 19 000 18 000 13 000 12 000 12 000 14 000 15 000 16 000 14 000
0
5
10
15
20
25
30
35
40
45
1999 2000 2001 2002 2003 2004 2005 2006 2007 2008 2009
Total
Portugal
Spain
Greece
Italy
Other
Qua
ntity (tho
usan
dtonn
es)
27
In Norway, there are two main types of raw material for the production of salted cod products.
Generally, the salt fish production in Northern Norway is based on fresh raw material while the
production in the Western part of Norway is from frozen and thawed cod. The raw material in
Northern Norway is caught with net, line and hand line, mainly by small coastal fishing boats. In
Western Norway the raw material is caught with trawl and line, and on board frozen on factory fishing
vessels.
Typical quality defects for cod caught by bottom trawl and Danish seine are flesh blood stains caused
by pressure and strokes, as well as elements of red/pink flesh discolouration due to insufficient
bleeding prior to slaughtering. For net caught fish, the most common quality error is flesh blood stains
and stripes from the fishing gear. Cod caught with line and hand line have been seen as the most
optimal raw materials with minor quality errors (Akse, Joensen and Tobiassen, 2004). However, new
findings show that a relatively high proportion of line caught cod from some vessels have blood
quality errors as red/pink flesh colour (Bjørkevoll, 2010). These findings seem similar to tests done on
direct slaughtering of line caught cod where red/pink bellies were registered (Bjørkevoll, Rindahl and
Hellevik, 2009). From the industry there have also been complaints concerning increased blood
quality errors on line caught cod.
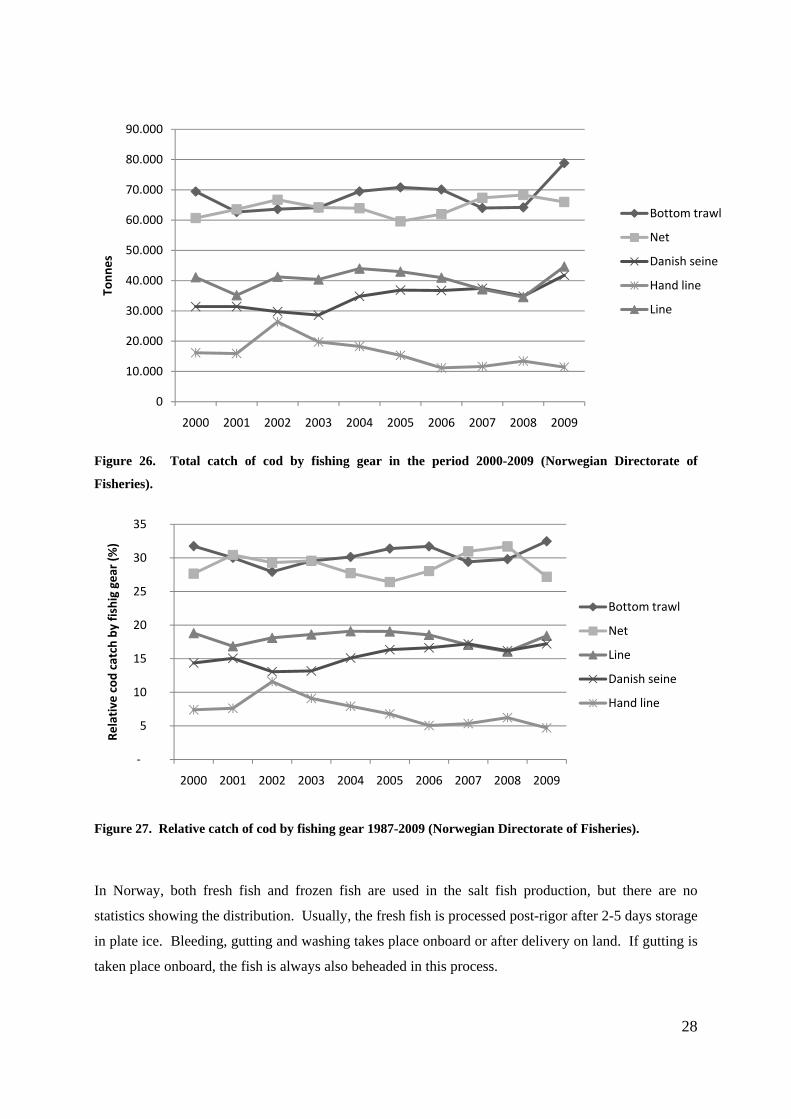
In contrast to Iceland, where catching methods have changed during the last decades, the use of net
and bottom trawl has been relatively stable (Figure 26 and Figure 27) in Norway. The catching gear
most common for cod used for heavy salted products are bottom trawl, net and line. In Norway, very
few producers of salted cod own fishing vessels where they can provide their own raw material as they
can in Iceland. This lack of vertical integration is an important factor that could explain the difference
between the raw material quality desired by the industry and the raw material provided by the fishing
fleet.
28
Figure 26. Total catch of cod by fishing gear in the period 2000-2009 (Norwegian Directorate of
Fisheries).
Figure 27. Relative catch of cod by fishing gear 1987-2009 (Norwegian Directorate of Fisheries).
In Norway, both fresh fish and frozen fish are used in the salt fish production, but there are no
statistics showing the distribution. Usually, the fresh fish is processed post-rigor after 2-5 days storage
in plate ice. Bleeding, gutting and washing takes place onboard or after delivery on land. If gutting is
taken place onboard, the fish is always also beheaded in this process.
0
10.000
20.000
30.000
40.000
50.000
60.000
70.000
80.000
90.000
2000 2001 2002 2003 2004 2005 2006 2007 2008 2009
Bottom trawl
Net
Danish seine
Hand line
Line
Tonn
es
‐
5
10
15
20
25
30
35
2000 2001 2002 2003 2004 2005 2006 2007 2008 2009
Relative cod
catch by fishig gear (%
)
Bottom trawl
Net
Line
Danish seine
Hand line
29
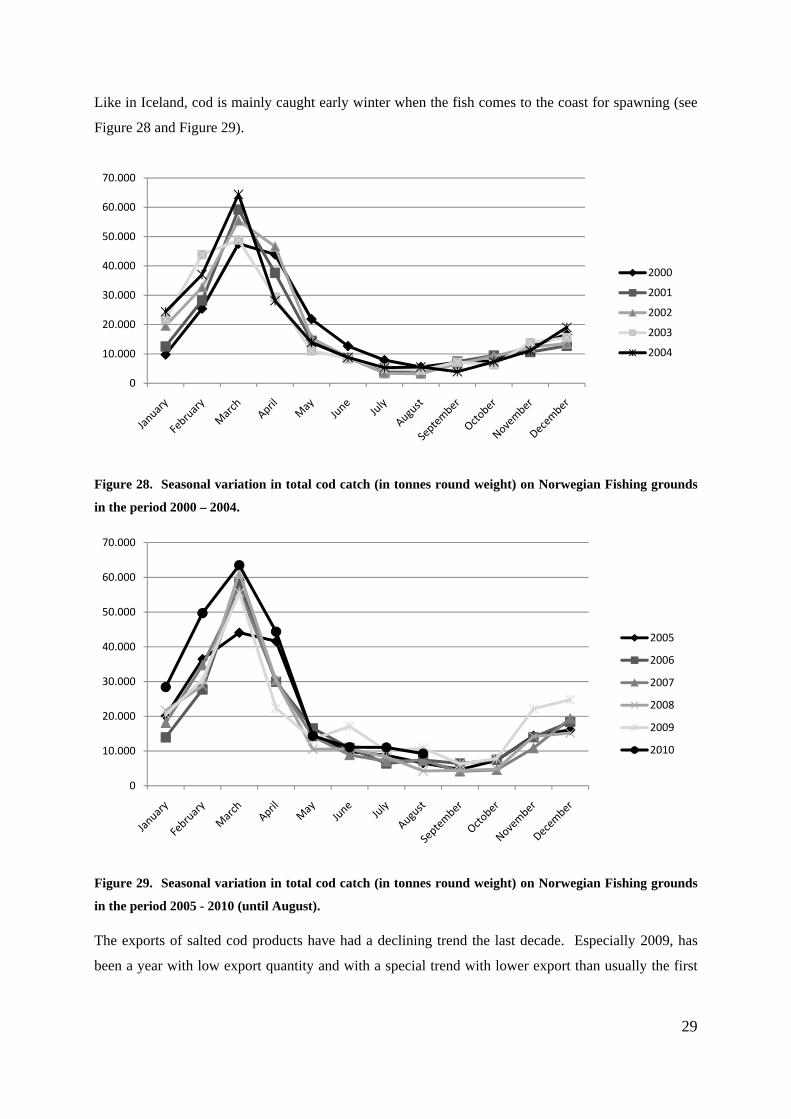
Like in Iceland, cod is mainly caught early winter when the fish comes to the coast for spawning (see
Figure 28 and Figure 29).
Figure 28. Seasonal variation in total cod catch (in tonnes round weight) on Norwegian Fishing grounds
in the period 2000 – 2004.
Figure 29. Seasonal variation in total cod catch (in tonnes round weight) on Norwegian Fishing grounds
in the period 2005 - 2010 (until August).
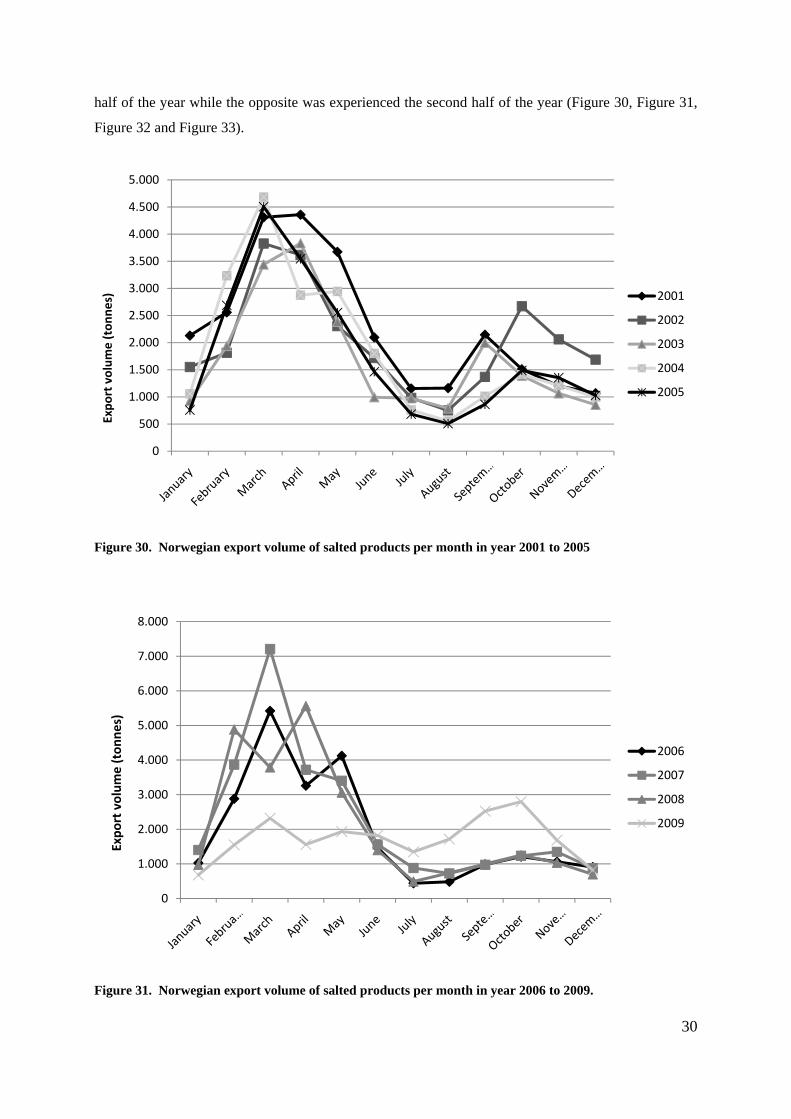
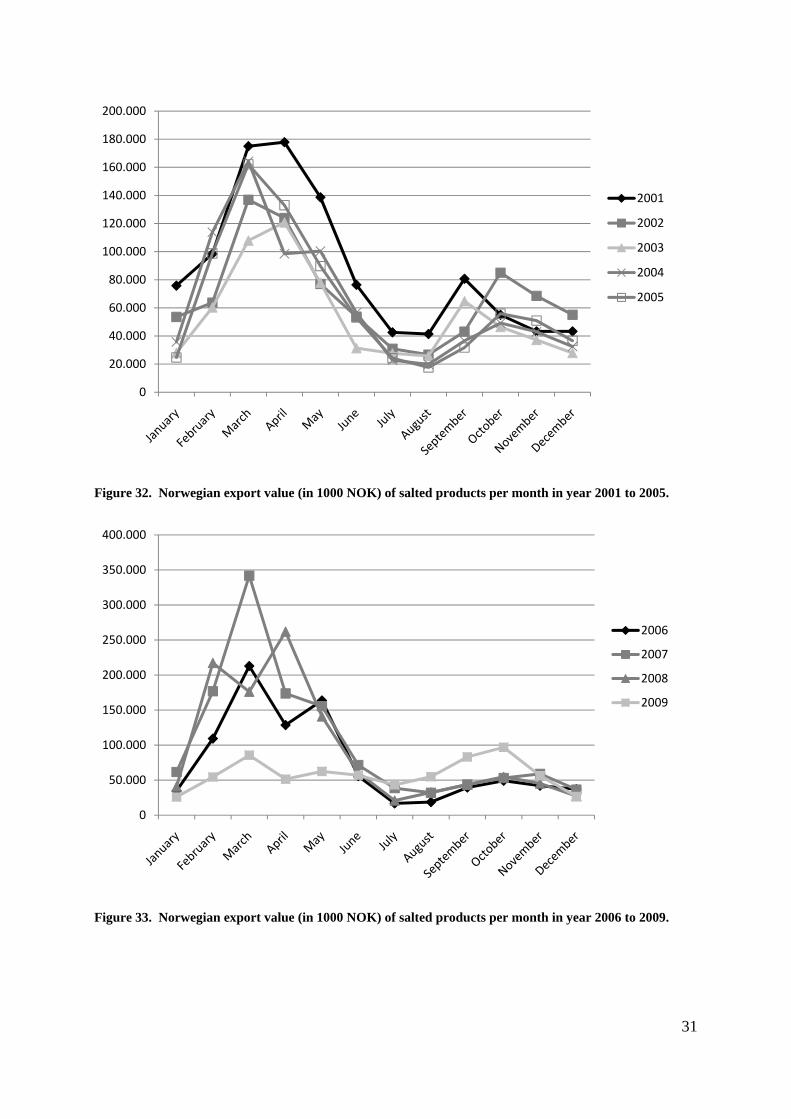
The exports of salted cod products have had a declining trend the last decade. Especially 2009, has
been a year with low export quantity and with a special trend with lower export than usually the first
0
10.000
20.000
30.000
40.000
50.000
60.000
70.000
2000
2001
2002
2003
2004
0
10.000
20.000
30.000
40.000
50.000
60.000
70.000
2005
2006
2007
2008
2009
2010
30
half of the year while the opposite was experienced the second half of the year (Figure 30, Figure 31,
Figure 32 and Figure 33).
Figure 30. Norwegian export volume of salted products per month in year 2001 to 2005
Figure 31. Norwegian export volume of salted products per month in year 2006 to 2009.
0
500
1.000
1.500
2.000
2.500
3.000
3.500
4.000
4.500
5.000
2001
2002
2003
2004
2005
Expo
rt volum
e (ton
nes)
0
1.000
2.000
3.000
4.000
5.000
6.000
7.000
8.000
2006
2007
2008
2009
Expo
rt volum
e (ton
nes)
31
Figure 32. Norwegian export value (in 1000 NOK) of salted products per month in year 2001 to 2005.
Figure 33. Norwegian export value (in 1000 NOK) of salted products per month in year 2006 to 2009.
0
20.000
40.000
60.000
80.000
100.000
120.000
140.000
160.000
180.000
200.000
2001
2002
2003
2004
2005
0
50.000
100.000
150.000
200.000
250.000
300.000
350.000
400.000
2006
2007
2008
2009
32
5.2.3 Salting procedures, curing conditions and storage
In Norway, the production of salted cod can be divided into several steps; pre-salting, salting and
finally curing during storage to become heavy salted products. Salting of the fish starts after splitting
(butterfly filleting) when salt can be introduced in a pre-salting step by brine-injection. The pre-curing
step is often done with brine of 17-18% NaCl, but the brine can also be fully saturated (~26,4% NaCl).
Further, the salting step is carried out by pickle salting. Fish and salt are laid in alternating layers in
sealed tubs, and can be stored between 2 and 15 °C for 4 days to several weeks. More and more often,
brine is added in the beginning of the pickling step. In the curing step, the fish is taken out of the tubs
and dry salted on pallets so that excessive brine is allowed to drain off. This step is normally carried
out at 2-4 °C for several weeks.
Like in Iceland, the processes used for production of salted cod have changed rapidly over the past
decades. In the beginning, the fish was only pile salted or dried salted, i.e. the split fish was stacked
with alternating layers of coarse salt, often on board fishing vessels. During the late 1970s and 1980s,
dry salting was replaced with pickle salting as the first salting step. During the 1990s, injection of
brine or brine curing (for fillets) was introduced. Adding of brine during pickle salting has been more
common after year 2000.
Several different combinations of injection, brining, pickling and dry salting are used, varying with
raw material, producers and demands from buyers. The salt concentration (NaCl) of the brine used can
be in the range of 17% to fully saturated (24%). The salt used can be sea salt, stone salt or a mix of
both. Another type of salt is “White fish salt” with higher levels of calcium than normal salt. After dry
salting, the products are graded according to size and visual appearance (commercial quality) and
packed in waxed cardboard boxes. If not fully cured when packed, the curing of the fish will continue
after packing, during storage and transport.
Before consumption the products must be rehydrated for one to two days, depending on the number of
water exchanges and storage temperature. The salt concentration is then reduced from 20% to 2-3%.
The shelf life of rehydrated products is short, and can be stored for less than a week at refrigerated
conditions (Bjørkevoll, Olsen & Skjerdal, 2003). When sold in supermarkets or other larger shops,
rehydrated products are most often frozen. In more traditional, small shops, which are declining
rapidly in number, the fish is most often sold chilled.
Due to more effective facilities for chilling, the extent of the quality problem pink discoloration
(halophilic bacteria) has been reduced the last decades. A lower level of these bacteria in the sea salt
then earlier, due to more extensive washing, can also be an important factor. In an on-going study
(Hellevik & Bjørkevoll, 2009), the level of halophilic bacteria in new salt collected from the salting
equipment at factories generally shows low, but also variable levels of halophilic bacteria (200 – 5000
CFU/g). New salt collected from bags contained 100-250 CFU/g. During and after the salting and
curing period, the level of halophilic bacteria in most cases declined. To prevent growth, the

33
temperature (below 8 °C) and air humidity (75%) must be controlled. Often the problem with pink
discoloration is first revealed in the markets where chilling facilities are lacking or not available.
5.2.4 Commercial quality rating in Norway
According to the “Norwegian Industry Standard for salted and dried salted products”, salted split fish,
is classified in the following commercial quality categories:
• Imperial/Superior: Made from fish that is thoroughly bled, well washed and rinsed to remove
remains of blood and entrails and with nape skin attached. The fish is to be properly split and
evenly salted, well pressed and restacked during processing. The fish is to be light-coloured
and firm, and without blemishes.
This category may include fish with the following characteristics: Poorly bled bellies, small
tears or longitudinal cracks, not properly rinsed, some blood clots, somewhat unevenly salted.
When assessing the fish, special consideration will be given to fish that has been thoroughly
bled and properly restacked during production. In this case, somewhat larger defects will be
tolerated if the overall impression justifies this, particularly if the fish is light-coloured and
firm.
• Universal: Fish that do not meet the requirements to Imperial/Superior are to be classified as
Universal.
This category may include fish with the following characteristics: Inadequately split, round
tail, inadequately washed or rinsed, insufficient removal of backbone, moderate blood clot,
major tears or longitudinal cracks, moderate cracking, minor blood, liver and/or bile stains.
The fish must retain its natural shape. Disfiguring blemishes such as stains/lumps of dried
blood or remains of entrails shall be removed.
• Popular: Fish that does not satisfy the requirements to Universal, which, nevertheless, is fit for
human consumption, is to be categorised as Popular. However, this category must not contain
fish that is sour, has been exposed to contamination, has ragged bellies, bile or gut content, or
fish that is badly cracked/loose fleshed.
• Mix: All the products in this standard may be packaged in a common category under the
description “Mix” if the fish is distributed fairly equally on the different categories.
All categories may include fish with black membrane. In the case of klipfish products, this
information is to be included on the package labels.
Some modifications have been added to the standard, for the rating of salted fillets:
• Imperial/Superior: In this category, the product comes from fish that has been emptied of
blood, but includes fillets that are slightly darker and bear the traces of incomplete bleeding.
34
This category may include fish with the following characteristics: small tears or longitudinal
cracks, insignificant mechanical damage. The fish is to be light-coloured and firm, and
without blemishes.
• Salted fillets, which do not satisfy the requirements to Imperial/Superior are to be classified as
Universal. This category may include fish with the following characteristics: Signs of
yellowing, larger tears or longitudinal cracks, moderate cracking, minor blood, liver and/or
bile spots, darker colour (the degree of darkness acceptable in Universal is to be assessed
based on the overall impression of the fish, minor marks from mechanical damage.
5.3 Production of salted fish in Faroe Islands
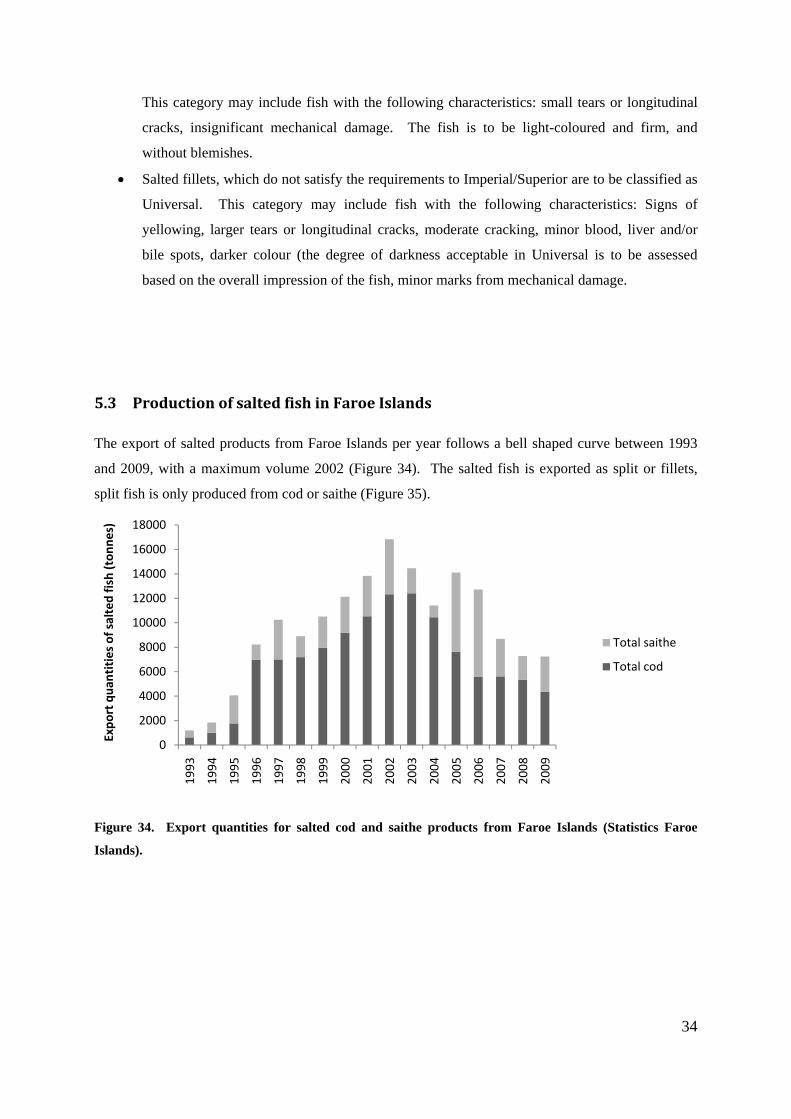
The export of salted products from Faroe Islands per year follows a bell shaped curve between 1993
and 2009, with a maximum volume 2002 (Figure 34). The salted fish is exported as split or fillets,
split fish is only produced from cod or saithe (Figure 35).
Figure 34. Export quantities for salted cod and saithe products from Faroe Islands (Statistics Faroe
Islands).
0
2000
4000
6000
8000
10000
12000
14000
16000
18000
1993
1994
1995
1996
1997
1998
1999
2000
2001
2002
2003
2004
2005
2006
2007
2008
2009
Expo
rt qua
ntities of salted fish (ton
nes)
Total saithe
Total cod
35
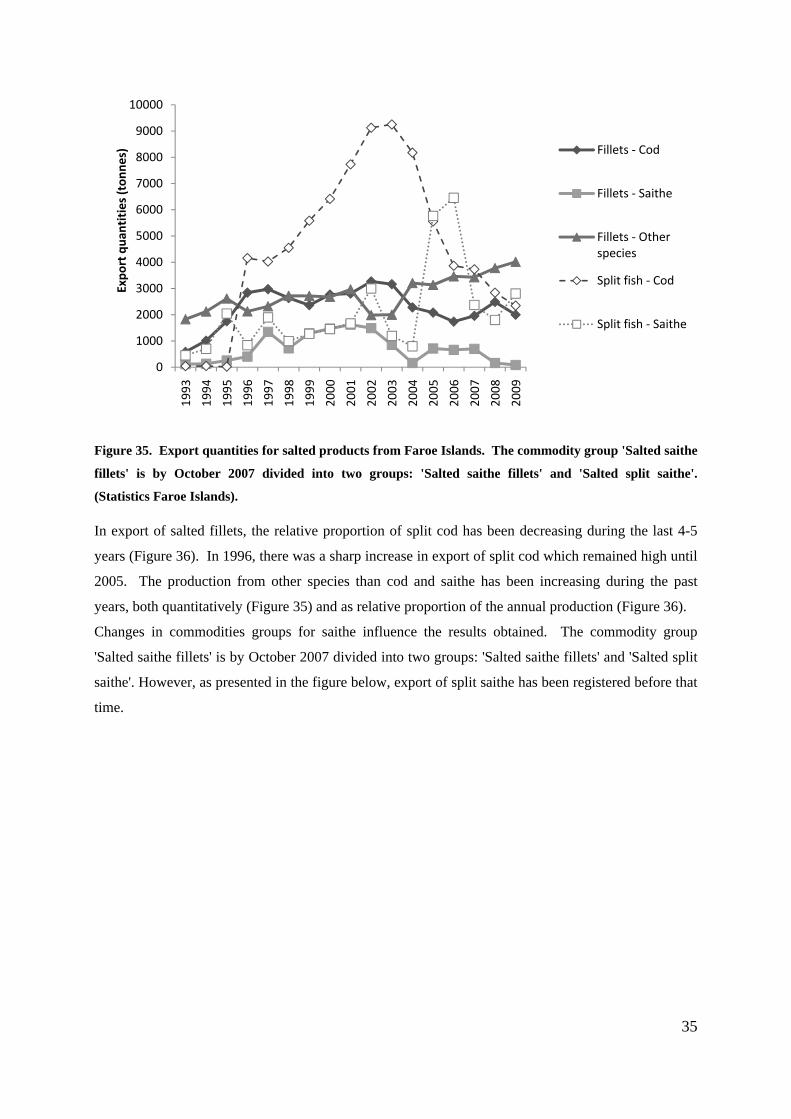
Figure 35. Export quantities for salted products from Faroe Islands. The commodity group 'Salted saithe
fillets' is by October 2007 divided into two groups: 'Salted saithe fillets' and 'Salted split saithe'.
(Statistics Faroe Islands).
In export of salted fillets, the relative proportion of split cod has been decreasing during the last 4-5
years (Figure 36). In 1996, there was a sharp increase in export of split cod which remained high until
2005. The production from other species than cod and saithe has been increasing during the past
years, both quantitatively (Figure 35) and as relative proportion of the annual production (Figure 36).
Changes in commodities groups for saithe influence the results obtained. The commodity group
'Salted saithe fillets' is by October 2007 divided into two groups: 'Salted saithe fillets' and 'Salted split
saithe'. However, as presented in the figure below, export of split saithe has been registered before that
time.
0
1000
2000
3000
4000
5000
6000
7000
8000
9000
10000
1993
1994
1995
1996
1997
1998
1999
2000
2001
2002
2003
2004
2005
2006
2007
2008
2009
Expo
rt qua
ntities (ton
nes) Fillets ‐ Cod
Fillets ‐ Saithe
Fillets ‐ Other species
Split fish ‐ Cod
Split fish ‐ Saithe
36
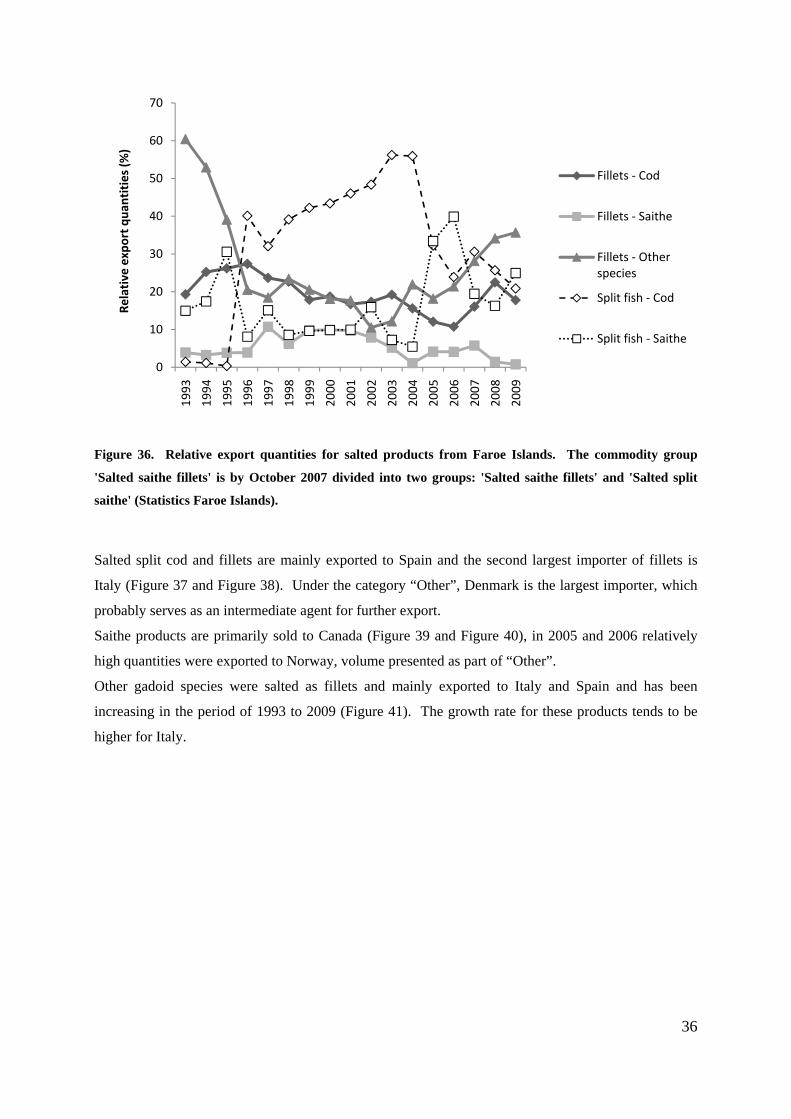
Figure 36. Relative export quantities for salted products from Faroe Islands. The commodity group
'Salted saithe fillets' is by October 2007 divided into two groups: 'Salted saithe fillets' and 'Salted split
saithe' (Statistics Faroe Islands).
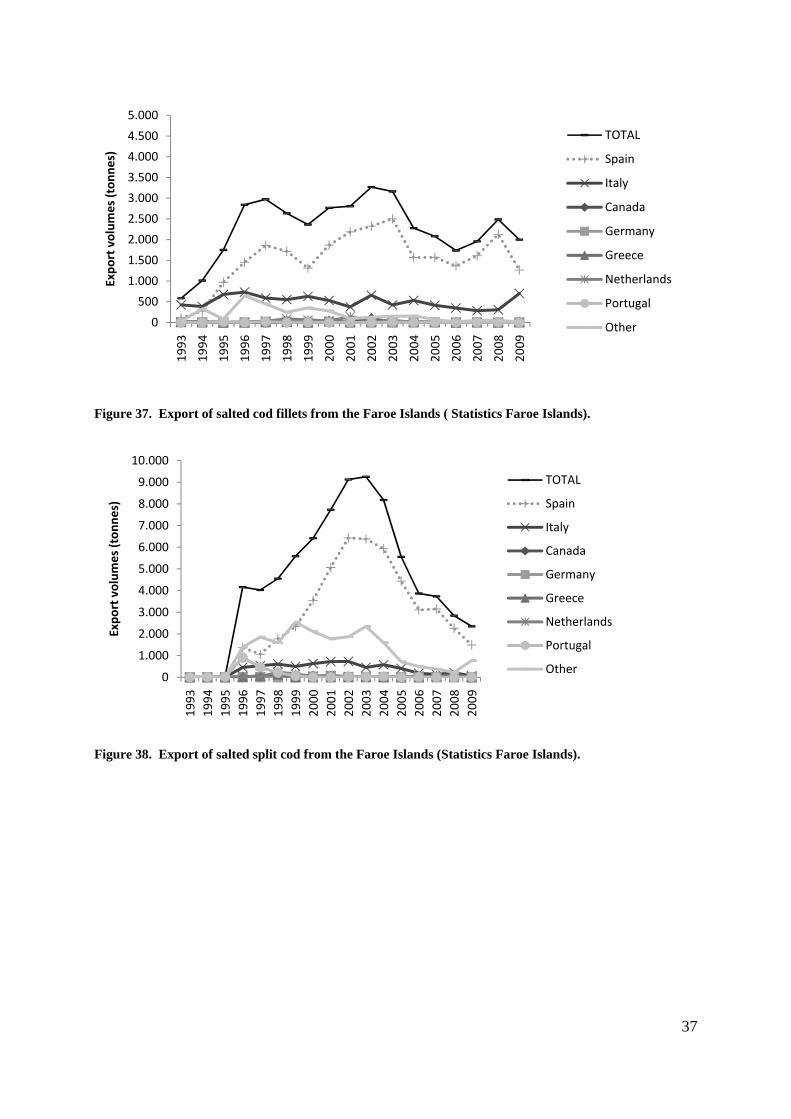
Salted split cod and fillets are mainly exported to Spain and the second largest importer of fillets is
Italy (Figure 37 and Figure 38). Under the category “Other”, Denmark is the largest importer, which
probably serves as an intermediate agent for further export.
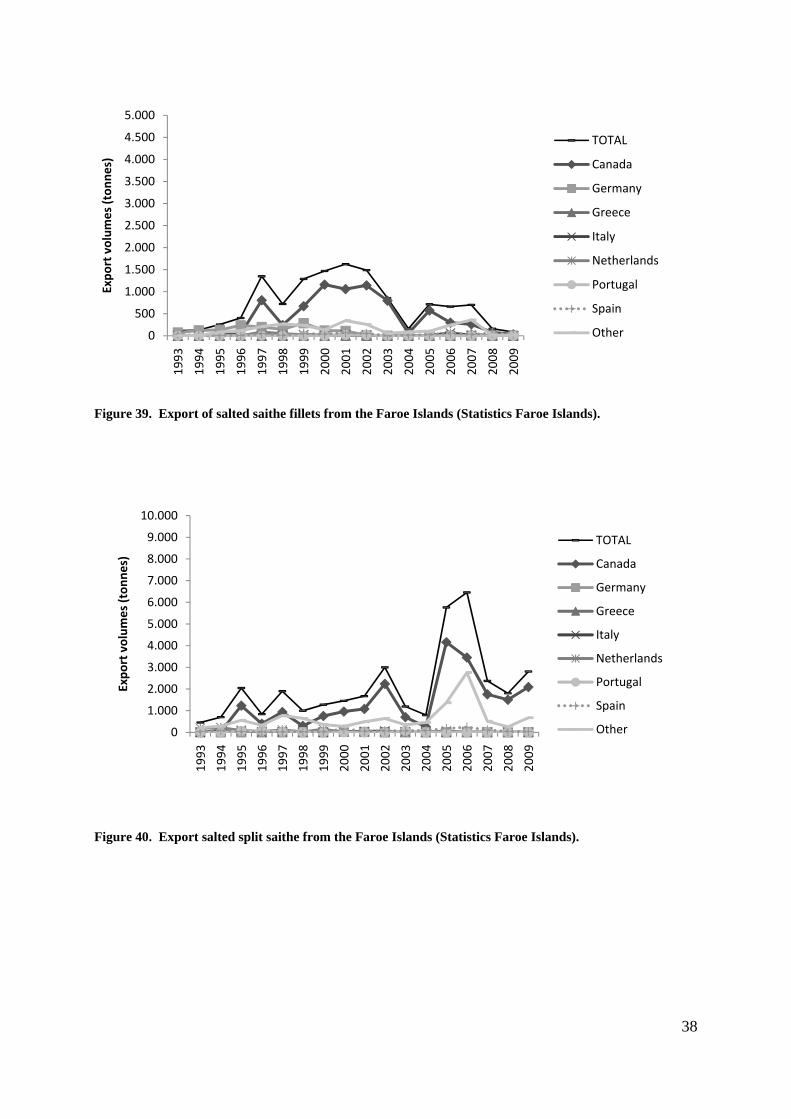
Saithe products are primarily sold to Canada (Figure 39 and Figure 40), in 2005 and 2006 relatively
high quantities were exported to Norway, volume presented as part of “Other”.
Other gadoid species were salted as fillets and mainly exported to Italy and Spain and has been
increasing in the period of 1993 to 2009 (Figure 41). The growth rate for these products tends to be
higher for Italy.
0
10
20
30
40
50
60
70
1993
1994
1995
1996
1997
1998
1999
2000
2001
2002
2003
2004
2005
2006
2007
2008
2009
Relative export q
uantities (%
)
Fillets ‐ Cod
Fillets ‐ Saithe
Fillets ‐ Other species
Split fish ‐ Cod
Split fish ‐ Saithe
37
Figure 37. Export of salted cod fillets from the Faroe Islands ( Statistics Faroe Islands).
Figure 38. Export of salted split cod from the Faroe Islands (Statistics Faroe Islands).
0
500
1.000
1.500
2.000
2.500
3.000
3.500
4.000
4.500
5.000
1993
1994
1995
1996
1997
1998
1999
2000
2001
2002
2003
2004
2005
2006
2007
2008
2009
Expo
rt volum
es (ton
nes)
TOTAL
Spain
Italy
Canada
Germany
Greece
Netherlands
Portugal
Other
0
1.000
2.000
3.000
4.000
5.000
6.000
7.000
8.000
9.000
10.000
1993
1994
1995
1996
1997
1998
1999
2000
2001
2002
2003
2004
2005
2006
2007
2008
2009
Expo
rt volum
es (ton
nes)
TOTAL
Spain
Italy
Canada
Germany
Greece
Netherlands
Portugal
Other
38
Figure 39. Export of salted saithe fillets from the Faroe Islands (Statistics Faroe Islands).
Figure 40. Export salted split saithe from the Faroe Islands (Statistics Faroe Islands).
0
500
1.000
1.500
2.000
2.500
3.000
3.500
4.000
4.500
5.000
1993
1994
1995
1996
1997
1998
1999
2000
2001
2002
2003
2004
2005
2006
2007
2008
2009
Expo
rt volum
es (ton
nes)
TOTAL
Canada
Germany
Greece
Italy
Netherlands
Portugal
Spain
Other
0
1.000
2.000
3.000
4.000
5.000
6.000
7.000
8.000
9.000
10.000
1993
1994
1995
1996
1997
1998
1999
2000
2001
2002
2003
2004
2005
2006
2007
2008
2009
Expo
rt volum
es (ton
nes)
TOTAL
Canada
Germany
Greece
Italy
Netherlands
Portugal
Spain
Other

39
Figure 41. Export salted fillets, other than cod and saithe, from the Faroe Islands (Statistics Faroe
Islands).
5.3.1 Catching methods and volumes
The catch of cod in Faroe Islands has been decreasing during the last decade (Figure 42). The
majority of the fish are caught with long-line (Figure 43). The proportion has been increasing since
1993.
Figure 42. Total cod catches in Faroe Islands by different fishing gear, in 1993 to 2009 (Statistics Faroe
Islands).
0
500
1.000
1.500
2.000
2.500
3.000
3.500
4.000
4.500
5.000
1993
1994
1995
1996
1997
1998
1999
2000
2001
2002
2003
2004
2005
2006
2007
2008
2009
Expo
rt volum
es (ton
nes)
TOTAL
Italy
Spain
Canada
Germany
Greece
Netherlands
Portugal
Other
0
5
10
15
20
25
30
35
40
45
1993
1994
1995
1996
1997
1998
1999
2000
2001
2002
2003
2004
2005
2006
2007
2008
2009
Cod catche
s (tho
usan
d tonn
es)
Fishing gear total
Long line
Otter trawl
Pair trawl
Jigging line
Gillnets etc.
40
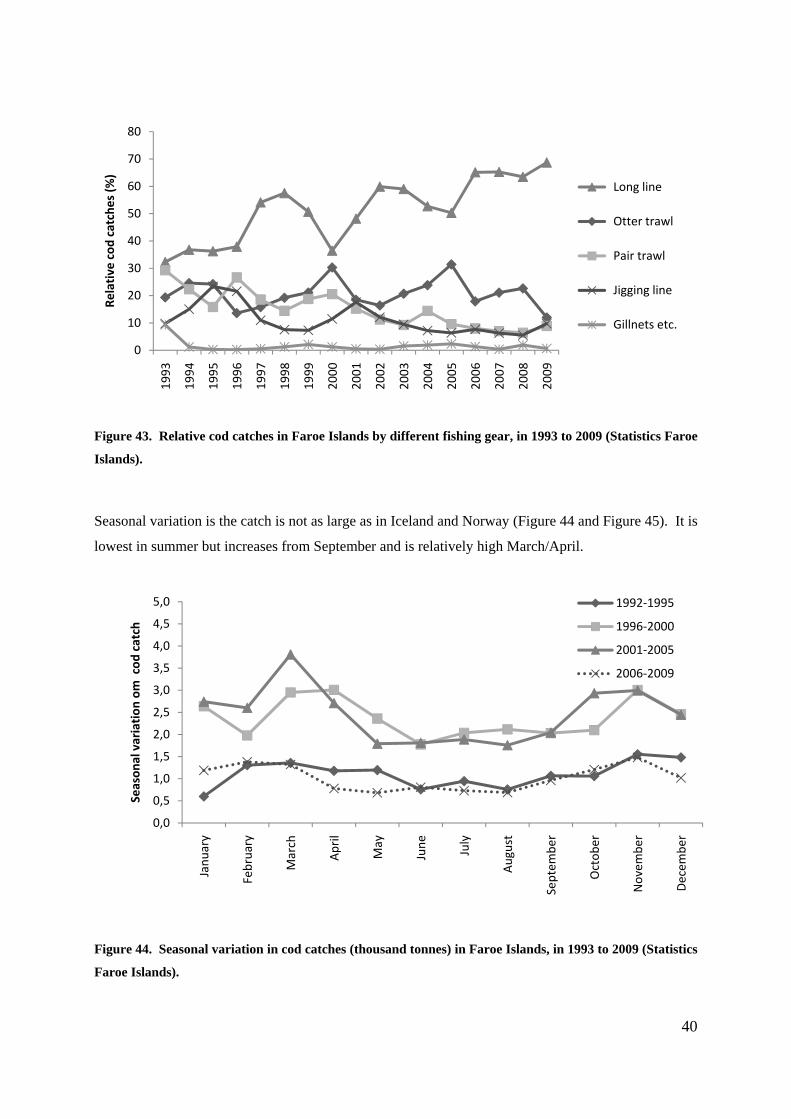
Figure 43. Relative cod catches in Faroe Islands by different fishing gear, in 1993 to 2009 (Statistics Faroe
Islands).
Seasonal variation is the catch is not as large as in Iceland and Norway (Figure 44 and Figure 45). It is
lowest in summer but increases from September and is relatively high March/April.
Figure 44. Seasonal variation in cod catches (thousand tonnes) in Faroe Islands, in 1993 to 2009 (Statistics
Faroe Islands).
0
10
20
30
40
50
60
70
80
1993
1994
1995
1996
1997
1998
1999
2000
2001
2002
2003
2004
2005
2006
2007
2008
2009
Relative cod
catches (%
)
Long line
Otter trawl
Pair trawl
Jigging line
Gillnets etc.
0,0
0,5
1,0
1,5
2,0
2,5
3,0
3,5
4,0
4,5
5,0
Janu
ary
February
March
April
May
June July
August
Septem
ber
Octob
er
Novem
ber
Decem
ber
Season
al variation
om cod
catch
1992‐1995
1996‐2000
2001‐2005
2006‐2009
41
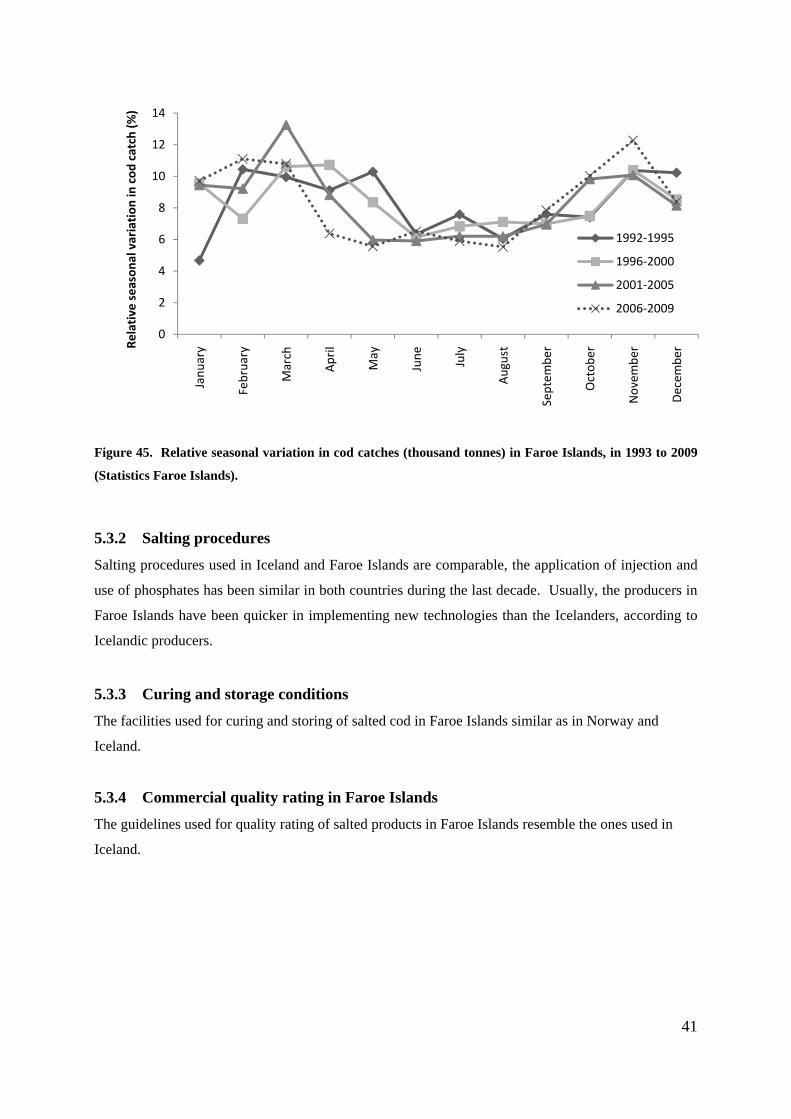
Figure 45. Relative seasonal variation in cod catches (thousand tonnes) in Faroe Islands, in 1993 to 2009
(Statistics Faroe Islands).
5.3.2 Salting procedures
Salting procedures used in Iceland and Faroe Islands are comparable, the application of injection and
use of phosphates has been similar in both countries during the last decade. Usually, the producers in
Faroe Islands have been quicker in implementing new technologies than the Icelanders, according to
Icelandic producers.
5.3.3 Curing and storage conditions
The facilities used for curing and storing of salted cod in Faroe Islands similar as in Norway and
Iceland.
5.3.4 Commercial quality rating in Faroe Islands
The guidelines used for quality rating of salted products in Faroe Islands resemble the ones used in
Iceland.
0
2
4
6
8
10
12
14
Janu
ary
February
March
April
May
June July
August
Septem
ber
Octob
er
Novem
ber
Decem
berRe
lative seasona
l variation
in cod
catch (%
)
1992‐1995
1996‐2000
2001‐2005
2006‐2009
42
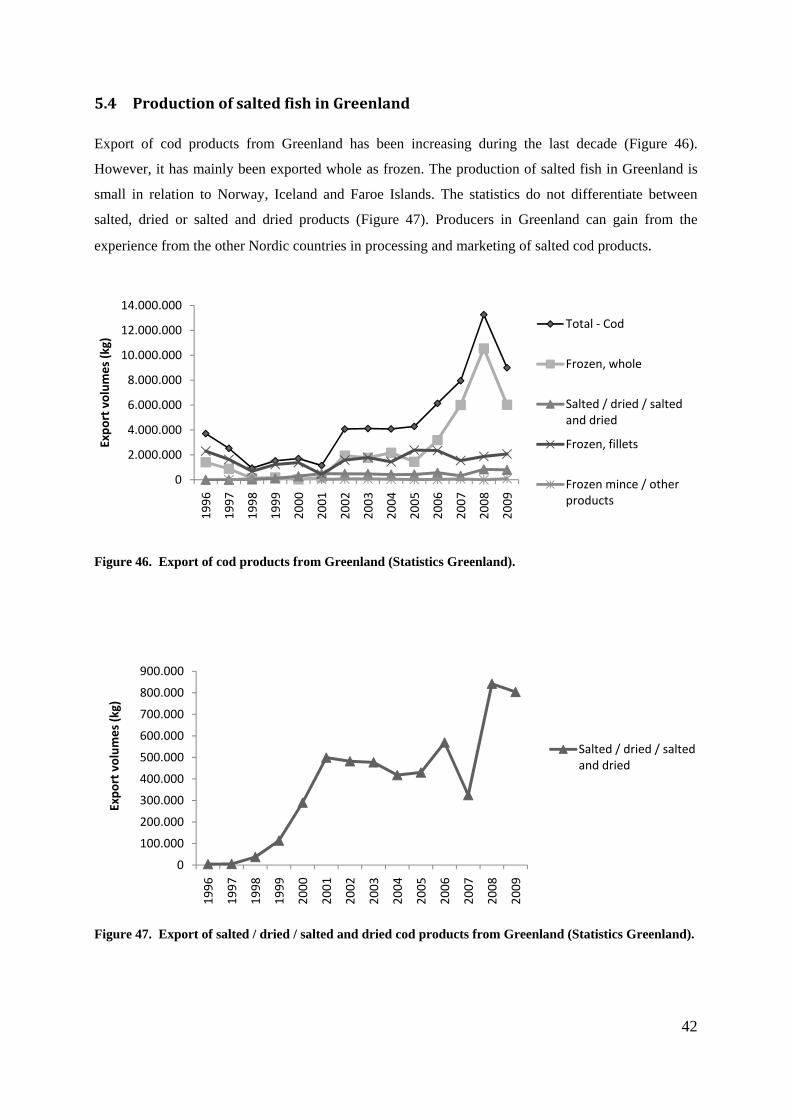
5.4 Production of salted fish in Greenland
Export of cod products from Greenland has been increasing during the last decade (Figure 46).
However, it has mainly been exported whole as frozen. The production of salted fish in Greenland is
small in relation to Norway, Iceland and Faroe Islands. The statistics do not differentiate between
salted, dried or salted and dried products (Figure 47). Producers in Greenland can gain from the
experience from the other Nordic countries in processing and marketing of salted cod products.
Figure 46. Export of cod products from Greenland (Statistics Greenland).
Figure 47. Export of salted / dried / salted and dried cod products from Greenland (Statistics Greenland).
0
2.000.000
4.000.000
6.000.000
8.000.000
10.000.000
12.000.000
14.000.000
1996
1997
1998
1999
2000
2001
2002
2003
2004
2005
2006
2007
2008
2009
Expo
rt volum
es (kg)
Total ‐ Cod
Frozen, whole
Salted / dried / salted and dried
Frozen, fillets
Frozen mince / other products
0
100.000
200.000
300.000
400.000
500.000
600.000
700.000
800.000
900.000
1996
1997
1998
1999
2000
2001
2002
2003
2004
2005
2006
2007
2008
2009
Expo
rt volum
es (kg)
Salted / dried / salted and dried

43
6 CONCLUDING REMARKS
The Nordic countries are the main exporters of salted gadoid products, whereas countries in South-
Europe and Latin America are the biggest importers. In Norway, Iceland and Faroe Islands, cod is
primarily used for the production.
Differences in handling after catching and salting procedures are the main cause to variation in the
characteristics of the salted products, such as weight yields and commercial quality. In addition, the
management and ownership of fisheries (including quotas) and processing companies is different
between the countries. In Iceland, the value chain by the biggest producers is vertically integrated,
which means that they own the quotas, the vessels, the processing companies and control the export
the markets. One of the major advantages is that supply and raw material quality can be optimised.
Flow and utilisation of information are easier and more rapid, both upstream and downstream the
value chain.
Producers in Faroe Islands seem to be most innovative in their production, rapidly reacting to
alterations in the market and other environmental factors important for the fishing industry.
Icelanders are not far behind but in Norway changes occur at a slower rate, partly due to different
manage system in the fisheries sector and separated ownership of links in the value chain.
Spain is the greatest importers of cod products from Faroe Islands and Spain. The Spanish market
pays the highest price for the products, of which whiteness, thickness and juiciness are important
quality parameters. Norwegian products are primarily exported to Portugal where prices are lower.
The main goal of the Norwegian salt fish sector is to gain a larger share of the Spanish market, through
development and alteration from the current situation in the industry.

44
7 REFERENCES
Ackman RG. 1967. The influence of lipids on fish quality. International Journal of Food Science & Technology
2(2):169-181.
Aftenposten. 2010. http://www.aftenposten.no/okonomi/article3816648.ece. 30.11.2010.
Akse L, Joensen S, and Tobiassen T. 2004. Fangstskader på råstoff i kystfisket. Report Fiskeriforskning 15/2004.
Akse L. 1995. Sammenligning av frosset / tint og kjølt torsk som råstoff til saltfiskproduksjon. Tromsö:
Fiskeriforskning.
Akse L, Gundersen B, Lauritzen K, Ofstad R and Solberg T. 1993. Saltfisk: saltmodning, utproving av
analysemetoder, misfarget saltfisk. Tromsö: Fiskeriforskning.
Birkeland S, Akse L, Joensen S, Tobiassen, T, and Skar, T. 2007. Injection-Salting of pre rigor Fillets of Atlantic
Salmon (Salmo salar). Journal of Food Science, 72, 29-35.
Bjarnason J. 1986. Handbók fiskvinnslunar – Saltfiskverkun. The Icelandic Fisheries Laboratories (Matis ohf).
Bjørkevoll I. 2010. Hvitere klippfisk -Vakuum-fjerning av blod og andel røde buker på flekket lineråstoff.
Report Møreforsking (in prep.).
Bjørkevoll I, Rindahl L, and Hellevik AH. 2009. Produktkvalitet i verdikjedeperspektiv. Report Møreforsking nr
Å 0915.
Bjørkevoll I, Olsen RL, Skjerdal OT. 2003. Origin and spoilage potential of the microbiota dominating
Psychrobacter in sterile rehydrated salt-cured and dried salt-cured cod (Gadus morhua). International
Journal of Food Microbiology 84, 175-187.
Bligh EG and Scott MA. 1966. Lipids in cod muscle and the effect of frozen storage. Journal of Fisheries
Research Board Canada 23:1025-1036.
Bligh EG and Dyer WJ. 1959. A rapid method of total lipid extraction and purification. Canadian Journal of
Biochemistry and Physiology 37:911-917.
Botta JR, Bonnell G and Squires BE. 1987a. Effect of method of catching and time of season on sensory quality
of fresh raw Atlantic cod (Gadus morhua). Journal of Food Science 52(4):928-931.
Botta JR, Kennedy K and Squires BE. 1987b. Effect of method of catching and time of season on the
composition of Atlantic cod (Gadus morhua). Journal of Food Science 52(4):922-924, 927.
Bragadóttir M. 2001. On the stability of Icelandic capelin meal. M.Sc. Thesis, University of Iceland, Reykjavik,
Iceland.
Castell CH and Bishop DM. 1973. Effect of season on salt-extractable protein in muscle from trawler-caught cod
and on its stability during frozen storage. Journal of the Fisheries Research Board of Canada 30(2):157-
160.
Castell CH, and Maclean J. 1964. Rancidity in lean fish muscle. II. Anatomical and seasonal variations. Journal
of the Fisheries Research Board of Canada, 21, 1361-1369.
Castell CH and MacLean J. 1963. Rancidity in lean fish muscle. II. Anatomical and seasonal variations. Journal
of the Fisheries Research Board of Canada, 21(6):1361-1369.
Dambergs N. 1964. Extractives of fish muscle. 4. Seasonal variations of fat, water solubles, protein and water
in cod (Gadus morhua L.) fillets. Journal of the Fisheries Research Board of Canada, 21(4):703-709.
45
Dambergs N. 1963. Extractives of fish muscle. 3. Amounts, sectional distribution and variations of fat, water-
solubles, protein and moisture in cod (Gadus morhua L.) fillets. Journal of the Fisheries Research Board of
Canada, 20(4):703-709.
Doe PE, Hashmi R, Poulter RG and Olley J. 1982. Isohalic sorption isotherms. I. Determination for dried salted
cod (Gadus morhua). Journal of Food Technology 17:125-134.
Duerr JD and Dyer WJ. 1952. Proteins in fish muscle. IV. Denaturation by salt. Journal of the Fisheries
Research Board of Canada 8(5):325-331.
Esaiassen M, Dahl R, Eilertsen G, Gundersen B, and Sivertsvik M. 2008. Pre-rigor filleting and brining of
farmed cod: Influence on quality and storage stability. LWT - Food Science and Technology, 41(4), 724-
729.
Fraser DI, Mannan A, Dyer DJ. 1961. Proximate composition of Canadian Atlantic fish. III. Sectional
differences in the flesh of species of Chondrostei, one of Chimaerae, and of some miscellaneous teleosts.
Journal of the Fisheries Research Board of Canada, 18, 893-905
Gallart-Jornet L, and Lindkvist KB. 2007. The Spanish salt fish market - a challenge to the Norwegian salt fish
industry. Torskefiskkonferanse, Tromsø 07.11.2007
Hamm R. 1960. Biochemistry of meat hydration. Advances in Food Research, 10:355-363.
Hellevik AH, and Bjørkevoll I. 2009. Resirkulering av salt i produksjon av salt- og klippfisk. Report
Møreforsking nr Å 0910.
Ingólfsdóttir S, Stefánsson G and Kristbergsson K. 1998. Seasonal variations in physicochemical and textural
properties of North Atlantic cod (Gadus morhua) mince. Journal of Aquatic Food Product Technology
7(3):39-61.
Innovasjon Norge. 2010. http://www.innovasjonnorge.no/Internasjonale-markeder/Kontorer-i-
utlandet/Spania/Nyheter/Naturally-cured-Norwegian-Bacalao-heading-to-Spain/. 30.11.2010.
Kristín Anna Þórarinsdóttir, Guðný Guðmundsdóttir, Sigurjón Arason. 2005. Ratio and chemical contents of by-
products selected from five cod species. Progress report in EU-project: Fishery by-products (QLK1-CT-
2000-01017). The Icelandic Fisheries Laboratories, IFL-report 31-05.
Larsen R, Olsen SH, Kristoffersen S, and Elvevoll EO. 2008. Low salt brining of pre-rigor filleted farmed cod
(Gadus morhua L.) and the effects on different quality parameters. LWT - Food Science and Technology,
41(7), 1167-1172.
Lauritzsen K, Akse L, Johansen A, Joensen S, Sorensen NK, and Olsen, R.L. (2004). Physical and quality
attributes of salted cod (Gadus morhua L.) as affected by the state of rigor and freezing prior to salting.
Food Research International, 37(7), 677-688.
Lindkvist KB, Gallart-Jornet L, and Stabell MC. 2008. The restructuring of the Spanish salted fish market. The
Canadian Geographer/Le Géographe canadien, 52(1), 105-120.
Love RM. 1975. Variability in Atlantic cod (Gadus morhua) from the Northeast Atlantic: A review of seasonal
and environmental influences on various attributes of the flesh. Journal of the Fisheries Research Board of
Canada 32(12):2333-2342.
Love RM. 1980. Seasonal variation and some alternative approaches to fish biology. The Chemical Biology of
Fishes. London, New York: Academic Press. p. 350-387.
46
Love RM. 1979. The post-mortem pH of cod and haddock muscle and its seasonal variation. Journal of the
Science of Food and Agriculture 30(4):433-438.
Love RM, Robertson I, Lavéty J and Smith GL. 1974. Some biochemical characteristics of cod (Gadus morhua,
L.) from the Faroe Bank compared with those form other fishing grounds. Comparative Biochemistry and
Physiology 47B:149-161.
MRA. 2007. Market and product development study for the salt fish industry in Nova Scotia for the Nova Scotia
Department of Fisheries and Aquaculture, Tender #60130623. MRA Management Consultants Ltd, Nova
Scotia, (http://www.gov.ns.ca/fish/marketing/ra/SaltfishMS.pdf)
Pedro S AM, Nunes ML, Bernado MF. 2004. Pathogenic bacteria and indicators in salted cod (Gadus morhua)
and desalted products at low and high temperatures. Journal of Aquatic Food Product Technology
13(3):39-48.
Rodrigues MJ, Ho P, Lopez-Caballero ME, Vaz-Pires P and Nunes ML. 2003. Characterization and
identification of microflora from soaked cod and respective salted raw materials. Food Microbiology
20(4):471-481.
Rørå AMB, Furuhaug R, Fjæra SO, and Skjervold PO. 2004. Salt diffusion in pre-rigor filleted Atlantic salmon.
Aquaculture, 232(1-4), 255-263.
Skjervold PO, Bencze Rora AM, Fjaera SO, Vegusdal A, Vorre A and Einen O. 2001. Effects of pre-, in-, or
post-rigor filleting of live chilled Atlantic salmon. Aquaculture, 194(3-4), 315-326.
Statistics Faroe Islands (http://www.hagstova.fo)
Statistics Greenland (http://www.stat.gl)
Statistics Iceland (http://www.statice.is/series).
The Norwegian Export Council Statistics, Norway (http://www.seafoodfromnorway.com)
Norwegian Directorate of Fisheries (http://www.fiskeridir.no)
UN Comtrade (http://comtrade.un.org/)
Valdimarsson and Gunnarsdottir, 1982. Áhrif mismunandi blóðgunar and slægingar á gæði ferskfisks, frystra
flaka og saltsfisks. The Icelandic Fisheries Laboratories.
Wang D, Tang J, and Correia LR. 2000. Salt diffusivities and salt diffusion in farmed Atlantic salmon muscle as
influenced by rigor mortis. Journal of Food Engineering, 43(2), 115-123.