variables influencing stimulus overselectivity in …
TRANSCRIPT

VARIABLES INFLUENCING STIMULUS OVERSELECTIVITY
IN NORMALLY DEVELOPING CHILDREN
Kimberley H. Smith
A Thesis
Submitted to
the Graduate Faculty of
Auburn University
in Partial Fulfillment of the
Requirements for the
Degree of
Master of Science
Auburn, Alabama December 16, 2005

iii
VARIABLES INFLUENCING STIMULUS OVERSELECTIVITY
IN NORMALLY DEVELOPING CHILDREN
Kimberley H. Smith
Permission is granted to Auburn University to make copies of this thesis at its discretion, upon request of individuals or institutions and at their expense. The author reserves all
publication rights.
______________________________ Signature of Author
______________________________ Date

iv
VITA
Kimberley Ann (Hays) Smith, daughter of Emit Calvin Hays Jr. and Carol (Meade) Hays,
was born August 29, 1975, in Cullman, Alabama. She graduated from J.B Pennington
High School in 1993. She attended the University of Montevallo and graduated in 1997
with a Bachelor of Science degree in Psychology. After working several years as a
behavior analyst specializing in treatment of autism spectrum disorders and
developmental disabilities, she entered Graduate School at Auburn University. She
married Charles (Chad) M. Smith, son of Manuel and Rosemary (Mead) Smith on July
17, 1999.

v
THESIS ABSTRACT
VARIABLES INFLUENCING STIMULUS OVERSELECTIVITY
IN NORMALLY DEVELOPING CHILDREN
Kimberley H. Smith
Master of Science, December 16, 2005 (B.S. University of Montevallo, 1997)
92 typed pages
Directed by James M. Johnston
Stimulus overselectivity is a type of responding observed in children and adults with
autism spectrum disorders and mental retardation. It involves responding that is
controlled by a small, often irrelevant portion of a total stimulus that results in other
stimulus components failing to exert control over responding. Although this phenomenon
has been examined frequently in individuals with autism spectrum disorders and mental
retardation, few studies are available examining overselective responding in normally
developing children and adults. Evidence that is available suggests that young normally
developing children respond to few components of a complex stimulus. The present
experiment was designed to identify variables influencing overselective responding in
preschoolers and more specifically, what type of stimulus presentation might result in
overselective responding. Participants, ages 3.11, 4.2 and 4.6, were presented a delayed

vi
matching to sample task displayed on a computer touch screen. The matching task was
presented as a game to the children in groups of 10 trials. Stimuli appeared on the screen
and the children were told to find the one that matches the first picture. Matching tasks
involving size, shape, number of stimuli and configuration of stimuli within a stimulus
complex were presented. Participants showed decreases in correctly matching the
dimension of size when stimuli were complex and of high number. Additionally, results
from the configuration condition showed that when responses to the top left shape in the
configuration were required, correct responding was 50% or less across subjects
suggesting that the stimulus dimensions of size and configuration within these conditions
was not exerting stimulus control over participants responding. This observation of
overselective responding illustrates the effect that stimulus features may have on
matching responses. The results also make apparent the implications of stimulus
arrangement on correct responding and the issues this poses for teachers and trainers. In
addition, there does not seem to be a distinct phenomenon in any specific sense different
than stimulus control deficits. Rather, it could be argued that certain stimulus
presentations tend to generate particular types of errors. Conceptual and definitional
issues surrounding stimulus overselectivity should be reexamined.

vii
ACKNOWLEDGEMENTS
I would like to express my deepest gratitude to my husband Chad Smith. It is
because of his support, patience, and love that this task was possible. I would like to
thank my parents for being excellent role models for me in all areas of my life and always
being supportive and loving regardless of the circumstances.
I would like to thank Jim Johnston for his guidance and willingness to teach. He
gave me a chance to further my studies in behavior analysis so that I may achieve my
academic and personal goals; to him I am deeply grateful.
I would also like to acknowledge Mei Jang’s assistance in programming the
software for this experiment. Also, thanks to Linda Silvern for allowing data collection at
Auburn Early Learning Center.
viii
Style Manual Used
Publication Manual of the American Psychological Association, 5th edition.
Computer software used
Microsoft Word 2003
Microsoft Excel 2003
Sigma Plot 9.0

ix
TABLE OF CONTENTS
LIST OF TABLES………………………………………………………………………...x
LIST OF FIGURES………………...…………………………………………………….xi
I. INTRODUCTION……………………………………………………….……1
a. Autism and its features………………….………………………………....1
b. Phenomenon of Stimulus Overselectivity………………………….……...7
II. METHOD…………...……………………………………………………….22
III. RESULTS……………...…………………………………………………….38
IV. DISCUSSION………………………………...……………………………...48
V. REFERENCES..……………………………………………………………..58
VI. APPENDICES……….………………………………………………………64
x
LIST OF TABLES
TABLES
1. Summary of all phases………………………. ………………………………………26
2. Pre-experimental phase stimulus conditions……………………………………….…31
3. Experimental phase stimulus conditions………………………………………….…..32
4. Stimulus manipulations with shape, size, and number conditions………………...….33
5. Classification of Global Ability Scores…………………………………...……….…39
6. Participant’s T-scores and GCA scores ………………………………………......….39
7. Location of incorrect responses for Participant 0011…………………...………..…..47
xi
LIST OF FIGURES
FIGURES
1. Example of visual stimulus………………….……………………………………..…25
2. Diagram of stimulus presentation on touchscreen…………………………...……….27
3. Example of trial sequence for Training phase-step 2, Pre-Experimental phase and Experimental phase……………………...……………...27 4. Example of stimuli used in Training phase- Step 1……………………...……….…..29 5. Example of Training Phase -Step 2……………………………..……………………30 6. Example stimulus presentation within pre-experimental phase for number condition…………………………………………………...……………..31 7. Example of stimuli presented in experimental phase in size condition with a high number of complex stimuli…………..……………………….35 8. Example of stimuli presented in experimental phase configuration condition- same shape-top left position…………………..…………...36 9. Number of correct size matching responses for all stimulus conditions………………………………………………………………..…41 10. Number of correct size matching responses made when stimuli presented were complex or simple…….………………………………42 11. Number of correct shape matching responses……………….………………………43 12. Number of correct shape matching responses when
stimuli were small or large………..…………………………………………………43 13. Number of correct “number of objects” matching
responses is shown…………………………………………………………………..44

xii
14. Number of correct number matching responses when stimuli were small or large.………………………………………………………….45
15. Number of correct matching responses when configuration of shape was manipulated……..……………………………………....46

1
Chapter I. INTRODUCTION
Variables Influencing Stimulus Overselectivity in
Normally Developing Children
Autism and its Features
In 1943, Leo Kanner first classified a group of 11 children as having early infantile
autism. The word autism means “absorption in self-centered activity and extreme
withdrawal or divorce from external reality”. He defined his observations as “inability to
relate themselves in the ordinary way to people and situations from the beginning of life".
In addition, he described these children as having “extreme autistic aloneness”. He
delineated six common characteristics among those children he observed.
1. Profoundly impaired social interactions including aloofness and aloneness
2. An obsessive perservation of sameness in behavior that is markedly rigid,
repetitive, lacking the usual play behavior of most children, and overall,
lacking in creative or imaginative dimensions.
3. Impaired language and social communication, including language that is
absent (mutism) deficient and, if present at all, is characteristically not aimed
at communication. Two frequent verbal behaviors are echolalia (insistent
repetition of words that may continue well beyond the normal age of about 3

2
years) and pronoun reversal, in which the “I” and “you” forms are not used
correctly.
4. A strong fascination for objects that are often handled with considerable fine
motor coordination
5. Exceptional memory feats may be performed by some of these children, such
as repeating verbatim whole television commercials or song lyrics.
6. Autism is evident early in life and is typically diagnosed by 2.6 to 5 years
(Kanner, 1943, p. 220).
Autism, also referred to as autistic disorder, is defined as a severely incapacitating
developmental disorder with neurological origins involving the child’s cognitive
functioning, language, social skill development, emotional life, and motor performance,
occurring during the first three years of life and continuing throughout the lifespan
(Autism Society of America website, 2002; Graziano, 2002). Autism is just one
diagnosis on the spectrum of pervasive developmental disorders; no one child displays
the exact behavioral characteristics as another child diagnosed with autism. The
behaviors associated with autism can include any combination and range from mild to
severe. Autism spectrum disorders (ASD) include autistic disorder, Rett’s disorder,
Childhood Disintegrative disorder, pervasive developmental disorder-not otherwise
specified, and Asperger’s disorder (DSM-IV-TR, 2001).
Prevalence and Incidence of Autism
Autism is currently the most frequently diagnosed of the pervasive
developmental disorders and has been located in all ethnic, racial, and social groups. An
3
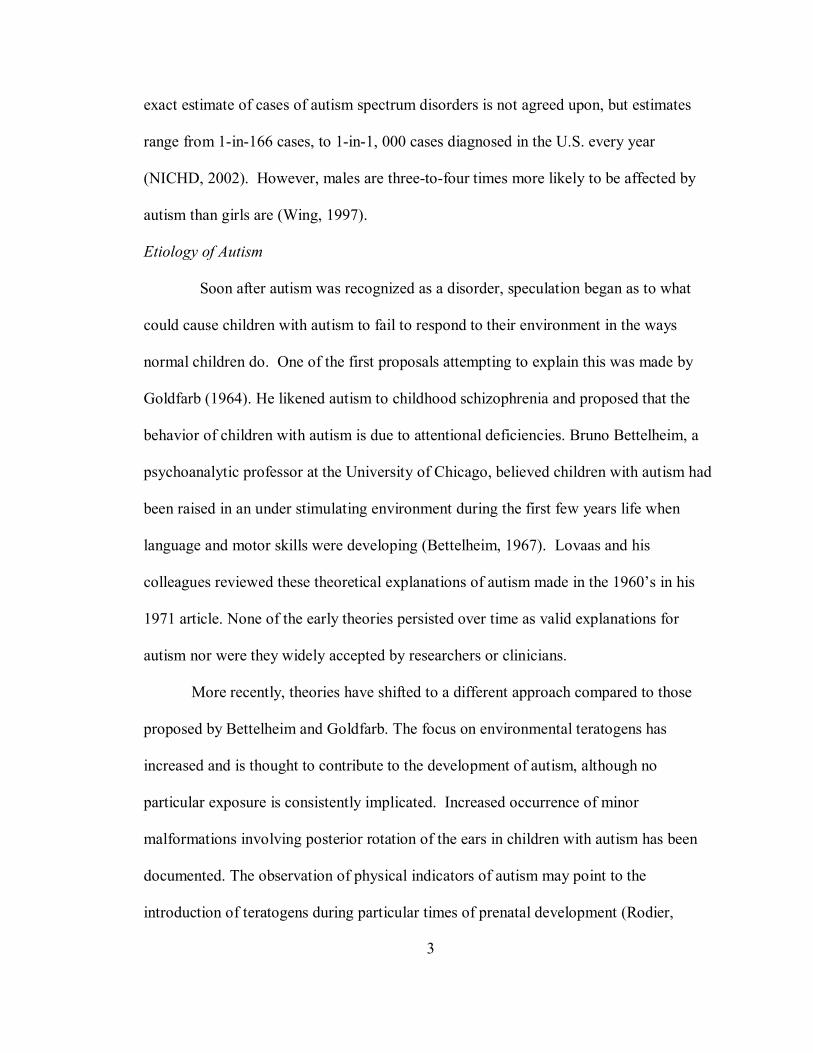
exact estimate of cases of autism spectrum disorders is not agreed upon, but estimates
range from 1-in-166 cases, to 1-in-1, 000 cases diagnosed in the U.S. every year
(NICHD, 2002). However, males are three-to-four times more likely to be affected by
autism than girls are (Wing, 1997).
Etiology of Autism
Soon after autism was recognized as a disorder, speculation began as to what
could cause children with autism to fail to respond to their environment in the ways
normal children do. One of the first proposals attempting to explain this was made by
Goldfarb (1964). He likened autism to childhood schizophrenia and proposed that the
behavior of children with autism is due to attentional deficiencies. Bruno Bettelheim, a
psychoanalytic professor at the University of Chicago, believed children with autism had
been raised in an under stimulating environment during the first few years life when
language and motor skills were developing (Bettelheim, 1967). Lovaas and his
colleagues reviewed these theoretical explanations of autism made in the 1960’s in his
1971 article. None of the early theories persisted over time as valid explanations for
autism nor were they widely accepted by researchers or clinicians.
More recently, theories have shifted to a different approach compared to those
proposed by Bettelheim and Goldfarb. The focus on environmental teratogens has
increased and is thought to contribute to the development of autism, although no
particular exposure is consistently implicated. Increased occurrence of minor
malformations involving posterior rotation of the ears in children with autism has been
documented. The observation of physical indicators of autism may point to the
introduction of teratogens during particular times of prenatal development (Rodier,
4
Bryson & Welch, 1997). Possible prenatal and perinatal environmental events that could
contribute to the development of autism include: rubella, herpes, encephalitis, maternal
bleeding during mid-to late pregnancy, drugs taken during pregnancy, and Rh
incompatibility. It is important to note that autism is observed throughout many different
social classes, nationalities, and cultures and rules out the possibility that it is has social
or cultural origins (Graziano, 2002).
Genotypic factors play an important role in the development of autism.
Hereditary, genetic, and chromosomal factors are implied by the findings in twin
research. While same-sex dizygotic twins have a concordance rate of 5 to 10 percent,
monozygotic or identical twins have a concordance rate of 65 to 90 percent. Siblings of
people with autism have a three to eight percent greater chance of having autism.
Furthermore, the recessive gene metabolic disorder, phenylketonuria, or PKU, and
Fragile X syndrome, a chromosomal irregularity, is present in some cases of autism
(Graziano, 2002). Fragile X is an X-linked disorder thereby affecting more boys than
girls. This disorder is characterized by retardation, hyperactivity, short attention span,
speech irregularities, poor eye contact as well as physical characteristics such as
hyperextensible joints (double jointedness), large or prominent ears, and in males, large
testicles (Fragile X website, Hagerman). The concurrent presence of Fragile X and autism
leads researchers to suggest it is the most common biomedical cause of autism (Graziano,
2002).
Examination of the environmental influences and possible genetic predispositions
has led many researchers to suggest a biological model of autism, that is, autism as a
biologically determined behavior disorder (Graziano, 2002). Piven, Arndt, Bailey,

5
Havercamp, Andreasen, and Palmer’s (1995) research revealed larger than normal brain
size in 22 males with autism due to a larger amount of brain tissue and larger lateral
ventricles. Another brain disorder related with autism is epilepsy. Thirty-five to forty-
five percent of autism cases also experience epileptic seizures (Graziano, 2002). This
correlational evidence combined with the evidence compiled across genetic and
environmental influences provides a starting point from which to begin the investigation
into the origins of autism. Until this research is complete, autism will continue to be
diagnosed based on behavioral characteristics.
Diagnostic Criteria and Behavioral Characteristics
When Leo Kanner first distinguished the classification of autism in 1943, he
commented on one of the eleven children he observed as follows:
When spoken to, he went on with what he was doing as if nothing had been said. Yet, one never had the feeling that he was willingly disobedient
or contrary. He was obviously so remote that the remarks did not reach him.
(Kanner, 1943, p. 217)
Often this unresponsiveness to verbal stimuli is the first behavioral deficit parents of
children with autism recognize. According to the Diagnostic and Statistical Manual 4th
ed, TR, (DSM-IV-TR) to meet the criteria for diagnosis, a child must exhibit a total of six
or more items from groups 1, 2, and, 3 with at least two items from 1, and 1 item each
from 2 and 3:
A. 1. Qualitative impairment in social interaction, as manifested by at least two of the

6
following:
a. marked impairment in the use of multiple nonverbal behaviors such as
eye-to- eye gaze, facial expression, body postures, and gestures to regulate
social interaction
b. failure to develop peer relationships appropriate to developmental level
c. a lack of spontaneous seeking to share enjoyment, interests, or
achievements with other people (e.g., by a lack of showing, bringing, or
pointing out objects of interest)
d. lack of social or emotional reciprocity
2. Qualitative impairments in communication as manifested by at least one of the
following:
a. delay in, or total lack of, the development of spoken language (not
accompanied by an attempt to compensate through alternative modes of
communication such as gesture or mime)
b. in individuals with adequate speech, marked impairment in the ability to
initiate or sustain a conversation with others
c. stereotyped and repetitive use of language or idiosyncratic language
d. lack of varied, spontaneous make-believe play or social imitative play
appropriate to developmental level
3. Restricted repetitive and stereotyped patterns of behavior, interests, and
activities, as manifested by at least one of the following:
a. encompassing preoccupation with one or more stereotyped and restricted
7
patterns of interest that is abnormal either in intensity or focus
b. apparently inflexible adherence to specific, nonfunctional routines or
rituals
c. stereotyped and repetitive motor mannerisms (e.g., hand or finger
flapping or twisting, or complex whole-body movements)
d. persistent preoccupation with parts of objects
B. Delays or abnormal functioning in at least one of the following areas, with onset
prior to age 3 years: 1. social interaction, 2. language as used in social communication,
or (3) symbolic or imaginative play.
C. The disturbance is not better accounted for by Rett's Disorder or Childhood
Disintegrative Disorder (DSM-IV-TR, 2001).
An overarching characterization observed in many children with autism is the way they
respond to complex environmental stimuli regardless which class of behavior is involved.
Phenomenon of Stimulus Overselectivity
Stimulus overselectivity observed in autism.
A key underlying feature in the diagnosis of autism is the phenomena referred to
as stimulus overselectivity or restricted stimulus control. Defined as focusing on a small,
often irrelevant portion of a total stimulus (Graziano, 2002), stimulus overselectivity
seems to affect the child with autism’s overall responding. The label “restricted stimulus
control” results from animal studies demonstrating the phenomena (Gray, 1976).
Stimulus overselectivity has been shown to affect functioning in a child with autism in

8
many different ways. For example, by focusing on or “overselecting” a particular feature
of a stimulus, such as the color of an object, the child may have considerable difficulty
learning about other features of the stimulus such as its shape. Another example might be
the child focusing on only one word in a sentence. After testing to determine that the
child can receptively identify a pencil and a desk, as well as the instruction “Bring me”
you ask him or her to “Bring me a pencil from your desk.” In the previous instruction, the
child might only respond to the instruction “bring me”; instead of bringing you the pencil
as you asked, the child might simply bring you something else from another place in the
room, and never bring the pencil to you. Although the skill of using receptive language is
considerably different from the visual task given in the first example, the result may
possibly be the same underlying mechanism. However, the exact mechanism underlying
overselective responding is still in question after more than thirty years of research.
Over the past few decades, many investigations searched for reasons underlying
this atypical responding in children with autism and additionally in persons with mental
retardation. These research efforts have resulted in two major lines of study: 1. Multiple
presentation of stimuli (including visual, auditory and tactile), visual cue discriminations,
auditory cue discriminations, and 2. Investigations correlating stimulus overselectivity,
IQ and mental/chronological age (Lovaas, Koegel, & Schreiberman 1979).
Multiple presentation of stimuli to children with autism, normal children and
mentally retarded children in the laboratory of Ivar Lovaas at UCLA resulted in an often
cited series of studies. Lovaas, Schreibman, Koegel, and Rehm (1971) published the
seminal study investigating simultaneous presentation of visual, auditory, and tactile
stimuli. During this experiment, bar pressing was reinforced for three different subjects

9
when they responded to the simultaneous presentation of a red floodlight (visual
stimulus), white noise (auditory stimulus) and a puff of air being forced into a blood
pressure cuff secured around the left calf of the child (tactile stimulus). Once this
performance was established, each stimulus modality was presented separately to
determine which stimulus had acquired control over responding. The results showed that
children with autism primarily responded to only one of the stimuli, the mentally retarded
children responded variably, and the group of normally developing children responded to
all three stimuli when presented separately. It was also found that if a particular stimulus
did not gain stimulus control properties or, in other words, if a particular stimulus did not
come to control the child’s response during the simultaneous presentation phase, it could
gain control over responding if it was trained separately later. All children exhibited
orienting responses to the three stimuli separately, yet the children with autism only
responded to one of the components during the testing phase. There was no evidence of a
particular stimulus modality exerting control in any of the groups. In discussion of his
finding, Lovaas et al., stated that the data showed that when autistic children are
presented with multiple stimulus inputs, their behavior often comes under the control of a
range of input that is too restricted (1971). Lovaas consequently labeled his observations
as stimulus overselectivity because the subjects overselected a portion of the stimuli
available. To clarify, this label does not imply that the children scan their environment
and select a portion of a relevant cue; they quite possibly may select an irrelevant or
minor feature of a cue while not responding to relevant features of the cue (Lovaas et al.,
1971).
10
After the initial study, it was determined that the child with autism may have been
“flooded” or “overloaded” with stimulation. To simplify and ameliorate this possible
confound, Lovaas and Schreibman (1971) conducted a study using only two stimuli:
auditory and visual. Actually, the same subjects, procedure, and stimuli were used as in
the first study (a red floodlight and white noise). However, there were two groups
observed in this study, children with autism and normally developing children. The
normal group showed no evidence of stimulus overselectivity, similar to findings in the
previous study; however, the children with autism showed somewhat different results
compared to the previous study. Four of the six children with autism showed
overselective responding; that is, only one of the stimuli controlled responding. The other
two children with autism showed little or no evidence of stimulus overselectivity.
Although there is no definitive reason for this difference, Lovaas and Schreibman
suggested that a possible reason lies in the fact that the previous study used three
different stimuli, while this study used two different stimuli. This finding led to the
conclusion that overselectivity may be more clearly observed with a larger quantity of
stimuli (Lovaas, Koegel & Schreibman, 1979).
The findings from the Lovaas et al. (1979) study led to further questions
surrounding the reasons for overselective responding in the autism population. One
possibility is that children with autism have great difficulty responding to separate
components of a complex stimulus. Another proposal was that children with autism are
“super-efficient”; that is, their selection behavior is reinforced in the presence of an
isolated portion of a discriminative stimulus resulting in only a portion of the entire
stimulus complex acquiring control over responding.
11
In 1977, Koegel and Schreibman conducted another study to answer the questions
formulated based on results of the Lovaas et al. (1979) study. The design of the
experiment was a reversal of the previous two investigations. The stimuli (auditory and
visual) were first presented individually and the children received reinforcement for
responding to them separately. Then stimuli were presented in three different ways:
visual only, auditory only, or visual/auditory simultaneous. Only responses to the
simultaneously presented stimuli were reinforced, whereas in previous studies responses
to a particular individual stimulus were reinforced. The results of this study
demonstrated that the children with autism continued to respond to only one of the
stimulus components for hundreds of trials, even though they received no reinforcement
for doing so. Also, responding to the other (also nonreinforced) stimulus extinguished
rapidly (Koegel & Schreibman, 1977). This finding led Koegel and Schreibman to drop
the hypothesis that children with autism were “super-efficient” in their responding, but to
retain the hypothesis that children with autism do have difficulty responding to stimuli
with multiple components (Lovaas, Koegel, & Schreibman, 1979).
Following Lovaas, Koegel, and Schreibman’s research using multiple cue
presentation, the possibility arose that stimulus overselectivity was being observed
among children with autism because they have difficulty responding when stimuli are
presented simultaneously in more than one sensory modality (Lovaas, Koegel, &
Schreibman, 1979). Reynolds, Newsome, and Lovaas (1974) developed a study to test if
this hypothesis was true in the auditory modality. Two groups were used in the study: an
group of eight children with autism with a mean age of eleven years, seven months, and a
normally developing group of eight children, mean age six years, six months. The

12
children were trained to press a bar when a two component auditory stimulus was
presented. During the test phase, the children were presented with individual components
to assess if responding was controlled by both individual components, only one of the
components, or both of the components. The children with autism responded to only one
of the stimuli presented separately, while the normally developing children responded to
both stimuli presented separately (Reynolds, Newsome, & Lovaas, 1974). This
replicates the findings observed by Lovaas, Schreibman, Koegel, and Rehm (1971) and
Koegel and Schreibman (1977) using stimuli from different modalities.
In addition to the studies examining auditory performance in children with autism,
the use of visual stimuli to demonstrate stimulus overselectivity has also been widely
employed. Koegel and Wilham (1973) conducted a study similar to that of Reynolds et
al. (1974) to test if the presentation of only visual stimuli might alleviate overselective
responding. Fifteen children with autism and fifteen normally developing children were
trained to respond to a complex visual stimulus made up of a card with two pictures
divided by a line. The children were tested by presenting single components of the
stimulus complex to determine if one component or both would control responding. As
found in previous studies, the children with autism primarily responded to only one of the
stimuli, although the majority of normal children responded to both. While the majority
of normal children responded to both stimuli presented separately, it is important to note
that three of the normal children did exhibit overselective responding (Koegel & Wilham,
1973).
The location of visual cues was proposed as a controlling factor by Anderson and
Rincover (1982). Anderson and Rincover conducted their investigation using eight

13
children with autism and eight normal children. Their goal was to demonstrate the
generality of stimulus overselectivity. Two experimental phases were implemented with
all children in the study. First, a pre-assessment was conducted to select children who
showed evidence of overselective responding. Two-digit numbers on 15X15 cm poster
board paper were the stimuli employed in the assessment and test conditions. Children
were trained to respond to one number (42) and to not respond to another number (96).
Reinforcement schedules were gradually thinned from continuous to VR 4 as consecutive
correct responses were increased. To determine which stimulus (the 4 or the 2) was
controlling responding, test trials were conducted presenting the number 41 and 82.
Children that responded at chance levels (70% or less) were not included in the following
phases because it was not conclusive they were exhibiting overselective responding.
Phase two consisted of an assessment of gestalt responding. (Gestalt is a concept
used to refer to an object made up of many parts, yet commonly controls responding as
one stimulus.) Children were trained to respond to three stimulus conditions involving
circles made up of many small dots (small, medium and large), while receiving mild
punishment for responding to a blank card presented simultaneously. A test or probe
condition was then introduced and a circle was presented on one card and a random
assortment of dots was presented on the other card. These type probe trials were
presented to determine the degree of stimulus control acquired by the circle (or the
gestalt) versus the components of the circle (the dots). Data collected under these two
conditions was examined to discover whether children would respond to the components
(dots) and their location and to assess whether stimulus overselectivity varied as a

14
function of stimulus parameters, such as how close the dots were to each other (Anderson
& Rincover, 1982).
Children with autism responded to the small and medium size circles during the
probe phase, but when the condition containing the large circle and dots was presented, 6
of the 8 responded to the large randomly placed dots. This suggests that overselectivity in
children with autism is not a generalized phenomenon across task conditions, but might
be a function of task parameters. This study further demonstrated that the nature of
stimulus variables influenced the responding of both normal and autistic children
(Anderson & Rincover, 1982).
A few years later, Rincover, Feldman, and Eason (1986) conducted a study using
children with autism that examined the absolute distance components were located from
each other, leading them to label certain types of responding “tunnel vision”. The
stimulus conditions for this study varied the distance (small, medium, large) of the center
cue from the other cues. Stimulus control probes were conducted for each stimulus
condition to determine which cues the children were learning (Rincover et al. 1986).
The results of this study revealed that the distance between the cues did make a
difference in the number of stimulus features the child responded to. When the distance
between cues was reduced, the number of cues controlling responding increased.
However, this finding was not observed in the normal children included in the study
(Rincover et al. 1986).
These studies examining children with autism help reveal some of the conditions
under which stimulus overselectivity is observed. The “tunnel vision hypothesis”
continues to be referred to as one of the possible factors of influencing visual stimulus

15
overselectivity in those with autism. However, stimulus overselectivity has not only been
investigated in children with an autism diagnosis. Studies demonstrating stimulus
overselectivity in individuals diagnosed with mental retardation has also been an active
line of research.
Stimulus Overselectivity observed in mental retardation.
In their 1971 study, Lovaas, Schreibman, Koegel, and Rehm found that children
with mental retardation typically responded to only two of the three test stimuli, even
though all three were presented simultaneously in the training sessions. Wilhelm and
Lovaas (1976) used subjects divided into three groups: severe MR, moderate MR, and
non-retarded. Subjects were trained on a visual discrimination task to respond to stimuli
cards with two pictures and were tested to see if they would respond to only one of the
pictures. Wilhelm and Lovaas found that the lower the IQ of the subject, fewer cues were
responded to.
Litrownik, McInnis Wetzel-Pritchard, and Filipelli (1978) conducted a study
examining stimulus overselectivity using a matching to sample task. Seven Down’s
syndrome children, seven autistic, and seven normal children were taught a matching to
sample task to further examine the attentional differences between children with autism
and MR. Results showed that the children with Down’s syndrome matched significantly
fewer pictures that the autistic or normal children.
Bailey (1981) examined stimulus overselectivity in mildly retarded and learning-
disabled public school children. The children were trained on a three-component visual
discrimination task and then tested on individual elements to determine which was
controlling responding. Nine of the mentally retarded children and eight of the learning
16
disabled students showed some overselective responding. The majority of the retarded
children exhibited stimulus overselectivity by responding to only one of three
components of the discrimination task, although the majority of the learning disabled
children responded to the discrimination task by only responding to two of the three
components (Bailey, 1981).
These studies demonstrating the phenomena of stimulus overselectivity in mental
retarded children suggests that stimulus overselectivity is not observed only in children
with autism. Furthermore, it is not a phenomenon only observed in children. Stromer,
McIlvane, Dube, and Mackay (1993) used teenagers and adults with mental retardation to
test if they exhibited stimulus overselectivity under conditions previously used with non-
human subjects such as pigeons and monkeys (D’Amato & Salmon, 1984; Riley, 1984;
Riley & Roitblat, 1978). They used a delayed matching-to-sample procedure with
complex sample and comparison stimuli. In this case, stimuli included two or more
features such as color and form. Stimuli were either one or two simultaneously displayed
pictures. All subjects responded with high accuracy when the stimuli only contained one
feature, however when the contingency was changed, requiring the subjects to
discriminate between two features of the stimuli, accuracy dropped considerably.
Huguenin and Touchette (1980) used color and tilted lines to examine stimulus
overselectivity in mentally retarded adult men. After training on the task, the two
features were combined and referred to as “conflict-compound” stimuli. Reinforcement
history was reversed for one element of the compound. After responding to the
compound stimulus was 95% accurate, control by each element was measured. The
unchanged element of the compound stimulus (regardless of type) consistently exerted
17
control correlating with the reinforcement contingencies associated with that compound.
This study not only exhibited stimulus overselectivity in adults, but the role
reinforcement plays in overselective responding.
The studies summarized thus far demonstrating stimulus overselectivity in autistic
and mentally retarded children and adults, has led to speculation that stimulus
overselectivity is a function of developmental level or mental age (Hale & Morgan, 1973;
Koegel & Wilhelm, 1973; Lovaas et al., 1971; Ross, 1976; Wilhelm & Lovaas, 1976).
Smeets et al. (1985) discusses this possibility, noting that stimulus overselectivity is
observed in both normal and handicapped children of low mental age and suggesting that
normal children become nonoverselective as they grow older and the degree of stimulus
overselectivity covaries with the degree of handicap. Whatever the cause of
overselectivity, it has been demonstrated in individuals with mental retardation.
Stimulus Overselectivity observed in normal children
A few researchers have tested normal children for evidence of stimulus
overselectivity. Eimas (1969) was one of the first, and he conducted a study of
elementary school age children in kindergarten, second, and fourth grade children. They
were trained on a single, two-choice discrimination with either two, three or four relevant
and redundant visual cues. Pertinent to this review, the study examined how many cues
are employed in problem solution, and the effect of developmental level on the use of
multiple cues.
The stimuli used were color-form patterns. The original presentation consisted of
two relevant cues, for example a green triangle. The three component cues were color,
form, and size (large green triangle). The four-cue condition contained the above
18
components, but in addition had a 1/16-inch border outlining the pattern that contained
both slanted and alternating dashes of black and white, vertical dashes of black and white,
or a solid black line. All 270 elementary students were tested individually and then
received twenty-five trials per day until they correctly discriminated twenty out of
twenty-five trials or until 100 trials had been administered. Nine students from
kindergarten, eight from second grade and two from fourth grade failed to learn the
original discrimination. Furthermore, the number of errors made by the kindergarten
children, was greater than for the older children 15 compared to 10.5 and 7.4 for second
and fourth graders. In addition, children on average responded to at least two cues and
often three, but the number tended to increase with age. These findings show that
younger, normal children typically use no more than two cues when completing a
discrimination task.
In 1973, Hale and Morgan proposed a new method for assessing children’s
component selection by testing if they responded to a single feature of a multi-component
stimulus. Two age groups were tested: the mean for one group was 4.6 years and the
mean for the other group was 8.8 years. The stimuli used included colored shapes on
black cards, white shapes on black cards, and colored cards. Two sets of five stimuli were
used that differed in the color chosen to be associated with each shape as well as in the
particular group they were in. The five cards were displayed with the shape facing away
from the subject and with instruction to match the cue card to one of the five display
cards. This procedure resulted in evidence that the younger group responded primarily to
a single component (shape) during the acquisition of the discrimination.

19
Duarte and Baer (1997) were able to show evidence of overselective responding
in a normal adult population using a facial recognition task. In the first session, all
participants were shown eight pictures of male hairstyles paired with a name. Then
participants viewed all the hairstyles again and were asked to respond with the correct
name. This error-corrected training was conducted until participants had named each
picture of hair correctly in two consecutive cycles. Then the complete faces (sudden
construction) were added to the hair pictures and naming and correction were provided.
In addition, a gradual construction procedure was conducted with some faces; one
element at a time was added to the face after the participant had correctly named all faces
in their current state and in two different orders. Probes were then conducted showing
each face without its hair. Participants were asked to name each face as before but
without corrections. Verbalization of how difficult the discrimination was given when the
first probe trial was presented. The results showed that when a single stimulus is
programmed as the only possible controlling stimulus, the addition of more potential
controlling variables could result in variable amounts of overselectivity.
Another area of study conducted involves studies demonstrating stimulus
overselectivity in children with autism and normal children matched by mental age/IQ
(Koegel & Wilhelm, 1973; Schover & Newsome, 1976; Rincover & Ducharme, 1987;
Rincover, Feldman, & Eason, 1986; Reynolds, Newsome, & Lovaas, 1974). Correlational
data found within studies examining stimulus overselectivity and low mental age reveal
some learner characteristics that may also be present when overselective responding is
observed. It may prove helpful to the field of autism treatment to compare skill
development of normal children and children with autism. This evidence begs further

20
inquiry into this phenomena’s presence in normal children. Table 1 contained within
Appendix B summarizes the studies reviewed within this manuscript by listing the
population and the variety of stimulus presentations used to study overselective
responding.
Practical Implications
Even though instances of stimulus overselectivity are observed in normally
functioning adults, the extent of stimulus overselectivity in normal children seems to
lessen as they grow older, at least according to the current literature available. The
challenge for trainers and teachers of children with autism is how to establish
discriminated responding, and research does not often support clear training protocols.
There is a protocol-training flowchart informally available that is rumored to have
originated from Lovaas’ intervention program, but no citation evidence can be located. In
1998, Mark Sundberg and Jim Partington published the ABLLS (Assessment of Basic
Language and Learning Skills). This assessment recommends a teaching sequence for
language skills that somewhat alleviates the problem of the lack of sequence for
instructional goals when teaching discriminated language skills to children with autism
(Sundberg & Partington, 1998). Although these resources are available, they are rarely
used by those trained outside the field of behavior analysis.
If typically developing children are able to overcome overselective responding
through normal developmental processes and experience, might study of their acquisition
of discriminative skills lead to new procedures to reduce this problem in children with
autism? Determining what factors enable normal children to reduce this type of

21
responding may give insight into ways of addressing this problem in those with
developmental disabilities.
What are the features of skill development by which a normally developing child
responds correctly to discrimination tasks without responding overselectively? Stimulus
overselectivity is present when simultaneous cues from different modalities are presented
and when cues from the same modality are presented, as has been shown by the autism
studies reviewed. However, the variables controlling stimulus overselectivity in normal
children are still unclear. While stimulus overselectivity has been thoroughly studied in
the autism population, the variables associated with overselective responding have not
been adequately investigated in normal children. It is unknown if there are particular
features or arrangements of visual stimuli that make overselective responding more or
less likely to occur. The purpose of the present study was to determine what particular
stimulus features lead to stimulus overselectivity in normally developing children.

22
Chapter II. METHOD Participants and Procedure
Participants were selected from Auburn University Early Learning Center on the
campus of Auburn University. Three preschool students (ages 3 years 11 months, 4 years
2 months, and 4 years 6 months) were selected to participate based on parental consent,
the child’s willingness to participate and scores on the Differential Ability Scales®. The
Differential Ability Scales® (DAS) published by The Psychological Corporation was
administered by a master’s level psychologist who was supervised by a Ph.D. licensed
psychologist.
The DAS is an individually administered battery of subtests comprised of 17
cognitive and 3 achievement subtests. It is designed to provide a measure of conceptual
and reasoning abilities useful for diagnostic and placement purposes. T-scores and the
GCA (Global Conceptual Ability) score contributed to the selection of children to
participate in the study. Selected children’s T-scores and GCA score had to be at or above
age level on the following subtests:
1. Verbal subtest
2. Non-verbal subtest
3. Spatial subtest
The objective of examining these particular criteria was to exclude participants that were
not at normal developmental level in the areas of language and spatial skills. This
23
allowed the researcher to minimize the possibility that a particular type of responding
was due to a developmental disability or delay. This was necessary because stimulus
overselectivity is commonly observed in children with developmental disabilities;
excluding those children not scoring at age level in these skill areas allowed selection of
children who were developing normally.
Following the administration of the DAS, each participant was asked to name
favorite toys, games, and cartoons. If the participant was selected to continue in the
study, this information was used to select visual stimuli that flashed on the computer
screen when the correct response was selected. The information was also used to
purchase items that were kept in a closed box accessible only after completing a session.
These preferred items included computer games, coloring and drawing materials, and
small toys.
The experiment was conducted in the research lab of the Auburn University Early
Learning Center over a nine-month period. Participants sat at a child-sized table in front
of a touch screen placed over the monitor of a laptop computer. The experimenter was
present in the room seated in a chair beside and slightly behind the participant’s chair to
prompt the participant to respond if necessary. The stimuli used in the experiment were
displayed using Visual Basic® software. This software program also compiled raw data
and created graphs. Additional graphs were constructed using Microsoft Excel® and
Sigma Plot®.
Pilot Studies
Some features of the experiment were determined by a series of pilot studies that
took place over a six month period. During these pilot studies, the experimenter presented

24
different stimulus conditions and combinations of stimuli to determine what stimulus
features might influence the way normal children responded in this procedure. Overall,
fewer correct responses were observed when the stimuli presented within the matching
task contained more two or more stimulus features. This led to the development of four
different stimulus conditions containing matching tasks grouped by stimulus dimension.
Observations during the pilot tests also led to the development of the shape
configuration condition. Some participants were only using a particular shape within a
group of shapes to select a correct matching response.
Furthermore it was determined that participants had more difficulty attending to
all the features of a stimulus when there were more, rather than fewer comparison stimuli
presented. Coupled with the fact that teaching skills to young children occurs with
multiple stimuli present, this observation resulted in the decision to present eight
comparison stimuli from which to choose the correct response.
In addition, session length was determined from pilot studies. When sessions of
only ten trials were tested, most students requested more trials. When sessions of thirty
trials were tested, some students, especially those younger than four years, requested to
end the session early. Based on these observations, twenty trials were presented each
session. If the participant requested to continue after twenty trials, then ten additional
trials were completed.
Reinforcer usage was also manipulated during pilot studies. Children named some
of their favorite toys and cartoons following the DAS assessment session, and it was
observed that pictures of these named objects and novel auditory stimuli presented after a
trial did increase matching responses for most pilot participants. Based on this
25
observation, it was determined to use preferred visual stimuli and a novel auditory
stimulus as a reinforcer after each trial throughout the experiment (See Figure 1).
Figure 1. Example of visual stimulus
Design Overview
The overall design of the experiment is summarized in Table 1. Details not
included in the table are provided in text. Each participant followed the sequence
of phases listed in Table 1. However, within phases two and three, blocks of 10 trials for
each stimulus condition were randomly presented across participants to eliminate the
possibility that patterns of responding were due to a sequence effect.
The stimulus arrangement on the screen for all phases is diagramed in Figure 2.
The location of stimuli on the screen was counterbalanced across trials to ensure that
particular types of stimuli and location of correct responses were not presented in the
same location from trial to trial within a block of 10 trials. When the eight comparison
stimuli appeared on the screen after presentation of each sample stimulus, there was up to
a 0.25 probability that the correct response could be chosen. (To show eight comparison
stimuli, some stimuli were presented on the screen more than one time.) The trial
sequence used throughout the experiment is diagramed in Figure 3.
Location of the correct response on the computer screen throughout the
experiment was counterbalanced so that the location of the correct response was not

26
presented in any pattern or more or less frequently in some locations. However, data were
examined to determine if a particular location was selected more frequently for each
participant. Following completion of the experiment, correct and incorrect responses
were tallied for each location on the screen to reveal if participants exhibited position
preference.
Table 1 Summary of all phases ______________________________________________________________________ Phase Description Number of trials ______________________________________________________________________ 1. Training 1. Touch screen training 5
2. Delayed matching to sample training 10
2. Pre-experimental Tested matching performance on 10 trials per
all 4 stimulus conditions in stimulus condition
isolation (40 total trials)
3. Experimental Tested matching performance on 10 trials per
all 4 stimulus conditions while stimulus condition
additional stimulus features were (180 total trials)
varied across blocks of trials
_____________________________________________________________________

27
Figure 2. Diagram of stimulus presentation on touchscreen. Sample stimulus is removed
after observing response, and comparison stimuli are presented after a zero second delay.
Sample Stimulus Presented
Participant touches sample stimulus and it is removed from screen
0 second delay
Eight comparison stimuli presented
Participant touches matching stimulus
Comparison 1
Comparison 4
Comparison 6
Comparison7
Comparison 5
Comparison 8
Sample
Comparison 2
Comparison 3

28
Response results in visual/auditory stimulus presentation (correct) or
3 sec. black screen (incorrect)
2 second Inter-trial interval
Figure 3. Example of trial sequence for Training phase-Step 2, Pre-Experimental phase,
and Experimental phase.
Training phase
Participants first engaged in training to generate performance characteristics
necessary for appropriate sensitivity to the independent variable. These characteristics
included the ability to consistently select a matching comparison stimulus when a sample
stimulus was presented. The training phase comprised two steps: 1.Touch screen training
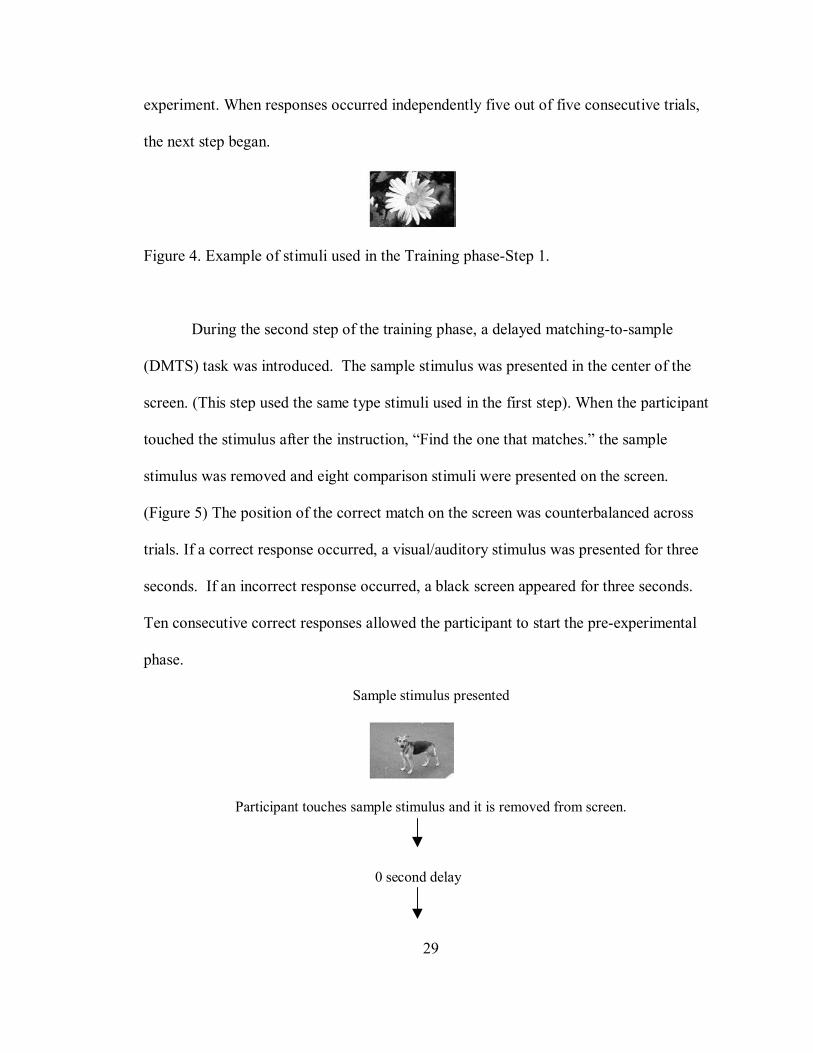
and 2. Delayed matching to sample (MTS) training (0 s delay). During touch screen
training, a single stimulus appeared on the center of the screen consisting of pictures of
common objects children often encounter in their daily environment. (Figure 4)
Participants were verbally prompted to touch the stimulus. If the verbal prompt was not
effective, the intrusiveness of the prompts increased until the participant responded.
Each response was consequated by a three second cartoon flashing on the screen and an
auditory stimulus consisting of praise or a funny sound. The cartoons were selected based
on information provided by the child during the initial assessment. The computer
software was programmed to randomly select audio and video files throughout the
29
experiment. When responses occurred independently five out of five consecutive trials,
the next step began.
Figure 4. Example of stimuli used in the Training phase-Step 1.
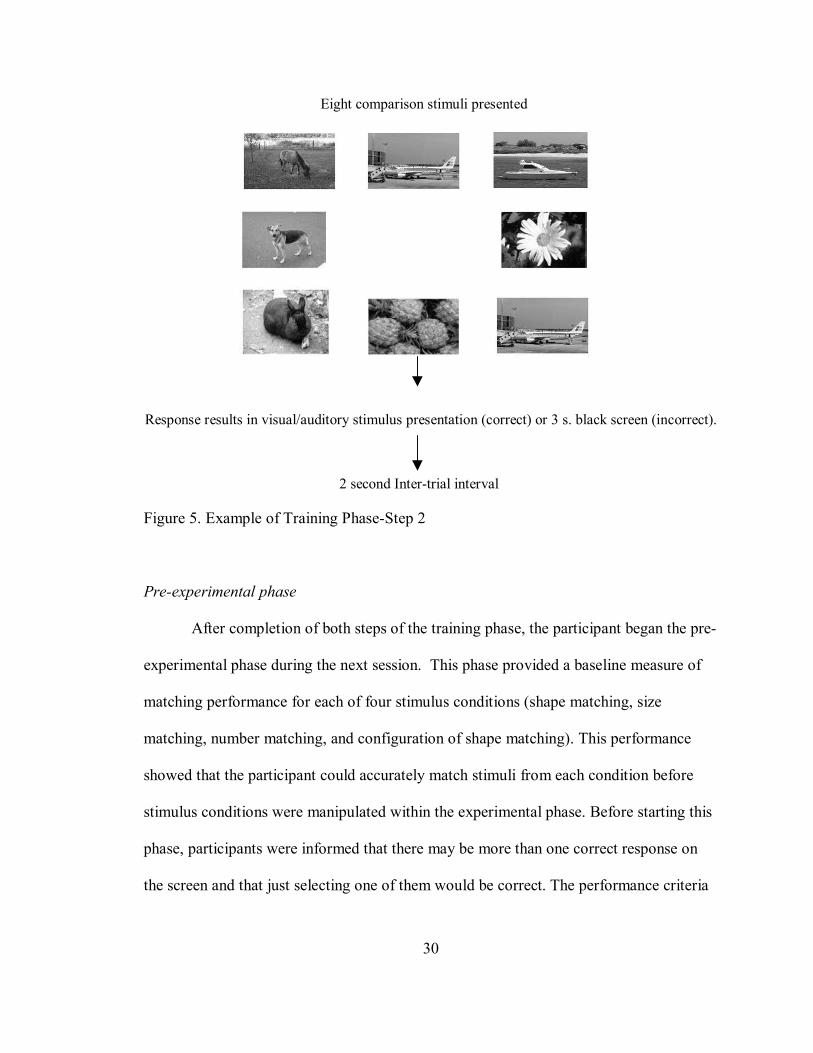
During the second step of the training phase, a delayed matching-to-sample
(DMTS) task was introduced. The sample stimulus was presented in the center of the
screen. (This step used the same type stimuli used in the first step). When the participant
touched the stimulus after the instruction, “Find the one that matches.” the sample
stimulus was removed and eight comparison stimuli were presented on the screen.
(Figure 5) The position of the correct match on the screen was counterbalanced across
trials. If a correct response occurred, a visual/auditory stimulus was presented for three
seconds. If an incorrect response occurred, a black screen appeared for three seconds.
Ten consecutive correct responses allowed the participant to start the pre-experimental
phase.
Sample stimulus presented
Participant touches sample stimulus and it is removed from screen.
0 second delay
30
Eight comparison stimuli presented
Response results in visual/auditory stimulus presentation (correct) or 3 s. black screen (incorrect).
2 second Inter-trial interval
Figure 5. Example of Training Phase-Step 2
Pre-experimental phase
After completion of both steps of the training phase, the participant began the pre-
experimental phase during the next session. This phase provided a baseline measure of
matching performance for each of four stimulus conditions (shape matching, size
matching, number matching, and configuration of shape matching). This performance
showed that the participant could accurately match stimuli from each condition before
stimulus conditions were manipulated within the experimental phase. Before starting this
phase, participants were informed that there may be more than one correct response on
the screen and that just selecting one of them would be correct. The performance criteria

31
required to progress to the next phase was 10 out of 10 consecutive, correct, matching
responses.
Each participant completed 10 trials within each of the four stimulus conditions
during this phase. Table 2 lists the stimuli used in each condition within the pre-
experimental phase. Figure 6 shows an example of stimuli presented within this phase.
Table 2
Pre-experimental phase stimulus conditions ________________________________________________________________________ Stimulus Condition Stimuli used in pre-experimental phase ________________________________________________________________________ Size Small & large circles Shape Circle & oval Number 1 circle & 2 circles Configuration of shape Grouping of 4 squares and 4 circles ________________________________________________________________________
Sample
Comparison
Figure 6. Example stimulus presentation within pre-experimental phase for number
condition.
32
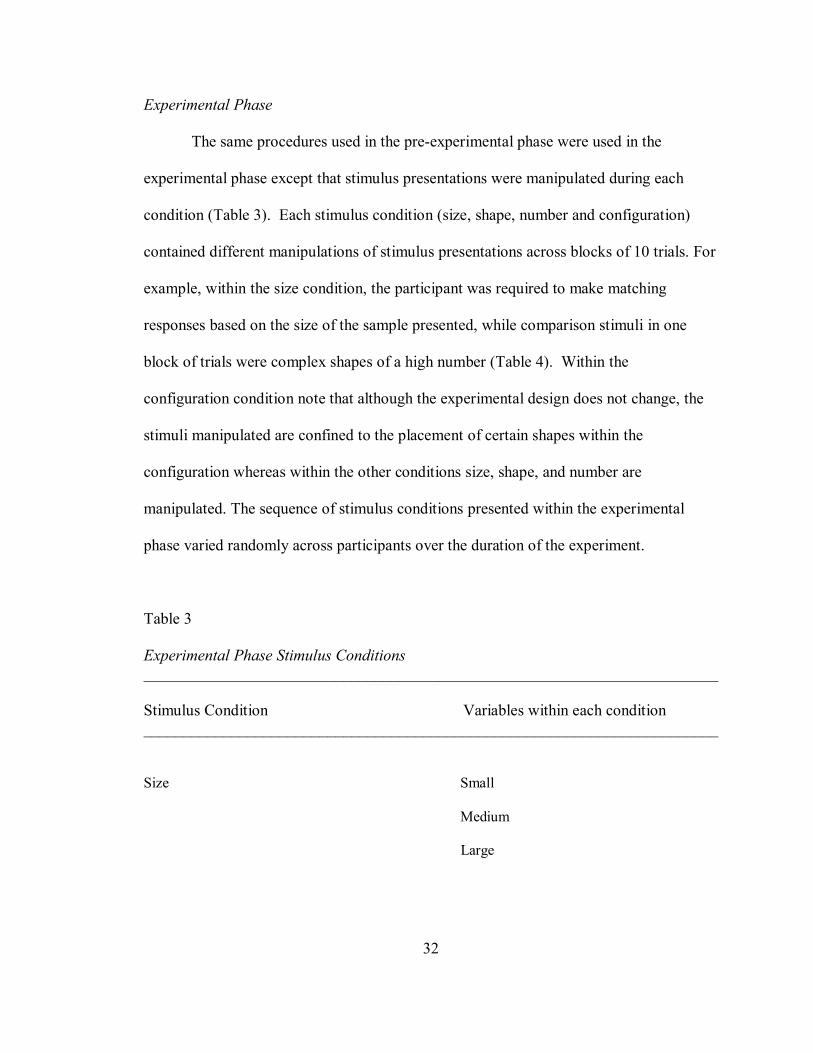
Experimental Phase
The same procedures used in the pre-experimental phase were used in the
experimental phase except that stimulus presentations were manipulated during each
condition (Table 3). Each stimulus condition (size, shape, number and configuration)
contained different manipulations of stimulus presentations across blocks of 10 trials. For
example, within the size condition, the participant was required to make matching
responses based on the size of the sample presented, while comparison stimuli in one
block of trials were complex shapes of a high number (Table 4). Within the
configuration condition note that although the experimental design does not change, the
stimuli manipulated are confined to the placement of certain shapes within the
configuration whereas within the other conditions size, shape, and number are
manipulated. The sequence of stimulus conditions presented within the experimental
phase varied randomly across participants over the duration of the experiment.
Table 3
Experimental Phase Stimulus Conditions ________________________________________________________________________ Stimulus Condition Variables within each condition ________________________________________________________________________ Size Small
Medium
Large
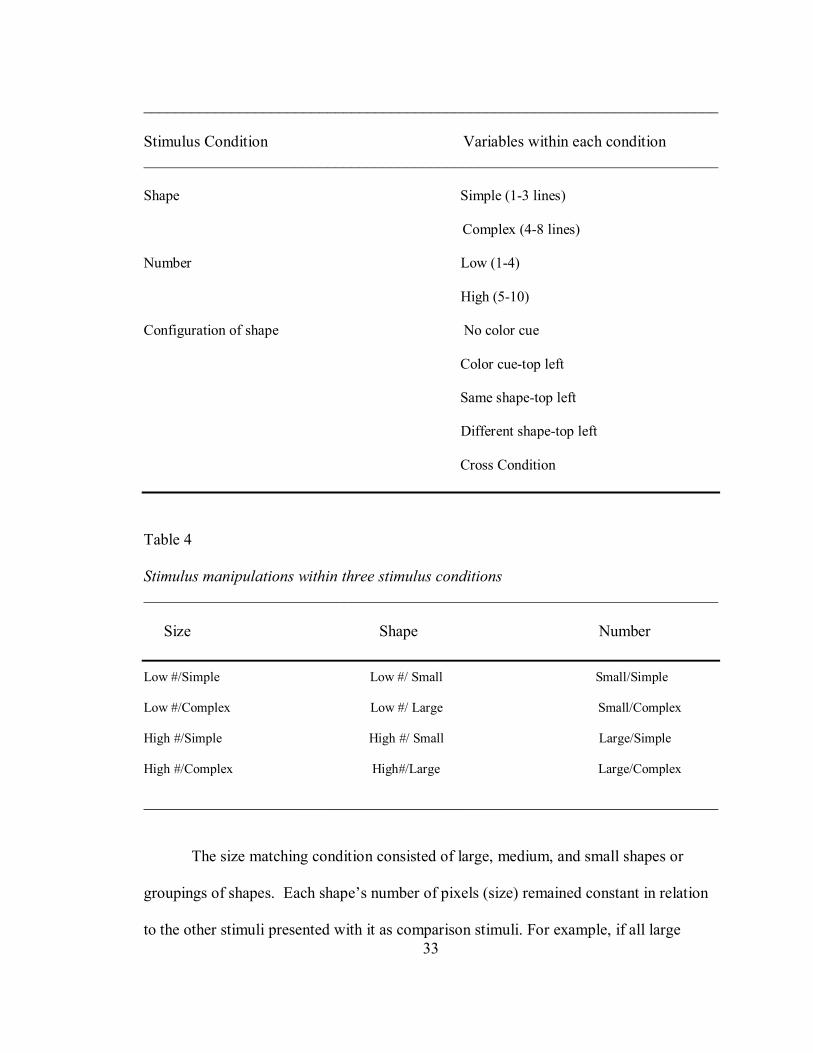
33
________________________________________________________________________ Stimulus Condition Variables within each condition ________________________________________________________________________
Shape Simple (1-3 lines)
Complex (4-8 lines)
Number Low (1-4)
High (5-10)
Configuration of shape No color cue
Color cue-top left
Same shape-top left
Different shape-top left
Cross Condition
Table 4
Stimulus manipulations within three stimulus conditions ________________________________________________________________________ Size Shape Number
________________________________________________________________________
The size matching condition consisted of large, medium, and small shapes or
groupings of shapes. Each shape’s number of pixels (size) remained constant in relation
to the other stimuli presented with it as comparison stimuli. For example, if all large
Low #/Simple
Low #/Complex
High #/Simple
High #/Complex
Low #/ Small
Low #/ Large
High #/ Small
High#/Large
Small/Simple
Small/Complex
Large/Simple
Large/Complex
34
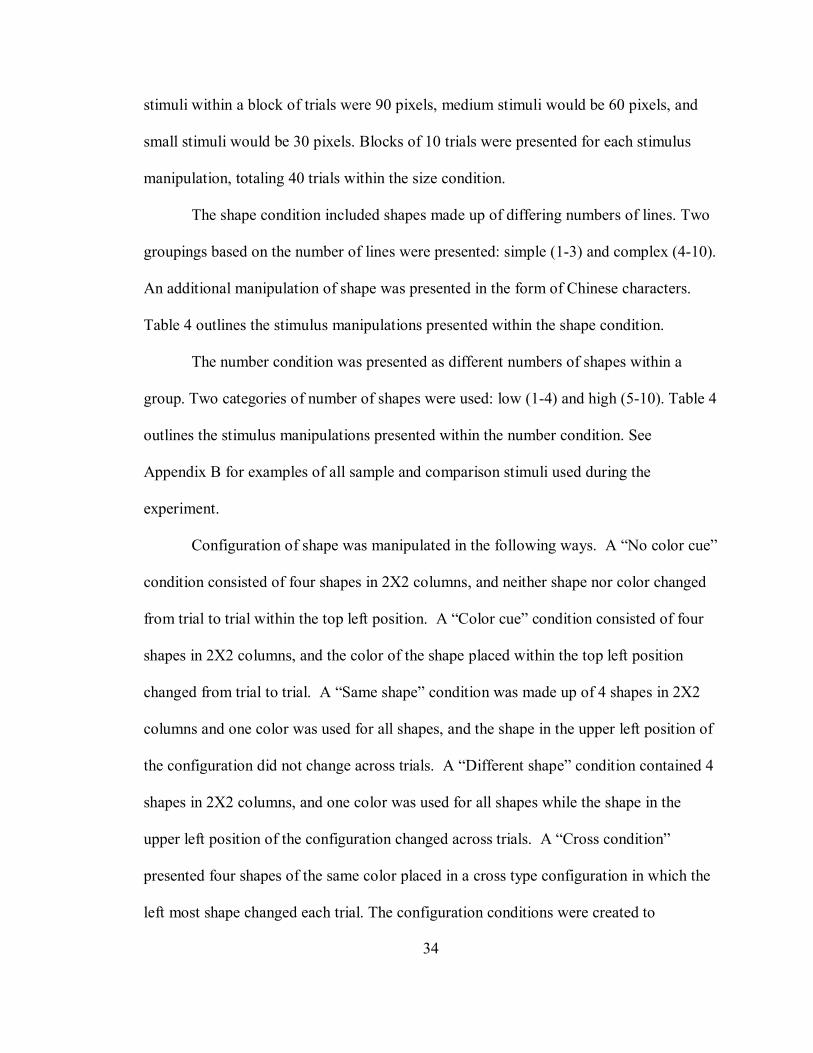
stimuli within a block of trials were 90 pixels, medium stimuli would be 60 pixels, and
small stimuli would be 30 pixels. Blocks of 10 trials were presented for each stimulus
manipulation, totaling 40 trials within the size condition.
The shape condition included shapes made up of differing numbers of lines. Two
groupings based on the number of lines were presented: simple (1-3) and complex (4-10).
An additional manipulation of shape was presented in the form of Chinese characters.
Table 4 outlines the stimulus manipulations presented within the shape condition.
The number condition was presented as different numbers of shapes within a
group. Two categories of number of shapes were used: low (1-4) and high (5-10). Table 4
outlines the stimulus manipulations presented within the number condition. See
Appendix B for examples of all sample and comparison stimuli used during the
experiment.
Configuration of shape was manipulated in the following ways. A “No color cue”
condition consisted of four shapes in 2X2 columns, and neither shape nor color changed
from trial to trial within the top left position. A “Color cue” condition consisted of four
shapes in 2X2 columns, and the color of the shape placed within the top left position
changed from trial to trial. A “Same shape” condition was made up of 4 shapes in 2X2
columns and one color was used for all shapes, and the shape in the upper left position of
the configuration did not change across trials. A “Different shape” condition contained 4
shapes in 2X2 columns, and one color was used for all shapes while the shape in the
upper left position of the configuration changed across trials. A “Cross condition”
presented four shapes of the same color placed in a cross type configuration in which the
left most shape changed each trial. The configuration conditions were created to

35
determine which parts of a complex stimulus might control the correct responding (Table
3). An example of stimuli presented in the configuration condition is shown in Figure 8.
Sample stimulus
Comparison stimuli
Figure 7. Example of stimuli presented in experimental phase in size condition with a
high number of complex stimuli.

36
Sample Stimulus
Comparison Stimuli
Figure 8. Example of stimuli presented in experimental phase configuration condition-
same shape-top left position.
Data Analysis
Data analysis focused on determining if overselective responding occurred. This
was accomplished by examining the frequency of correct responses within each stimulus
manipulation under each stimulus condition. An inference of stimulus overselectivity was
made when a participant’s matching accuracy in the experimental phase decreased to
50% accuracy or less compared to the pre-experimental phase. If correct responses
occurred within a particular stimulus condition, it was evidence that the child can respond
to all dimensions of a stimulus to make a correct match. If incorrect responses occurred
during a particular stimulus condition it was evidence that the child could not respond to

37
all dimensions of the stimulus to make a correct match, therefore responding
overselectively when particular stimulus dimensions are present. Stimuli selected instead
of the correct response were also examined to determine if a particular feature of the
stimuli was controlling responding.

38
Chapter III. RESULTS
Three subtests from the Differential Ability Scales® (DAS) were administered
to children prior to their participation in this study. These three subtests evaluated verbal,
non-verbal, and spatial skills. Each subtest reported a raw score that was transformed into
an ability score. The DAS ability score is an estimate of a child’s level of ability
measured by the subtest. Ability scores were then converted to T-scores, which are
normative scores and are defined with reference to score distributions of children of the
same age in a standardization sample. Once T-scores were obtained for each subtest, the
examiner summed the T-scores and found the corresponding GCA (Global Conceptual
Ability) score. Table 5 shows classification of Global Conceptual Ability (GCA) scores.
T-scores and GCA scores obtained from the DAS are reported in Table 6. All
participants’ scores fell in the average GCA classification or higher. The DAS scoring
manual recommends a child be further evaluated for mental retardation or developmental
delay only if GCA scores fall in the below average category or lower. Based on these
guidelines, the scores for all children participating in the present experiment were within
normal age range.
Data analysis and graphical presentation Data obtained from the training phase for each participant were obtained only as
an artifact of instructing the participant to make matching responses using the touch

39
Table 5
Classification of GCA scores ________________________________________________________________________ GCA Scores Category Percentiles
________________________________________________________________________
Table 6
Participant’s T-scores and GCA scores ________________________________________________________________________
Verbal Non-verbal Spatial GCA
T-Score T-Score T-Score ________________________________________________________________________
________________________________________________________________________
130 and above Very High 98-99
120-129 High 91-97
110-119 Above Average 75-90
90-109 Average 25-74
80-89 Below Average 9-24
70-79 Low 3-8
69 and below Very Low 1-2
Participant 0003 (age 4.6) 80 40 49 114
Participant 0004 (age 4.2 ) 46 41 41 90
Participant 0011 ( 3.11) 57 62 58 112

40
screen. Analysis of these data is not included for this reason. Data collected on the
accuracy of responding within pre-experimental and experimental phases are presented as
number of correct matching responses when particular stimulus conditions were
presented. The conditions presented included matching size, shape, number, and
configuration. Within each stimulus condition, features of the stimuli presented varied
across blocks of trials. For example, across the blocks where size matching was tested,
the stimuli varied from small to large, simple to complex, and low number to high
number.
Figures 9, 11, and 13 show the bar charts for each stimulus condition. These
illustrate the effects of two stimulus features on matching responses. To isolate further
the particular stimulus dimensions that affected matching responses, the second bar charts
shown (Figures 10,12, and 14) illustrate the effect of one stimulus feature on matching
responses. This two-part presentation of data assists in illustrating a single stimulus
dimension’s influence on responses without the influence of the dimension it was
presented with during the experiment. It is important to note that the second set of bar
charts simply re-presents the data contained in the first set of bar charts.
Size matching
The stimulus characteristics that varied when matching size were complexity of
shape and number of objects. Figure 9 shows the number of correct responses when
participants were matching the dimension of size. All participants showed fewer correct
responses when a greater number of complex stimuli were presented. Participant 0011
also showed decreased correct responses when a fewer number of complex shapes were
presented.

41
Figure 10 further clarifies the influence of complexity of shape on matching
responses and represents the data shown in Figure 9. All participants made fewer correct
responses when shapes were complex as compared to simple suggesting that
overselective responding occurred more frequently when shapes were complex. In
summary, correct responding decreased during the size matching condition when more,
rather than less complex stimuli were presented.
Size Matching
Num
ber o
f Cor
rect
Res
pons
es
0
2
4
6
8
10Participant 0003 Participant 0004 Participant 0011
Pre-Experimental Low #/Simple Shape
Low #/Complex Shape
High #/Complex Shape
High #/ Simple Shape
Figure 9. Number of correct size matching responses for all stimulus conditions.

42
Matching Size when stimuli are complex and simple
Complex Simple
Num
ber o
f Cor
rect
Res
pons
es
0
5
10
15
20
Participant 0003 Participant 0004 Participant 0011
Figure 10. Number of correct size matching responses made when stimuli presented
were complex or simple.
Shape matching The stimulus features that varied while matching shape were size and number of
objects. Within the shape matching condition, there was no overall decrease in correct
responses observed across participants (Figure 11). However, participant 0011 showed
decreased correct responses when the stimuli presented were small in size. Figure 12
represents the data showing the influence of only small and large stimuli on shape
matching. Again, no overall decrease is noted for participants, with the exception of
participant 0011 when small stimuli were presented (Figure 12).

43
Shape Matching
Num
ber o
f cor
rect
resp
onse
s
0
2
4
6
8
10
Participant 0003 Participant 0004 Participant 0011
Pre-exp Low #/Small size
Low #/Large size
High #/Small size
High #/Large size
ChineseCharacters
Figure 11. Number of correct shape matching responses.
Matching Shape when stimuli are Small or Large
Small Large
Num
ber o
f Cor
rect
Res
pons
es
0
5
10
15
20 Participant 0003 Participant 0004 Participant 0011
Figure 12. Number of correct shape matching responses when stimuli were small or
large.

44
Number Matching
The stimulus characteristics that varied while matching number were complexity
of shape and size. Responding observed within the number matching condition showed
no overall decrease in correct responses (Figure 13). Participant 0004 however showed
decreased correct responses when stimuli were large in size. Later, ten extra trials were
presented to participant 0004 to rule out the possibility that an intervening variable was
controlling responding. The additional trials resulted in only five of ten correct responses.
As observed in shape matching results, participant 0011 showed fewer correct responses
when stimuli were small in size, while the other participants did not show a decrease
(Figure 14).
Pre-exp Small size/Complex Shape
Large size/Simple Shape
Large size/Complex Shape
Small size/Simple Shape
Matching Number of objects
Num
ber o
f Cor
rect
Res
pons
es
0
2
4
6
8
10
Participant 0003 Participant 0004 Participant 0011
Figure 13. Number of correct “number of objects” matching responses is shown.
45
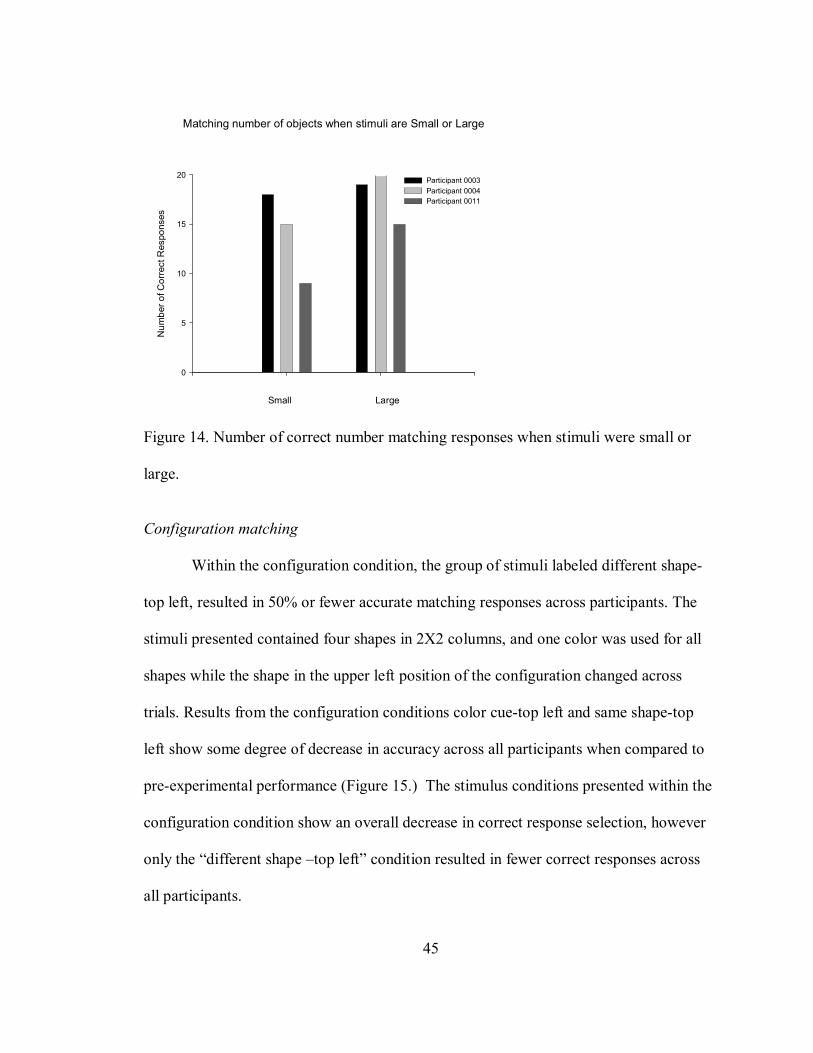
Matching number of objects when stimuli are Small or Large
Small Large
Num
ber o
f Cor
rect
Res
pons
es
0
5
10
15
20Participant 0003 Participant 0004 Participant 0011
Figure 14. Number of correct number matching responses when stimuli were small or
large.
Configuration matching
Within the configuration condition, the group of stimuli labeled different shape-
top left, resulted in 50% or fewer accurate matching responses across participants. The
stimuli presented contained four shapes in 2X2 columns, and one color was used for all
shapes while the shape in the upper left position of the configuration changed across
trials. Results from the configuration conditions color cue-top left and same shape-top
left show some degree of decrease in accuracy across all participants when compared to
pre-experimental performance (Figure 15.) The stimulus conditions presented within the
configuration condition show an overall decrease in correct response selection, however
only the “different shape –top left” condition resulted in fewer correct responses across
all participants.

46
Matching Configuration of shapes
Num
ber o
f cor
rect
resp
onse
s
0
2
4
6
8
10
Participant 0003 Participant 0004 Participant 0011
Pre-Exp No color cue
Color cue Same shape top left
Diff shape/ Top left
Cross Configuration
Figure 15. Number of correct matching responses when configuration of shape was
manipulated.
Response Location Data
Sometimes stimulus overselectivity is observed when a particular location on the
computer screen is repeatedly selected while the correct response is located in another
position on the screen. Participant 0011 demonstrated a position preference throughout
the experiment. As demonstrated in Table 8, participant 0011 had a high frequency of
responding to location seven on the touch screen when location seven was incorrect
compared to other locations on the touch screen. This table also illustrates the larger
number of errors in overall responding by participant 0011. A reduction in correct
responding during some stimulus conditions is similar to that of other participants,
however the position preference by participant 0011 must be considered.

47
Table 7
Location of incorrect responses for Participant 0011 ___________________________________________________________________ Location
1 Location
2 Location
3 Location
4 Location 5
Location 6
Location 7
Location 8
___________________________________________________________________ 12 5 0 0 9 3 26 8
___________________________________________________________________
Summary of Results
Overall, results observed in the size condition and in the configuration condition
revealed stimulus features and combinations of stimulus features that resulted in
overselective responding by these participants. Within the size condition, correct
responses for all participants decreased when a greater number of complex shapes were
presented. Within the configuration condition, although an overall decrease in correct
responding was observed suggesting difficulty in selecting correct responses, in
“Different Shape-Top Left” 50% of the responses were incorrect across participants.
Despite similar performances by participants in the size and configuration conditions, no
overselective responding was observed in the shape or number condition aside from
individual differences.

48
Chapter IV. DISCUSSION
Summary of findings
Preschoolers with no detectable developmental delays were presented with
delayed matching to sample (MTS) tasks composed of different stimulus dimensions:
size, shape, number and configuration. All three participants showed decrements in
correct responding during the size condition when there were more rather then fewer
stimuli and when stimuli were more rather than less complex in shape. This suggests that
typical preschoolers may have difficulty making size discriminations when there are
more stimuli and when these stimuli are relatively complex. In other words, multiple
features of stimuli may affect discriminated learning.
Throughout the study, incorrect responding revealed overselective responding
when multi-component stimuli were presented and decreases in correct matching
responses were noted when all components of the complex controlled responding.
Responding in the presence of small, medium and large size stimuli revealed that when a
smaller number of complex shapes were involved, overselective responding was not
observed. However, when there were more stimuli presented but they were less complex
in shape, no decrease in correct responses occurred. This suggests that the combination
of increased number of stimuli and complexity of shape resulted in overselective

49
responding. Failure to respond to changes in size when other stimuli features (e.g.,
complexity of shape and number) are present can interfere with learning.
Although the observation of overselectivity when matching size when stimuli
were of high number and complex was found for all three participants, there was some
evidence of a position preference for one participant (0011). Position preference is
observed when responses are repeatedly made to a particular location of stimulus
placement instead of to the stimulus itself. Position preferences are commonly observed
in children on the autism spectrum during teaching interventions and it has been
considered as overselective responding by some researchers (Glenn, Whaley, Ward &
Buck, 1980). It is unclear why participant 0011 exhibited position preference throughout
the experiment.
In contrast to the effects of complexity of shape together with number of stimuli
when matching size, manipulation of the complexity of shapes alone did not reveal
overselective responding. The data showed that all three participants had little difficulty
selecting the correct matching responses, whether the shapes involved three or fewer
straight lines or Chinese characters. This finding is contrary to the suggestion that
stimulus overselectivity might partly be a function of the familiarity of the stimuli
presented. At least in the case of the stimuli used in this experiment, this relationship was
not observed.
The arrangement of stimuli in presentations defined their configuration. One
configuration consisted of four shapes placed in 2X2 columns. A second configuration
also consisted of four shapes, but in a “cross” arrangement. Two participants (0004 and
0011) showed the same number or more correct responses in the cross than the 2X2
50
configurations. In other words, when potential matches included a stimulus presented in
the 2X2 configuration, they were more likely to respond incorrectly than when stimuli
were placed in the cross configuration. The 2X2 arrangement places two stimuli (shapes)
in the left-most positions, whereas the cross arrangement presents only one shape in the
left position. A possible reason for this performance is that they may have already
acquired a history of “reading” stimuli from upper left to right and then down. The cross
arrangement was presented to assess this possibility.
Also within the configuration stimulus presentations, the condition that presented
a different shape in the top left position on each trial resulted in all three participants
obtaining five or fewer correct responses. It is not completely clear why this decrease in
responding was observed, however closer examination of the responses chosen as correct
show that two participants (0003 & 0011) were not using the lower left position to
respond. Because they were not using the lower left position to make their selection,
stimuli on the right of the configuration controlled responding, suggesting that they were
scanning from top left to top right. Participant 0003 and 0011 did have pre-reading skills,
while participant 0004 did not; this may be evidence that instruction in pre-reading skills
may affect performance in other tasks, such as complex stimulus matching.
In contrast to Configuration condition--different shape-top left, within the
condition--same shape-top left, the top left shape did not change on each trial. Correct
responses were greater in the same shape-top left condition compared to the different
shape-top left condition. These conditions can be examined even further by inspection of
the stimuli chosen instead of the correct response. Within the same shape-top left
stimulus condition, stimulus configurations that retained the same two shapes on the left

51
side of the complex were chosen as correct matches, disregarding the shapes on the right
side of the complex that were different, suggesting the tendency to respond to the left
portion of the stimulus complex. This finding is somewhat surprising because it
contradicts the observations found in same shape-top left regarding using stimuli on the
right side of the stimulus complex. However, another possible reason for this observation
could be explained in the simple fact that the number of changing stimuli within the
configuration was reduced within the same shape- top left configuration. The findings
within the configuration conditions illustrate additional facets of stimulus presentations
that can affect the acquisition of discriminated performances.
Future research directions
Matching to sample procedures were employed in this investigation in part
because they are a commonly used classroom teaching technique with preschool age
children. Many learning activities in the preschool classroom involve matching objects,
letters, and numbers during daily activities. The other frequently used procedure for
examining stimulus overselectivity is discrimination training. This procedure involves
reinforcing responses to a particular stimulus or particular features of a stimulus, then
slightly altering the presentation of the stimulus and observing if the child responds
discriminately to the change. Future research using discrimination training procedures
should be conducted using the stimulus dimensions employed in this experiment. It may
further clarify if stimuli manipulated during matching to sample tasks produce the same
performance in a discrimination task. This would benefit the field by revealing that some
types of stimuli may evoke overselective responding only in the context of certain types
of tasks (e.g. MTS).

52
Specific research using the stimulus dimensions employed in this study should be
conducted. Other presentations of size matching with multiple component stimuli could
further illuminate what was observed in this study. Presenting a size-matching task when
the shapes of the stimuli are different each trial would also shed further light onto the
observations made in this study. It should be examined to determine if overselective
responding could be occurring because the shape and number of stimuli presented
remained the same in this experiment. The configuration of shape condition needs further
inquiry as to what stimuli affect responding when location of shape is altered across
trials. Also within the configuration condition, it should be tested if the number of stimuli
that changes among the comparison stimuli influences responding to all features of the
stimulus complex. This information could assist in understanding discrimination learning
in children with developmental disabilities compared to normally developing children.
Observing the exact details of how children learn to discriminate between objects and
features of objects could greatly assist in bettering the technology available to teach
children with developmental disabilities.
Examination of overselective responding in conjunction with particular skills a
child is learning, such as reading, would provide more specific information about errors
and possibly better solutions to minimize these errors. It would be helpful to determine if
the same types of errors are observed when presenting stimuli in isolation than when
presenting stimuli in a multiple component manner. Investigation into the effects of a
gradual increase of the number of stimuli until a more complex stimulus is presented may
also provide useful information to teachers.

53
The preschool children in this study showed overselectivity when particular
matching responses were required. An area of further research should look at these same
stimulus dimensions in the child’s natural learning environment. Bickel, Richmond, Bell
and Brown (1986) were able to clearly show the influence of contextual factors and
historical factors in the occurrence of overselectivity in adults. This should also be
examined in children to further determine what contextual factors may occasion
overselective responding in everyday tasks commonly presented in a preschool
classroom. One method of examining this would be to present tasks on a computer
monitor and objects from the child’s natural environment to determine if overselective
responses are more likely using a particular method of presentation.
Practical Implications
This study adds to the literature on this topic by identifying particular stimulus
dimensions to which children may exhibit overselective responding. The fact that
participants had difficulty making size discriminations when a larger number of complex
stimuli were presented offers some important suggestions for teaching children size
related concepts. It may be difficult for some children to learn such concepts in the
presence of other stimulus dimensions.
Another way of putting this is that teachers might unknowingly select stimulus
dimensions that generate overselective responding. Awareness of the different
dimensions an object contains is pertinent information for the teacher to consider. When
number of objects and the shape of the objects can affect responding when learning about
another stimulus dimension with normally developing children, it is imperative that
teachers consider the consequences of this when teaching children with autism. Lack of

54
attention to stimuli dimensions and arrangements of training stimuli could result in
overselective responding that might not otherwise be found (Glenn, Whaley, Ward &
Buck, 1980).
Much of the overselectivity literature addresses ways of modifying overselective
responding. Although teachers can use various training procedures to overcome this kind
of responding, another option is to modify training stimuli. One way to do this is to limit
the number of stimulus dimensions within a teaching arrangement. Another strategy to
consider is conducting a probe of stimulus presentations with students to isolate and
observe problematic patterns of responding to particular stimuli before creating the
training stimuli. Using a matching to sample presentation on a computer or creating
physical materials may be an easy and efficient way of conducting the probe. Assuming
that all children learn efficiently using the same teaching materials is a premature
assumption that should be avoided.
An alternative analysis may include determining which features of a stimulus
complex a child is more likely to attend to and adjusting instruction methods to maximize
teaching opportunities instead of trying to “fix” the problematic responding. If it is
commonly observed that a child tends to respond to a particular feature of an object, quite
possibly the teacher could use this to their advantage rather than considering it a barrier
to instruction. If it is presumed by the instructor that overselective responding is an
artifact of self-stimulatory behavior, such as responding to a particular color or shape of
an object, and that feature has been shown to be a reinforcer, this could possibly work to
the teacher’s advantage, rather than serving as a barrier.
55
Conceptual issues surrounding stimulus overselectivity
For those responsible for treating children with autism, stimulus overselectivity is
often viewed as a major barrier to learning and a very limiting condition. The DSM-IV-
TR specifies diagnostic criteria that include descriptions of overselectivity that must be
observed for diagnosis:
3. restricted repetitive and stereotyped patterns of behavior, interests, and
activities, as manifested by at least one of the following:
a. encompassing preoccupation with one or more stereotyped and restricted
patterns of interest that is abnormal either in intensity or focus
b. apparently inflexible adherence to specific, nonfunctional routines or rituals
c. stereotyped and repetitive motor mannerisms (e.g., hand or finger flapping or
twisting, or complex whole-body movements)
d. persistent preoccupation with parts of objects
This type of responding is generally discussed as a debilitating problem not only among
children with autism but among those with other developmental disabilities, particularly
mental retardation. However, there is accumulating evidence that it is commonly
observed in many different populations of learners with varying skill levels. In other
words, such findings suggest that it is a relatively common phenomenon.
The fact that this kind of responding can be observed among individuals with
widely varying characteristics raises questions about the fundamental nature of what is
called stimulus overselectivity or restricted stimulus control. These questions are
reflected in disagreements about the definition of stimulus overselectivity. Although
56
many researchers often site Lovaas, et al (1971) as the source of their definition of
stimulus overselectivity, different investigators operationalize the concept with varying
procedures and stimulus features. As a result, the research literature has as yet failed to
clarify the features of a distinctive phenomenon. What the literature has made
increasingly clear is that errors in bringing responding under stimulus control are easily
obtained in learners who otherwise differ in significant ways, and it does not seem to be
the case that these errors are not observed beyond a particular age since it is a
phenomenon observed throughout adulthood (Duarte & Baer, 1997).
The phrase “stimulus overselectivity” implies that the responses of a person that
exhibits it are overly controlled by a particular feature of a stimulus. This may not be the
case, however. The notion of overselectivity may inappropriately imply a particular
behavioral process that is not justified by experimental findings. It could be argued that
certain training procedures (e.g., matching to sample) tend to generate certain patterns of
errors depending on the particular nature of training stimuli. The research literature has
increasingly identified some of the features of stimuli that can influence patterns of
errors.
In a related study, Bickel, Stella, & Etzell, (1984) have suggested that stimulus
overselectivity should not be thought of as a phenomenon, as much as it should be
examined within a hierarchy of stimuli that control responding. Their analysis led them to
suggest that overselective responding can be described as “the ordering of stimulus
elements in a stimulus control hierarchy rather than limited stimulus control”. This
challenges the notion that stimulus overselectivity is “restricted stimulus control,” a
phrase that is often used interchangeably with stimulus overselectivity in the behavior

57
analysis literature. In addition, the varying viewpoints and interchangeable terms for
stimulus overselectivity throughout the literature present considerable difficulty to
applied behavior analysts and parents of children with autism when searching for
information on the topic; the variation in usage and definition often causes more
confusion than assistance.
The present findings and the study by Bickel, et al. (1984) shows that the pattern
of errors in matching to sample procedures that is sometimes termed as stimulus
overselectivity need to be reexamined. The concept of overselectivity may not be a useful
way of describing such responding. The phrase implies a particular, clinically specific
tendency that is no longer supported in the literature. There does not seem to be a distinct
phenomenon in any specific sense different from stimulus control deficits. Instead, a
more accurate way of conceptualizing overselectivity would be in light of the stimulus
control literature. More specifically, noting that particular features of training stimuli may
result in certain types of errors under certain conditions.
Considering the problematic conceptual issues mentioned above, future research
should continue to examine stimulus overselectivity as type of responding that all humans
experience under certain stimulus conditions. Based on the results observed in these
children, conceptual and definitional issues surrounding what has been referred to as
stimulus overselectivity (or restricted stimulus control) should be reconsidered. In
addition, these results could provide a foundation for examination of other behaviors
observed in both children with developmental disabilities and in normal children. This
would be valuable because to provide ethical and high quality intervention for a child
with autism, their skill levels should be compared to that of a typically developing child.

58
In summary, the dimensions of size, and configuration of shape revealed
overselective responding in normally developing children. Although the participants
scored average or above average on the DAS, the ease with which stimulus conditions
were altered to cause normal children to respond overselectively suggests that stimulus
overselectivity is not a special condition itself. The significance of stimulus conditions
outlined in this study should be considered when observing overselective responding in
treatment settings. Before a consequence-based intervention is attempted, careful
examination of the teaching stimuli should be considered. Additionally, stimulus
overselectivity should not be presented as a phenomenon that is observed only in children
with autism, but as a phenomenon that can be observed in any population given the
proper stimulus conditions. Applied implications of the findings in this study can lead to
improvements in selection of teaching techniques and stimuli used for training. This
study can serve as a guide to the applied and experimental fields of study. Consideration
of the applied and conceptual issues surrounding stimulus overselectivity warrants further
consideration in the field of autism treatment.

59
Chapter V. REFERENCES
American Psychiatric Association. (2001). Diagnostic and statistical manual of
mental disorders. (4thed.-TR) Washington D.C. Anderson, N.B., & Rincover, A. (1982). Generality of overselectivity in
developmentally disabled children. Journal of Experimental Child Psychology, 34, 217-230.
Autism Society of America. (2002, December). Retrieved December 2002, from http://
www.autism-society.org
Bailey, S. L. (1981). Stimulus overselectivity in learning disabled children. Journal of Applied Behavior Analysis, 14, 239-248. Bettelheim, B. (1967). The empty fortress: infantile autism and the birth of the self.
New York: Free Press. Bickel, W.K., Richmond, G., Bell, J. & Brown, K. (1986). A microanalysis of the controlling stimulus-response relations engendered during the assessment of
stimulus overselectivity. The Psychological Record, 36, 225-238. Bickel, W.K., Stella, M.E., & Etzel, B.C. (1984). Reevaluation of Stimulus
Overselectivity. Journal of Autism and Developmental Disabilities, 14, 137- 157.
Burke, J. C. (1991). Some developmental implications of a disturbance in

60
responding to complex environmental stimuli. American Journal of Mental Retardation, 96, 37-52.
D’Amato, M.R. & Salmon, D.P. (1984). Cognitive processes in cebus monkeys. In H.L. Roitblat, T.G. Bever, & H.S. Terrace (Eds.), Animal cognition. (pp. 149-
168). Hillsdale, NJ: Erlbaum. Duarte & Baer. (1997). Overselectivity in the naming of suddenly and gradually
constructed faces. In D.M Baer & E.M. Pinkston (Eds.) Environment and behavior (pp. 210-218). Boulder, Colo: Westview Press.
Dube, W.V. & McIlvane, W.J. (1997). Reinforcer frequency and restricted stimulus
control. Journal of the Experimental Analysis of Behavior, 668, 303-316.
Eimas, P.D. (1969). Multiple cue discrimination learning in children. Psychological
Record, 19, 417-424. Elliot, C.D. (1983). Differential Ability Scales. The Psychological Corporation: USA. Fellows, B.J. (1968). The discrimination process and development. London:
Pergamon Press. Glenn, S, Haley, D, Ward, R & Buck, R. (1980). Obtaining color discriminations in
developmentally disabled children by disrupting response stereotyping. Behavior
Research of Severe Developmental Disabilities, 1, 175-189. Goldfarb, W. (1964). An investigation of childhood schizophrenia. Archives of
General Psychiatry, 11, 620-634.

61
Gray, V. A. (1976). Stimulus control of differential-reinforcement-of-low-rate
responding. Journal of the Experimental Analysis of Behavior, 25, 199-207.
Graziano, A. (2002). Developmental disabilities. Boston, MA: Allyn & Bacon. Hagerman, B. (2002). The National Fragile X foundation. Retrieved December 2002
from http://www.fragilex.org Hale, G.A. & Morgan, J.S. (1973). Developmental trends in children’s component
selection. Journal of Experimental Child Psychology, 15, 302-314. Huguenin, N. H. & Touchette, P.E. (1980). Visual attention in retarded adults:
combining stimuli which control incompatible behavior. Journal of the Experimental Analysis of Behavior, 33, 77-86.
Kanner, L. (1943). Autistic disturbances of affective contact. Nervous Child, 2, 217-
250.
Koegel, R. and Wilhelm, H. (1973). Selective responding to the components of
multiple visual cues by autistic children. Journal of Experimental Child Psychology, 15, 442-453.
Koegel, R. & Schreibman, L. (1977). Teaching autistic children to respond to
simultaneous multiple cues. Journal of Experimental Child Psychology, 24, 299-311.
Kovattana, P.M. & Kraemer, H.C. (1974). Response to multiple visual cues of color,
size, and form by autistic children. Journal of Autism and Childhood Schizophrenia, 4, 251- 261.
Litrownik, A.J., McInnis, E.T., Wetzel-Pritchard, A.M. & Filipelli, D.L. (1978).
Restricted stimulus control and inferred attentional deficits in autistic and

62
retarded children. Journal of Abnormal Psychology, 87, 554-562.
Lovaas, O.I., & Schreibman, L. (1971). Stimulus overselectivity of autistic children in a two stimulus situation. Behaviour Research & Therapy, 9, 305-310. Lovaas, O.I., Schreibman L., Koegel, R. & Rehm, R. (1971). Selective responding
by autistic children to multiple sensory input. Journal of Abnormal Psychology, 77, 211-222.
Lovaas, O.I., Koegel, R.L. & Schreibman, L. (1979). Stimulus overselectivity in
autism: a review of research. Psychological Bulletin, 6, 1236-1254. Meisel, C.J. (1981). Stimulus overselectivity by mentally retarded adolescents: effects
of pretraining on cue identification. American Journal of Mental Deficiency, 3, 317-322.
National Institute of Child Health and Human Development (NICHD). Retrieved
December 2002) from http://www.nichd.nih.gov Piven, J., Arndt, S., Bailey, J, Havercamp, S., Andreasen, N.C., & Palmer, P. (1995)
An MRI study of brain size in autism. American Journal of Psychiatry, 152, 1145-1149.
Reynolds, H.S. Newsome, C.T. & Lovaas, O. I. (1974). Auditory overselectivity in
autistic children. Journal of Abnormal Child Psychology, 2, 253-263. Riley, D.A. (1984). Do pigeons decompose stimuli compounds? In H.L. Roitblat,
T.G. Bever, & H.S. Terrace (Eds.), Animal cognition. (pp. 333-350). Hillsdale, NJ: Erlbaum.
Riley, D.A. & Roitblat, H.L. (1978). Selective attention and related cognitive
63
processes in pigeons. In H. Hulse, H. Fowler, & W.K. Honig (Eds.), Cognitive processes in animal behavior. (pp.249-276). Hillsdale, NJ: Erlbaum.
Rincover, A., Feldman, M., & Eason, L. (1986). Tunnel Vision: A possible keystone
stimulus control deficit in autistic children. Analysis and Intervention in Developmental Disabilities, 6, 283-304.
Rincover, A. & Ducharme J. (1987). Variables influencing stimulus overselectivity
and "tunnel vision" in developmentally delayed children. American Journal of Mental Deficiency, 91, 422-430.
Ross, A.O. (1976). Psychological aspects of learning disabilities and reading
disorders. New York: McGraw-Hill. Schreibman L (1997). The study of stimulus control in autism. In D.M Baer & E.M.
Pinkston (Eds.) Environment and behavior (pp. 203-209). Boulder, Colorado: Westview Press.
Schover, L.R. & Newsome, C.D. (1976). Overselectivity, developmental level, and
overtraining in autistic and normal children. Journal of Abnormal Child Psychology, 4, 289-298.
Sidman, M. (1979). Remarks. Behaviorism, 7, 123-126. Stromer, R., McIlvane, W.J., Dube, W.V., and Mackay, H.A. (1993). Assessing
control by elements of complex stimuli in delayed matching to sample. Journal of the Experimental Analysis of Behavior, 59, 83-102.
Varni, J. W., Lovaas, O. I., Koegel, R.L. & Everett, N.L. (1979). An analysis of
observational learning in autistic children and normal children. Journal of Abnormal Child Psychology, 7, 31-43.
64
Wilham, H & Lovaas, I.O. (1976). Stimulus overselectivity: A common feature in
autism and mental retardation. American Journal of Mental Deficiency, 81, 26-31.
Wing, V. (1996). Autism spectrum disorders. British Medical Journal, 312, 327-328.

65
VI. APPENDICES

66
APPENDIX A

67
Verbal Assent to participate in
Stimulus Variables Influencing Stimulus Overselectivity
In Normal Children
Researcher: Kim H. Smith
“Would you like to come with me and play a computer game for a few minutes?” If the child responds “Yes”, then the researcher will escort the child to the computer room. Before beginning the game ask: “You can stop playing the game anytime you want to. You just need to tell me, okay?” “Do you have any questions before we begin?” If the child states that “No, I do not want to play” or if he or she states that they do not want to continue at any point, then the researcher will ask the child to participate on a different day. If the child “No” or “I’m not sure” the researcher will also ask the child to participate on a different day.
68
Parent Sign-Up List for
VARIABLES INFLUENCING STIMULUS OVERSELECTIVITY
IN NORMAL CHILDREN
**Please put your child’s name and your name**
1. _________________________________________________________________ 2. _________________________________________________________________ 3. _________________________________________________________________ 4. _________________________________________________________________ 5. _________________________________________________________________ 6. _________________________________________________________________ 7. _________________________________________________________________ 8. _________________________________________________________________ 9. _________________________________________________________________ 10. _________________________________________________________________ 11. _________________________________________________________________ 12. _________________________________________________________________ 13. _________________________________________________________________ 14. _________________________________________________________________ 15. _________________________________________________________________ 16. _________________________________________________________________ 17. _________________________________________________________________ 18. _________________________________________________________________ 19. _________________________________________________________________ 20. _________________________________________________________________ 21. _________________________________________________________________ 22. _________________________________________________________________ 23. _________________________________________________________________ 24. _________________________________________________________________ 25. _________________________________________________________________ 26. _________________________________________________________________ 27. _________________________________________________________________ 28. _________________________________________________________________ 29. _________________________________________________________________ 30. _________________________________________________________________ 31. _________________________________________________________________ 32. _________________________________________________________________ 33. _________________________________________________________________ 34. _________________________________________________________________ 35. _________________________________________________________________ 36. _________________________________________________________________
69
Scripts
(to be used during data collection sessions)
Begin Session: “You sit here in front of the computer. I’m going to start the game now. If at anytime you need to take a break or quit playing just tell me.” Prompting during training Phase 1 session: “Touch the screen (or picture) that matches. Opportunity for breaks within the session: Would you like to take a break and play with a toy? Opportunity to complete another block of trials after a break: Would you like to play the game again? End of the Session: Thank you so much for playing the game. Which sticker would like?

70
APPENDIX B

71
Table 1 Summary of studies examining stimulus overselectivity ________________________________________________________________________ Author and Date Population Stimulus arrangements ________________________________________________________________________ Eimas
(1969)
Normal
children
Color-form patterns with 2-4 cues (color,
form, size and border
Lovaas, Schreibman,
et. Al. (1971)
Autistic,
mentally
retarded, and
normal children
Simultaneous presentation of auditory, visual
and tactile
Lovaas, Schreibman
(1971)
Autistic
children
Two stimulus presentation- visual/auditory
Koegel & Wilhelm
(1973)
Autistic and
normal children
Stimulus cards with 2 objects on each card
Wilhelm & Lovaas
(1976)
Older mentally
retarded
children and
normal children
Stimulus cards with 3 objects on each card
Schover & Newsome
(1976)
Autistic and
normal children
Single colored shapes on white index cards
Koegel &
Schreibman (1977)
Autistic
children
Simultaneous cues (visual & auditory)
presented but no cues were redundant

72
Litrownik et al
(1978)
Autistic, Downs
syndrome and
normal children
Combinations of two attributes across four
dimensions (color, shapes, size, number of
items)
Anderson & Rincover
(1982).
Autistic and
normal children
Dots on cards form shape of different sizes
Bickel, et al
(1984)
Normal children Auditory stimuli- continuous and discrete
sounds
Bickel, Richmond, et
al (1986)
Mentally
retarded adults
Pairs of shapes presented; one shape per
index card
Rincover, Feldman,
Eason (1986)
Autistic and
normal children
Stimuli on index cards with numbers located
small, medium and large distances away
from center shape
Rincover &
Ducharme
(1987)
Autistic and
normal children
Shapes on cards- within stimulus
features (red triangle) and extra stimulus
features (red strip across top of card and
white shape.
Stromer, et al
(1993)
Mentally
retarded adults
Computer touch screen; sample stimulus
appeared in center, then four objects
appeared in corner’s of screen
Duarte & Baer (1997) Normal children
and adults
Face recognition on white cards with black
background
________________________________________________________________________

73
Sample
Comparison
Figure 1. Size condition when stimuli were of low number and simple.
Sample
Comparison
Figure 2. Size condition when stimuli were of low number and complex.
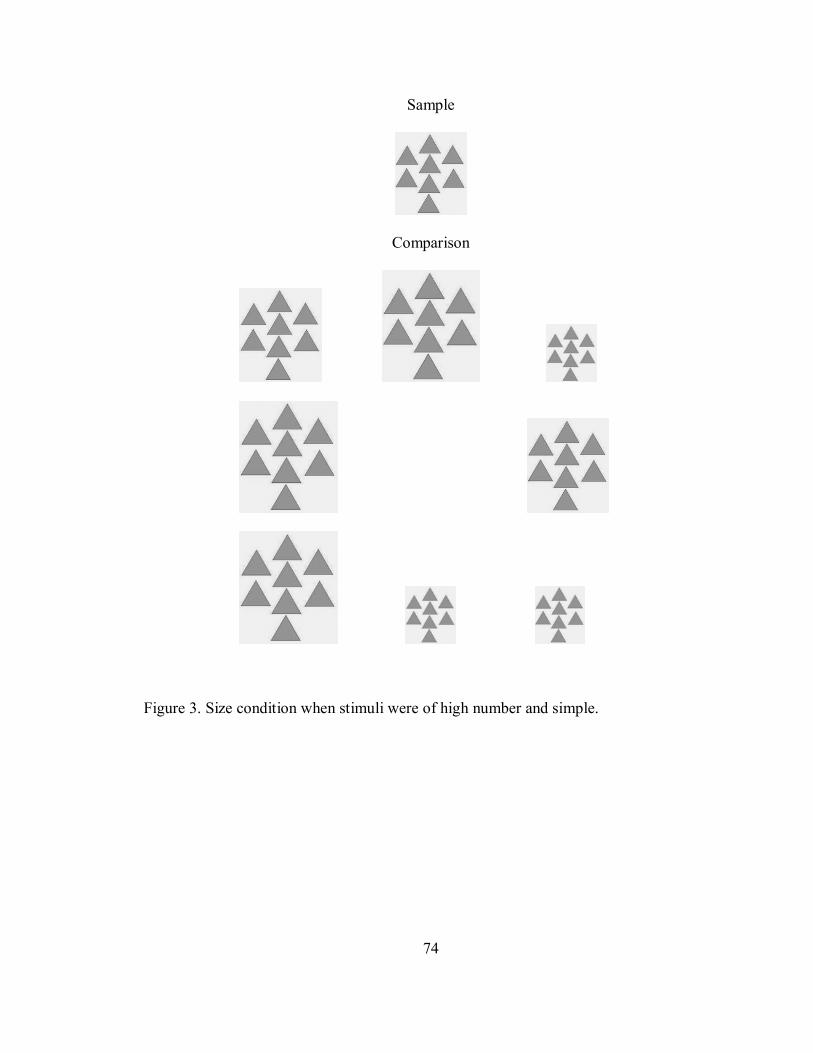
74
Sample
Comparison
Figure 3. Size condition when stimuli were of high number and simple.

75
Sample
Comparison
Figure 4. Shape condition when stimuli were of low number and small (or large) size.
Sample
Comparison
Figure 5. Shape condition when stimuli were of high number and small size (or large).

76
Sample
Comparison
Figure 6. Shape condition when stimuli were Chinese Characters.
Sample
Comparison
Figure 7. Number condition when stimuli were small (or large) and simple.
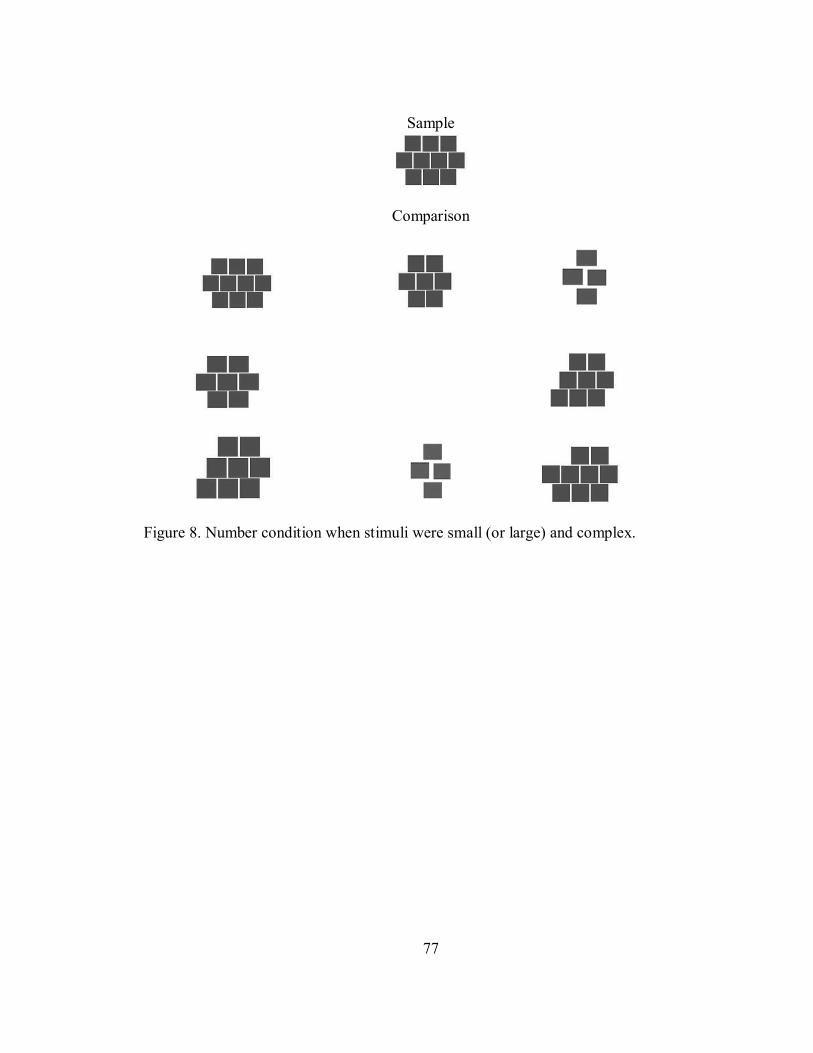
77
Sample
Comparison
Figure 8. Number condition when stimuli were small (or large) and complex.

78
Sample
Comparison
Figure 9- Configuration condition- no color cue. (Color nor shape of top left position differed)
Sample
Comparison
Figure 10- Configuration condition- color cue (Color and shape in top left position differed)
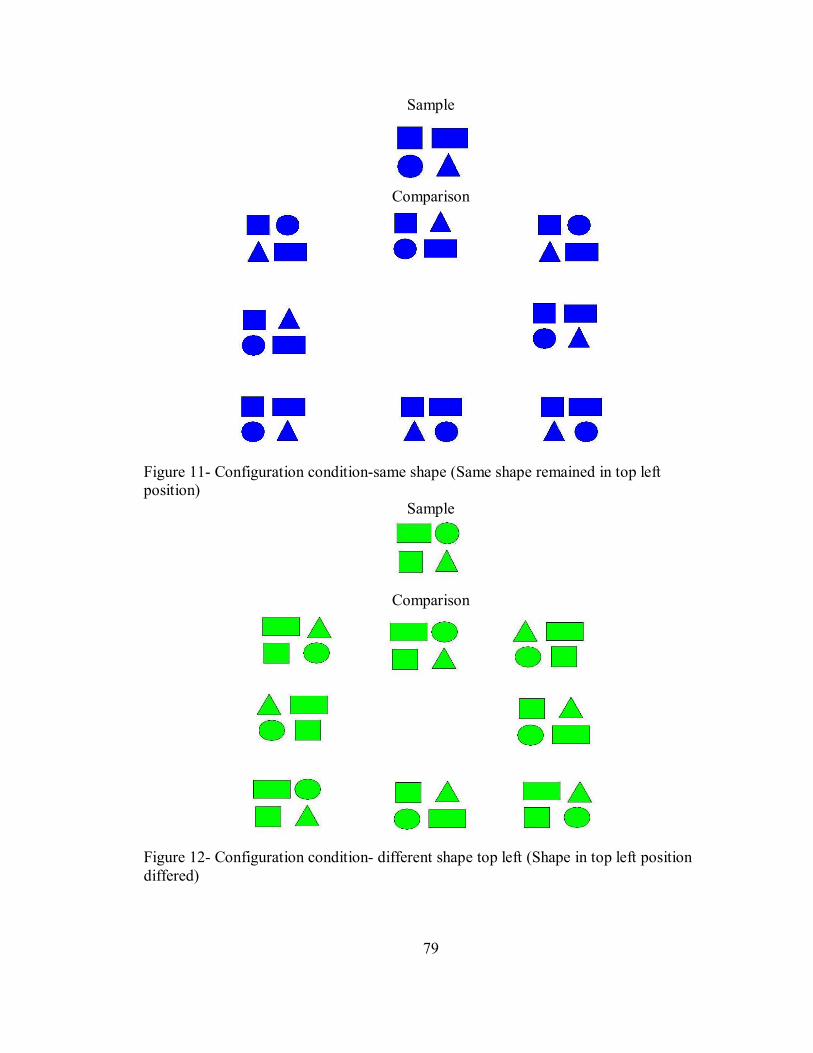
79
Sample
Comparison
Figure 11- Configuration condition-same shape (Same shape remained in top left position)
Sample
Comparison
Figure 12- Configuration condition- different shape top left (Shape in top left position differed)

80
Sample
Comparison
Figure 13-Configuration condition- Cross formation