variables and scale measurement (revisited) · 2/1/2013 · variables and scale measurement...
TRANSCRIPT
Variables and Scale Measurement (Revisited)
Lulu Eva Rakhmilla, dr., M.KMEpidemiology and Biostatistics
2013

Selecting research area
Formulating research questions
/ hypotheses
Selecting a research strategy
Collecting data
Analysing the data
Report writing
The Research Process

Hypothesis Testing
How are variables meaningful?
Variables
Data Presentation
Research Problems
Sample Size

Quantitative Research Problems
• Variables– A variable is a label of name that represents a
concept or characteristic that varies (e.g., gender, weight, achievement, attitudes toward inclusion, etc.)
– Conceptual and operational definitions of variables
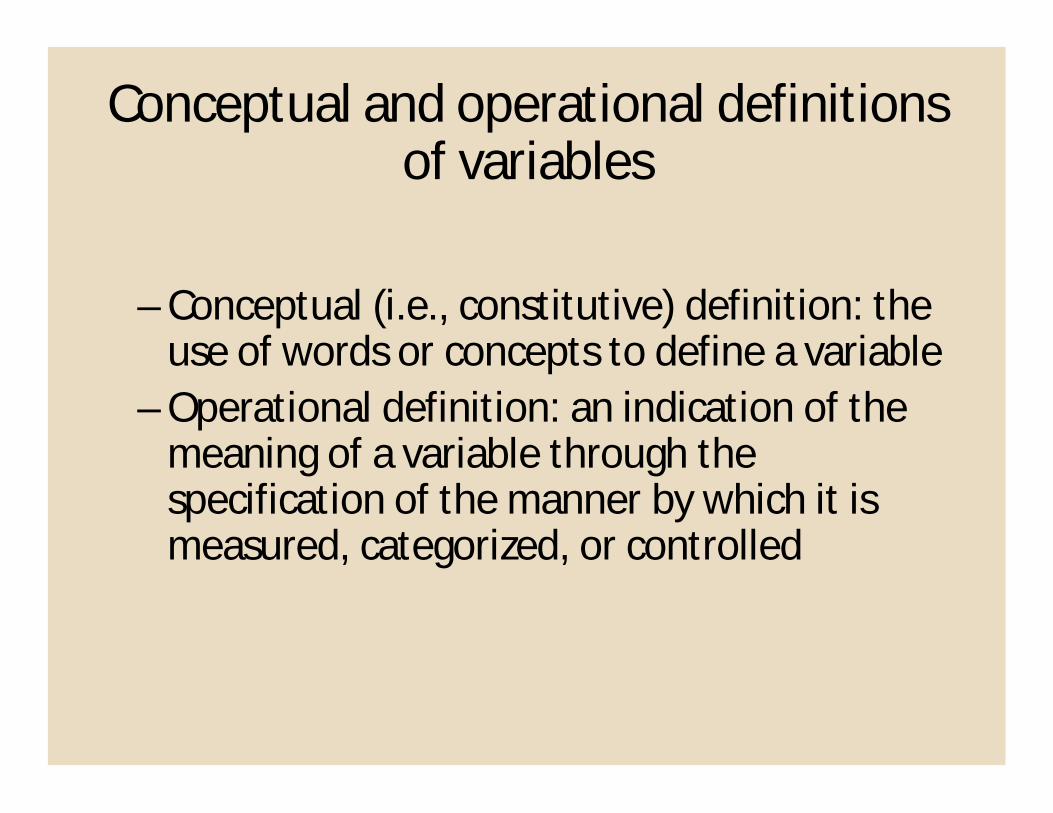
Conceptual and operational definitions of variables
– Conceptual (i.e., constitutive) definition: the use of words or concepts to define a variable
– Operational definition: an indication of the meaning of a variable through the specification of the manner by which it is measured, categorized, or controlled

Example 1
• For each of the following hypotheses, identify theindependent and dependent variable. Then givean example of how you would operationalizeeach variable.– People who are nervous perform poorly– Reading speed decreases as word length increases– Attractive people are more influential in debates– People sleep better if they read before going to bed– Alcohol impairs judgment

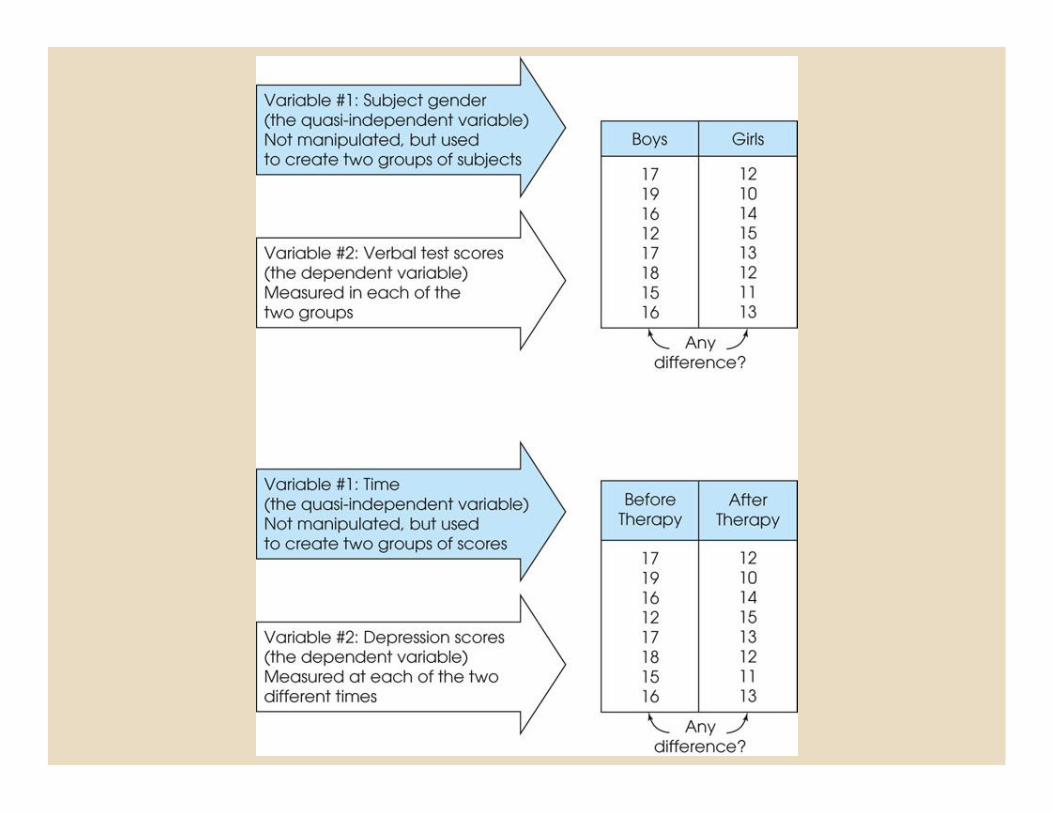
Independent and dependent (i.e., cause and effect)
– Independent variables act as the “cause” in that they precede, influence, and predict the dependent variable
– Dependent variables act as the effect in that they change as a result of being influenced by an independent variable
– Examples• The effect of two instructional approaches
(independent variable) on student achievement (dependent variable)
• The use of SAT scores (independent variable) to predict freshman grade point averages (dependent variable)
Example 2• A researcher was interested in the following hypothesis:
people are less likely to help others when they arepreoccupied. To test this prediction Dr. Batson asked studentsto rehearse a speech as they walked across campus to delivera lecture, while other students were simply asked to walkacross campus for the second part of a study. On the route tothe other building a man was laying on the ground in need ofhelp. Observers then recorded whether the passing studentstopped to assist the fallen man.
– What is the conceptual independent variable?– What is the conceptual dependent variable?– What is the IV operationalization?– What is the DV operationalization?

– Extraneous variables are those that affect the dependent variable but are not controlled adequately by the researcher
– Confounding variables are those that vary systematically with the independent variable and exert influence of the dependent variable
Extraneous and confounding variables
Quantitative Research Problems
• Continuous and categorical variables– Continuous variables are measured on a scale that
theoretically can take on an infinite number of values
• Test scores range from a low of 0 to a high of 100• Attitude scales that range from very negative at 0 to
very positive at 5• Students’ ages

– Categorical variables are measured and assigned to groups on the basis of specific characteristics• Examples
–Gender: male and female–Socio-economic status: low middle, and
high• The term level is used to discuss the groups or
categories–Gender has two levels - male and female–Socio-economic status has three levels -
low, middle, and high
Continuous and categorical variables

– Continuous variables can be converted to categorical variables, but categorical variables cannot be converted to continuous variables• IQ is a continuous variable, but the researcher
can choose to group students into three levels based on IQ scores - low is below a score of 84, middle is between 85 and 115, and high is above 116
• Test scores are continuous, but teachers typically assign letter grades on a ten point scale (i.e., at or below 59 is an F, 60 to 69 is a D, 70 to 79 is a C, 80-89 is a B, and 90 to 100 is an A
Hypotheses
– Hypotheses are tentative statements of the expected relationships between two or more variables• There is a significant positive relationship
between self-concept and math achievement• The class using math manipulatives will show
significantly higher levels of math achievement than the class using a traditional algorithm approach

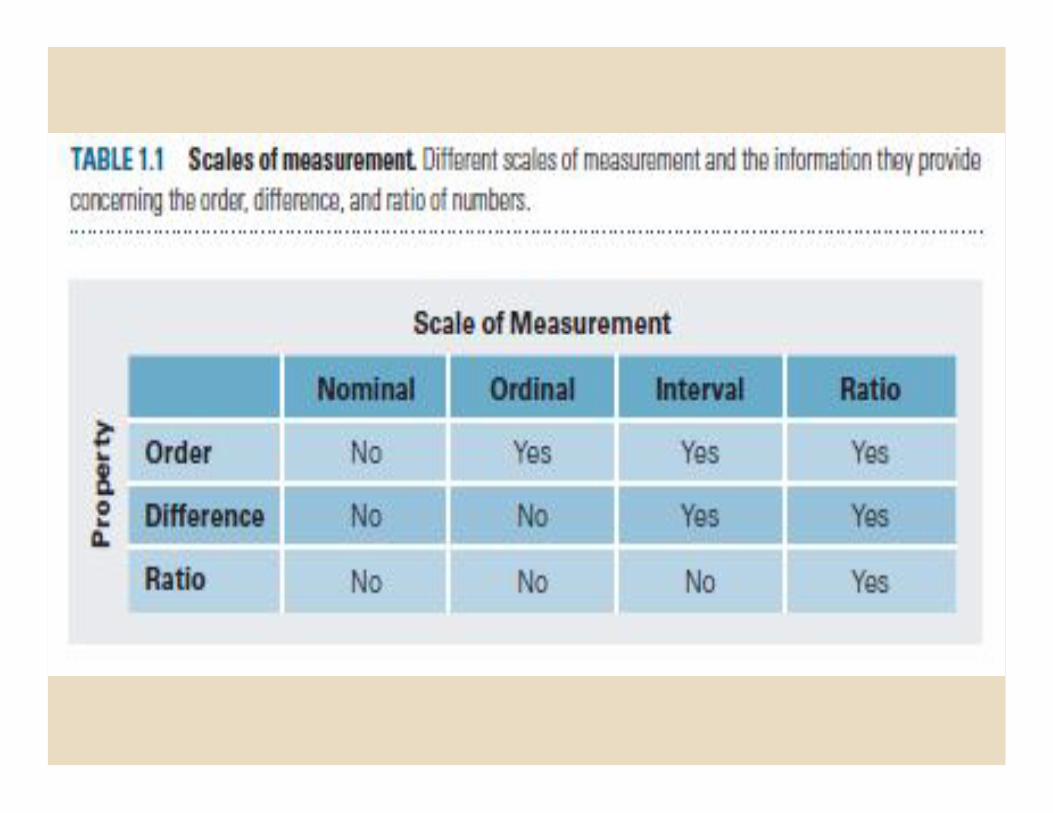
Variables can be defined into types according to the level of mathematical scaling that can be carried out on the data.
There are four types of variable:
1. Nominal 2. Ordinal
3. Interval 4. Ratio
Level of mesurement
• Nominal or categorical: variable measured using categories that cannot be rank ordered.
• No order in categories so no judgement possible about the relative size or distance from one category to another.
• What does this mean?
•No mathematical operations can be performed on the variables relative to each other.
• Nominal variables reflect qualitative differences rather than quantitative ones.
Nominal variablesNominal variables

Examples:
Nominal variablesNominal variables
What is your gender? (please tick)
Male
Female
Did you enjoy the film? (please tick)
Yes
No

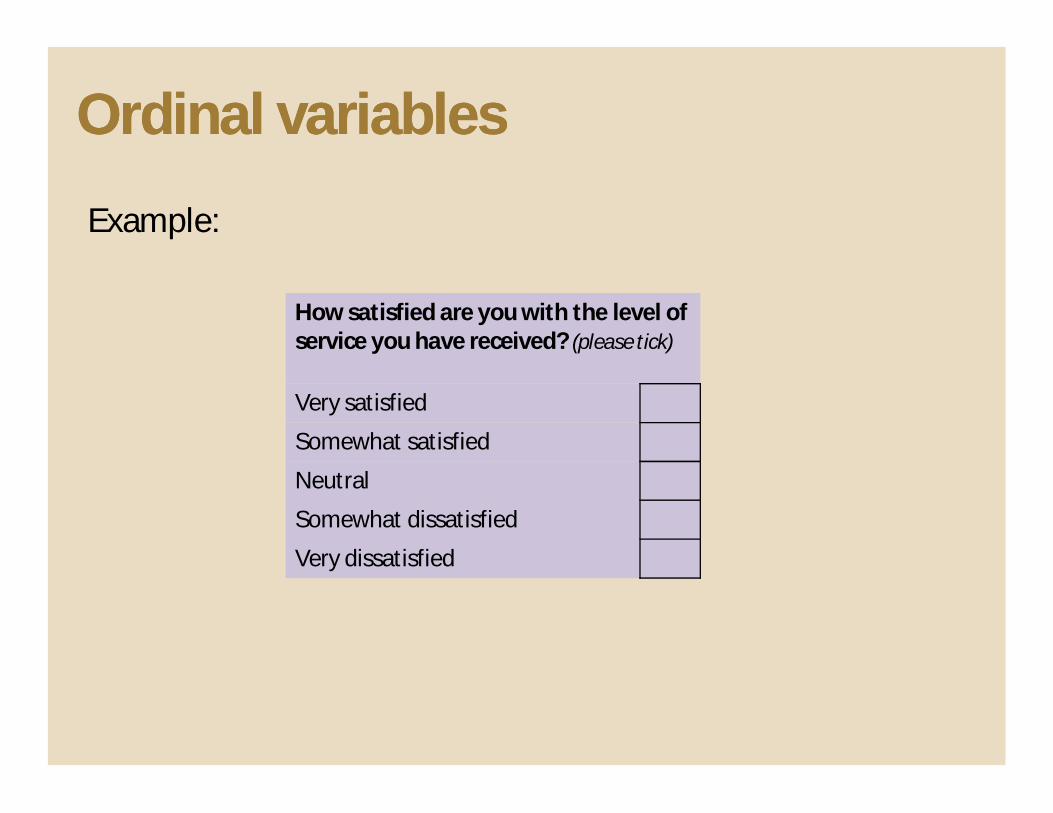
• Ordinal : variables that comprises of categories that can be rank ordered.
• Distance between each category cannot be calculated but the categories can be ranked above or below each other.
• What does this mean?
• Can make statistical judgements and perform limited maths.
Ordinal variablesOrdinal variables
Example:
Ordinal variablesOrdinal variables
How satisfied are you with the level of service you have received? (please tick)
Very satisfied
Somewhat satisfied
Neutral
Somewhat dissatisfied
Very dissatisfied

• Both interval and ratio data are examples of scale variables.
• Scale variables:
• numeric format (Rp.500, Rp.1.000, , Rp. 1.500, )
•can be measured on a continuous scale
•distance between each can be observed and as a result measured
•can be placed in rank order.
Interval and ratio Interval and ratio variablesvariables
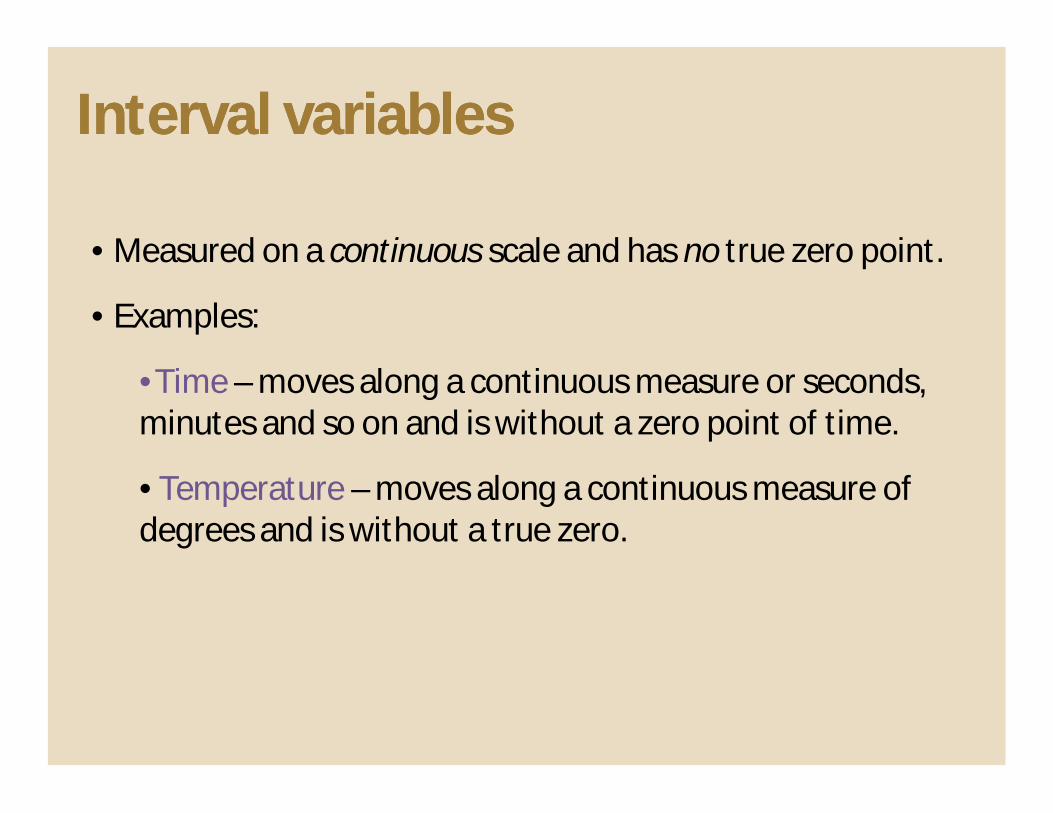
• Measured on a continuous scale and has no true zero point.
• Examples:
•Time – moves along a continuous measure or seconds, minutes and so on and is without a zero point of time.
• Temperature – moves along a continuous measure of degrees and is without a true zero.
Interval variablesInterval variables

• Measured on a continuous scale and does have a true zero point.
• Examples:
• Age
• Weight
• Height
Ratio variablesRatio variables

•These levels of measurement can be placed in hierarchical order.
Hierarchical variable orderHierarchical variable order
Ratio
Interval
Ordinal
Nominal

Characteristics of Different Levels of Scale Measurement
Type of Scale
Data Characteristics
Numerical Operation
Descriptive Statistics Examples
Nominal Classification but no order, distance, or origin
Counting Frequency in each categoryPercent in each categoryMode
Gender (1=Male, 2=Female)
Ordinal Classification and order but no distance or unique origin
Rank ordering MedianRangePercentile ranking
Academic status (1=Freshman, 2=Sophomore, 3=Junior, 4=Senior)
Interval Classification, order, and distance but no unique origin
Arithmetic operations that preserve order and magnitude
MeanStandard deviationVariance
Temperature in degreesSatisfaction on semantic differential scale
Ratio Classification, order, distance and unique origin
Arithmetic operations on actual quantities
Geometric meanCoefficient of variation
Age in yearsIncome in Saudi riyals
Note: All statistics appropriate for lower-order scales (nominal being lowest) are appropriate for higher-order scales (ratio being the highest)

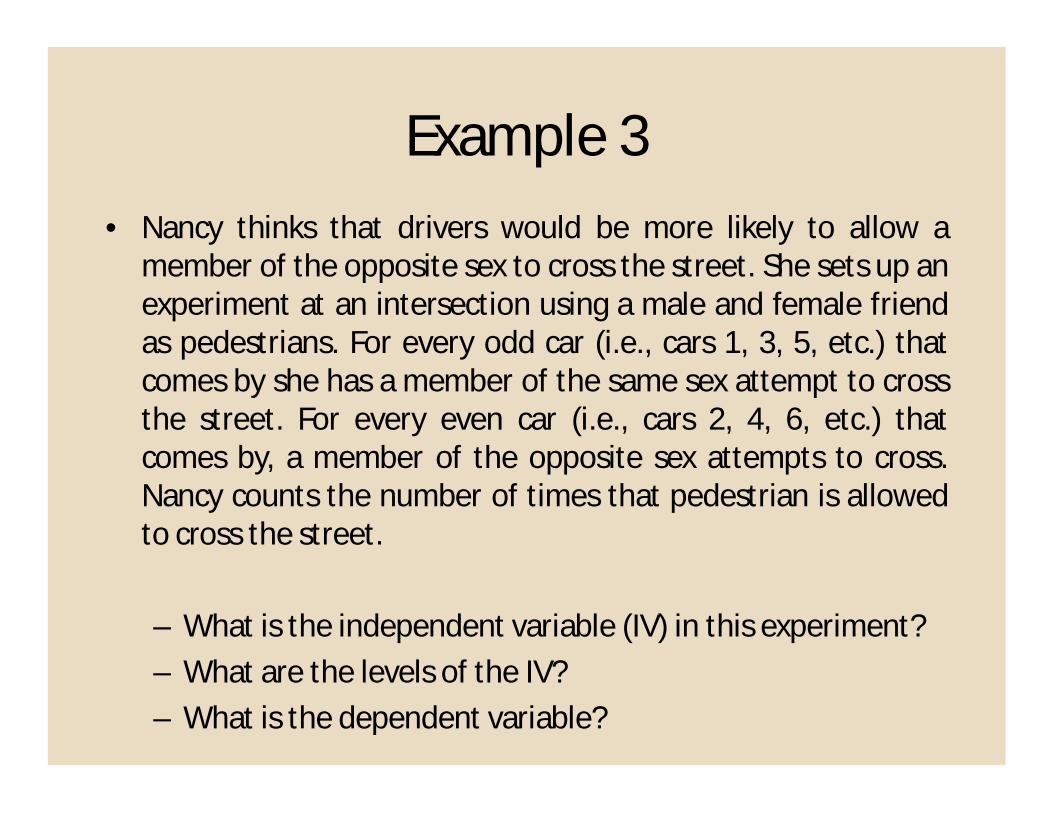
Example 3• Nancy thinks that drivers would be more likely to allow a
member of the opposite sex to cross the street. She sets up anexperiment at an intersection using a male and female friendas pedestrians. For every odd car (i.e., cars 1, 3, 5, etc.) thatcomes by she has a member of the same sex attempt to crossthe street. For every even car (i.e., cars 2, 4, 6, etc.) thatcomes by, a member of the opposite sex attempts to cross.Nancy counts the number of times that pedestrian is allowedto cross the street.
– What is the independent variable (IV) in this experiment?– What are the levels of the IV?– What is the dependent variable?

Examples 4
• Riley wants to know if it is possible for people toshow signs of alcohol intoxication even when theyhaven’t ingested any alcohol. She randomly assignsone group of subjects to drink 4 beers with alcoholwhile another group of subjects is given 4 non-alcoholic beers. Subjects are given one and a halfhours to drink the beers. A control group of subjectsis given an equivalent amount of water to drink overthe same time span. After each group has consumedtheir drinks, Riley has each subject perform a paperand pencil maze task and measures the time it takesto complete the maze.

Examples 5
• Bob is interested in whether his studentsperform better with only a mid-term and finalduring a course or with several tests giventhroughout the semester. To test this, headministers a mid-term and final to Section-1and six exams to Section-2. At the end of thesemester he compares final grades for eachsection.

Sample Size
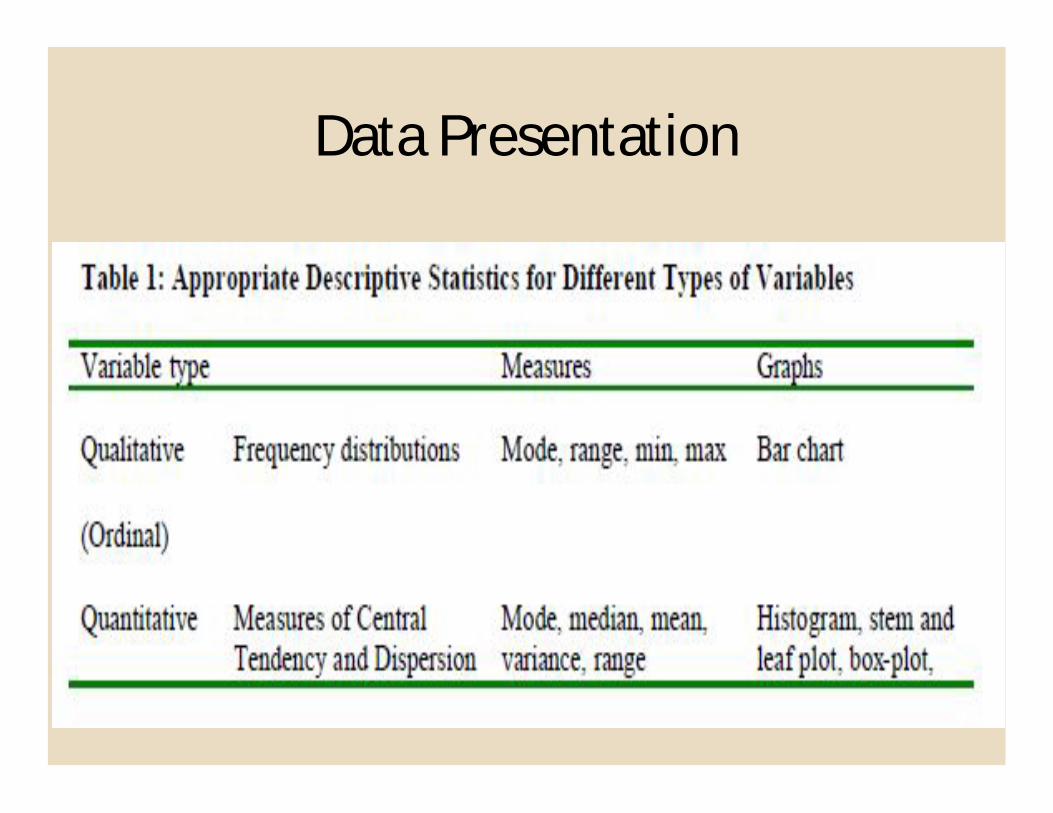
Data Presentation


How are variables measured?The investigator seeks to examine if diabetes is associated with an increased
risk of TB in an urban setting in Indonesia using unmatched case-control study.
• Are there any association between diabetes and an increasing risk of TB in an urban setting in IndonesiaResearch Problems
• Diabetes is associated with an increased risk of TB in an urban setting in Indonesia Hypothesis Testing
• Qualitative, nominal, dichotomous Sample Size
• Bar chartData Presentation

How are variables measured?The investigator wants to perform clinical trial to compare total blood
cholesterol level (mg/dl) among patients receiving new drug X and patients receiving standard therapy, using cross-over design.
• Are there any mean differences of to total blood cholesterol level new drug X compare than standard therapyResearch Problems
• New drug X had mean differences of total blood cholesterol level compared than standard therapyHypothesis Testing
• Quantitative, continuousSample Size
• Box plotsData Presentation

Let’s discuss the first journal

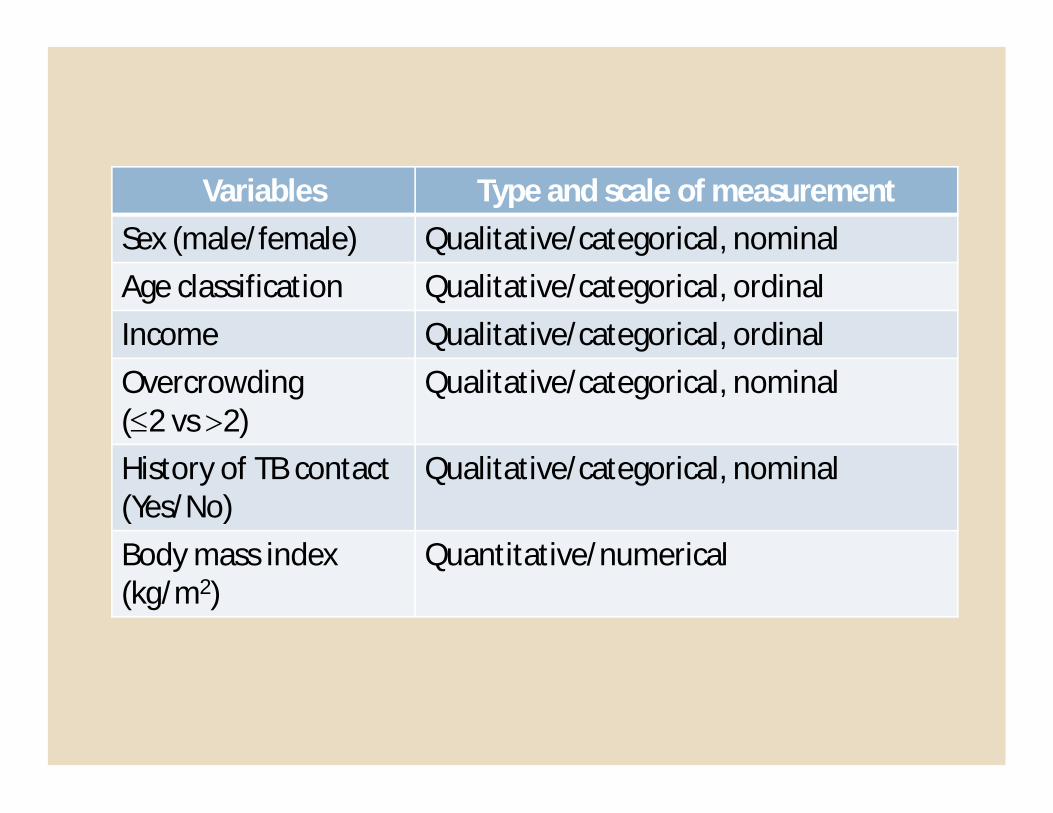
Variables Type and scale of measurementSex (male/female) Qualitative/categorical, nominalAge classification Qualitative/categorical, ordinalIncome Qualitative/categorical, ordinalOvercrowding (2 vs 2)
Qualitative/categorical, nominal
History of TB contact (Yes/No)
Qualitative/categorical, nominal
Body mass index(kg/m2)
Quantitative/numerical


Variables Type and scale of measurementFBG results-Normal-Impaired-Diabetes
Qualitative/categorical, ordinal
Glucosuria-Yes-No
Qualitative/categorical, nominal

Let’s discuss the second journal


Variables Type and scale of measurementSex (male/female) Qualitative/categorical, nominalAge (years) Quantitative/numericalHistory of TB contac (Yes/No) Qualitative/categorical, nominalPrevious treatment for TB(Yes/No)
Qualitative/categorical, nominal
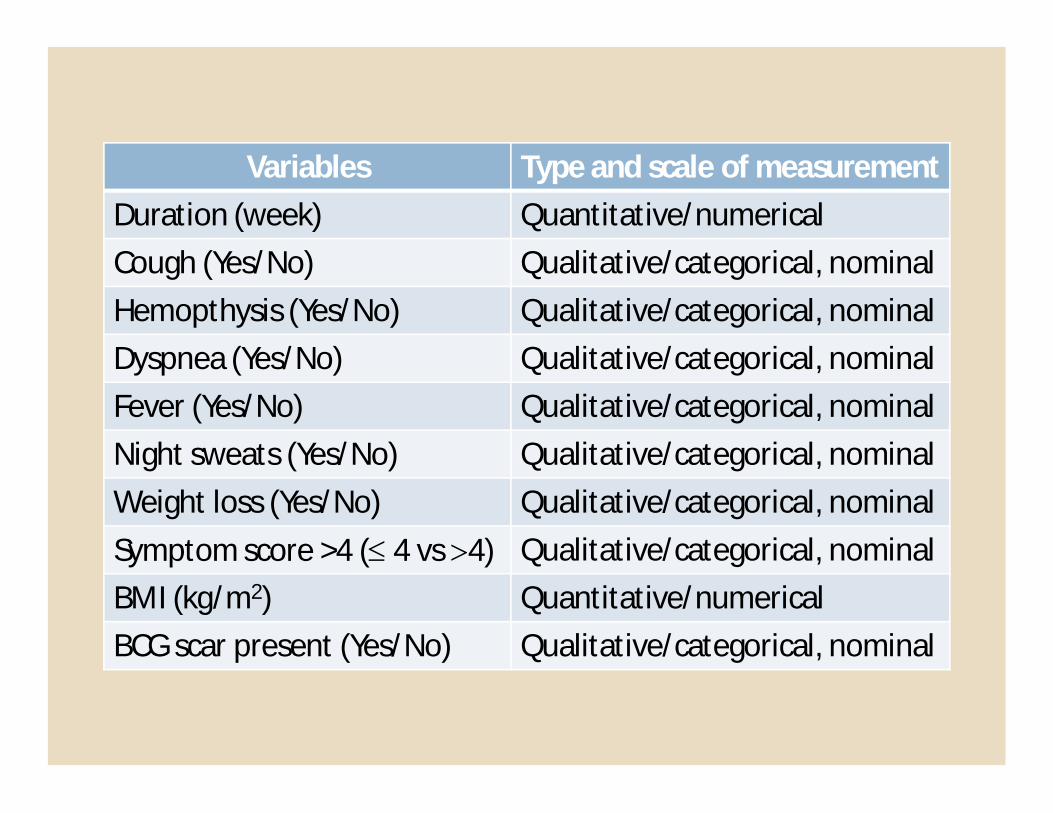
Variables Type and scale of measurementDuration (week) Quantitative/numericalCough (Yes/No) Qualitative/categorical, nominalHemopthysis (Yes/No) Qualitative/categorical, nominalDyspnea (Yes/No) Qualitative/categorical, nominalFever (Yes/No) Qualitative/categorical, nominalNight sweats (Yes/No) Qualitative/categorical, nominalWeight loss (Yes/No) Qualitative/categorical, nominalSymptom score >4 ( 4 vs 4) Qualitative/categorical, nominalBMI (kg/m2) Quantitative/numericalBCG scar present (Yes/No) Qualitative/categorical, nominal

Variables Type and scale of measurementSeverity of chest radiograph findings-Advanced (Yes/No)-Cavity present (Yes/No)
Qualitative/categorical, nominal
Sputum microscopic examination result-Positive (Yes/No)
Qualitative/categorical, nominal
Sputum culture result-Negative and/or contamination-Positive
Qualitative/categorical, nominal
INH resistant (Yes/No) Qualitative/categorical, nominalRIF resistant (Yes/No) Qualitative/categorical, nominalMDR (Yes/No) Qualitative/categorical, nominalLaboratory Test Results (all) Quantitative/numerical
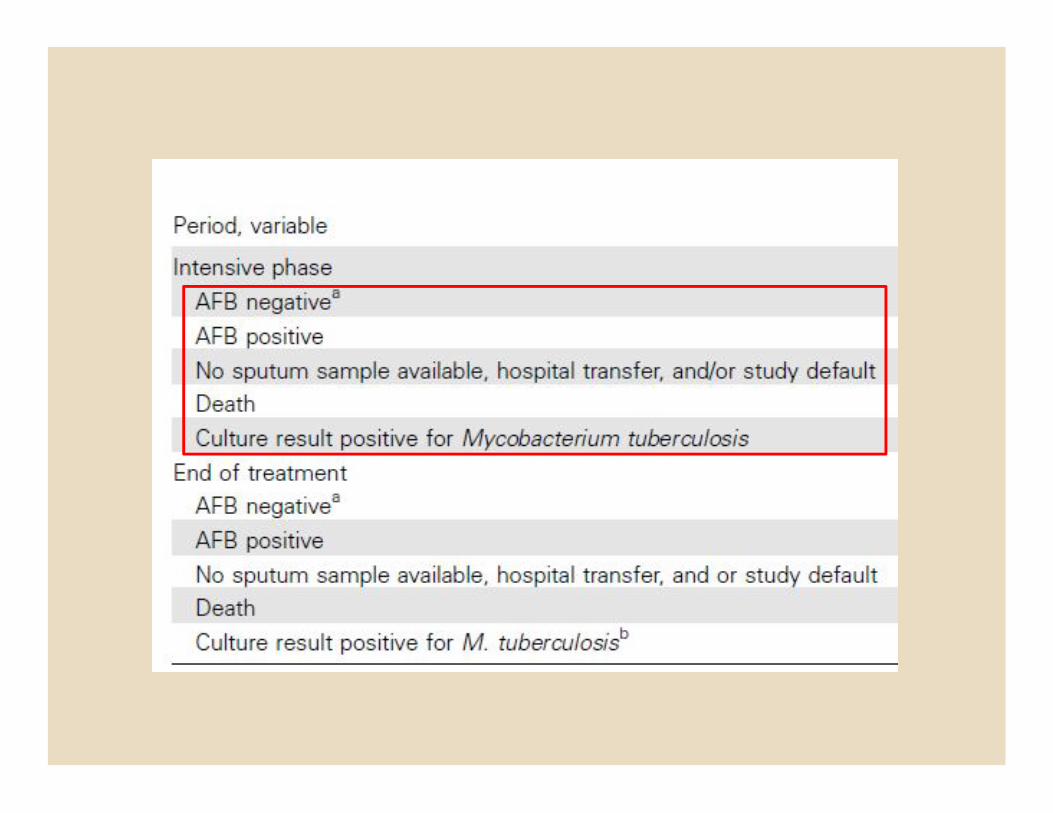

Variables Type and scale of measurementAFB negative (Yes/No) Qualitative/categorical, nominalAFB positive (Yes/No) Qualitative/categorical, nominalNo sputum available, hospital transfer, and/or study default (Yes/No)
Qualitative/categorical, nominal
Death (Yes/No) Qualitative/categorical, nominalCulture result positive (Yes/No) Qualitative/categorical, nominal
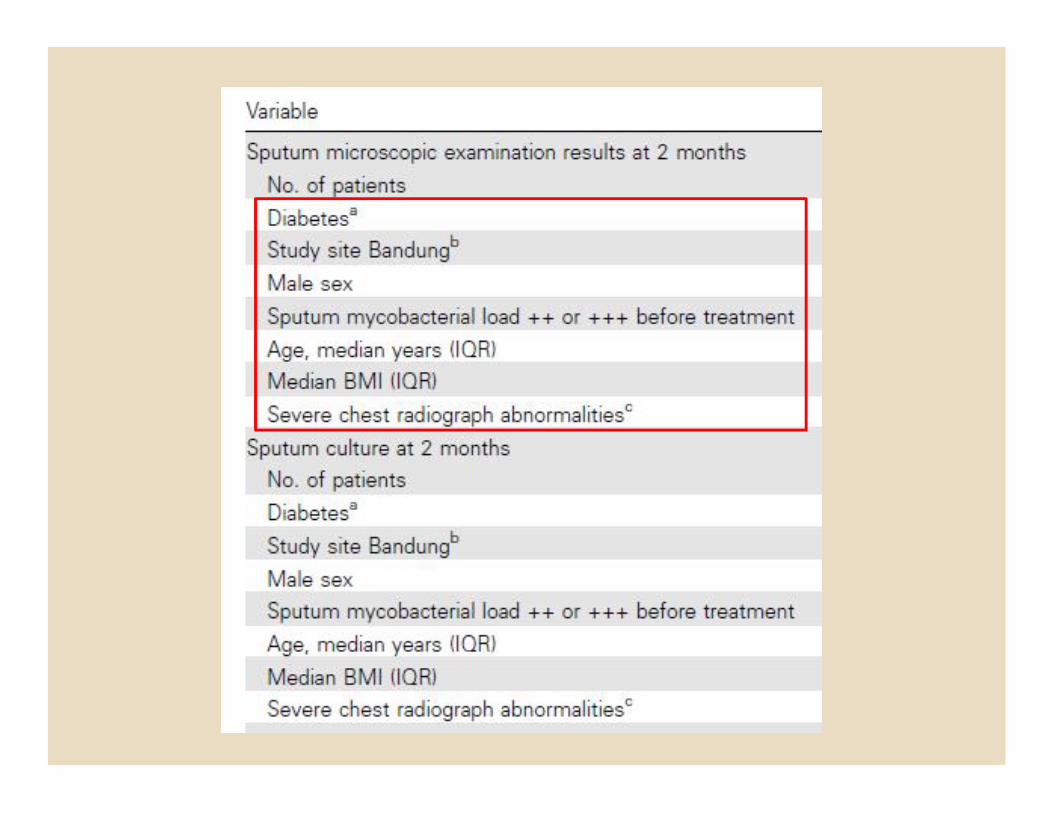

Variables Type and scale of measurementDiabetes (FBG >126 mg/dl) Qualitative/categorical, nominalStudy site Bandung (Yes/No) Qualitative/categorical, nominalSex (male/female) Qualitative/categorical, nominalAge (years) Quantitative/numericalBMI (kg/m2) Quantitative/numericalSevere chest radiograph abnormalities (mild or moderate vs severe)
Qualitative/categorical, nominal
Non-conversion at week 8 (Yes/No) Qualitative/categorical, nominal
Adjustment rate material See Modern Epidemiology, page 262; Greenland and the attachment pdf. file “standardization”
