variable flow over cooling towers - cooling tower ...spxcooling.com/pdf/tr-014.pdfcooling tower...
TRANSCRIPT

BackgroundSystems operated more simply in the past thus life was a lot easier. Controls were simple, energy was cheap and cooling towers were considered a constant-flow device. Chillers were more efficient when fully loaded, they were staged as plant loads varied. Condenser water pumps were also staged with the chillers and, since cooling towers were supposed to be operated over a relatively narrow range of flows, the number of operating cooling towers matched the number of operating chillers.
Today energy costs continue to rise and there are highly sophisticated system optimization programs. Chiller plants have had primary-secondary pumping on chilled water loops for over 30 years now and cooling tower fans have utilized VFDs (variable frequency drives) for almost 25 years. Since the 90s chillers have been operated on VFDs and, more recently, variable condenser water flow. Using system optimization programs can vary everything in the chiller plant, maximizing each piece of equipment by taking into account that component’s effect on the other components in the chiller plant.
Much effort has been expended over the past 20 plus years to reduce energy costs — great strides have been made.
Foundation for Variable FlowThis paper does not cover variable condenser water flow and carries none of the process-side limitations inherent with that approach. Variable flow over cooling towers is completely compatible with the aforementioned though and with all of the other approaches mentioned.
A cooling tower is a special type of heat exchanger — special in that it transfers not only heat but also a little bit of mass as it evaporates some of the water it circulates, providing opportunities to save energy by operating cooling towers differently. Since a cooling tower is a heat exchanger, trading surface area for fan horsepower is fundamental. The following table shows an example validating this premise.
Running the UPDATE* application and selecting a cooling tower, the application will output a list of products that are capable of rejecting the heat load defined by the flow rate and temperatures input. The output list is sorted in order of increasing first cost. In the case shown in the table a single cell NC cooling tower has been selected for a duty of 1200 gpm cooled from 95°F to 85°F at a 78°F wet bulb temperature — a nominal 400 ton cooling load.
Three NC cooling tower models are listed, model number 03, 05 and 07 represent the physical sizes of the cooling towers. The NC8403 is the smallest and contains the smallest fill volume (the fill is the media on which the heat transfer occurs). The smallest unit also has the largest motor — 40 hp. Though all three of these units have approximately the same cooling capacity increasing the physical size of the cooling towers, moving from the 03 through the 05 to the 07 sizes, fan horsepower goes down as size goes up.
It makes sense that if there is less wetted surface more air is needed to move over the surface, requiring more fan energy. Further, it is not surprising that smaller cooling towers cost less than larger cooling towers, as structure and fill volume costs more than larger motors. Since cooling towers all have essentially the same cooling capacity, the lower horsepower required by the larger units dramatically improves energy efficiency, as shown by the ASHRAE 90.1 efficiency values shown in the table.
* SPX Cooling Technologies’ product selection UPDATE™ application is
available online at spxcooling.com/update. Register to use the program and
access will be activated.
➠
Model hp Cost ASHRAE eff 50' dbA
NC8403TAN@ 40 1.00 38.7 68
NC8405QAN@ 20 1.12 75.1 66
NC8407PLN@ 15 1.49 104.1 59
Variable Flow Over Cooling Towers FOR E N E RGY SAVI NGS
thermal science

Notice that the NC8407PLN is substantially more expensive than the two smaller cooling towers, that is not entirely due to the increased physical size of the unit. Note that the model number has an L in it while the other two models have the letter A. L indicates that this model also includes the Quiet Fan option, actually the first of several sound-reduction options available in the NC product line. This particular option is not just a fan change, instead the entire drive train is optimized to reduce the sound level from the cooling tower compared to standard models. While the 8405QAN is 2 dBA quieter than the low first cost selection at 50 feet, the 8407PLN with the Quiet Fan option is 9 dBA quieter. Also notice trading surface area for fan horsepower impacts first cost and space requirements but offsets those factors with the potential for significant increases in efficiency as well as reduction in sound levels.
Cooling tower cooling capacity varies directly with fan speed
• 100% speed provides 100% performance • 75% speed provides 75% performance • 50% speed provides 50% performance
Cooling tower fan energy varies with the cube of the speed ratio
• 100% speed: 1.003 = 100.0% hp • 75% speed: 0.753 = 42.2% hp • 50% speed: 0.503 = 12.5% hp
Pump Affinity Laws work the same way.
When modulating the cooling tower fan, it is important to understand that airflow through the fan varies in direct proportion to fan speed. Thermal performance of the cooling tower also varies directly with airflow and also varies in direct proportion to the fan speed.
Running the cooling tower fan at 50% speed translates to 50% cooling tower performance. Examining fan laws it is apparent that the horsepower consumed by that fan varies with the cube of the speed ratio. Running a fan at 75% speed should provide 75% of the cooling capacity at 42% of the fan brake horsepower. At 50% fan speed, 50% cooling capacity occurs while using only 12 or 13%
of the energy. Thus half the capacity at one-eighth the horsepower provides a huge opportunity to save energy, if it is feasible to run fans slower, while still achieving the needed cooling.
Traditional Example - 3000 Ton Chiller PlantWhat if the cooling tower could be operated over reduced flow conditions, so that 75% of the flow that’s going through the three operating chillers is put over all four cooling tower cells. See Figure 1.
Do not the change chillers’ operation, chillers should still operate in their most efficient manner. Instead continually use all the available water flow (75% of design) in all four cooling tower cells. Continue to use the entire installed wetted surface so each cooling tower cell receives 75% of the designated water flow.
Running all four fans at 75% speed will produce the same cooling capacity as running three fans at full speed. Taking advantage of the fan laws ensure that the fans running at 75% speed draw only 42% of the horsepower or just under 17 bhp each for a total of 68 bhp for all fans. Note that drawing 120 bhp by running three fans at full speed is the traditional method, however, it is not as efficient.
Forty-four percent of the fan energy can be saved by circulating 75% flow over all of the cooling tower cells if proper water distribution can be achieved within the cooling towers.
Next, if the cooling towers are able to circulate 50% flow with good water distribution, running all four cooling towers when only operating two chillers and two condenser water pumps should work. Figure 2.
In this scenario running all four fans at half speed provides the same cooling with the same capacity as running two fans at full speed but because of the fan laws the total brake horsepower drops to 20, 5 hp per fan times four fans, compared to 80 hp for running two fans at full speed.
FIGURE 1 Variable flow example — 75% load. 3000 ton chiller plant
75% Fan Speed
1687 gpm
75% Fan Speed
1687 gpm
75% Fan Speed
1687 gpm
75% Fan Speed
1687 gpm
75% Fan Speed
1687 gpm
75% Fan Speed
1687 gpm
75% Fan Speed
1687 gpm
75% Fan Speed
1687 gpm
6750 gpm
6750 gpm
4-750 ton chillers and 4-cell cooling tower9000 gpm, 95°-85°-78° Select NC8411TAN4 at 40 hp/fan
Now at 75% load — 3 chillers and 4 cooling towers running
The end results: 67.6 ÷ 120 = 44% energy savings versus traditional
fan hp1 at 16.91 at 16.91 at 16.91 at 16.9 67.6 total hp

Cooling Tower Designs – How They Handle Variable FlowThere are two kinds of cooling towers, crossflow and counterflow and within these two broad categories there are various subsets. Water distribution systems in these two designs differ, as well as the manner in which the air-water contact is managed. Each design has limitations and it is important to understand what those limitations are and the distinctions between them. Since water distribution systems in these two designs are completely different, as well as the manner in which the air-water contact is managed, these two designs will be discussed separately.
Crossflow cooling towers are so named because the water flows vertically through the fill while the air flows horizontally, across the flow of the falling water. Because of this, air does not have to pass through the distribution system, permiting the use of gravity flow hot water distribution basins mounted at the top of the cooling tower above the fill. These basins are universally applied on all crossflow cooling towers.
Potentially 75% of the fan energy can be saved, if proper water distribution can be achieved within the cooling towers. As in the earlier example, trading wetted surface for fan horsepower saves energy.
What Could Go Wrong?Potential savings are available if the cooling towers would allow managed flow turndowns. Understanding why cooling towers were/are considered constant flow devices is paramount.
There are water distribution concerns, issues of predictable performance and, in cold climates, the possibility of icing in the cooling tower, especially if there is poor water distribution, which can be a major contributor to icing.
Different types of cooling towers utilize different designs to allow variations in how air and water flow are managed. These cooling tower designs may be more or less forgiving of wide variations in water flow.
FIGURE 2 Variable flow example — 50% load. 3000 ton chiller plant
50% Fan Speed
1125 gpm
50% Fan Speed
1125 gpm
50% Fan Speed
1125 gpm
50% Fan Speed
1125 gpm
50% Fan Speed
1125 gpm
50% Fan Speed
1125 gpm
50% Fan Speed
1125 gpm
50% Fan Speed
1125 gpm
50% Fan Speed
1125 gpm
50% Fan Speed
1125 gpm
50% Fan Speed
1125 gpm
50% Fan Speed
1125 gpm
4500 gpm
4500 gpm
4-750 ton chillers and 4-cell cooling tower9000 gpm, 95°-85°-78° Select NC8411TAN4 at 40 hp/fan
Now at 50% load — 2 chillers and 4 cooling towers running
The end results: 20 ÷ 80 = 75% energy savings versus traditional
fan hp1 at 51 at 51 at 51 at 5 20.0 total hp
Marley NC Crossflow Cooling Tower
➠
Marley MD Counterflow Cooling Tower

Figure 3 is a cutaway of a crossflow cooling tower showing the water distribution system with fill, the heat transfer surface, arranged directly below it. This is a Marley NC cooling tower, and the water inlet connection at the outboard edge of the cooling tower is directly above the air inlet. The inlet flume runs across the full length of the top of the air inlet, its purpose is to take that water from the inlet piping and distribute the water first along the full length of the air inlet before releasing it into the distribution basin. Water flows through a slot at the bottom of the inlet flume and travels from right to left in this figure, thus the water flow in the basin is in the same direction as the airflow through the fill below it.
Another trait common to crossflow cooling tower designs is a large number of nozzles. In a 400 ton Marley NC cooling tower, there are 260 nozzles, and they are very close together. Because the nozzles are so close to each other, lateral water flow of only a few inches is required to distribute the water uniformly over the fill, therefore NC crossflow cooling towers need only about 2½" of head above the nozzle.
In order to limit the weight of water in the basin, basins are fairly shallow. In fact, the maximum design depth on Marley cooling towers is only about 5½" which still allows some freeboard before the basin overflows. Since the water depth has to be maintained between 2½" and overflow and that depth, or head varies with the square of the flow rate, this puts a limit on the range of flow rates that a gravity flow system can manage with a given size nozzle size unless it can be modified in some way.
One modification technique is to make the basins very deep. A 3'-0" deep basin could allow much more head over the nozzles, and would allow a significant range of flows. Unfortunately, water is heavy and this would add considerable weight to the cooling tower and also increase its height, neither is desirable. There is another solution.
The difference in counterflow cooling tower design is that air flows vertically upward, counter to the flow of falling water in the fill. Because of this vertical airflow, it is not possible to use the open, gravity-flow basins typical in crossflow designs. Instead, counterflow cooling towers use pressurized, pipe-type spray systems to spray
water onto the top of the fill. Since air must be able to pass through the spray system, the pipes and nozzles must be much farther apart so as not to restrict airflow. Marley’s 400 ton NC crossflow cooling tower has 260 nozzles whereas Marley’s 400 ton MD counterflow cooling tower has around 60, arrayed over the entire plan area of the cooling tower.
Because of the much greater distance between counterflow nozzles, each has to laterally throw water further to bridge the gaps in order to distribute the hot water uniformly over the fill. This requires more pressure at the nozzle, typically in the range of 3 to 15 feet of head in addition to the static lift, which may be from 6 to10 feet. Most factory-assembled counterflow cooling towers have a greater total pump head than similar-sized crossflow cooling towers. However, with the spray system closed there is no risk of overflowing as with the open basins of crossflow cooling towers.
Nozzle PhysicsFigure 4 shows a set of crossflow nozzle curves, while Figure 5 shows the curves for counterflow nozzles. These charts demonstrate a couple of important points.
While the charts look different, because the X and Y axes are reversed, the flow rate per nozzle is on the X axis of the crossflow curve and on the Y axis of the counterflow curve.
Both nozzle curves illustrated operate on the same physics. The formula for flow through a nozzle is the head on the nozzle varies with the square of the flow. To double the flow through the nozzle head pressure has to be increased by a factor of four. To triple the flow rate the pressure has to go up by a factor of nine. To reduce the flow rate to vary the flow over the cooling tower the pressure at the nozzle decreases by the same factor.
There is a maximum and a minimum pressure required for proper operation of either type of nozzle. For crossflow nozzles — Figure 4 — those limits are represented by the two horizontal red lines on the curve. For the counterflow nozzle, Figure 5, the left and right edges of the chart on the curve represent the limits. Too little pressure and water distribution suffers, too much pressure results in other problems, all are undesirable.
FIGURE 3 Crossflow hot-water distribution basin
FIGURE 4 Crossflow nozzle chart

Water distribution systems need to be operated within the design parameters defined by the cooling tower manufacturer for each specific product. Operate the nozzle outside those design limits and problems will occur. The challenge is to find a way to vary the flow rate of the crossflow or counterflow cooling towers, while staying within the design constraints of the water distribution system.
Implementing Variable Flow in Crossflow Cooling Tower DesignsSimple modifications to some crossflow designs permit variance in the flow rate over a wide range by varying the number of nozzles that are active as a function of the flow rate.
Installing nozzle cups can effectively divide the hot water distribution basin into outboard and an inboard sections. This allows the cooling tower to manage variations in flow automatically, ensuring that adequate head over the active nozzles is maintained. Most importantly, uniform air-side pressure drop is maintained across the fill.
Nozzle cups enables the ability to:
• Maintain uniform air-water contact for maximum efficiency
• Provide consistent off-design performance
• Minimize drift
• Minimize risk of icing in freezing weather
Figure 6 is a cross-section of a crossflow cooling tower operating at full design water flow. The outboard water inlet depicted feeds hot water into the inlet flume along the outboard side of the hot water distribution basin. The slot at the bottom of the flume directs water into the hot water basin so the water flows from left to right across the basin as shown.
Circulating full design water flow-rate over the cooling tower with the variable flow modification makes the water depth high enough so that the submerged cups are functionally invisible. The cups have
no impact on water distribution to the nozzles and the entire basin is active. The fill, shown as the shaded area under the basin, also has full flow over its entire area.
Because the fill is uniformly wetted the total pressure drop through the fill is also uniform thus the fan sees a uniform air side pressure drop across the entire face of the drift eliminators. Air velocity through the entire fill pack is uniform, resulting in predictable thermal performance.
FIGURE 5 Counterflow nozzle chart
0
5
3 5 7 9
Head (ft H2O)
K=10.1
K=5.8
gpm/nozzle=K* √ head H2O
11 13 15
10
15
20
25
30
35
40
45Fl
ow R
ate
(gpm
per
noz
zle)
Marley VariFlow™ Nozzle Cup
Outboard
Outboard WaterInlet
Nozzle Cups
Full Flow
Inboard
FIGURE 6 Full design flow rate
➠

Figure 7 illustrates intermediate flow condition of a crossflow cooling tower with nozzle cups. With less water over the cooling tower, the lower flow rate results in less head over the nozzles — the water depth decreases. As the depth decreases, the nozzle cups begin to restrict flow to the nozzles on the inboard side of the basin. Since cups are installed along the full length of the basin, the water flow rate is uniformly reduced along the inboard portion of the fill.
In this intermediate flow condition, some water still overflows the cups and the water depth in the cups is probably less than the minimum head for the nozzles. Water flow in those nozzles is less predictable. Note however, the less predictable zone is uniformly distributed across the full length of the hot water basin then into the fill below that portion of the basin.
Note that uniform water depth across the entire outboard portion of the hot water basin is within the design operating range of the nozzles providing predictable water flow uniformly distributed across the full length of the air inlet opening. The air side pressure drop through this portion of the fill is uniform.
In addition, lower water flow through the cupped nozzles means less water flowing into the inboard portion of the fill. Even if this reduced flow rate results in less-than-minimum head over the nozzle resulting in unpredictable flow through individual nozzles in this area, this area of unpredictable flow is still uniformly distributed along the entire length of the fill section.
The fan draws air horizontally through the fill package, which consists of the inlet louvers, the outboard and inboard portions of the fill, and the drift eliminators. The total pressure drop is the sum of the pressure drops in all these areas but by far the greatest pressure drop is that in the outboard portion of the fill with the heaviest water loading. Any variation in air side pressure drop in the rear of the fill is
of minimal impact on the total. Air velocity through the fill is uniform, as is the thermal performance.
Notice the heavy water distribution right at the outboard portion of the fill at the air inlet louvers. A sharp transition between the dry integral louvers and the heat-containing water film at the outboard edge of the fill provides maximum resistance to ice formation in freezing weather.
Reducing the flow to the minimum flow rate as in Figure 8 results in the head in the basin dropping further and the cups becoming fully active. This completely cuts off water flow to the nozzles on the inboard side of the basin. The nozzles at the rear of the basin are now dry.
The inboard portion of the fill, however, is not dry. Since airflow in a crossflow cooling tower is horizontal across the flow of the falling water in the fill, there is still a tendency of the airflow to pull the water back into that section of the fill. Further, the air picked up moisture as a result of passing through the outboard section of fill and is now saturated.
Saturated air results in the fill, drift eliminators and plenum structure remaining wet. There is no scale formation in either the drift eliminators or the cooling tower plenum on a cooling tower in normal operation. The fill is not flooded but is wet so there is no alternate wetting and drying taking place at the rear of the fill or in the eliminators or plenum.
Water depth in the outboard portion of the basin is at least 2½" deep, so flow through the nozzles remains predictable at all times. Although there is still some water on the inboard portion of the fill as a result of the horizontal airflow through the front of the fill, some loss of effectiveness in the rear portion of the fill during very low-flow conditions only occurs at extremely low total heat loads relative to the cooling tower capacity, minimizing the effect.
Outboard
Outboard WaterInlet
IntermediateFlow
Intermediate Flow
Inboard
FIGURE 7 Intermediate design flow rate
Outboard
Outboard WaterInlet Low Flow Warm Moist Air
Keeps This AreaFrom Drying Out
Low Flow
Inboard
FIGURE 8 Low design flow rate

Most importantly, uniform air side pressure drop across the fill occurs so the fan maximizes its intended function of cooling the water. No air bypasses the fill, it is all put to effective use.
Issues With Inboard InletsIt is important to have both the water inlet and distribution flume on the outboard side of the basin. The first NC cooling tower, launched in 1968, was not designed this way and Marley realized that a change was required, redesigning it in 1975.
As shown in Figure 9, if the water inlet is inboard, adding nozzle cups block water flow to the outboard portion of the basin. Now, under low-flow conditions, not only are the inlet louvers dry, but the outboard portion of the fill is completely dry because the air passing through this portion of the fill has not yet picked up moisture from the wet section of the fill. Worse, there is a transition zone between the completely dry outboard section and the completely wet inboard section.
As in the earlier low-flow case, there is no sharp transition between dry fill and wet fill but an area a few inches wide allows progressively
greater volumes of water on the fill sheets. Since the air is cold, quite possibly below freezing under such low load conditions, it is still below freezing when the air encounters the first, very light volume of water in this area. The result is a substantially increased risk of ice formation in the section of the fill in the transition zone – not good.
Issues With Center InletsThe center inlet design, Figure 10, directly in the center of the hot water basin, feeds a splash-box rotated 90 degrees from the layouts shown previously and distributes water from the center into the hot water basin, presenting challenges for managing reduced flow.
Figure 11 shows the basin dam arrangement used by one manufacturer. The dams are designed to capture the water leaving the entire splashbox and divert the water toward the air inlet face.
While this approach helps to carry the water to the full length of the air inlet face, effective air travel is not uniform across the entire length of the cooling tower inlet.
Outboard
Air Inlet Sideof Fill is Dry
Low Flow
Low Flow
Inboard
Transition ZoneDry to Wet
Inboard WaterInlet
FIGURE 9 Inboard inlet is not desirable
Water Inlet
DistributionFlume
Plan View
FIGURE 10 Center inlet crossflow design
Basin Dam
FIGURE 11 Center inlet crossflow design with basin dams
➠

Marley blade-type louvers were 10½" wide, with about 7" of horizontal distance between the heat-containing water on the fill and the outboard edge of the louver. This added distance makes it more difficult for the heat in the circulating water on the fill to melt ice built up on the outboard section of the louvers.
Integral inlet louvers are thermoformed within the fill sheet, avoiding the transition between film surface and splash surface, eliminating droplet formation and the resultant uphill splash. Since the louver is more compact, about 3" wide, the outboard edge resides in close proximity to the heat-containing water film on the fill, providing greater resistance to ice formation.
The shaded area in Figure 12 shows the portion of the fill that has water on it during low-flow conditions. At the center of the cell the full fill air travel is utilized while at the outer ends of the cell only a small portion gets wetted. In between those areas, effective fill air travel varies between the two extremes.
The net result is that the portion of the fill fully wetted varies substantially depending on where the air enters the air inlet face. Since the film of water on that fully wetted fill adds substantial air-side pressure drop compared to the less-wetted fill behind the basin dams, the total air-side pressure drop through the fill varies. The result is much higher air rates through the fill at the left and right ends of the cell with progressively lower air rates toward the center of the air inlet face where most of the water is located. Thus the water at the ends of the cell is much colder than the water at the center of the cell. When operating a cooling tower in a free-cooling mode, the water at the ends of the cell may be at greater risk of icing.
Crossflow Design – Integral Inlet LouversMarley crossflow cooling towers have had integral air inlet louvers since the early 80s as shown in Figure 13. Figure 14 shows the louver configuration used on NC cooling previously, many other manufacturers still use this configuration.
The difference is significant. With the previous design, Figure 14, the cooling tower has film fill with blade-type inlet louvers shown butting up against the fill. Remember, these cooling towers use film fill, designed to avoid the formation of water droplets on the fill itself, causing the water to form a thin film on the surface of the fill for greater cooling efficiency and water management. The edge of the fill slopes from vertical so that airflow pulls the water back into the fill as it flows down the fill surface. When fan speed is reduced or stopped in cold weather the water flow becomes vertical and drips off the leading edge of the fill onto the louvers.
When a water droplet splashes onto an inclined surface most of the water splashes down and flows back into the fill. However, a little of that water droplet splashes up and lands on the cold louver where it can freeze, eventually building up an ice ridge on the louver at the outside edge of the droplet splash zone and cause problems.
Low PD Low PDHigh PDPD Varies PD Varies
FIGURE 12 Water distribution with low flow
Integral Louvers
FIGURE 13 Film fill with thermoformed integral louvers
FIGURE 14 Film fill with separate blade type louvers
Implementing Variable Flow in Counterflow Cooling Tower DesignsFigure 17 shows the relationship between the spray system, the fill and the airflow through a counterflow cooling tower. In the crossflow design, limiting the number of spray nozzles in service was a way to vary the distribution of water as the flow rate varied. However, the vertical airflow through a counterflow design imposes different limitations on the ability to vary the quantity of nozzles in service with variation in flow rate. Blocking off flow to some of the nozzles would block off water flow to an entire section of fill in the direction of airflow.
One option available for very large, field-erected cooling towers is to make the cooling tower spray plenum much taller, and install a two-tiered spray system above the fill. This is achieved by adding a series of standpipes on top of the spray system branch arms and mounting a second set of spray nozzles at the top of those standpipes. At low flow only the lower spray system would receive any water since there would not be sufficient head to lift the water to the upper series of nozzles. Increasing the flow rate would automatically increase the head, so water would also flow to the upper series of nozzles. The head in a spray system varies with the square of the flow rate.
On factory-assembled counterflow cooling towers such a system would add several feet to the height of the cooling tower, adding significantly to the cooling tower cost and weight while making it less attractive architecturally.
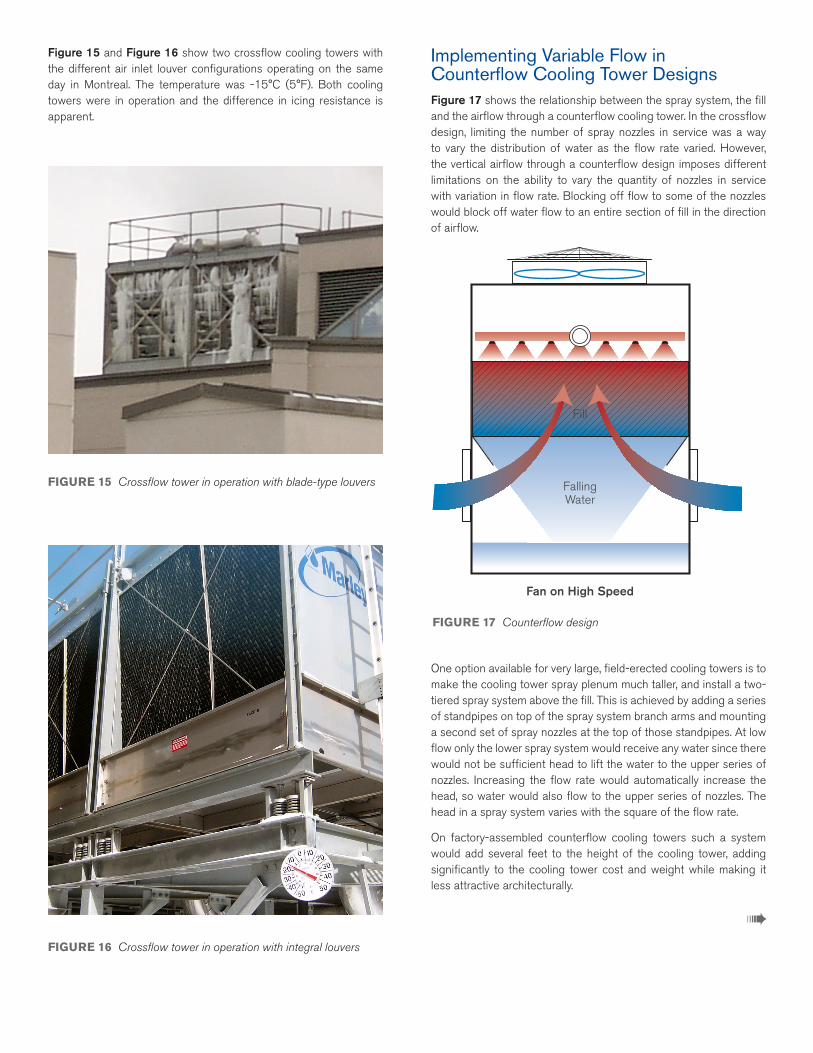
Figure 15 and Figure 16 show two crossflow cooling towers with the different air inlet louver configurations operating on the same day in Montreal. The temperature was -15°C (5°F). Both cooling towers were in operation and the difference in icing resistance is apparent.
FIGURE 15 Crossflow tower in operation with blade-type louvers
➠FIGURE 16 Crossflow tower in operation with integral louvers
FallingWater
Fan on High Speed
Fill
FIGURE 17 Counterflow design

In theory there is a wider range of head available in a pressurized spray system than there is in an open gravity flow crossflow cooling tower distribution system. Similar to a crossflow cooling tower, a minimum head above the nozzle is required to maintain proper water distribution over the fill.
Figure 18 illustrates flow rates over a counterflow cooling tower below the minimum design flow rate for the nozzles.
Lower flow rate results in lower head over the nozzle and, if too low, the nozzle can no longer achieve the needed lateral throw to get the water uniformly distributed over the top of the fill.
Too low and the spray pattern droops leaving sections of the fill unwetted or unevenly wetted. Since airflow through this type of cooling tower is vertically upward, air provides little assistance in distributing the water laterally within the fill. Gravity wants to pull water straight down. Counterflow fill, typically a cross-corrugated design used virtually by all manufacturers, provides little assistance in lateral water distribution. The net result is a vertical flow of water through the fill, leaving channels with substantially less water.
Since air-side pressure drop through the fill is a function of not only the dry fill but also the film of water on the fill, a substantial difference between the pressure drop through the well-wetted fill section and sections with little or no water occurs. This difference persists the entire height of the fill.
There is a significant difference in airflow through the wet sections of the fill and the less-wet sections. The fan runs to cool the water, drawing air through dry fill is not cost effective and provides only a fraction of the air necessary in the wet section where it is most effective.
This loss of efficiency costs thermal performance and in extreme cases can increase the risk of icing and result in scale formation if the flow rate is cycled between extremes.
So, how much can the flow rate be reduced on a counterflow cooling tower and stay within the design limits of the spray system? Using the full range of available nozzle head, substantial turndown is available. Figure 19 represents one of the nozzles used on the Marley MD counterflow cooling tower.
At 15'-0" of head the Marley nozzle flows at 22.5 gpm and up to 10 gpm at 3'-0" of head. From maximum flow to minimum flow, this reduces the flow rate by 55%, another substantial reduction.
Note that a substantial overlap between the small nozzle (shown in blue) and the large nozzle (shown in green) occurs. Since higher pump head increases the cost of operation of the cooling tower most system designers prefer to keep the cooling tower pump head as low as possible. Therefore, as soon as the flow rate is high enough to permit, the next larger nozzle is used to minimizes pump head. The minimum flow for the larger nozzle is about 17.5 gpm which is the point where the larger nozzle is selected. The curve shows the smaller nozzle reaching 17.5 gpm at about 9'-0" of head, well below the maximum flow of 22.5 gpm for that nozzle.
A 400 ton Marley MD counterflow cooling tower would have about 60 nozzles. At nominal flow of 3 gpm/ton each nozzle would flow about 20 gpm. At that flow rate the choice of using either the small or large nozzles would default to the larger nozzle to keep the design pump head low, at about 4'-0". However, with the head low not much turndown is available. 17.5 gpm would be the limit, a reduction of only 12.5% before the reaching the bottom of the nozzle curve.
Using the smaller nozzle achieves a 50% turndown, reducing 20 gpm/nozzle down to 10, at the expense of substantially higher pump head while the cooling tower is circulating full design flow. The pump head turndown penalty is 8'-0" of additional head when the tower is operating at full design flow.
Reduced Flow Rate
Water Channeling in Fill
FIGURE 18 Counterflow design with reduced flow
FIGURE 19 Counterflow nozzle chart
0
5
3 5 7 9
Head (ft H2O)
K=10.1
K=5.8
gpm/nozzle=K* √ head H2O
11 13 15
10
15
20
25
30
35
40
45
Flow
Rat
e (g
pm p
er n
ozzl
e)

The amount of flow turndown available on any counterflow cooling tower starts with the nozzle curve for the particular model which is based on the specific design conditions of the project. Depending on that starting point, the flow may be reduced as much as 50% or maybe more, more likely 35% or even less. The specific cooling tower selection determines flow turndown.
Separating physics from marketing is critical. All manufacturers’ nozzles operate under the same laws of physics whether they are square, round, rotary, fluidic or hydrocyclone designs. The head through the nozzle varies with the square of the flow rate.
• All nozzles operate under the same physics
• Head varies with the square of the flow rate
• Different manufacturers may have (slightly) higher or lower head limitations
• Turndown depends on the nozzle curve
• Consult the cooling tower supplier for minimum flow for a specific installation
ConclusionThere are significant energy savings opportunities if the cooling tower can be operated under variable flow conditions.
Varying the flow rate over the cooling tower, not through the process the cooling tower serves has no effect on process efficiency, as the process is still allowed to operate in its most efficient manner. Variable flow is a way to maximize the effectiveness of the installed cooling tower capacity for whatever flow the process has.
Key points:
• Cooling tower capacity varies directly with the fan speed
• Cooling tower energy consumption varies with the cube of the speed ratio
Options are:
• Run half of the fans at full speed for 50% cooling at half of the energy usage
• Run all the fans at half speed for 50% cooling at one-eighth the energy usage
Not all factory assembled cooling towers are created equal:
• Crossflow cooling towers with outboard water inlets and integral inlet louvers handle very high turndown rates (50-70% or more), and can operate under these conditions in freezing weather
• Crossflow cooling towers without inboard inlets and without integral inlet louvers can handle high turndown rates, but may have issues in freezing weather
• Counterflow cooling towers are not easily modified but variable flow can be achieved as long as the limitations of nozzle design and fill coverage are taken into account on the specific cooling tower model and design conditions
There are inherent design differences between crossflow and counterflow cooling towers that affect their variable flow capabilities.
Crossflow cooling towers with gravity flow hot water basins:
• The head varies with the square of the water flow
• Crossflow cooling towers are easily modified
• Variflow nozzle cups allow 50%+ flow reduction while maintaining proper water distribution
If the crossflow cooling tower is to be operated in freezing weather include:
• Outboard water inlets
• Integral inlet louvers
Counterflow cooling towers with pressurized flow system:
• The head varies with the square of the water flow
• Counterflow cooling towers are not easily modified
• Enough head is needed to properly pressurize the piping plus cover the fill
• Limited turndown capability
• 50% turndown reduces head 4x. If 3'-0" of head is needed at the inlet at half flow, 12'-0" head is required at design flow
Common misconceptions exist regarding how much flow can be reduced with certain types of cooling towers. If the cooling tower installation, new or existing, needs to take advantage of variable cooling tower flow, ask the cooling tower representative about the specific requirements.
For new or replacement installations optimized for variable flow, pick a crossflow design in general — and a Marley crossflow design in particular for maximum flexibility.
Freezing Weather Operation TipsFollowing are best practices for freezing weather regardless of whether the cooling tower is a crossflow or counterflow, these best practices are appropriate for all:
• A water cooling tower will do some cooling even when the fan is off creating a heat load if water is circulating water. If for some reason pumps must run and there is no heat load, incorporate a bypass into the cooling tower piping. The bypass must have two positions, on or off, not a modulating bypass. Note that less water carries even less heat, making icing even more likely.
• On the air side, use VFDs on all fans if the cooling tower will be running in freezing weather. VFDs are recommended for all cooling tower applications due to better control of process water temperature, lower energy consumption, reduced wear and tear on mechanical equipment and more friendly sound characteristics.
➠

• On multiple cooling tower cells, fan speeds should be ramped up and down together to maintain the desired cold watertemperature. This will avoid the problem of one cell makingthe water too cold while another does not cool enough. Thisalso minimizes energy cost. Modulate fan speeds to controlthe water temperature appropriate for the process beingcooled, keeping it reasonable for the climate.
• The “rule of thumb” for cold water set-points is to minimizethe risk of ice formation in the fill by using a cold watersetpoint no lower than the cooling range plus 32°F. If cooling water over a 10° range, do not try to get the water colderthan 42°, and higher than is better. Most processes don’tbenefit from water this cold anyway, save fan energy andreduce risk by using reasonable cold water setpoints.
• Do not run fans in reverse in freezing weather, it does notkeep air inlet louvers ice free. The fan will ice up creatingdamage to mechanical equipment and blowing water out the louvers, icing an entire area instead.
It’s important to get to know the particular cooling tower installation — its heat load profile and site-specific airflow patterns around the cooling tower. By monitoring the installation regularly, learn the scenarios which increase the risk of louver ice formation and to be in a better position to head it off icing before it becomes a problem.
At times a cooling tower may ice up anyway. By monitoring the cooling tower, anticipating ice and knowing procedures can forestall a 6,000 lb block of ice from forming on inlet louvers.
The first step is to simply shut the fan off. This is one clear advantage to having multiple cooling towers serving your process or chiller. With multiple cells, simply shut off one fan at a time while maintaining cooling on the remaining cells, and rotate the deicing procedure through all operating cooling tower cells. Shutting off a fan virtually stops airflow through the cooling tower, allowing the water in the fill to come closer to the inlet louvers. In most cases, this alone is adequate to remove accumulated ice from the air inlet louvers.
• If deicing is required this multi-step procedure starts withshutting down one fan and allowing it to come to a full stop.When the fan is fully stopped, start the fan in reverse at lowspeed, in the range of 30% or so, no higher than 50%. Blowthe warm circulating water onto the louvers to melt the ice.Do not run the fan so fast that water blows out through theinlet louvers. If done before the ice accumulation is too greatthis should take only a short time, approximately two to fiveminutes. Stop the fan, allow it to come to a full stop andresume forward operation as normal, repeating as needed.The idea is to deice frequently for short periods of time toensure that deicing is accomplished before heavy ice hasa chance to accumulate reducing the risk of damage to thecooling tower and/or adjacent structures
• Not only does the cooling tower need protection fromfreezing while in operation, it is necessary to plan forsituations where the cooling tower is out of operation forshort periods — overnights, weekends, or between cyclesin a manufacturing process. The most common approach isusing a basin heater in the cooling tower cold water basin.Any available heat source, electricity, steam or hot water,works but electric resistance heaters are by far the mostcommon resource. Electric resistance heaters are low costand simple to install and maintain. If there is a surplus of hotwater or steam available, steam or hot water coils can beprovided for recirculating systems or steam ejectors can beused if the condensate does not need to be recovered.
• Another alternative is to locate a storage tank below thecooling tower, either within the building or below gradebelow the frost line. With this type of system, water flowsfrom an indoor tank, through the load system, and back tothe tower, where it is cooled. The cooled water flows bygravity from the tower to the tank located in a heated space.At shutdown, all exposed water drains into the tank, where itis safe from freezing. This approach avoids the energy costof the basin heaters although there is a pump head penaltysince the pump now has to overcome the greater static liftfrom the water level in the storage tank to the top of thecooling tower. This also requires added space in the building.
thermal science
TR-014 | ISSUED 9/2017
COPYRIGHT © 2017 SPX CORPORATION
In the interest of technological progress, all products are subject to design
and/or material change without notice.
SPX COOLING TECHNOLOGIES, INC.
7401 WEST 129 STREET
OVERLAND PARK, KS 66213 USA
913 664 7400 | [email protected]
spxcooling.com