variability reduction & a six sigma process - · pdf filewmg slide 1 variability reduction...
TRANSCRIPT

GraemeKnowlesWMG Slide 1
Variability Reduction &A Six Sigma Process
The Basics of A Revolutionary Approach to Business
Improvement
GraemeKnowlesWMG Slide 2
Variation
qOccurs everywhere:
§ Machined dimensions
§ Time to complete a task
§ Number of faults per vehicle
§ The weight of a dispensed product
GraemeKnowlesWMG Slide 3
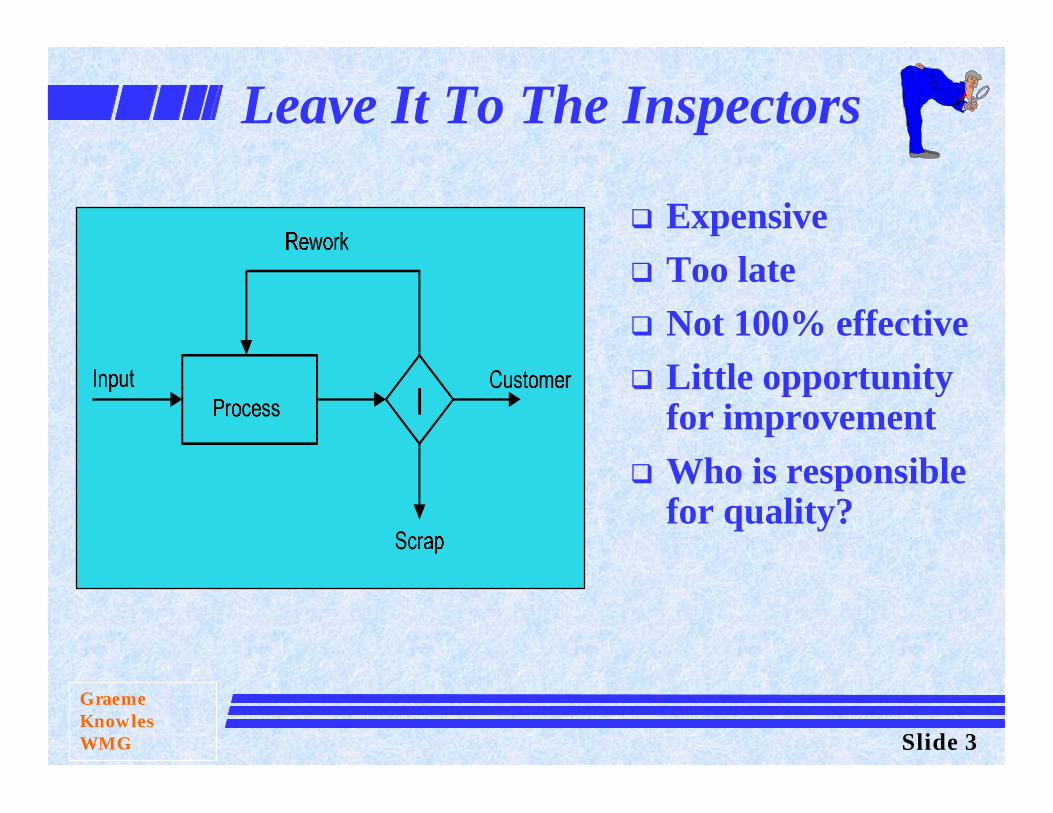
Leave It To The Inspectors
q Expensiveq Too lateq Not 100% effectiveq Little opportunity
for improvement
q Who is responsible for quality?

GraemeKnowlesWMG Slide 4
Are You Common or Special?
qCommon Causes§ Affect, to some extent, all
products of a process§ Inherent in the system§ Affects capability but not
predictability
qExamples§ Raw material variation§ Ambient temperature variation§ Operator variability
§ Play in a machine
qSpecial Causes§ Affect only some products of a
process§ Transient in nature§ Affects both predictability and
capability
qExamples§ Poorly trained operator§ Defective Material§ Wrong processing conditions§ Machine malfunction
GraemeKnowlesWMG Slide 5
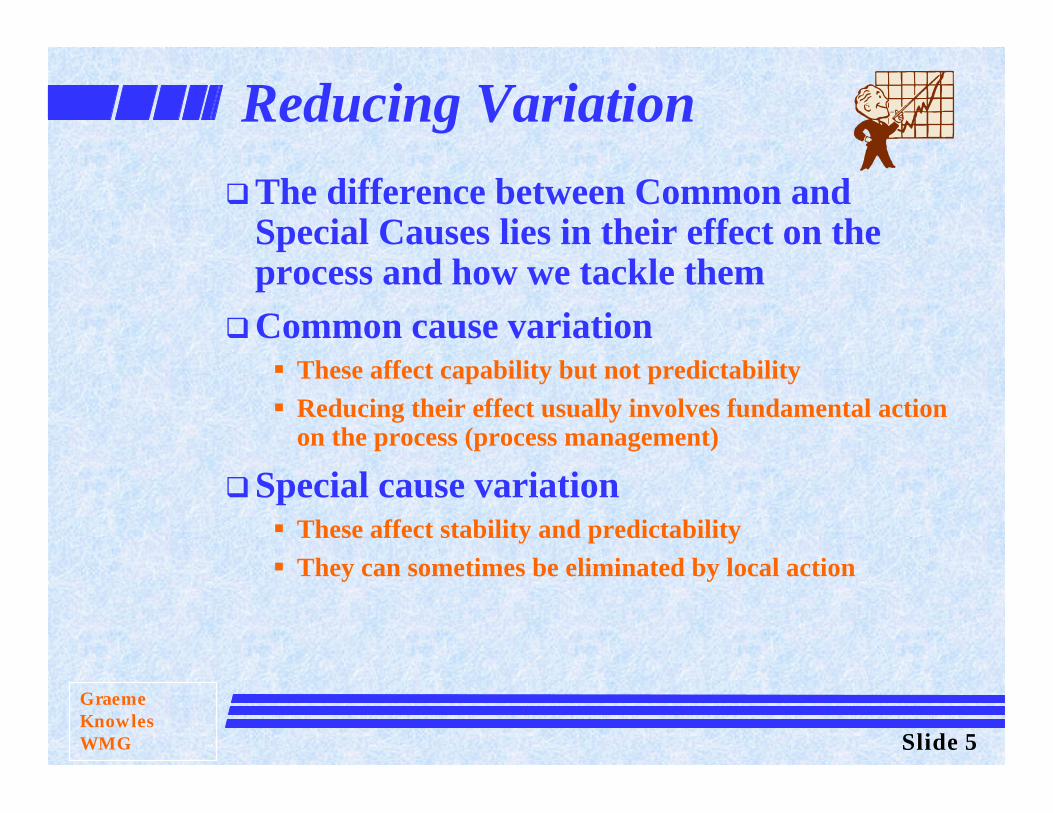
Reducing Variation
qThe difference between Common and Special Causes lies in their effect on the process and how we tackle them
qCommon cause variation§ These affect capability but not predictability
§ Reducing their effect usually involves fundamental action on the process (process management)
qSpecial cause variation§ These affect stability and predictability
§ They can sometimes be eliminated by local action

GraemeKnowlesWMG Slide 6
The Concept of Statistical Control (I)q In Statistical Control§ For a process where only common cause variation is
present, the pattern of variation will be stable.§ This is known as being ‘In Statistical Control’.§ We can use this fact to predict, within limits, the future
results of the process.M e a n s C h a rt
44.00
45.00
46.00
47.00
48.00
49.00
50.00
51.00
52.00
53.00
1 2 3 4 5 6 7 8 9 10 11 12 13 14 15 16 17 18 19 20 21 22 23 24 25 26 27 28 29 30
S a m p le
U C L
L C L

GraemeKnowlesWMG Slide 7
The Concept of Statistical Control (II)
q Out of Statistical Control§ When special cause variation is present, the process is not
predictable.§ This state is described as being ‘Out of Statistical Control’.
UCL
LCL

GraemeKnowlesWMG Slide 8
Establishing Control
qThe Average Chart§ Concerned with between
subgroup variation long term variation in process average
§ Control limits are calculated based on the average within subgroup variation (from R chart)
§ ‘Is process average variability excessive?’
qThe Range Chart§ Concerned with within
subgroup variation (short term variability in process spread)
§ Control limits are based on the average within subgroup variation
§ ‘Is the short term variation consistent?’

GraemeKnowlesWMG Slide 9
Can We Make It Then?
q Which process would you prefer?
q Process A cannot meet spec. q Process B could potentially
meet spec but is poorly set.q Process C is barely capable.q Process D is highly capable.q Which do you currently have?q If you don’t know, how can
you expect to succeed?

GraemeKnowlesWMG Slide 10
Process Capability
qKnowledge of capability is essential if we are to make appropriate decisions concerning the selection of processes to meet design intent
qBefore establishing its capability, the process must be stable - operating under common cause variation alone
q If the process is unstable it has indeterminate capability

GraemeKnowlesWMG Slide 11
Sigma Levels
q This measure indicates the potential of the processq An assumption within Six Sigma is that a process
centre may shift as much as 1.5 Sigma in either direction
q This gives rise to the popularly quoted 3.4 ppmdefective levels
q This is the minimum performance level when a maximum shift is applied
( )σ
σ2
LTLUTLn
−=

GraemeKnowlesWMG Slide 12
Implications of Sigma Levels
3.40.0026 sigma
2330.575 sigma
6,210634 sigma
66,8102,7003 sigma
308,70045,6002 sigma
Ppm with 1.5 sigma shiftPpm with no shiftSigma Level
Upper Tolerance
Lower Tolerance
GraemeKnowlesWMG Slide 13
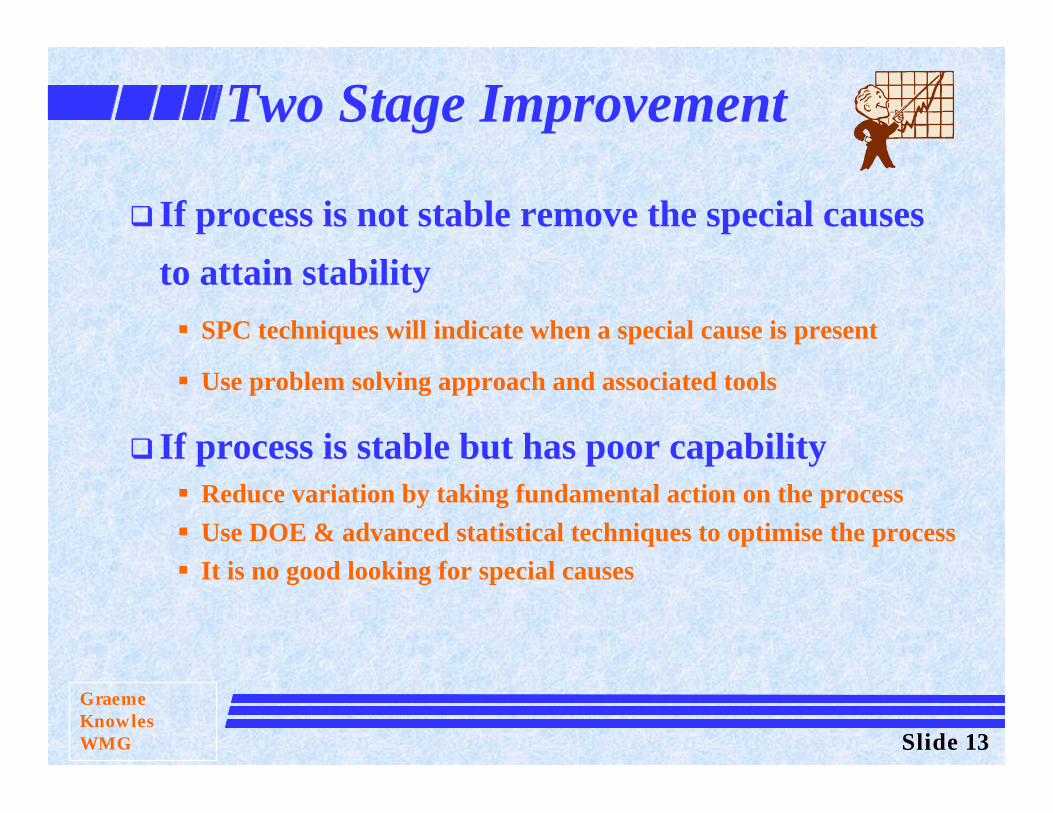
Two Stage Improvement
q If process is not stable remove the special causes
to attain stability
§ SPC techniques will indicate when a special cause is present
§ Use problem solving approach and associated tools
q If process is stable but has poor capability§ Reduce variation by taking fundamental action on the process
§ Use DOE & advanced statistical techniques to optimise the process
§ It is no good looking for special causes

GraemeKnowlesWMG Slide 14
Juran’s Trilogy
q Modified from Juran’sQuality Trilogy
q The system is first planned and achieves the level of performance of which it is initially capable
q Sporadic special causes occur & should be tackled
q Fundamental improvement actions change the zone of performance to a new level
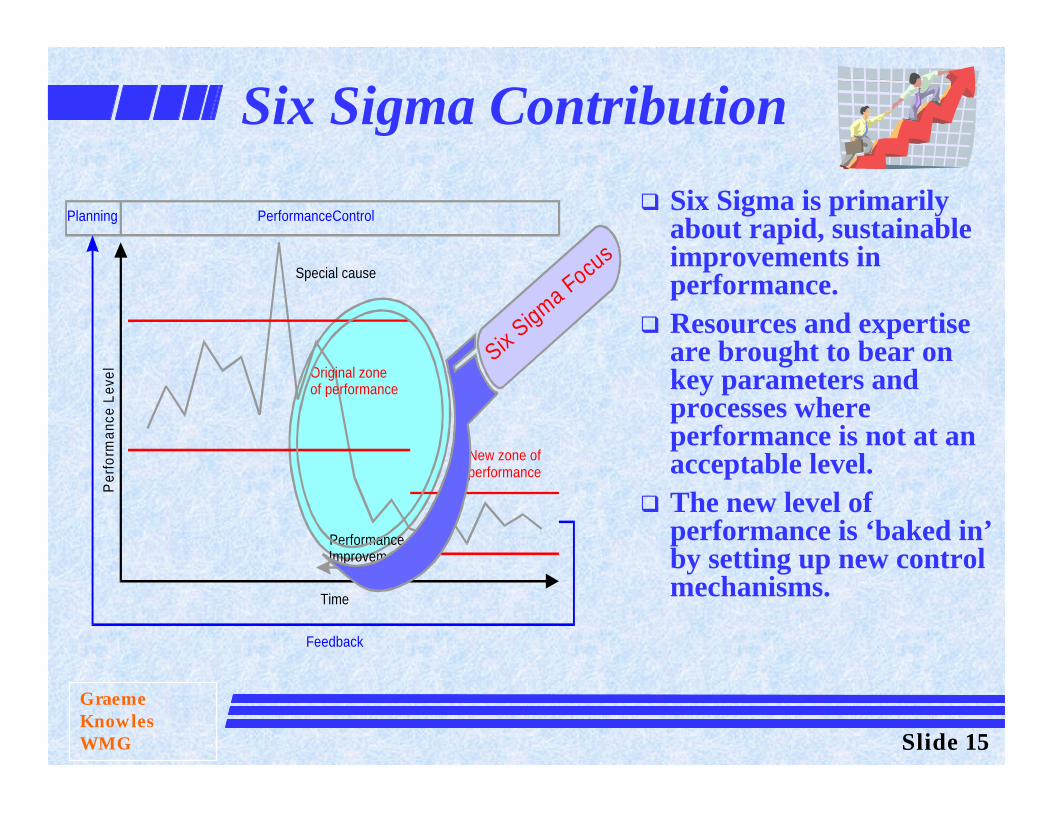
GraemeKnowlesWMG Slide 15
Six Sigma Contribution
q Six Sigma is primarily about rapid, sustainable improvements in performance.
q Resources and expertise are brought to bear on key parameters and processes where performance is not at an acceptable level.
q The new level of performance is ‘baked in’ by setting up new control mechanisms.
Per
form
ance
Lev
el
Time
Special cause
Original zoneof performance
PerformanceImprovement
New zone of performance
Planning PerformanceControl
Feedback
Six Sigma Focu
s

GraemeKnowlesWMG Slide 16
Six Sigma Definition(s)
qA measure:§ A statistical definition of how far a process deviates from
perfection
qA target:§ Equates to 3.4 ppm defective or unacceptable
qA philosophy:§ A long –term business strategy focused on the reduction
of cost through driving down variation in product and processes

GraemeKnowlesWMG Slide 17
Six Sigma Applicability
qManufacturing
qDesignqTransactional Processes
GraemeKnowlesWMG Slide 18
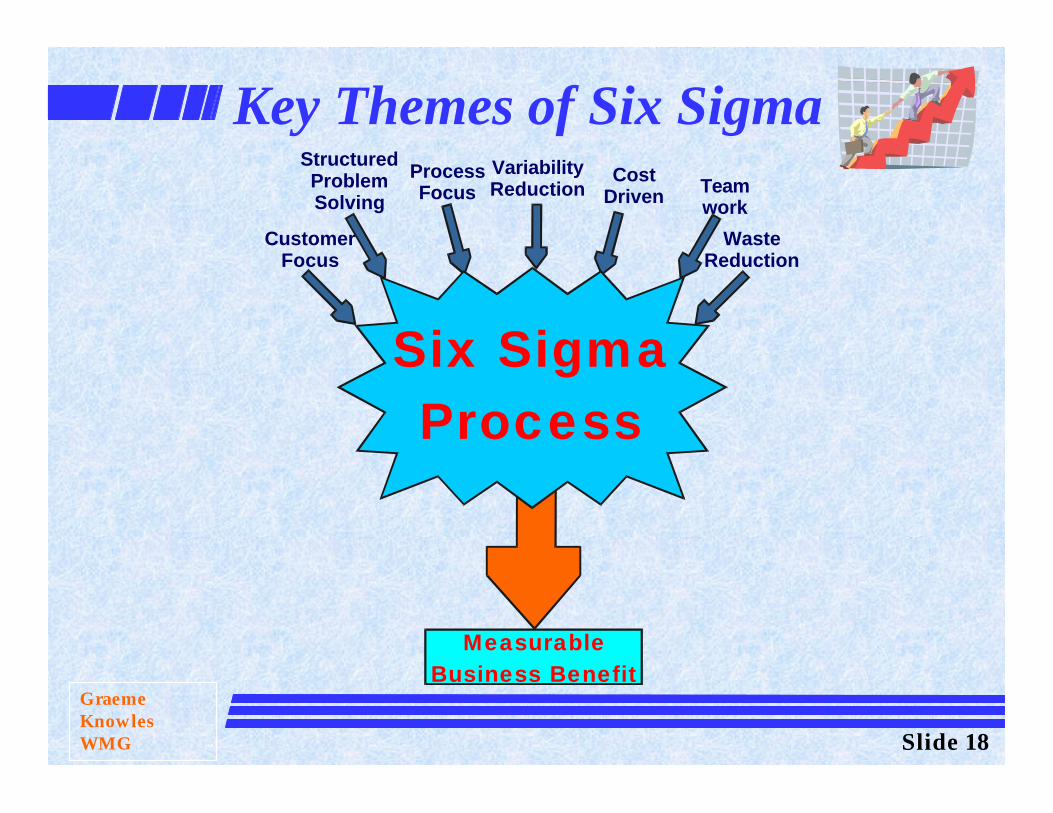
Key Themes of Six Sigma
Six SigmaProcess
StructuredProblemSolving
ProcessFocus
VariabilityReduction
CostDriven Team
work
CustomerFocus
WasteReduction
MeasurableBusiness Benefit

GraemeKnowlesWMG Slide 19
A Six Sigma Process
Define
Measure
Analyse
Improve
Control
ProcessCustomer requirementsOpportunityLikely benefitsPossible contributors
Current PerformanceSources of Variability
Key VariablesRelationships
Implemented solutionPredicted & tested results
Key variables controlledPlan for stabilityTraining plan
Measure of benefits achievedRecord of the process

GraemeKnowlesWMG Slide 20
Six Sigma Tools
Define
Measure
Analyse
Improve
Control
FlowchartCause & Effect
QFD FMEA
Control ChartsCapabilityAnalysis
Pareto Waste & CostAnalysis
Multi-vari Correlation
ANOVA Measurement Capability
DOE Process redeisgn
Taguchi Poke Yoka
ControlPlan
ControlCharts
Cusum
Training