vapor-liquid equilibria for methanol + ethanol + calcium chloride, + ammonium iodide, and + sodium...
TRANSCRIPT

472 J. Chem. Eng. Data 1995,40, 472-477
Vapor-Liquid Equilibria for Methanol + Ethanol + Calcium Chloride, + Ammonium Iodide, and + Sodium Iodide at 298.15 K
Hideki Yamamoto,’ Tamotsu Terano, Yasuharu Nishi, and Junji Tokunaga
Department of Chemical Engineering, Faculty of Engineering, Kansai University, Suita, Osaka 564, Japan
Vapor-liquid equilibria for methanol + ethanol + CaC12, + NHII, and + NaI were measured a t 298.15 * 0.05 K using a static method. The data obtained in this apparatus were confirmed by comparison with the literature data of ethanol + water and ethanol + water + CaClz and tested for thermodynamic consistency. Any salt used in this work exerted salting-in effect on the methanol + ethanol system, the magnitude of which was CaClz > NaI > NH4I. The observed data were correlated by use of Hbla’s equation, and p was determined for each system. The calculated result of each system reproduced experimental data within an accuracy of &2.12% in vapor-phase mole fraction. From the results of comparison of /3 obtained in this work with the kind of salt additive for methanol + ethanol and ethanol + water systems, it was found that p depended mainly on the kind of salt but not on the kind of solvent mixture. The application of Hala’s model for an alcohol + alcohol + salt system was confirmed at a temperature of 298.15 K.
1. Introduction
Data of phase equilibria in chemical engineering are indispensable for the design of equilibrium separation processes such as distillation, absorption, extraction, or crystallization. Recently, an alternative extractive distil- lation using a salt as extractive solvent has attracted attention. If a salt, being completely nonvolatile, is added to the solvent mixture, the relative volatility generally changes; this is known as the salting-in or -out effect on vapor-liquid equilibria. As a result, the azeotropic point is shifted or eliminated, when the salt-free mixture has an azeotropic point. Furthermore, if the salt effect is utilized for the distillation, it is possible to separate an azeotropic mixture (1).
This is one reason research for salt effect has been undertaken. In comparison with vapor-liquid equilibria for nonelectrolyte systems, those for systems containing electrolytes are still insufficient from the standpoint of theoretical analysis. Also, the investigation of the kind of salts has been limited. Furthermore, a mathematical model for vapor-liquid equilibria in the presence of salt has been less established than for nonelectrolyte, because of the complex behavior of electrolytes.
In this study, to check the consistency of the experimen- tal apparatus based on the static method, isothermal vapor-liquid equilibria at 298.15 K were measured for ethanol + water + CaC12. The salt effects of CaC12, NH41, and NaI on the vapor-liquid equilibria of methanol + ethanol at 298.15 K are examined experimentally.
The present data of vapor-liquid equilibria were cor- related using Hala’s model (2), and p values in Hala’s equation for methanol + ethanol + salt were determined.
2. Experimental Section 2.1. Experimental Apparatus. The apparatus based
on a static method ( 3 , 4 ) was manufactured in our labora- tory for the measurement of vapor-liquid equilibria. A schematic diagram for the experimental apparatus is shown in Figure 1. A 500 cm3 degassing flask was used to degas the sample. It was equipped with a water jacket for cooling and a bellows valve. The equilibrium cell, which was made of Pyrex glass, has about 100 cm3 capacity, and
0021-9568/95/1740-0472$09.00/0
it was equipped with a water jacket to keep the mixture at constant temperature (298.15 f 0.05 K). The constant- temperature water bath was controlled by PID controller within an accuracy of +0.01 K. The temperature of the sample was measured with a standard mercury thermom- eter. Sample was stirred slowly by a magnetic stirrer.
The temperature of the external circulating water was controlled at about 5 K higher than the temperature of equilibrium to avoid partial condensation of vapor in the pipe arrangement. A gas sampler was used for analysis of vapor-phase composition. It consists of a six-way ball valve and a tube of about 1 cm3 capacity. A vapor phase was introduced into the gas chromatograph directly. The line between the gas sampler and gas chromatograph was wrapped by a ribbon heater to avoid partial condensation. It was controlled a t about 5 K higher than the temperature of the equilibrium cell by the PID controller with an accuracy of &0.05 K. For measurement of the vapor pressure, the digital quartz manometer DG-430KH of Tokyo Aircraft Instrument Co., Ltd., was used in this experiment, and its accuracy was within *0.01% of full scale (2 MPa). Then, a sampling flask of 30 cm3 capacity was used for sampling of the liquid phase in the equilib- rium cell. To remove air and moisture from the system, the vacuum pump was used, and its attainable degree of vacuum was 0.1 Pa. The pipe arrangement of the experi- mental apparatus (Figure 1) was made of stainless steel, and the outside and inside diameters were 6.35 and 3.18 mm, respectively. A clamping joint of metal ferrule manufactured by Nupro Co. was used in this apparatus. As for the valve arrangements, the bellows valve was supplied by,Nupro Co. and the ball valve by Whitey Co.
To analyze the liquid-phase composition in equilibrium state using the gas chromatograph, salt and solvent must be separated from the liquid phase. Therefore, an evapo- rating apparatus similar to that devised by Iino et al. (5) was newly manufactured for this purpose. A schematic diagram is shown in Figure 2. The samples for vapor and liquid phases were analyzed using gas chromatography with thermal conductivity detector GC-8A and integrator C-R6A manufactured by Simadzu Corp. Co., Ltd. Helium with a purity of 99.999% was used as carrier gas, and it was provided from Sumitomo Seika Co. The operating
0 1995 American Chemical Society

Journal of Chemical and Engineering Data, Vol. 40, No. 2, 1995 473
Vacuum
Water+
PI l!i Figure 1. Schematic diagram of the experimental apparatus: 1, degassing flask 2, equilibrium cell; 3, standard mercury thermometer; 4, magnetic stirrer; 5, constant temperature water bsth; 6, gas sampler; 7, PID temperature controller; 8, digital quartz pressure gauge; 9, sampling flask; 10, vacuum pump; Bl-Bs, ball valve; VI-vS, bellows valve.
A. Still
B. C. Heater
D. F. Condenser
E. vapor condensate stock chamber f
L Figure 2. Schematic diagram of the evaporating apparatus for separation of salt.
Table 1. Operating Conditions of the Gas Chromatograph
column packing Gaskuropack 54 60180 carrier gas He (30 mumin) sample size 0.6 p L injectioddetector temp 493 K column temp 393 K current 90 mA
SUS i.d. 3 mm x 2 m
conditions of the gas chromatograph are given in Table 1. 2.2. Experimental Procedures. 2.2.1. Measurement
of Vapor Pressure for Single Solvent -k Salt. A weighed solvent and salt were stirred slowly by a magnetic stirrer in the Erlenmeyer flask until the salt dissolved completely in the solvent. The sample was charged in a degassing flask being heated by mantle heater. After the mixture was degassed by aspirator for 1 h, the degassing flask was installed in a fixed position of the apparatus. The experimental apparatus connecting the vapor-liquid equi- librium cell was evacuated by vacuum pump for 1 or 2 h, and the pressure in the system was recorded. Then, the sample in the degassing flask was introduced to the cell. This sample solution was stirred slowly to reach an
equilibrium state. When the temperature of the sample and the pressure in the apparatus became constant, the sample was regarded as in equilibrium state and the pressure was recorded. The vapor pressure of a single solvent + salt system was obtained as the pressure difference between initial pressure in the apparatus and that in equilibrium state.
2 5 5 . Accuracy of Vapor-Liquid Equilibria Mea- surement. Each experiment was carried out under the condition of constant mass percent of salt. In the subse- quent operation, vapor pressure was measured by the method described under 2.2.1.
For the analysis of the vapor-phase composition, vapor in equilibrium state was withdrawn into the gas sampler, and it was analyzed by gas chromatography. On the other hand, liquid phase in the cell was introduced into a sampling flask and its weight was measured exactly. Since the liquid phase contained a salt, the salt was completely separated using an evaporating apparatus (Figure 2). The liquid-phase composition other than salt (salt-free basis) was analyzed by gas chromatography. The mole fraction of salt in this liquid phase was also obtained from the weight of separated salt.
2.3. Determination of Composition. To obtain the calibration curve, various compositions of methanol + ethanol were prepared; these mixtures were introduced into the gas chromatograph and the area fraction of the peak in the gas chromatogram was obtained. The obtained mole fraction ( x ) and area fraction(s) were interpolated using a fifth-order function as follows:
x = 1.370(~ - s5) - 0.865(s2 - s5) + 1.290(s3 - s 5 ) - 1.314(s4 - s 5 ) + s5 (1)
The observed data were fitted to pass through two points, (0,O) and (1,l). Accuracy for this calibration curve was within an average deviation of &1.06%. Each composition obtained in this work was determined by interpolation of the calibration curve (eq 1).
3. Materials Methanol, ethanol, CaC12, NHJ, and NaI in this study
were guaranteed reagents from Wako Chemicals Co., and their minimum purities were 99.8%, 99.5%, 99.0%, 99.5%, and 99.5%, respectively. Since the impurity in methanol or ethanol was water, it was dehydrated by 3A molecular sieves, inch, and then minimum purities 99.9% were confirmed by gas chromatography. For the purpose of removing of moisture contained in the salt, CaClz was dried

474 Journal of Chemical and Engineering Data, Vol. 40, No. 2, 1995
Table 2. Vapor-Liquid Equilibria of Ethanol (1) + Water (2) at 298.15 K
mole fraction
Table 3. Accuracy of Separation of Ethanol (1) + Water (2) Containing CaClz using Evaporating Apparatus
mole fraction of ethanol
0.063 0.115 0.205 0.291 0.327 0.424 0.495 0.650 0.701 0.838 0.973
0.365 0.486 0.581 0.614 0.633 0.662 0.679 0.752 0.785 0.867 0.971
0.55 3.85 4.12 1.15 1.61 0.00
-1.45 -0.13
1.03 1.17 0.00
4.56 -2.98 5.51 1.47 6.37 3.24 6.67 0.91 6.81 0.89 7.08 0.28 7.27 0.28 7.49 -1.45 7.63 -0.78 7.81 -0.76 7.87 -0.25
100Ac = f1 .37 1OOA6 = f1 .21
a d,, = Cylexptl - ylcalcd*), b = ( p x p t l - paled*), c A = (l/N)- EEll[(exptl) - (calcd*)l/(calcd*)]. *, Smoothed values from Hall et al. using the Wilson equation (Wilson parameter: A12 = 0.2805, A 2 1 = 0.7264).
L
2.
1.0
0.8
0.6
0.4
0.2
0.0 0.0 0.2 0.4 0.6 0.e 1.0
x1
Figure 3. Vapor-liquid equilibria of ethanol (1) + water (2) a t 298.15 K. 0, present work; 0, Dobson (10); A , Hall (11); -, smoothed value by Wilson’s equation using observed data.
by heating at 573 K for more than 24 h. N&I and NaI were dried by heating at 353 K for 3 h. Water was purified by use of Milli-Q Lab0 manufactured by Millipore Ltd., after distillation and ion exchange.
4. Results and Discussion 4.1. Consistency of Experimental Apparatus. The
consistency of the experimental apparatus for vapor pres- sure measurement was already checked by comparisons of vapor pressures of pure components (methanol, ethanol, 1-propanol, 2-propanol, and water) with literature values at 298.15 (10.05) K. Observed vapor pressure had satis- factory agreement with data from the refs 6-9 within an accuracy of 11.5%. The reproducibility was within 10.6%.
To check the consistency of the experimental apparatus used in this work, vapor-liquid equilibria for ethanol (1) + water (2) was measured at 298.15 (k0.05) K. The experimental data for ethanol + water are given in Table 2 and shown in Figure 3, where they are compared with the literature data (IO, 11). The average deviation between experimental and literature value was 11.37% in vapor- phase mole fraction and f1.21% in total pressure. Ther- modynamic consistency of the data was ascertained by the area test of Herington’s method (12, 13). The result of Herington’s area test was A = 0.028, and the point test was P = 0.027 (consistency tests of data were generally A < 0.03, P -= 0.05, respectively).
Then, to check the reproducibility of the experimental data, samples of the fixed liquid-phase composition (0.2,
x1*1a X 1 * 2 b 1006,,/~,c yield of solvent
0.486 0.482 -0.82 99.33 0.483 -0.62 99.36 0.482 -0.82 99.54
Mole fraction of ethanol determined before salt mixing. Mole fraction of ethanol determined after separation using the evapo- rating apparatus. 6,, = - x1*1.
0.4, 0.6, and 0.8 mole fraction of ethanol) were measured three times, respectively. The reproducibility was within f1.4% for vapor-phase composition and within 10.9% for total pressure. In view of the above result, it appears that vapor-liquid equilibrium data obtained from this experi- mental apparatus are reliable.
4.2. Consistency of Evaporating Apparatus. The consistency of the evaporating apparatus (Figure 2) was checked by yield of solvents (mole fraction) and material balance before and after evaporating. The solution of fured composition (ethanol (1) + water (2) + CaClz (3)) was charged into a still. After salt was separated from the solution, material balance and yield of the solvents were calculated. The above operation was repeated three times. The results are given in Table 3. For ethanol (1) + water (2) + CaClz (31, maximum deviation of solvent composition (mole fraction) was -0.82%, and its yield was more than 99.3%. Accordingly, it was considered that salt and solvents were sufficiently separated from solution.
4.3. Vapor Pressure of Single Solvent + Salt. To correlate salt effect, vapor pressure data for single solvent (methanol or ethanol) + salt (CaC12, NH41, or NaI) were measured a t 298.15 (10.05) K. Activity (a,) of the solvent could be expressed as
ai =pilpio i = 1 , 2 (2)
where pl0 and p , are the vapor pressure of pure component and the partial pressure of component i, respectively. The vapor pressure and activity data for the methanol + salt ethanol + salt systems are given in Tables 4 and 5. As for the degree of vapor pressure lowering against molarity, it was found that ethanol + NaI was the largest among ethanol + salt, and there was not much difference between ethanol + NH4I and ethanol + CaC12.
The order of vapor pressure lowering for methanol + salt was methanol + CaClz > methanol + NaI > methanol +
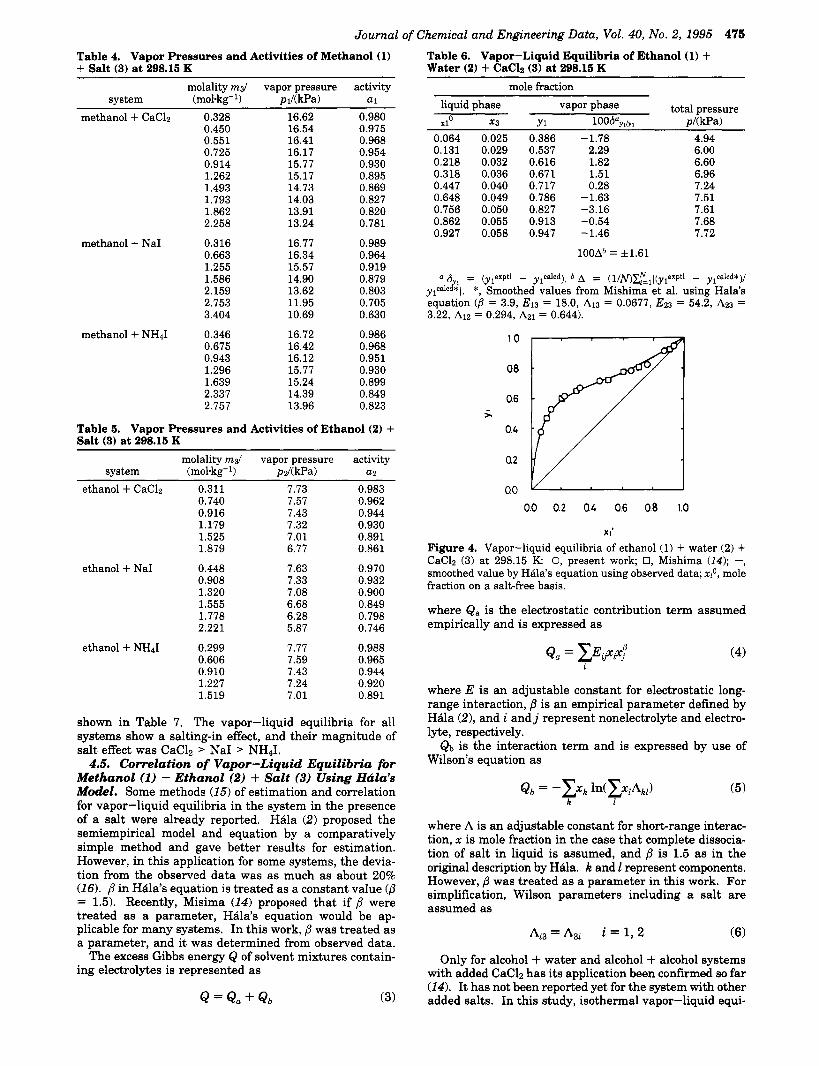
4.4. Vapor-Liquid Equilibria for Methanol (1) + Ethanol (2) + Salt (3). To check the reliability of the apparatus for the measurement of salt effect, the vapor- liquid equilibria for ethanol (1) + water (2) with 5 mass % CaC12, as already reported, was measured at 298.15 (zkO.05) K. Table 6 gives the obtained experimental data. These data are also shown in Figure 4, where they are compared with the literature data (14). As shown in Table 6, the average deviation of these experimental data was within f 1.6% in vapor-phase composition from the literature data. It was considered that this experimenal apparatus was reliable for the measurement of salt effect.
In turn, the vapor-liquid equilibria for the methanol (1) + ethanol (2) + CaClz (3) (10 mass %), methanol (1) + ethanol (2) + NH4I (3) (20 mass %), and methanol (1) + ethanol (2) + NaI (3) (20 mass %) systems were newly measured at 298.15 (f0.05) K. The mole fraction (xg) of NH41 and NaI were 0.09-0.13, similar to that of CaC12 (10 mass %). The experimental data for these systems are
N&I.
Journal of Chemical and Engineering Data, Vol. 40, No. 2, 1995 475
Table 4. Vapor Pressures and Activities of Methanol (1) + Salt (3) at 298.15 K Table 6. Vapor-Liquid Equilibria of Ethanol (1) + Water (2) + CaClz (3) at 298.15 K
~~
molality m$ system (mol-kg- l)
methanol + CaClz 0.328 0.450 0.551 0.725 0.914 1.262 1.493 1.793 1.862 2.258
vapor pressure m/(kPa)
activity a1
16.62 16.54 16.41 16.17 15.77 15.17 14.73 14.03 13.91 13.24
0.980 0.975 0.968 0.954 0.930 0.895 0.869 0.827 0.820 0.781
methanol + NaI 0.316 16.77 0.989 0.663 16.34 0.964 1.255 15.57 0.919 1.586 14.90 0.879 2.159 13.62 0.803 2.753 11.95 0.705 3.404 10.69 0.630
methanol + NH4I 0.346 16.72 0.986 0.675 16.42 0.968 0.943 16.12 0.951 1.296 15.77 0.930 1.639 15.24 0.899 2.337 14.39 0.849 2.757 13.96 0.823
Table 5. Vapor Pressures and Activities of Ethanol (2) + Salt (3) at 298.15 K
molality m$ vapor pressure activity system (mol-kp-l) pzl(kPa) a2
ethanol + CaClz 0.311 7.73 0.983 0.740 7.57 0.962 0.916 7.43 0.944 1.179 7.32 0.930 1.525 7.01 0.891 1.879 6.77 0.861
ethanol + NaI 0.448 7.63 0.970 0.908 7.33 0.932 1.320 7.08 0.900 1.555 6.68 0.849 1.778 6.28 0.798 2.221 5.87 0.746
ethanol + NHJ 0.299 7.77 0.988 0.606 7.59 0.965 0.910 7.43 0.944 1.227 7.24 0.920 1.519 7.01 0.891
shown in Table 7. The vapor-liquid equilibria for all systems show a salting-in effect, and their magnitude of salt effect was CaClz > NaI > NHJ.
4.6. Correlation of Vapor-Liquid Equilibria for Methanol (1) + Ethanol (2) + Salt (3) Using H&la’s Model. Some methods (15) of estimation and correlation for vapor-liquid equilibria in the system in the presence of a salt were already reported. H6la (2) proposed the semiempirical model and equation by a comparatively simple method and gave better results for estimation. However, in this application for some systems, the devia- tion from the observed data was as much as about 20% (16). ,8 in HBla’s equation is treated as a constant value (p = 1.5). Recently, Misima (14) proposed that if p were treated as a parameter, HBla’s equation would be ap- plicable for many systems. In this work, p was treated as a parameter, and it was determined from observed data.
The excess Gibbs energy Q of solvent mixtures contain- ing electrolytes is represented as
(3)
mole fraction
liquid phase vapor phase total pressure X10 3c3 Y1 lood=Yl/Y, pKkPa) 0.064 0.131 0.218 0.318 0.447 0.648 0.756 0.862 0.927
0.025 0.029 0.032 0.036 0.040 0.049 0.050 0.055 0.058
0.386 0.537 0.616 0.671 0.717 0.786 0.827 0.913 0.947
-1.78 2.29 1.82 1.51 0.28
-1.63 -3.16 -0.54 -1.46
4.94 6.00 6.60 6.96 7.24 7.51 7.61 7.68 7.72
100Ab = f1.61
a = CylexPtl - ylcalcd). b A = (1/)/)1? 1=1 I(ylexptl - ylcalcd*)/ yiCalC * . *, Smoothed values from Mishima et al. using Hala’s equation (p = 3.9, E13 = 18.0, A13 = 0.0677, E23 = 54.2, A23 = 3.22, 1\12 = 0.294, A21 = 0.644).
1.0
0.8
0.6
0.4
a2
QO - 0.0 0.2 a4 0.6 0.8 1.0
X1’
Figure 4. Vapor-liquid equilibria of ethanol (1) + water (2) + CaClz (3) at 298.15 K 0, present work 0, Mishima (14); -, smoothed value by HBla’s equation using observed data; xio, mole fraction on a salt-free basis.
where QB is the electrostatic contribution term assumed empirically and is expressed as
Q, = zE,&$ 1
(4)
where E is an adjustable constant for electrostatic long- range interaction, p is an empirical parameter defined by HBla (2) , and i and j represent nonelectrolyte and electro- lyte, respectively.
Q b is the interaction term and is expressed by use of Wilson’s equation as
where A is an adjustable constant for short-range interac- tion, x is mole fraction in the case that complete dissocia- tion of salt in liquid is assumed, and p is 1.5 as in the original description by Hda. Fz and 1 represent components. However, j3 was treated as a parameter in this work. For simplification, Wilson parameters including a salt are assumed as
A, = ASi i = 1, 2 (6)
Only for alcohol + water and alcohol + alcohol systems with added CaClz has its application been confirmed so far (14). It has not been reported yet for the system with other added salts. In this study, isothermal vapor-liquid equi-

476 Journal of Chemical and Engineering Data, Vol. 40, No. 2, 1995
Table 7. Vapor-Liquid Equilibria of Methanol (1) + Ethanol (2) + Salt (3) at 298.15 K
mole fraction
liquid-phase vapor-phase total pressure salt XIO x3 yl 100Sayl~yl pl(kPa)
CaC12
NaI
NHII
0.116 0.117 0.199 0.246 0.129 0.389 0.398 0.127 0.543 0.491 0.109 0.656 0.613 0.108 0.752 0.729 0.089 0.836 0.842 0.103 0.909 0.918 0.104 0.956
0.161 0.136 0.275 0.255 0.108 0.406 0.338 0.102 0.502 0.477 0.111 0.646 0.593 0.099 0.752 0.708 0.110 0.833 0.838 0.104 0.923 0.930 0.098 0.962
0.085 0.110 0.170 0.181 0.107 0.302 0.278 0.104 0.416 0.377 0.099 0.545 0.487 0.097 0.656 0.621 0.094 0.758 0.740 0.093 0.851 0.854 0.088 0.940 0.948 0.082 0.977
-0.13 8.38 0.78 9.20
-3.78 10.32 0.01 11.20
-0.79 12.22 -0.20 13.24 -0.30 14.49
0.09 15.04
-0.48 7.87 -0.10 8.79 -1.15 9.54 -0.47 10.51
0.54 11.68 0.30 12.38 1.26 13.67
-0.11 14.50
10.95 7.82 0.22 8.51
-3.75 9.19 -0.16 10.09
0.11 10.78 -1.18 12.03
0.12 13.18 2.15 14.34 0.46 15.28
Q 6 Y l = (ylexptl - yiCBICd). *, Smoothed values from experimental values using Hala’s equation.
1.0
0.8
0.6
0.4
0.2
0.0
0.0 0.2 0.4 0.6 0.8 1.0
X i
Figure 5. Correlation of salt effect of CaC12, NH41, and NaI on vapor-liquid equilibria of methanol (1) + ethanol (2) a t 298.15 K by Hala’s model: thick line, no salt; -, CaC12; - - -, NaI; - - -, NH4I; xIo , mole fraction on a salt-free basis.
libria were measured for the methanol + ethanol system with not only CaClz added but also NH4I or NaI, and the application of Hala’s model was investigated. The results of correlation are shown in Figure 5. The parameters and the accuracies of correlation for each system are given in Table 8. The calculated results could reproduce the experimental data within f2.1% (average deviation) in the vapor phase for these three systems. Therefore, it is considered that Hala’s model can correlate the vapor- liquid equilibria for the methanol + ethanol system with added NH4I or NaI as well as CaClz with sufficient accuracy.
However, it appears that Hala’s model is neither the simplest nor the most applicable model, since data reduc- tion and determination of parameters require much time
0 1 2 3 4 5 6
P Figure 6. Relation between p value and accuracy of Hdla’s model for solvent + solvent + CaC12: -, ethanol (1) + water (2) + CaClz (3); - - -, methanol (1) + ethanol (2) + CaClz (3); - - -, methanol (1) + water (2) + CaClz (3). Deviation- = ’ (l/N)CI(y;XPtl - yylcd)/yylcd I.
0- 1 2 3 4 5 6
P Figure 7. Relation between /3 value and accuracy of Hdla’s model for solvent + solvent + NHJ: -, ethanol (1) + water (2) + NH4I (3); - - -, methanol (1) + ethanol (2) + NH4I (3). Deviation = (1/jv)xl(ptl - yylcdyycalcd 1 I.
on the correlation analysis for one system. If ,8 was predicted by any method, the vapor-liquid equilibria of a ternary system could be estimated by use of the data of binary systems only, as ternary systems include a binary one.
To predict ,8 value, ,8 vs accuracy of correlation for a ternary system is plotted. Figure 6 shows the relation of ,8 value and deviation for ethanol (1) + water (2), methanol (1) + ethanol (21, and methanol (1) + water (2) (14) containing CaC12. In Figure 6, the ,8 value for each system is the same. Furthermore, Figures 7 and 8 show the deviation plots for methanol (1) + ethanol (2) and ethanol (1) + water (2) in the presence of NH4I and NaI, in which the same tendency is observed. It was found that ,d value mainly depended on the kind of salt, not on the kind of solvent mixture. There is a possibility to estimate salt effect on vapor-liquid equilibria for other solution systems containing salt.
5. Conclusion Salt effect on vapor-liquid equilibria for methanol (1) + ethanol (2) was measured a t 298.15 kt0.05) K using the
experimental apparatus based on a static method. CaClz, NH41, and NaI were chosen as salt additives for this system. The reliability of data obtained in this apparatus was confirmed by a good agreement with the literature data (ethanol + water and ethanol + water + CaC12) and the test of thermodynamic consistency. Any salt used in this study exerted salting-in effect on methanol (1) + ethanol

Journal of Chemical and Engineering Data, Vol. 40, No. 2, 1995 477
Table 8. Correlation Parameters for Vapor-Liquid Equilibria of Methanol (1) + Ethanol (2) + Salt (3) at 298.15 K by Hbla's Model
Wilson parameters av deviation 100Ab system P*. methanol + ethanol + CaCl2 3.8 E13 = 45.44, 1\13 = 0.2818 10.76
E23 = 21.15, 1\23 = 0.0614 A12 = 1.715, 1\21 = 0.4566
methanol + ethanol + NaI E13 = 31.56, 1\13 = 0.2750 E23 = 19.68, 1\23 = 0,0843 1\12 = 1.715,1\12 = 0.4566
2.8
methanol + ethanol + NHJ 2.8 E13 = 15.81, 1\13 = 0.1941 E23 = 19.53,1\23 = 0.0484 1\12 = 1.715, 1\12 = 0.4566
f0 .55
12.12
a These values were optimized by vapor-liquid equilibria of ternary system. A = (l/N&I (ylexpt1 - ylcalcd*)/y~calcd* I .
0 1 2 3 4 5 6
P Figure 8. Relation between /3 value and accuracy of H6la's model for solvent + solvent + NaI: -, ethanol (1) + water (2) + NaI (3); - - -, methanol (1) + water (2) + NaI (3). Deviation = (l/Nxi(y;"Ptl - yylcdyyylcd I.
(2)) the magnitude of which was CaClz > NaI > NHJ The experimental data were correlated by Hala's model, and the calculated result of every system was reproduced with sufficient accuracy. Therefore, the application of Hala's model for the alcohol + alcohol + salt system was con- firmed. From the results of comparison of /3 value obtained in this work, it was considered that B as a parameter mainly depended on the kind of salt, not on the solvent mixture.
Literature Cited (1) Further, W. F. Salt Effect in Distillation: Literature Review 11.
Can. J . Chem. Eng. 1977,55,229-239. (2) Hbla, E. Fluid Phase Equilib. 1983, 13, 311-319. (3) Hbla, E.; Pick, J.; Fried, V.; Vilim, 0. Vapor-Liquid Equilibrium,
2nd ed.; Pergamon Press: Oxford, U.K., 1967. (4) Kojima, K. Kagaku Kogaku 1989,33, 1201-1204. ( 5 ) Iino, M.; Nakae, N.; Sudoh, J.; Hirose, Y. Kagaku Kogaku 1971,
(6) Gibbard, H.; Creek, J. L. J . Chem. Eng. Data 1974,19,308-310. (7) Nagata, I. J . Chem. Eng. Data. 1985, 30, 201-203. (8) Singh, J.; Benson, G. C. Can. J . Chem. 1968, 46, 2065-2069.
35, 1017-1021.
(9) Singh, J.; Pflug, H. D.; Benson, G. C. Can. J . Chem. Eng. 1969, 47,543-546.
(10) Dobson, H. J. E. J . Chem. SOC. 1926, 128, 2886-2890. (11) Hall, D. J.; Mash, C. J; Pemberton, R. C. "NPL Report Chemistly";
(12) Herington, E. F. G. J . h s t . Petrol. 1961, 37, 457-470. (13) Kojima, K.; Moon, H.; Ochi, K. Fluid Phase Equilib. 1990, 56,
(14) Misima, K.; Matsubara, K.; Arai, Y.; Hongo, M. Kagaku Kogaku
(15) Sada, E.; Kito, S.; Morisue, T. Kagaku Kogaku 1973, 37, 983-
Jan 1979 p 95.
269-284.
Ronbunshu 1987,13, 850-853.
986. (16) Lee, L. S.; Tsao, Y. 2.; Yang, B. L. M. Can. J . Chem. Eng. 1991,
69, 788-793.
Received for review August 29, 1994. Revised November 14, 1994. Accepted November 22, 1994."
JE94018OQ @Abstract published in Advance ACS Abstracts, January 15, 1995.