vanguard markets - february 9, 2015 edition
DESCRIPTION
Vanguard Markets features unbiased, in-depth coverage of corporate and market developments across a wide range of business sectors. Every week, Vanguard Markets delivers essential business analysis and commentary on Nigerian companies, regional economies, and global markets. Vanguard Markets is published by Vanguard Media Limited in association with Customs Street Advisors Limited, a specialist communications consultancy.TRANSCRIPT

EN months after its historic initial public offering (IPO), Se-
plat Petroleum has given its shareholders cause to cheer amidst the gloom brought on by the sharp decline in oil prices. In light of depressed crude prices, companies in the sector have been discour-aged by sceptical sharehold-ers and unconvinced bankers from pursuing M&A activities. Seplat has chosen to take the elevator going in the oppo-site direction. It has doubled down on its bets about oil prices’ prospects.
The company announced on Thursday that it had completed the acquisition of two oil blocks, OML53 and OML55, from Chevron and Belema Oil respectively. The timing is not opportun-istic. Seplat has worked as-siduously behind the scenes for many months, often in contentious, litigious circum-stances, to seal these deals. Its perseverance has paid off.
The blocks are located in the shallow waters of the Niger Delta. Under the dis-closed terms of the deal, Se-plat will pay $259.4m for a 40 per cent stake in OML53 and $132.2mn for a 22.5% inter-est in OML55. Seplat’s stake in OML55 was indirectly ac-quired though its purchase of a 56.25 per cent stake in Belema Oil, which has bought a 40 per cent interest in the block from Chevron.
Ildar Davletshin and Temilade Esho, oil and gas sector analysts at Re-
naissance Capital, view the transactions as ‘a sig-nificant and positive devel-
opment for Seplat.’ In their preliminary assessment of the deals, they note three
key takeaways. One, OML53 and OML55 will boost Se-plat’s reserves by about 65 per cent. Two, the blocks should enable the company to double oil production as soon as they reach capac-ity within four years. Three, they should help Seplat in-crease EBITDA within the range of 60-70 per cent by 2018, and add about 20 per cent to its net asset value.
There is also a sense of re-lief that Seplat’s acquisition train is on the move again after false starts in 2014. In its report for the half year period ended June 30, 2014, it explained that its bids for OML 29 and OML24, which were put up for sale by Shell had been unsuccessful because it stuck to ‘price dis-cipline’ and did not put for-ward ‘the highest price offer’.
The news of its latest ac-quisitions comes on the back of announcements in Janu-ary that it successfully refi-nanced its existing debt fa-cilities and had commenced talks with Afren, the FTSE 250 listed independent oil exploration and production company.
The oil company received $1 billion from two consor-tia of banks, one local, and the other foreign. The funds were to be used to repay $552 million in existing debt, with the balance held in reserve to seize advantage of new busi-ness opportunities. ;
Vanguard Markets | Monday, February 09, 2015 | Issue 028
FIXED INCOME & FOREX
Seplat’s counterintuitive acquisitions win market applause
Source: FMDQ
T
Currency Central Rate
SWISS FRANC 181.7097
YEN 1.4276
WAUA 237.1180
RIYAL 44.6286
DANISH KRONE 25.7585
SDR 237.3978
FOREX RATES
AGAINST THE GRAIN
Seplat drill technicians working on a rig
MoFr167.3
167.4
167.6
167.5
167.7167.50
Tu We Th Fr
$/N
MoFr251.0
252.5
255.5
254.0
257.0256.9785
Tu We Th Fr
£/N
MoFr189.0
189.8
191.4
190.6
192.2191.8043
Tu We Th Fr
Euro/N
MoFr26.20
26.40
26.80
26.60
27.00
Tu We Th Fr
CNY/N 26.8232
MoFr0.27
0.28
0.30
0.29
0.31
Tu We Th Fr
CFA/N 0.2822
Source: Thomson Reuters

OULD Ecobank T r a n s n a t i o n a l Incorporated be
dealing with a case of bad news goose-stepping in pairs on its manicured front lawn? On Tuesday, a labour court sitting in Lomé, the Togolese capital, awarded $11.6 mil-lion to Thierry Tanoh, its ousted chief executive, for wrongful dismissal. Tanoh was removed under a cloud in March 2014 for falsification of financial statements and governance failures at the pan African bank.
The following day, Febru-ary 4, the International Monetary Fund released a report, Pan-African Banks - Opportunities and Challeng-es for Cross-Border Over-sight, damning the financial institution on critical points.
The red flags pop-up eve-rywhere in the IMF report: rapid expansion was not been matched by commensurate strengthening of governance standards, enjoyment of the status of a bank holding com-pany registered in Togo, ETI is not formally regulated but is supervised by the Commis-
sion Bancaire (Banking Com-mission) of the West African Monetary Union, its financial performance differs across regions, its cross-border risk transfer mechanism is opaque, and although the Ni-gerian subsidiary reported a decent improvement in capi-tal position and profitability in H1 2014, its ‘true position may be less positive based on several risk factors’.
The report goes on to list
the risk factors shadowing the Nigerian subsidiary, the biggest in the group. It reads like a parade of the usual sus-pects. Weak capital position, reckless lending practices, high operating costs, unsta-ble deposit base, and lack of confidence in the manage-ment team. No one will fault the authors of mincing words.
The verdict in Lomé comes on the heels of another one delivered by a court in Abid-
jan court in January order-ing ETI and Public Invest-ment Corporation, the quasi-public South African investment entity and a ma-jor shareholder in the bank, to pay the ex-CEO $15m for defamation of character.
In strongly worded rebut-tals, Ecobank rejected the two judgments.
‘ETI does not accept the legitimacy of the Togolese court’s ruling because the
court does not have legal ju-risdiction over Mr Tanoh’s employment contract. Mr. Tanoh signed this contract before assumption of his post as Ecobank Group CEO in July 2012 in the full knowl-edge that it was governed by English law. The contract expressly provides that all disputes shall be settled by international arbitration in London by an arbitrator ap-pointed by the President of the International Chamber of Commerce in Paris. The con-tract grants exclusive juris-diction to the English courts in relevant matters. Mr. Tanoh, an Ivorian national with permanent residence in the United States during his tenure as ETI Group CEO, rejected these express provi-sions of his contract, prefer-ring instead to pursue litiga-tion in a Togolese court for reasons best known to him.’
An unnamed senior official was quoted in London’s Fi-nancial Times saying that ETI would call ‘a special board meeting next week to review these issues and to make a decision over what is best for
the institution and whether we should move to a jurisdic-tion where there is a secure legal environment.’ Such threats are not made lightly.
One sentence in the re-lease hints obliquely that an out of court settlement may be in the offing. ‘Eco-bank rejects the excessive sums of money that he is demanding in local courts in Togo and Cote d’Ivoire.’ Does this suggest that ETI may be prepared to pay a reasonable severance package to end the matter?
Ecobank also dismissed the IMF report as obsolete. ‘The report, which contains some inaccuracies, is roughly 18 months out of date as regards some of its references to the Ecobank Group… It would be wrong for the report to inad-vertently convey the percep-tion that past governance is-sues still exist at Ecobank. A lot has taken place between the preparation of the afore-mentioned IMF report and the present time.’
Some say that there is no smoke without fire. ;
HE i-word is on eve-ryone’s lips. Infla-tion has a directly
inverse relationship with belt holes: the higher inflation rises, the tighter belt holes are hooked. In the January edition of its Inflation Watch report, analysts at FSDH Merchant Bank, point out
that international food prices as measured by the Food and Agriculture Organization’s Food Price Index (FFPI) de-clined 1.9 per cent in January 2015, compared with Decem-ber 2014, and 10.1 per cent against the January 2014 fig-ure. The report forecasts that the official Nigerian Bu-
reau of Statistics’ inflation rate for January will be 8 per cent, unchanged over the De-cember 2014 figure, and same as the January 2014 figure. So far, so good. But with the see-saw in exchange rates, this could turn out to be the calm before the storm. ;
BUSINESSVM2
REWIND
VM | Monday, February 09, 2015 | Issue 028
Inflation vigilance
Ecobank in the crosshairsC
T
EDITOR: MIDENO BAYAGBON
GROUP BUSINESS EDITOR: OMOH GABRIEL
CONTENT DIRECTION: OBIORA TABANSI ONYEASO
DESIGN & ILLUSTRATION: PUBLICAN MEDIA
Vanguard Markets features unbiased, in-depth coverage of corporate and market developments across a wide range of business sectors.Every week, Vanguard Markets delivers essential business analysis and commentary on Nigerian companies, regional economies, and global markets. Vanguard Markets is published by Vanguard Media Limited in associa-tion with Customs Street Advisors Limited, a specialist communications consultancy.
Vanguard Media Limited, Vanguard Avenue, Kirikiri Canal, P.M.B.1007, Apapa.
Website: www.vanguardngr.com
ISSN 0794-652X
Published by
In Association With
HE Mauritius-domi-ciled Synergy Part-ners Equity Fund
is wasting little time to deploy its war chest. Last week, Syn-ergy Capital Managers, the fund manager announced that it had made an undisclosed but significant investment in NetPlus Strategic Sales and Advisory Limited. The two-year old startup has established itself as a serious player in the e-commerce, and e-infrastructure space under Wole Faroun, its resource-ful founder. NetPlus’ technol-ogy underpins the company’s own WebMallNG.com storefront, and is considered the most robust indigenously developed e-commerce plat-form in the sub-Saharan re-gion excluding South Africa. WebMallNG.com’s competi-tors in the B2B arena include Kaymu and Konga. The company counts Diamond Bank, FCMB, Fidelity Bank, and UBA among its clients. NetPlus is also ag-gressively building out its presence in e-payments to go head-on against PayPal, which entered the Nigerian
market in 2014 in partner-ship with First Bank. Faroun expressed his delight at attracting institutional capital interest within its rela-tively short operating history. SPEF’s capital injection would help NetPlus to ‘grow its brand and strengthen partnerships with key players the in the e-commerce and e-payments space as well as providing value from a governance and management perspective.’Akintoye Akindele, a part-
ner in Synergy Capital Managers, the fund man-ager, said that NetPlus ‘solves a critical need in the market-place, and is strategically posi-tioned to unlock the enormous potential of e-commerce in Nigeria first, and subsequent-ly across the region.’Fundraising for SPEF is scheduled for its second close in the second quarter of the year. The fund is targeting $75m. NetPlus is SPEF’s first investment. ;
Synergy Capital Managers bets on e-commerce with Netplus investment
T
Ecobank branch
Source: FSDH Merchant Bank and National Bureau of Statistics

MARKET DATA VM3VM | Monday, February 09, 2015 | Issue 028
LEGEND
15-week trading bar:This bar shows the volume of the company’s shares traded during the 5 most recent weeks. Each alternate colour bar represents a consecutive week. The bar is to be read from left to right. The first bar on the left (light blue) represents the traded volume five weeks ago. The next bar (grey) represents the volume 4 weeks ago. The 5th and last bar (light blue) signifies the volume of shares exchanged last week. The purpose of the Weekly Trading bar is to give readers an instant view of trading volumes as they compare on a week-by-week basis.
2Liquidity Rating: This indicates the level of demand for a company’s shares based on the number of deals rather than volume done over the past week. Stocks are graded accord-ing 5 categories. Blue spheres are used to represent liquidity. • Category 5: This is the highest liquidity rating shown by 5 blue spheres.
Stocks that have traded more than 20 deals per day on at least 4 days in the past week are awarded this score
• Category 4: This is shown by 4 blue spheres. It indicates that the stock has
traded between 12 to 19 deals per day on at least 4 days in the past week• Category 3: Shown with 3 spheres, this liquidity classification represents
those stocks that have traded 8 to 11 deals per day on at least 4 days in the past week
• Category 2: Shown with 2 spheres it identifies those stocks that traded 4 to 7 deals per day on at least 4 days in the past week
• Category 1: This is shown by one blue sphere to represent stocks on which 3 deals and/or below were traded per day on at least 4 days in the week.
SECTOR PRICE CHANGES – FEB 02 – 09, 2015MARKET REVIEW – FEBRUARY 02 – 09, 2015
TRADING UPDATE
Agriculture 3 2 0Conglomerates 1 3 1
Construction/Real Estate 1 6 2Consumer Goods 10 13 8
Financial Services 7 36 14Healthcare 3 5 2
ICT 1 10 0Industrial Goods 4 13 4
Natural Resources 0 4 1Oil & Gas 5 4 2Services 5 8 5
Declined Unchanged Advanced
TOP DECLINERS WTD
CONOIL PLC -9.97
VITAFOAM NIGERIA PLC -9.47
VONO PRODUCTS PLC -8.55
FLOUR MILLS NIGERIA PLC -7.69
PRESCO PLC -6.77
TOP GAINERS WTD
NATIONAL SALT COMPANY OF NIGERIA PLC 16.15
ACCESS BANK OF NIGERIA PLC 15.83
N.E.M INSURANCE CO.(NIG) PLC 11.32
SEPLAT PETROLEUM DEVELOPMENT COMPANY LTD 9.39
DIAMOND BANK PLC 8.94
TOP DECLINERS WTD
ETERNA PLC -5.62
EVANS MEDICAL PLC -5.29
UNION BANK OF NIGERIA PLC -5.26
TRANS NATIONWIDE EXPRESS PLC -5
UNION DICON SALT PLC -5
TOP GAINERS WTD
R. T. BRISCOE (NIG.) PLC 34.43
DANGOTE FLOUR MILLS PLC 33.33
UACN PROPERTY DEVELOPMENT CO. PLC 30.78
IKEJA HOTEL PLC 20.72
CHAMPION BREWERIES PLC 16.9
DASHBOARD
TickerFriday 5-day 4-Week
5-Week trading1
52-Week price rangeYtD Liquidity
Rating2Close Change, % Volume Open Week Hi Week Lo Change, % Volume Open Change, % Volume Low Close ( ) High
7UP 152.86 -2.64% 107 153.00 157.60 146.70 -0.09% 17,943 160.00 -4.46% 67,731 74.97 197.94 -3.86% ABCTRANS 0.55 0.00% 2,600 0.51 0.55 0.51 7.84% 12,096 0.53 3.77% 56,761 0.51 0.92 -3.51%
ACCESS 6.00 5.45% 463,964 5.18 6.08 5.11 15.83% 2,929,795 5.25 14.29% 8,977,280 4.50 10.18 -4.61% AGLEVENT 1.26 0.00% 8 1.26 1.26 1.21 0.00% 78 1.31 -3.82% 10,896 1.19 1.86 -3.82%
AIICO 0.81 -1.22% 1,523 0.80 0.84 0.76 1.25% 61,821 0.78 3.85% 585,306 0.65 0.94 -3.57% AIRSERVICE 1.71 -2.29% 290,530 1.71 1.75 1.71 0.00% 291,253 1.62 5.56% 299,148 1.56 3.26 0.59%ASHAKACEM 20.24 0.00% 323 20.24 20.80 20.24 0.00% 4,450 22.40 -9.64% 34,006 13.87 34.60 -2.74% BETAGLAS 31.49 4.97% 60,800 30.00 31.49 30.00 4.97% 72,800 26.40 19.28% 94,008 15.49 31.49 19.28%CADBURY 38.24 -6.73% 1,647 41.12 41.50 38.24 -7.00% 5,059 39.90 -4.16% 23,300 33.10 86.50 -8.95%
CAP 37.00 -4.52% 882 38.75 39.89 36.86 -4.52% 3,087 37.60 -1.60% 14,102 33.01 49.00 -0.80% CCNN 9.50 2.15% 216 9.37 9.66 9.13 1.39% 6,765 9.30 2.15% 25,597 8.00 15.98 -3.85%
CONOIL 32.60 5.16% 1,117 32.68 34.40 29.50 -0.24% 6,221 36.21 -9.97% 11,910 29.50 79.51 -5.23%CONTINSURE 0.87 -1.14% 24,480 0.90 0.94 0.87 -3.33% 32,520 0.97 -10.31% 345,790 0.80 1.24 -10.31%COURTVILLE 0.50 0.00% 465 0.50 0.50 0.50 0.00% 4,498 0.50 0.00% 20,429 0.50 0.81 0.00%CUSTODYINS 4.00 0.00% 87,753 3.91 4.00 3.80 2.30% 299,696 3.57 12.04% 754,745 1.90 4.35 13.96%
CUTIX 1.54 0.00% 0 1.55 1.63 1.48 -0.65% 3,672 1.36 13.24% 13,557 1.21 2.24 14.93%DANGCEM 159.80 1.11% 2,060 156.00 162.94 156.00 2.44% 50,042 158.65 0.72% 226,256 150.10 250.02 -15.89%
DANGFLOUR 4.00 10.19% 7,836 3.04 4.00 3.00 31.58% 164,199 4.32 -7.41% 336,664 2.88 9.97 -9.09% DANGSUGAR 6.90 -0.72% 34,738 6.82 8.26 6.18 1.17% 1,120,435 5.71 20.84% 2,268,830 4.70 12.00 14.24% DIAMONDBNK 3.95 -1.25% 42,748 3.58 4.21 3.47 10.34% 919,090 4.80 -17.71% 3,480,116 3.47 7.05 -27.52%
ETERNA 2.54 0.79% 3,000 2.67 2.80 2.52 -4.87% 11,195 2.85 -10.88% 42,492 2.52 5.35 -15.05% ETI 16.61 0.18% 688,618 16.18 16.80 15.50 2.66% 1,242,597 16.25 2.22% 2,400,686 12.40 20.28 -8.74%
FBNH 7.00 0.14% 838,084 7.09 7.40 6.95 -1.27% 3,189,574 7.99 -12.39% 8,014,656 6.95 16.52 -19.54% FCMB 2.09 0.00% 186,041 2.05 2.15 1.99 1.95% 775,817 2.11 -0.95% 3,760,117 1.98 4.64 -16.40%
FIDELITYBK 1.27 -0.78% 45,067 1.26 1.33 1.25 0.79% 457,285 1.52 -16.45% 3,900,405 1.25 2.40 -20.63% FIDSON 3.20 -3.03% 18,986 3.26 3.30 3.20 -1.84% 71,396 3.35 -4.48% 183,842 2.32 3.90 -13.75%
FLOURMILL 34.20 -5.26% 5,902 38.42 38.42 34.20 -10.98% 27,632 35.15 -2.70% 510,126 33.70 82.73 -12.62% FO 210.00 -7.34% 504 230.00 230.00 210.00 -8.70% 3,608 230.00 -8.70% 69,221 81.21 259.94 -7.53%
GLAXOSMITH 40.21 -0.35% 11 38.68 44.00 38.68 3.96% 2,980 42.00 -4.26% 41,095 38.22 72.45 -15.19% GUARANTY 21.00 -4.11% 147,249 20.03 23.00 19.80 4.84% 745,858 20.55 2.19% 4,680,282 17.05 31.80 -16.60% GUINNESS 128.90 -0.08% 194 129.99 130.00 125.00 -0.84% 4,340 130.21 -1.01% 235,318 115.00 219.25 -22.02%
HONYFLOUR 3.07 -2.23% 1,050 3.00 3.46 3.00 2.33% 13,286 3.06 0.33% 62,655 2.87 4.50 -6.97% INTBREW 20.55 -4.42% 83 20.90 22.19 20.50 -1.67% 11,457 21.39 -3.93% 83,690 20.05 32.20 -7.47%JBERGER 42.65 -1.57% 1,516 44.80 46.10 42.65 -4.80% 4,018 52.03 -18.03% 35,457 42.65 76.45 -25.99%
LINKASSURE 0.50 0 0 0.50 0.00% 380 0.50 0.50 0.00%MANSARD 2.95 -0.34% 415 3.00 3.00 2.86 -1.67% 17,093 3.05 -3.28% 79,523 1.96 3.79 -5.14%MAYBAKER 1.43 -0.69% 233 1.44 1.50 1.37 -0.69% 6,862 1.51 -5.30% 20,024 1.33 2.48 -5.30%
MOBIL 157.60 -0.25% 200 157.00 158.00 151.06 0.38% 852 157.05 0.35% 3,555 112.54 182.00 1.50% MRS 48.02 0.00% 0 48.02 48.02 48.02 0.00% 81 50.54 -4.99% 1,311 41.84 70.00 -4.99%
NAHCO 4.75 -1.25% 1,151 4.80 4.90 4.66 -1.04% 17,545 4.88 -2.66% 97,570 3.56 6.18 -5.00% NASCON 7.55 0.67% 32,649 6.42 8.12 6.30 17.60% 162,486 6.40 17.97% 324,189 5.68 13.99 20.41%
NB 141.81 -1.49% 66,625 142.02 151.99 141.81 -0.15% 184,068 147.00 -3.53% 562,799 128.50 189.00 -13.00% NEIMETH 0.72 -2.70% 596 0.72 0.74 0.71 0.00% 1,712 0.70 2.86% 29,249 0.67 2.08 -5.26%
NEM 0.57 -3.39% 5,020 0.53 0.59 0.53 7.55% 33,353 0.60 -5.00% 166,982 0.52 0.90 -12.31% NESTLE 815.25 -1.78% 56 800.00 830.00 797.00 1.91% 4,389 853.61 -4.49% 32,049 770.61 1,200.00 -18.11%
NIGERINS 0.50 0.00% 100 0.50 0.50 0.50 0.00% 5,718 0.50 0.00% 11,918 0.50 0.54 0.00%NNFM 18.95 0 18.95 18.95 18.95 0.00% 18 17.15 10.50% 93 17.15 23.08 9.22%OANDO 14.93 -2.67% 10,550 15.30 15.80 14.93 -2.42% 1,202,826 15.25 -2.10% 10,277,946 13.18 36.89 -14.69%
OKOMUOIL 27.90 6.45% 444 28.69 28.69 26.21 -2.75% 10,552 24.90 12.05% 122,594 23.20 42.98 11.60% PAINTCOM 1.43 0.00% 18 1.43 1.50 1.43 0.00% 643 1.47 -2.72% 2,977 1.33 2.00 -2.72%PORTPAINT 3.83 -4.96% 100 3.75 4.03 3.75 2.13% 1,129 4.07 -5.90% 12,553 3.52 5.77 3.23%
PRESCO 30.45 1.53% 2,110 31.06 32.50 29.00 -1.96% 8,894 26.10 16.67% 269,310 20.88 49.00 18.39% PRESTIGE 0.50 0 0.50 0.50 0.50 0.00% 125 0.50 0.00% 10,812 0.50 0.64 0.00%
PZ 27.36 -2.63% 1,039 29.64 32.67 27.01 -7.69% 83,494 24.53 11.54% 227,463 16.60 41.06 15.20% REDSTAREX 3.70 -6.33% 1,479 3.60 3.95 3.60 2.78% 8,407 4.00 -7.50% 20,986 3.44 5.35 -1.60%ROYALEX 0.50 -3.85% 859 0.50 0.52 0.50 0.00% 965 0.51 -1.96% 62,953 0.50 0.65 -3.85%
RTBRISCOE 0.82 3.80% 5,687 0.61 0.82 0.58 34.43% 44,764 0.84 -2.38% 71,159 0.58 1.38 -2.38% SEPLAT 333.90 -4.76% 360 305.23 350.59 305.00 9.39% 767 314.99 6.00% 52,485 252.93 735.00 -5.01%
SKYEBANK 1.97 -1.50% 371,850 1.97 2.14 1.95 0.00% 935,365 2.32 -15.09% 1,506,135 1.95 4.16 -22.13% SOVRENINS 0.50 0.00% 198 0.50 0.50 0.50 0.00% 218 0.50 0.00% 4,985 0.50 0.50 0.00%STANBIC 24.23 -4.30% 2,434 26.14 26.94 24.23 -7.31% 44,851 27.00 -10.26% 551,593 19.00 35.00 -10.52%
STERLNBANK 2.35 -4.08% 12,344 2.32 2.48 2.32 1.29% 263,199 2.49 -5.62% 682,099 2.09 2.74 -2.89% TOTAL 142.41 -3.13% 84 147.98 149.97 142.41 -3.76% 648 148.00 -3.78% 5,873 141.50 195.50 -4.43%
TRANSCORP 2.80 -3.11% 116,382 2.82 3.00 2.75 -0.71% 818,912 3.10 -9.68% 3,074,424 2.55 7.08 -12.77% UAC-PROP 11.35 3.28% 541 9.11 11.94 9.11 24.59% 14,408 9.25 22.70% 58,415 8.09 21.31 18.60%
UACN 40.90 2.25% 12,185 37.02 40.90 37.00 10.48% 30,280 27.60 48.19% 308,976 26.00 67.85 20.29% UBA 3.42 -3.12% 186,406 3.50 3.70 3.42 -2.29% 991,660 3.79 -9.76% 3,366,038 3.11 8.26 -20.83%
UBCAP 1.45 -2.03% 10,326 1.44 1.50 1.43 0.69% 95,598 1.58 -8.23% 467,460 1.38 3.04 -13.69% UBN 9.00 0.00% 8,041 9.23 9.68 8.93 -2.49% 25,212 8.03 12.08% 150,297 6.48 10.89 5.88%
UNILEVER 35.50 -1.93% 33,719 34.00 36.20 34.00 4.41% 55,354 33.00 7.58% 734,225 27.00 55.00 -5.56% UNITYBNK 0.50 0 0.50 0.50 0.50 0.00% 34,567 0.50 0.00% 61,648 0.50 0.50 0.00%VITAFOAM 3.25 -4.97% 2,552 3.59 3.63 3.23 -9.47% 82,583 3.82 -14.92% 273,782 3.23 5.15 -15.14%
WAPCO 88.80 4.47% 5,829 82.00 89.00 82.00 8.29% 41,481 80.07 10.90% 89,985 66.50 136.73 9.63% WAPIC 0.51 0.00% 11,222 0.51 0.53 0.50 0.00% 243,646 0.60 -15.00% 1,113,785 0.50 1.05 -20.31%
WEMABANK 0.94 3.30% 1,867 0.93 0.95 0.90 1.08% 42,654 0.97 -3.09% 300,744 0.85 1.21 2.17% ZENITHBANK 16.28 -6.92% 391,783 16.13 18.41 15.90 0.93% 1,283,061 16.43 -0.91% 5,172,305 14.54 25.80 -9.56%
MARKET SNAPSHOT
MARKET DATAVM4 VM | Monday, February 09, 2015 | Issue 028
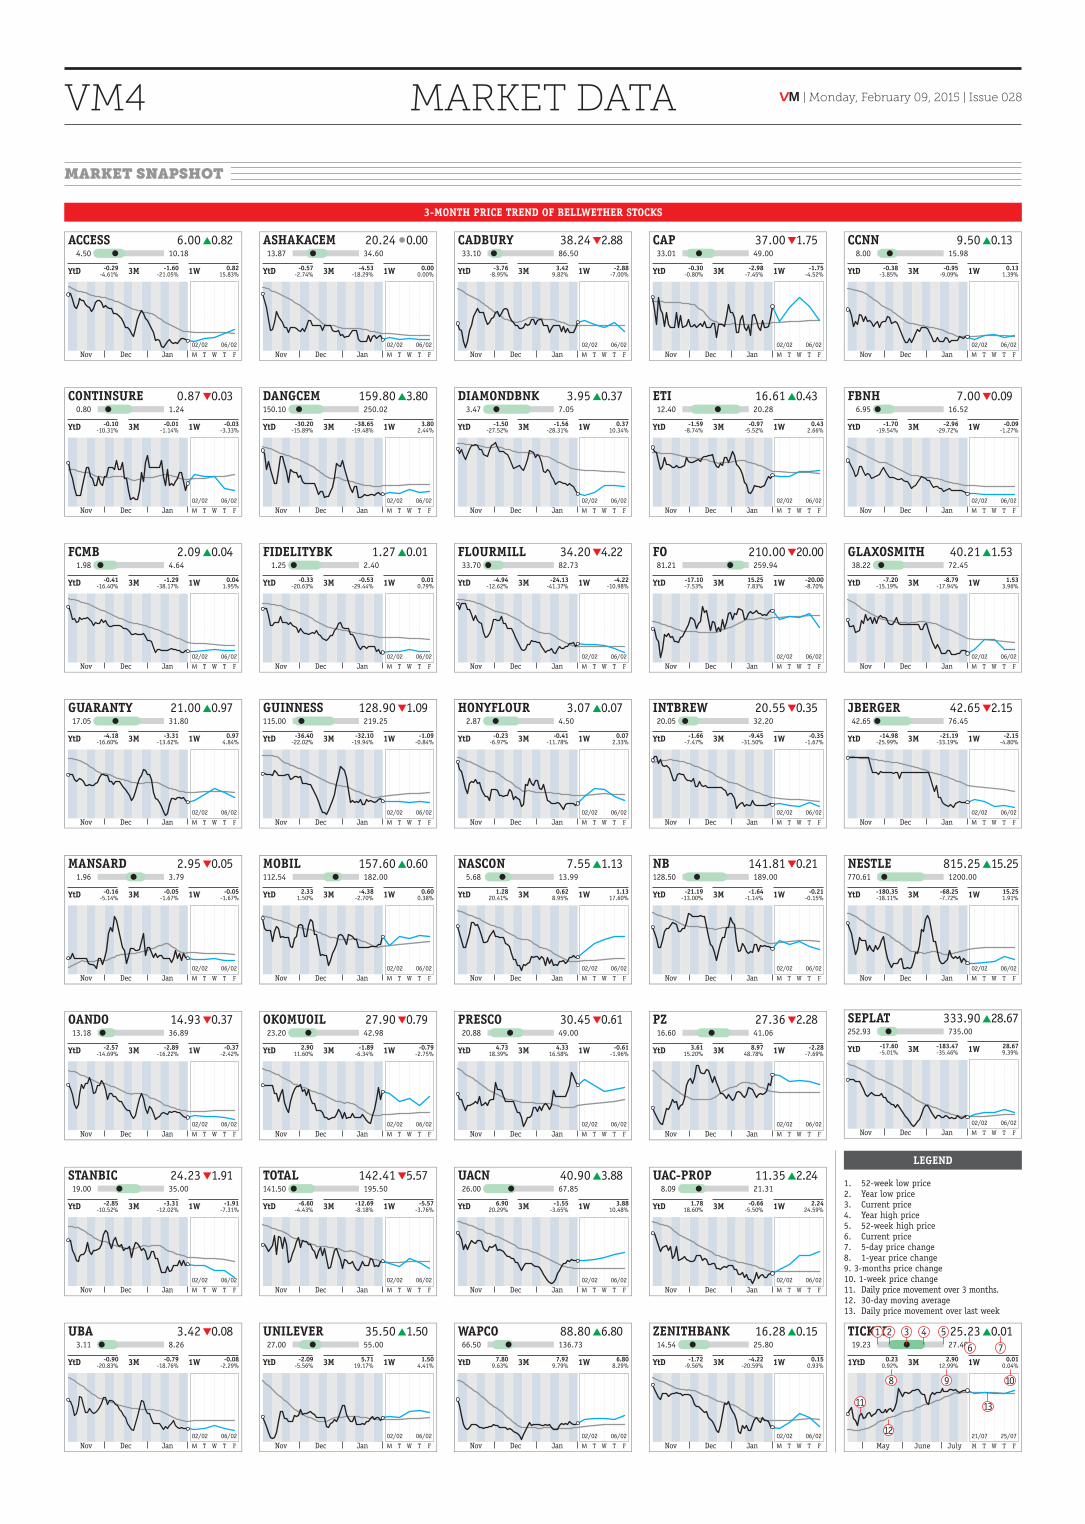
3-MONTH PRICE TREND OF BELLWETHER STOCKS
LEGEND
ACCESS 6.0010.184.50
YtD -0.29 -1.60 0.8215.83%3M 1W
0.82
Nov Dec Jan
-4.61% -21.05%
02/02
M T W T F
06/02
ASHAKACEM 20.2434.6013.87
YtD -0.57 -4.53 0.000.00%3M 1W
0.00
Nov Dec Jan
-2.74% -18.29%
02/02
M T W T F
06/02
CADBURY 38.2486.5033.10
YtD -3.76 3.42 -2.88-7.00%3M 1W
2.88
Nov Dec Jan
-8.95% 9.82%
02/02
M T W T F
06/02
CAP 37.0049.0033.01
YtD -0.30 -2.98 -1.75-4.52%3M 1W
1.75
Nov Dec Jan
-0.80% -7.45%
02/02
M T W T F
06/02
CCNN 9.5015.988.00
YtD -0.38 -0.95 0.131.39%3M 1W
0.13
Nov Dec Jan
-3.85% -9.09%
02/02
M T W T F
06/02
CONTINSURE 0.871.240.80
YtD -0.10 -0.01 -0.03-3.33%3M 1W
0.03
Nov Dec Jan
-10.31% -1.14%
02/02
M T W T F
06/02
FCMB 2.094.641.98
YtD -0.41 -1.29 0.041.95%3M 1W
0.04
Nov Dec Jan
-16.40% -38.17%
02/02
M T W T F
06/02
GUARANTY 21.0031.8017.05
YtD -4.18 -3.31 0.974.84%3M 1W
0.97
Nov Dec Jan
-16.60% -13.62%
02/02
M T W T F
06/02
MANSARD 2.953.791.96
YtD -0.16 -0.05 -0.05-1.67%3M 1W
0.05
Nov Dec Jan
-5.14% -1.67%
02/02
M T W T F
06/02
OANDO 14.9336.8913.18
YtD -2.57 -2.89 -0.37-2.42%3M 1W
0.37
Nov Dec Jan
-14.69% -16.22%
02/02
M T W T F
06/02
STANBIC 24.2335.0019.00
YtD -2.85 -3.31 -1.91-7.31%3M 1W
1.91
Nov Dec Jan
-10.52% -12.02%
02/02
M T W T F
06/02
UBA 3.428.263.11
YtD -0.90 -0.79 -0.08-2.29%3M 1W
0.08
Nov Dec Jan
-20.83% -18.76%
02/02
M T W T F
06/02
DANGCEM 159.80250.02150.10
YtD -30.20 -38.65 3.802.44%3M 1W
3.80
Nov Dec Jan
-15.89% -19.48%
02/02
M T W T F
06/02
FIDELITYBK 1.272.401.25
YtD -0.33 -0.53 0.010.79%3M 1W
0.01
Nov Dec Jan
-20.63% -29.44%
02/02
M T W T F
06/02
GUINNESS 128.90219.25115.00
YtD -36.40 -32.10 -1.09-0.84%3M 1W
1.09
Nov Dec Jan
-22.02% -19.94%
02/02
M T W T F
06/02
MOBIL 157.60182.00112.54
YtD 2.33 -4.38 0.600.38%3M 1W
0.60
Nov Dec Jan
1.50% -2.70%
02/02
M T W T F
06/02
OKOMUOIL 27.9042.9823.20
YtD 2.90 -1.89 -0.79-2.75%3M 1W
0.79
Nov Dec Jan
11.60% -6.34%
02/02
M T W T F
06/02
TOTAL 142.41195.50141.50
YtD -6.60 -12.69 -5.57-3.76%3M 1W
5.57
Nov Dec Jan
-4.43% -8.18%
02/02
M T W T F
06/02
UNILEVER 35.5055.0027.00
YtD -2.09 5.71 1.504.41%3M 1W
1.50
Nov Dec Jan
-5.56% 19.17%
02/02
M T W T F
06/02
DIAMONDBNK 3.957.053.47
YtD -1.50 -1.56 0.3710.34%3M 1W
0.37
Nov Dec Jan
-27.52% -28.31%
02/02
M T W T F
06/02
FLOURMILL 34.2082.7333.70
YtD -4.94 -24.13 -4.22-10.98%3M 1W
4.22
Nov Dec Jan
-12.62% -41.37%
02/02
M T W T F
06/02
HONYFLOUR 3.074.502.87
YtD -0.23 -0.41 0.072.33%3M 1W
0.07
Nov Dec Jan
-6.97% -11.78%
02/02
M T W T F
06/02
NASCON 7.5513.995.68
YtD 1.28 0.62 1.1317.60%3M 1W
1.13
Nov Dec Jan
20.41% 8.95%
02/02
M T W T F
06/02
PRESCO 30.4549.0020.88
YtD 4.73 4.33 -0.61-1.96%3M 1W
0.61
Nov Dec Jan
18.39% 16.58%
02/02
M T W T F
06/02
UACN 40.9067.8526.00
YtD 6.90 -1.55 3.8810.48%3M 1W
3.88
Nov Dec Jan
20.29% -3.65%
02/02
M T W T F
06/02
WAPCO 88.80136.7366.50
YtD 7.80 7.92 6.808.29%3M 1W
6.80
Nov Dec Jan
9.63% 9.79%
02/02
M T W T F
06/02
ETI 16.6120.2812.40
YtD -1.59 -0.97 0.432.66%3M 1W
0.43
Nov Dec Jan
-8.74% -5.52%
02/02
M T W T F
06/02
FO 210.00259.9481.21
YtD -17.10 15.25 -20.00-8.70%3M 1W
20.00
Nov Dec Jan
-7.53% 7.83%
02/02
M T W T F
06/02
INTBREW 20.5532.2020.05
YtD -1.66 -9.45 -0.35-1.67%3M 1W
0.35
Nov Dec Jan
-7.47% -31.50%
02/02
M T W T F
06/02
NB 141.81189.00128.50
YtD -21.19 -1.64 -0.21-0.15%3M 1W
0.21
Nov Dec Jan
-13.00% -1.14%
02/02
M T W T F
06/02
PZ 27.3641.0616.60
YtD 3.61 8.97 -2.28-7.69%3M 1W
2.28
Nov Dec Jan
15.20% 48.78%
02/02
M T W T F
06/02
UAC-PROP 11.3521.318.09
YtD 1.78 -0.66 2.2424.59%3M 1W
2.24
Nov Dec Jan
18.60% -5.50%
02/02
M T W T F
06/02
ZENITHBANK 16.2825.8014.54
YtD -1.72 -4.22 0.150.93%3M 1W
0.15
Nov Dec Jan
-9.56% -20.59%
02/02
M T W T F
06/02
TICKER 25.2327.4019.23
1YtD 0.230.92%
2.9012.99%
0.010.04%3M 1W
0.01
May June July21/07
M T W T F
25/07
FBNH 7.0016.526.95
YtD -1.70 -2.96 -0.09-1.27%3M 1W
0.09
Nov Dec Jan
-19.54% -29.72%
02/02
M T W T F
06/02
GLAXOSMITH 40.2172.4538.22
YtD -7.20 -8.79 1.533.96%3M 1W
1.53
Nov Dec Jan
-15.19% -17.94%
02/02
M T W T F
06/02
JBERGER 42.6576.4542.65
YtD -14.98 -21.19 -2.15-4.80%3M 1W
2.15
Nov Dec Jan
-25.99% -33.19%
02/02
M T W T F
06/02
NESTLE 815.251200.00770.61
YtD -180.35 -68.25 15.251.91%3M 1W
15.25
Nov Dec Jan
-18.11% -7.72%
02/02
M T W T F
06/02
SEPLAT 333.90735.00252.93
YtD -17.60 -183.47 28.679.39%3M 1W
28.67
Nov Dec Jan
-5.01% -35.46%
02/02
M T W T F
06/02
3 4 5
8
12
9 10
11
6
13
7
21
1. 52-week low price2. Year low price3. Current price4. Year high price5. 52-week high price6. Current price7. 5-day price change8. 1-year price change9. 3-months price change10. 1-week price change11. Daily price movement over 3 months.12. 30-day moving average13. Daily price movement over last week