van der waals density functionals applied to solids - ucl · physical review b 83, 195131 (2011)...
TRANSCRIPT

PHYSICAL REVIEW B 83, 195131 (2011)
Van der Waals density functionals applied to solids
Jirı Klimes,1 David R. Bowler,2 and Angelos Michaelides1,*
1London Centre for Nanotechnology and Department of Chemistry, University College London, London WC1E 6BT, UK2London Centre for Nanotechnology and Department of Physics and Astronomy, University College London, London WC1E 6BT, UK
(Received 1 February 2011; revised manuscript received 15 April 2011; published 25 May 2011)
The van der Waals density functional (vdW-DF) of M. Dion et al. [Phys. Rev. Lett. 92, 246401 (2004)] isa promising approach for including dispersion in approximate density functional theory exchange-correlationfunctionals. Indeed, an improved description of systems held by dispersion forces has been demonstrated in theliterature. However, despite many applications, standard general tests on a broad range of materials includingtraditional “hard” matter such as metals, ionic compounds, and insulators are lacking. Such tests are important notleast because many of the applications of the vdW-DF method focus on the adsorption of atoms and molecules onthe surfaces of solids. Here we calculate the lattice constants, bulk moduli, and atomization energies for a rangeof solids using the original vdW-DF and several of its offspring. We find that the original vdW-DF overestimateslattice constants in a similar manner to how it overestimates binding distances for gas-phase dimers. However,some of the modified vdW functionals lead to average errors which are similar to those of PBE or better. Likewise,atomization energies that are slightly better than from PBE are obtained from the modified vdW-DFs. Althoughthe tests reported here are for hard solids, not normally materials for which dispersion forces are thought to beimportant, we find a systematic improvement in cohesive properties for the alkali metals and alkali halides whennonlocal correlations are accounted for.
DOI: 10.1103/PhysRevB.83.195131 PACS number(s): 71.15.Mb, 61.50.−f, 31.15.−p
I. INTRODUCTION
London dispersion interactions are a ubiquitous phe-nomenon which contribute to the stability of a wide varietyof systems ranging from biomolecules to molecules adsorbedon surfaces. However, the origin of the dispersion forces—nonlocal electron-electron correlations—makes their accuratetheoretical description challenging. This is especially true fordensity functional theory (DFT) where local or semilocalfunctionals lack the necessary ingredients to describe thenonlocal effects. In fact, developing methods that includedispersion, at least approximately, has been one of the mostimportant fields of development in DFT in the last decade.Out of the various schemes that have been proposed to adddispersion to current DFT approximations,1–11 the van derWaals density functional (vdW-DF) method3 is very appealingsince it is based directly on the electron density. In thisfunctional the exchange-correlation energy takes the form of
Exc = EGGAx + ELDA
c + Enlc , (1)
where the exchange energy EGGAx uses the revPBE
generalized-gradient approximation (GGA) functional,12 andELDA
c is the local density approximation (LDA) to thecorrelation energy. Enl
c is the nonlocal energy term whichaccounts approximately for the nonlocal electron correlationeffects. Although Enl
c is obtained using a relatively simpledouble space integration, this still represents an improvementcompared to local or semilocal functionals.
Although the vdW-DF method greatly improves the inter-action energies of dispersion bonded systems, its accuracy hasbeen shown13–15 to be inferior to certain GGAs for a range ofsystems where hydrogen bonds are present.16–18 This has leadto modifications of the method that have focused on both theexchange and correlation parts.15,19–23 With several functionalforms proposed, it is important to test the methods on generalreference test sets to uncover strengths and weaknesses and
help further development. To this end we assess here the func-tionals using a test set of solid-state properties of materials.24
Apart from method assessment, this is also important sincemany of the applications of the vdW functionals lie outsideof “soft matter,” involving, for example, adsorbates on solidsurfaces. Indeed there has recently been a surge of interest inthe application of vdW-DF to adsorption processes, includingadsorption of water or hydrocarbons on various surfaces.25–34
In such studies an adequate description of the substrate witha given functional should, in principle, be a prerequisite.35 Itwould, for example, be unsatisfactory to improve the descrip-tion of the adsorbate-substrate interaction and, at the sametime, compromise the bonding within the substrate. However,without tests of the properties of the substrate and solids in gen-eral it remains unclear how suitable vdW-DF is for adsorptionstudies. Indeed, the PBE lattice constant is often employedin adsorption studies using revPBE-vdW; however, as weshow, the PBE and revPBE-vdW lattice constants can differ byseveral percent and the surface is therefore artificially strained.
There is at least one more reason to perform the testsreported here: Nonlocal correlations are thought to be impor-tant for solid-state materials where the core electron densitieshave relatively large polarizability. For example, copper andgold have been subject to several studies,36–38 with the vdWcontribution to binding estimated to be 0.2–0.6 eV for Cu and0.6–1.2 eV for Au (i.e., up to ∼30% of the total atomizationenergy of bulk Au). There are only a handful of studiesconcerning heavy alkali metals (see, e.g., Ref. 39), but it wasfound that dispersion needs to be included to make the bccstructure the most stable. More recently, the need to includenonlocal correlation in DFT semilocal functionals has beendiscussed for the heavy alkalis.40
Here we test the performance of several vdW functionalsusing a standard test of lattice constants, bulk moduli, andatomization energies of solids. Our test set is similar to the test
195131-11098-0121/2011/83(19)/195131(13) ©2011 American Physical Society
KLIMES, BOWLER, AND MICHAELIDES PHYSICAL REVIEW B 83, 195131 (2011)
of Csonka et al.41 and includes metals and ionic and covalentmaterials. We include the original vdW-DF (referred to asrevPBE-vdW herein), the recently proposed vdW-DF221,42
(referred to as rPW86-vdW2 herein), and two vdW functionalsdeveloped recently by us, optPBE-vdW and optB88-vdW.15
We also propose a new exchange functional based on the B86bexchange43 which gives an accuracy similar to the optB88based vdW-DF on the S22 reference set of weakly bonded gasphase dimers16 and has an improved asymptotic behavior.42
See Appendix A for more details of the optB86b exchangefunctional. This test, together with our previous study,15
should give the reader a broad overview of the strengths anddeficiencies of the vdW functionals that will hopefully lead tofurther developments.
The main outcomes of this study are that the revPBE-vdW and rPW86-vdW2 functionals significantly overestimatethe lattice constants for most materials considered and thatthe average absolute error is more than twice that of theoptB88-vdW and optB86b-vdW functionals. The optB88-vdW and optB86b-vdW functionals give errors between thatof PBEsol and PBE with optB86b-vdW giving smaller errorsthan optB88-vdW. This is because the exchange enhancementfactor (Fx) of the optB88-vdW and optB86b-vdW functionalsis between the Fx of PBEsol and PBE for small reduced densitygradients (s). The optB88-vdW and optB86b-vdW functionalsalso almost halve the errors of PBE in atomization energies.optPBE-vdW improves over revPBE-vdW but not as muchas optB88-vdW does. This behavior for the lattice constantsis similar to that of binding curves and bond lengths; in allthree cases the functionals with rapidly growing enhancementfactors give on average longer equilibrium distances and agreeless with the reference values than the functionals where Fx
follows the slowly varying gas limit for small s.In the next section we discuss the implementation of the
vdW-DF method and details of the computational setup. Theresults are summarized in Secs. III, IV, and V for latticeconstants, bulk moduli, and atomization energies, respectively.We study the differences between local, semilocal, andnonlocal correlation functionals in Sec. VI. And finally inSec. VII we discuss the implications of this study for furtherdevelopment of the vdW-DF methods.
II. COMPUTATIONAL SETUP
We have used the VASP44,45 code with our implementationof the vdW-DF correlation using the efficient algorithm ofRoman-Perez and Soler.46 The vdW-DF term is calculatedon the sum of the pseudo–valence and partial electroniccore charge densities, i.e., on the same density that is usedto calculate the valence exchange-correlation energy in theprojector-augmented wave (PAW)47,48 method in VASP. Theuse of the PAW method means that the calculation is all-electron frozen core (with PBE orbitals) for the exchange andthe LDA correlation part of the exchange-correlation energy.The evaluation of the vdW correlation energy is done in apseudopotential approximation. We test this approximation inAppendices B and C and find that it is very accurate. Forexample, the error in lattice constant is usually below 0.1%,slightly higher for materials with very small bulk moduli. Suchdifferences are much smaller than the intrinsic errors of the
exchange-correlation functionals themselves and smaller orcomparable to differences between different codes41,49–51 orpotentials.52 While to obtain high accuracy within the Roman-Perez and Soler scheme using the all-electron density a carefulchoice of parameters is required (discussed in Appendices Band C), the VASP calculations are accurate using less tightsettings. For VASP calculations we use 30 interpolation pointsfor the q0 function with a saturation value qcut
0 = 10. ThevdW kernel uses a hard setting for the kernel short-rangesoftening which eliminates the need for the soft correctionterm (see Ref. 46). Finally, we note that the algorithm utilizesthe fine FFT grid and, except for the FFTs and summing of theenergy, there is no other communication needed between theprocesses.
We employ a standard approach to calculate the solidproperties. The energy is calculated for a set of lattice constantvalues and for each functional at least seven points aroundthe lowest energy are used to fit the Murnaghan equation ofstate. The plane-wave basis cutoff is set to 750 eV (900 eVfor solids containing C or F). To reduce errors, we have usedthe latest hard PAW potentials supplied with VASP53 with thehighest number of valence electrons. For semiconductors andionic solids (metals) an 8×8×8 (16×16×16) Monkhorst-Packk-point grid is used in the conventional unit cell. Our PBElattice constants agree well with the VASP calculations of Paieret al.49 as well as with the all-electron reference PBE andPBEsol values of Haas et al.50 The reference calculations foratoms were performed in a large 12 × 14 × 16 A3 box; forspin-polarized atoms we evaluate the Enl
c term on the sumof the two spin densities. The experimental reference values,corrected for zero-point energy effects in the case of latticeconstants and atomization energies, are taken from Refs. 41and 54. The statistical values that we use to quantify theerrors of the functionals are the mean error (ME) and themean absolute error (MAE), as well as the relative versions ofthese quantities, namely mean relative error (MRE) and meanabsolute relative error (MARE).
III. LATTICE CONSTANTS
The lattice constants calculated with VASP are given inTable I and shown as relative errors in Fig. 1. For comparisonwe also give the errors of LDA, PBE, and the PBEsolfunctional, one of the GGA functionals55–58 devised for solid-state calculations. We also include the results of the adiabatic-connection fluctuation-dissipation theorem (ACFDT) in therandom-phase approximation (RPA)59–61 from Ref. 51, whichrepresents the state of the art for solid-state calculations. Beforediscussing the results in detail, let us just point out a strikingfeature of the results: The errors are not random and clearperiodic trends are observed. All methods shown tend to givelarger lattice constants for the transition metals, ionic solids,and semiconductors while the alkali and alkali-earth latticesare too short. This seems to correspond to the tendency offunctionals to give larger lattice constants when going fromleft to right in the periodic table.50 This behavior does notseem to be improved by hybrid functionals49,62 and is alsopresent to some extent in the RPA lattice constants, althoughfrom the alkali and alkali-earth metals only the data for Nahave been published.51 In fact, even the functionals designed
195131-2

VAN DER WAALS DENSITY FUNCTIONALS APPLIED TO . . . PHYSICAL REVIEW B 83, 195131 (2011)
TABLE I. Lattice constants in A of different solids calculated using VASP for different vdW functionalsand two GGA functionals (PBE and PBEsol). In addition, we show the LDA values taken from Ref. 41.The values are compared to the experimental values corrected for zero-point energy effects (indicatedby “ZPEC”) also taken from Ref. 41. While both optPBE-vdW and optB88-vdW give mean absoluteerrors similar to those of PBE, this value for the optB86b-vdW functional is between those of PBE andPBEsol. The original revPBE-vdW gives lattice constants that are too large.
Exchange revPBE rPW86 optPBE optB88 optB86b LDA PBEsol PBE Exp.Correlation vdW vdW2 vdW vdW vdW LDA PBEsol PBE (ZPEC)
Cu 3.708 3.757 3.655 3.632 3.605 3.517 3.569 3.635 3.595Ag 4.254 4.331 4.174 4.141 4.101 4.010 4.059 4.154 4.056Pd 4.014 4.086 3.960 3.941 3.909 3.836 3.876 3.943 3.875Rh 3.882 3.945 3.843 3.831 3.805 3.755 3.780 3.830 3.793
Li 3.453 3.396 3.440 3.432 3.452 3.363 3.436 3.437 3.449Na 4.233 4.156 4.195 4.169 4.191 4.054 4.174 4.200 4.210K 5.293 5.177 5.225 5.168 5.202 5.046 5.216 5.284 5.212Rb 5.672 5.550 5.584 5.506 5.541 5.373 5.572 5.671 5.576Cs 6.141 5.987 6.022 5.899 5.945 5.751 6.015 6.160 6.039Ca 5.555 5.493 5.502 5.450 5.465 5.328 5.461 5.533 5.553Sr 6.052 6.005 5.979 5.917 5.921 5.782 5.913 6.019 6.045Ba 5.073 5.058 4.987 4.917 4.906 4.747 4.894 5.028 4.995Al 4.084 4.084 4.058 4.054 4.036 3.985 4.018 4.041 4.020
LiF 4.116 4.080 4.067 4.033 4.037 3.913 4.010 4.068 3.964LiCl 5.223 5.204 5.153 5.114 5.103 4.968 5.067 5.152 5.056NaF 4.752 4.693 4.693 4.647 4.658 4.502 4.636 4.708 4.579NaCl 5.750 5.694 5.673 5.622 5.627 5.465 5.609 5.701 5.565MgO 4.281 4.282 4.252 4.231 4.230 4.168 4.222 4.257 4.184
C 3.600 3.608 3.585 3.577 3.572 3.532 3.557 3.574 3.543SiC 4.406 4.424 4.386 4.375 4.369 4.329 4.354 4.377 4.342Si 5.507 5.523 5.476 5.460 5.447 5.403 5.429 5.465 5.416Ge 5.864 5.934 5.793 5.762 5.725 5.623 5.680 5.766 5.640GaAs 5.851 5.908 5.783 5.751 5.717 5.605 5.667 5.752 5.638
ME (A) 0.105 0.088 0.050 0.012 0.010 −0.100 −0.006 0.061MAE (A) 0.105 0.116 0.064 0.066 0.049 0.100 0.033 0.067MRE (%) 2.3 2.0 1.1 0.4 0.3 −2.0 −0.1 1.3MARE (%) 2.3 2.6 1.4 1.4 1.0 2.0 0.7 1.4
for solids do not lead to a qualitative improvement of the latticeconstants. For example, the difference between the largest andthe smallest relative errors is similar for LDA, AM05, PBEsol,and PBE.50
Let us now discuss the results of the vdW functionals. Thetwo van der Waals functionals proposed by the Langreth andLundqvist groups (revPBE-vdW and rPW86-vdW2) tend togive larger lattice constants (ME = 0.105 A for revPBE-vdWand ME = 0.088 A for rPW86-vdW2). While revPBE-vdWoverestimates all values, rPW86-vdW2, rather surprisingly,underestimates the lattice constants of the alkali and alkali-earth metals. The errors are as large as 5.0% (6.8%) forrevPBE-vdW (rPW86-vdW2) in the case of Ag and largefor other transition metals included as well as for Ge andGaAs. The large errors are similar to the overestimation ofthe binding distance that has been observed before for manysystems.3,26,63,64 This has been related to the too steep behaviorof the exchange enhancement factor for small reduced densitygradients which can be seen in Fig. 2. Although originallyboth revPBE and rPW86 exchange functionals were selectedbecause they give similar binding to Hartree-Fock for somegas-phase dimers, at short separations these functionals are
too repulsive,42 which is important in hydrogen bonding andhere for lattice constants.
The repulsion is largely decreased by utilizing an exchangefunctional that has a less steeply rising Fx and thus isless repulsive for short interatomic separations, such as theexchange functionals proposed in Ref. 15 (see Fig. 2). TheoptPBE-vdW is based on the PBE functional and it givessimilar lattices to PBE for all the systems except for thealkali and alkali-earth metals. For these metals, the vdWcorrelation term gives better agreement with the referencethan the semilocal PBE correlation. The average errors arefurther reduced by using the optB88-vdW or optB86b-vdWfunctionals. However, for the alkalis the lattice constantsbecome too short and this worsens progressively as the ionsize increases. This might be caused by overestimation of thedispersion energy in the vdW functional20 or by the lack ofhigher order terms.65 The optB88-vdW functional yields amean error of 0.012 A. The mean absolute error of 0.066 A iscomparable to the error of optPBE-vdW (MAE = 0.064 A).The optB86b-vdW which, like PBEsol, follows the limitof slowly varying density for small s, further improves theagreement with the reference (MAE = 0.049 A) and performs
195131-3

KLIMES, BOWLER, AND MICHAELIDES PHYSICAL REVIEW B 83, 195131 (2011)
Cu
Cu
Ag
Ag
Pd
Pd
Rh
Rh
Li
Li
Na
Na
K
K
Rb
Rb
Cs
Cs
Ca
Ca
Sr
Sr
Ba
Ba
Al
Al
LiF
LiF
LiCl
LiCl
NaF
NaF
NaCl
NaCl
MgO
MgO
C
C
SiC
SiC
Si
Si
Ge
Ge
GaAs
GaAs
-2
0
2
4
6
Dif
fere
nce
from
ref
eren
ce (
%)
revPBE-vdWoptPBE-vdWoptB88-vdWoptB86b-vdWrPW86-vdW2
Cu
Cu
Ag
Ag
Pd
Pd
Rh
Rh
Li
Li
Na
Na
K
K
Rb
Rb
Cs
Cs
Ca
Ca
Sr
Sr
Ba
Ba
Al
Al
LiF
LiF
LiCl
LiCl
NaF
NaF
NaCl
NaCl
MgO
MgO
C
C
SiC
SiC
Si
Si
Ge
Ge
GaAs
GaAs
-2
0
2
4
6
Dif
fere
nce
from
ref
eren
ce (
%)
LDAPBEsolPBERPAoptB86b-vdW
FIG. 1. (Color online) Comparison of the relative errors in the lattice constants calculated with different vdW-DF functionals, LDA (fromRef. 41), PBE, PBEsol, and recent data using the RPA (Ref. 51). The vdW methods are shown in the left panel while the right panel containsthe results of the (semi)local functionals and RPA, as well as the optB86b-vdW results for comparison. All the methods overestimate the latticeconstants for ionic solids and semiconductors and tend to give shorter lattices for alkali and alkali-earth metals. As with the S22 set, both therevPBE-vdW and rPW86-vdW2 yield equilibrium distances that are too long in most cases. This is improved by the functionals with optimizedexchange: optPBE-vdW, optB88-vdW, and optB86b-vdW.
in between PBEsol (MAE = 0.033 A) and PBE (MAE =0.067 A). Interestingly, optB86b-vdW gives smaller latticeconstants than optB88-vdW for transition metals while theopposite is true for alkali metals. We attribute this to thebehavior of Fx in two regions of s. The Fx of optB86b-vdWis less steep than Fx of optB88-vdW for s < 1 and slightlysteeper for s ∼ 2 (see Fig. 2). The s < 1 region has beenidentified to be of importance for the lattice constants oftransition metals while s ∼ 2 affects the lattice constants ofalkali metals.41,66
Although it might be surprising at first sight that functionalsoptimized on interaction energies of gas-phase dimers give
0 2 4 6s
1
1.5
2
Fx(s
)
PBEPBEsolrevPBErPW86optPBEoptB88optB86b
FIG. 2. (Color online) The exchange enhancement factors Fx ofthe functionals employed in this study: PBE, PBEsol, and revPBE,which share the same functional form but differ in the values ofparameters; rPW86, which is used in the rPW86-vdW2 (Ref. 21)functional; and three exchange functionals (optPBE, optB88, andoptB86b) optimized for use with the vdW correlation (Ref. 15).The steepness for small reduced density gradients (s) is of crucialimportance in determining the lattice constants.
very good lattice constants, it just highlights the connectionbetween the influence of the exchange part on lattice constants,molecular bonds, and intermolecular binding curves.67,68 In allthese cases the small s behavior is able to alter the properties,and by following the slowly varying electron gas limit all thesethree measures tend to be improved.
IV. BULK MODULI
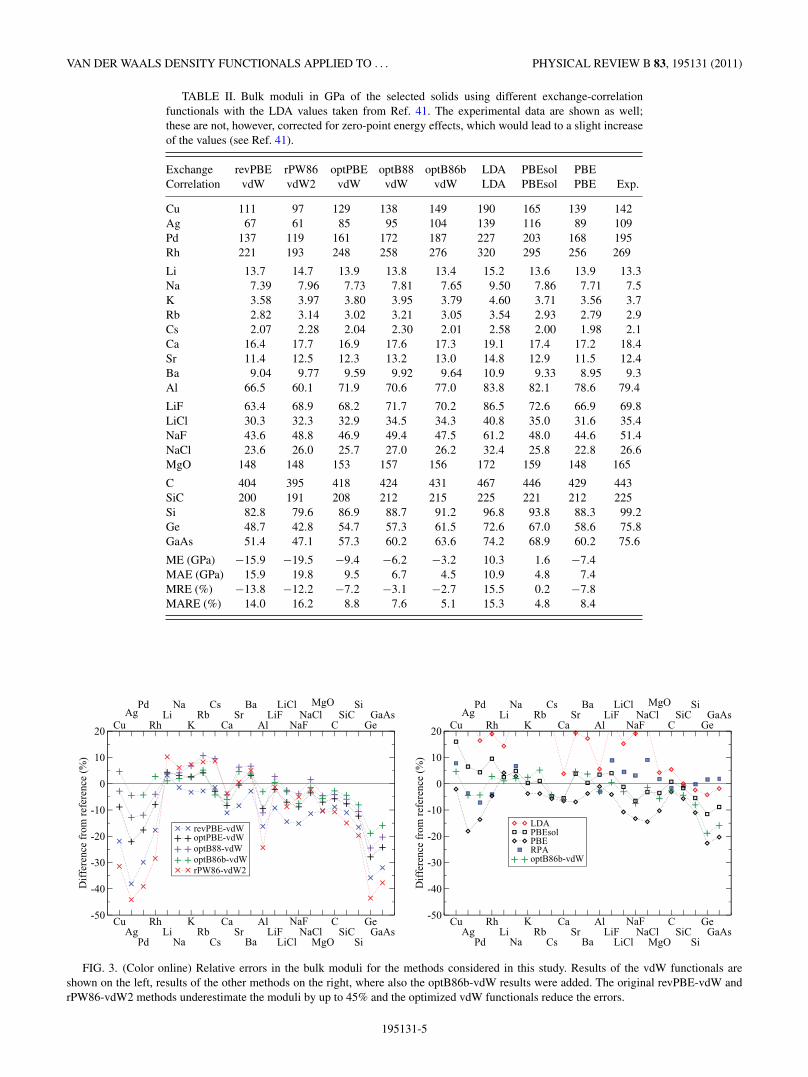
It is known that the results of a given functional for bulkmoduli are related to the behavior for lattice constants. Theshorter the predicted lattice constant, the higher the bulkmodulus. The vdW functionals tend to follow this trend as canbe seen from the data in Table II and the relative errors shownin Fig. 3. The revPBE-vdW and rPW86-vdW2 functionals givetoo soft lattices, with the bulk moduli smaller by more than30% for Ag, Pd, Ge, and GaAs. This correlates well with theoverestimation of the lattice constant by more than 3% forthese materials with revPBE-vdW and rPW86-vdW2.
There are several trends that one can observe; perhaps theclearest is the tendency of PBE and PBEsol to underestimatethe bulk modulus with the increase of the ion size. This is mostprominent for semiconductors, where it is clear that none ofthe vdW functionals alter this trend. On the other hand the RPAresults do not suffer this deficiency. Importantly, this softeningtrend for alkali metals is improved by the vdW functionals. Thereference experimental values were not adjusted for zero-pointenergy effects which would slightly increase the referencevalues (up to ∼3% in the case of Li41). Let us then conclude thathere again the optimized vdW functionals improve upon theoriginal methods and they follow the trend expected from theerrors in the lattice constants. Specifically, the average absoluteerrors increase in order PBEsol < optB86b-vdW < optB88-vdW ≈ PBE ≈ optPBE-vdW < revPBE-vdW < rPW86-vdW.
195131-4
VAN DER WAALS DENSITY FUNCTIONALS APPLIED TO . . . PHYSICAL REVIEW B 83, 195131 (2011)
TABLE II. Bulk moduli in GPa of the selected solids using different exchange-correlationfunctionals with the LDA values taken from Ref. 41. The experimental data are shown as well;these are not, however, corrected for zero-point energy effects, which would lead to a slight increaseof the values (see Ref. 41).
Exchange revPBE rPW86 optPBE optB88 optB86b LDA PBEsol PBECorrelation vdW vdW2 vdW vdW vdW LDA PBEsol PBE Exp.
Cu 111 97 129 138 149 190 165 139 142Ag 67 61 85 95 104 139 116 89 109Pd 137 119 161 172 187 227 203 168 195Rh 221 193 248 258 276 320 295 256 269
Li 13.7 14.7 13.9 13.8 13.4 15.2 13.6 13.9 13.3Na 7.39 7.96 7.73 7.81 7.65 9.50 7.86 7.71 7.5K 3.58 3.97 3.80 3.95 3.79 4.60 3.71 3.56 3.7Rb 2.82 3.14 3.02 3.21 3.05 3.54 2.93 2.79 2.9Cs 2.07 2.28 2.04 2.30 2.01 2.58 2.00 1.98 2.1Ca 16.4 17.7 16.9 17.6 17.3 19.1 17.4 17.2 18.4Sr 11.4 12.5 12.3 13.2 13.0 14.8 12.9 11.5 12.4Ba 9.04 9.77 9.59 9.92 9.64 10.9 9.33 8.95 9.3Al 66.5 60.1 71.9 70.6 77.0 83.8 82.1 78.6 79.4
LiF 63.4 68.9 68.2 71.7 70.2 86.5 72.6 66.9 69.8LiCl 30.3 32.3 32.9 34.5 34.3 40.8 35.0 31.6 35.4NaF 43.6 48.8 46.9 49.4 47.5 61.2 48.0 44.6 51.4NaCl 23.6 26.0 25.7 27.0 26.2 32.4 25.8 22.8 26.6MgO 148 148 153 157 156 172 159 148 165
C 404 395 418 424 431 467 446 429 443SiC 200 191 208 212 215 225 221 212 225Si 82.8 79.6 86.9 88.7 91.2 96.8 93.8 88.3 99.2Ge 48.7 42.8 54.7 57.3 61.5 72.6 67.0 58.6 75.8GaAs 51.4 47.1 57.3 60.2 63.6 74.2 68.9 60.2 75.6
ME (GPa) −15.9 −19.5 −9.4 −6.2 −3.2 10.3 1.6 −7.4MAE (GPa) 15.9 19.8 9.5 6.7 4.5 10.9 4.8 7.4MRE (%) −13.8 −12.2 −7.2 −3.1 −2.7 15.5 0.2 −7.8MARE (%) 14.0 16.2 8.8 7.6 5.1 15.3 4.8 8.4
Cu
Cu
Ag
Ag
Pd
Pd
Rh
Rh
Li
Li
Na
Na
K
K
Rb
Rb
Cs
Cs
Ca
Ca
Sr
Sr
Ba
Ba
Al
Al
LiF
LiF
LiCl
LiCl
NaF
NaF
NaCl
NaCl
MgO
MgO
C
C
SiC
SiC
Si
Si
Ge
Ge
GaAs
GaAs
-50
-40
-30
-20
-10
0
10
20
Dif
fere
nce
from
ref
eren
ce (
%)
revPBE-vdWoptPBE-vdWoptB88-vdWoptB86b-vdWrPW86-vdW2
Cu
Cu
Ag
Ag
Pd
Pd
Rh
Rh
Li
Li
Na
Na
K
K
Rb
Rb
Cs
Cs
Ca
Ca
Sr
Sr
Ba
Ba
Al
Al
LiF
LiF
LiCl
LiCl
NaF
NaF
NaCl
NaCl
MgO
MgO
C
C
SiC
SiC
Si
Si
Ge
Ge
GaAs
GaAs
-50
-40
-30
-20
-10
0
10
20
Dif
fere
nce
from
ref
eren
ce (
%)
LDAPBEsolPBERPAoptB86b-vdW
FIG. 3. (Color online) Relative errors in the bulk moduli for the methods considered in this study. Results of the vdW functionals areshown on the left, results of the other methods on the right, where also the optB86b-vdW results were added. The original revPBE-vdW andrPW86-vdW2 methods underestimate the moduli by up to 45% and the optimized vdW functionals reduce the errors.
195131-5

KLIMES, BOWLER, AND MICHAELIDES PHYSICAL REVIEW B 83, 195131 (2011)
V. ATOMIZATION ENERGIES OF SOLIDS
The calculated atomization energies for our selection ofsolids are presented in Table III, and the relative errors areshown in Fig. 4. Again we include for comparison LDA,PBE, PBEsol, and RPA data in Fig. 4. As can be seen therevPBE-vdW and rPW86-vdW2 functionals underestimate theatomization energies with average relative errors of −11.0%and −15.9%, respectively. This underestimation is similar tothe overestimation of LDA (ME = 15.1%). The optimizedoptPBE-vdW, optB88-vdW, and optB86b-vdW functionalsgive much improved results with the average relative errorsof −3.0%, −1.3%, and 2.1%, respectively. In most cases theoptimized functionals tend to give larger atomization energiesand increase in the order optPBE-vdW, optB88-vdW, andoptB86b-vdW. Only in the case of the alkali metals doesoptB88-vdW give less binding than optPBE-vdW which forthese materials agrees well with the reference values.
Interestingly, when one compares the GGA and vdWcorrelation functionals, there seems to be some systematicimprovement as well, most notably for the alkali metals. Whilethe PBE atomization energies get progressively worse with theincrease of the ion size, all the vdW functionals give errors of
a similar magnitude. While one can observe a similar trendfor PBE atomization energies of semiconductors, which isdecreased by the optimized vdW functionals, PBEsol seemsto improve over PBE as well. The atomization energies of thealkali halides calculated using the optimized vdW functionalsare also in better agreement with the reference data than eitherPBE or PBEsol. The effect of different correlation functionalswill be discussed more in the next section.
VI. THE EFFECT OF NONLOCAL CORRELATION
Although we know that the vdW-DF correlation formis only approximate, it is interesting to see what changesoccur when semilocal correlation such as the PBE correlation(referred to as “PBEc”) is replaced by the nonlocal form ofvdW. (The “vdW correlation” is the ELDA
c + Enlc correlation
energy). To study this change we have calculated the latticeconstants using the PBE exchange functional (referred to as“PBEx”) and LDA, PBE, and vdW correlation functionals.This way we can directly compare the effect of adding PBEsemilocal or vdW nonlocal corrections. Let us first presentthe results for the lattice constants in Fig. 5. At first sight,
TABLE III. Atomization energies in eV for various solids calculated using VASP for different exchange-correlation functionals.We show the data of the revPBE-vdW and rPW86-vdW2 functionals, the optimized vdW functionals, and results of LDA, PBEsol,and PBE. The values are compared to the experimental values corrected for zero-point energy effects taken from Ref. 41. All threeoptimized functionals give better results than either PBE or PBEsol. The LDA values were taken from Ref. 51 for semiconductors,ionic solids, transition metals, and Al. The atomization energies of alkali and alkali-earth metals were taken from Ref. 54.
Exchange revPBE rPW86 optPBE optB88 optB86b LDA PBEsol PBE Exp.Correlation vdW vdW2 vdW vdW vdW LDA PBEsol PBE (ZPEC)
Cu 2.93 2.81 3.35 3.52 3.70 4.55 4.04 3.49 3.52Ag 2.16 2.15 2.57 2.76 2.90 3.64 3.06 2.50 2.97Pd 3.18 3.13 3.71 3.96 4.16 5.08 4.43 3.71 3.92Rh 5.12 4.92 5.81 6.10 6.40 7.67 6.73 5.82 5.78
Li 1.52 1.47 1.61 1.57 1.63 1.79 1.68 1.60 1.67Na 1.01 0.90 1.09 1.04 1.10 1.24 1.15 1.08 1.13K 0.84 0.75 0.91 0.88 0.92 1.01 0.93 0.86 0.94Rb 0.76 0.69 0.84 0.81 0.85 0.92 0.83 0.77 0.86Cs 0.72 0.66 0.80 0.79 0.81 0.87 0.77 0.70 0.81Ca 1.62 1.40 1.82 1.88 1.99 2.21 2.11 1.90 1.86Sr 1.36 1.13 1.56 1.61 1.73 1.90 1.81 1.61 1.73Ba 1.68 1.52 1.90 1.99 2.08 2.24 2.12 1.88 1.91Al 2.96 2.56 3.30 3.34 3.61 4.04 3.86 3.50 3.44
LiF 4.36 4.48 4.49 4.53 4.50 4.94 4.47 4.32 4.47LiCl 3.47 3.51 3.58 3.61 3.60 3.83 3.55 3.42 3.59NaF 3.89 3.95 4.00 4.02 4.00 4.38 3.95 3.82 3.98NaCl 3.23 3.21 3.32 3.33 3.32 3.50 3.25 3.15 3.34MgO 4.83 4.85 5.08 5.21 5.23 5.88 5.29 4.97 5.27
C 7.09 6.95 7.54 7.70 7.88 9.01 8.26 7.70 7.58SiC 6.02 5.82 6.37 6.52 6.67 7.45 6.88 6.44 6.49Si 4.35 4.05 4.60 4.74 4.87 5.34 4.95 4.62 4.68Ge 3.43 3.09 3.76 3.90 4.01 4.62 4.15 3.72 3.86GaAs 2.90 2.73 3.27 3.36 3.44 4.09 3.55 3.15 3.39
ME (eV) −0.34 −0.46 −0.08 0.00 0.10 0.56 0.20 −0.11MAE (eV) 0.34 0.46 0.09 0.07 0.12 0.56 0.22 0.13MRE (%) −11.0 −15.9 −3.0 −1.3 2.1 15.1 4.8 −4.4MARE (%) 11.0 16.0 3.1 2.9 3.2 15.1 6.0 5.0
195131-6

VAN DER WAALS DENSITY FUNCTIONALS APPLIED TO . . . PHYSICAL REVIEW B 83, 195131 (2011)
Cu
Cu
Ag
Ag
Pd
Pd
Rh
Rh
Li
Li
Na
Na
K
K
Rb
Rb
Cs
Cs
Ca
Ca
Sr
Sr
Ba
Ba
Al
Al
LiF
LiF
LiCl
LiCl
NaF
NaF
NaCl
NaCl
MgO
MgO
C
C
SiC
SiC
Si
Si
Ge
Ge
GaAs
GaAs
-40
-30
-20
-10
0
10
20
Dif
fere
nce
from
ref
eren
ce (
%)
revPBE-vdWoptPBE-vdWoptB88-vdWoptB86b-vdWrPW86-vdW2
Cu
Cu
Ag
Ag
Pd
Pd
Rh
Rh
Li
Li
Na
Na
K
K
Rb
Rb
Cs
Cs
Ca
Ca
Sr
Sr
Ba
Ba
Al
Al
LiF
LiF
LiCl
LiCl
NaF
NaF
NaCl
NaCl
MgO
MgO
C
C
SiC
SiC
Si
Si
Ge
Ge
GaAs
GaAs
-40
-30
-20
-10
0
10
20
Dif
fere
nce
from
ref
eren
ce (
%)
LDAPBEsolPBERPAoptB86b-vdW
FIG. 4. (Color online) Relative errors in atomization energies calculated using different DFT approaches. Data for various flavors of vdWfunctionals are shown in the left panel. Data for LDA, semilocal PBE and PBEsol, the RPA method, and the optB86b-vdW functional are shownin the right panel. The ZPE was subtracted from the experimental data. The optB88-vdW and optB86b-vdW tend to give values between thoseof PBE and PBEsol for transition metals and semiconductors, in agreement with the behavior of their exchange enhancement factor. However,they agree better with the reference for alkali halides, where even PBEsol underbinds. Moreover, they give consistent errors for alkali metalswhere both PBE and PBEsol increasingly underbind with the increasing size of the ion.
the PBEx-PBEc and PBEx-vdWc give rather similar results,consistently decreasing the PBEx-LDAc lattice constant.69
This means that an exchange functional which gives goodresults for solids with PBE correlation will tend to givegood results with the vdW correlation as well. As we notedbefore, there is, however, a clear difference for the alkalimetals, where the PBEx-PBEc gives progressively worselattice constants with the increase of the ion size. This is evenmore pronounced for the atomization energies, shown in Fig. 6,where PBEx-PBEc underbinding starts at only −3% for Libut worsens to ∼−15% for Cs. This trend is clearly reversedby the vdW correlation, although too much. The tendency tounderbind larger ions by semilocal functionals is analogous to
Cu
Cu
Ag
Ag
Pd
Pd
Rh
Rh
Li
Li
Na
Na
K
K
Rb
Rb
Cs
Cs
Ca
Ca
Sr
Sr
Ba
Ba
Al
Al
LiF
LiF
LiCl
LiCl
NaF
NaF
NaCl
NaCl
MgO
MgO
C
C
SiC
SiC
Si
Si
Ge
Ge
GaAs
GaAs
-2
0
2
4
6
8
Dif
fere
nce
from
ref
eren
ce (
%)
PBEx-LDAcPBEx-PBEcPBEx-vdWc
FIG. 5. (Color online) Comparison of the relative errors in thelattice constants for the PBE exchange functional with LDA, PBE,and vdW correlation functionals.
the behavior of semilocal functionals for noble-gas dimers inthe gas phase.70 The interaction energy is obtained only fromthe region of electron density overlap and therefore does notscale in the same way as the size of the ion.
Careful observation reveals that the differences betweenPBE and vdW correlations are qualitatively similar for tran-sition metals and semiconductors. With the vdW correlationthe lattice constants are larger by ∼1% (except for C, SiC,and Si, where the difference is less) while the atomizationenergies have a smaller range of errors. For example, inthe Rh, Pd, Ag group, the nonlocal correlations will berelatively the most important for Ag which has a closed d
shell and the smallest atomization energy. And indeed, therange of errors in atomization energies decreases for this
Cu
Cu
Ag
Ag
Pd
Pd
Rh
Rh
Li
Li
Na
Na
K
K
Rb
Rb
Cs
Cs
Ca
Ca
Sr
Sr
Ba
Ba
Al
Al
LiF
LiF
LiCl
LiCl
NaF
NaF
NaCl
NaCl
MgO
MgO
C
C
SiC
SiC
Si
Si
Ge
Ge
GaAs
GaAs
-50
-40
-30
-20
-10
0
10
Dif
fere
nce
from
ref
eren
ce (
%)
PBEx-LDAcPBEx-PBEcPBEx-vdWc
FIG. 6. (Color online) Relative errors in the atomization energiesfor the PBE exchange functional combined with LDA, PBE, and vdWcorrelation functionals.
195131-7

KLIMES, BOWLER, AND MICHAELIDES PHYSICAL REVIEW B 83, 195131 (2011)
TABLE IV. Summary of the results for lattice constants and atomization energies obtained usingPBE, the revPBE-vdW and rPW86-vdW2 functionals of Langreth and Lundqvist and co-workers,and the vdW functionals with optimized exchange.
PBE revPBE-vdW, rPW86-vdW2 Optimized Exchange
Lattice constants Worse than PBE Similar to or better than PBEMARE 1.4% 2.3% (revPBE-vdW) 1.4% (optB88-vdW)
Atomization energies Worse than PBE Better than PBEMARE 5.0% 11.0% (revPBE-vdW) 2.9% (optB88-vdW)
group, although the trend is not cured completely. Note thatthe trend in lattice constants is not improved and it would beactually worsened by using a hybrid functional.49 Thus thesemilocal PBE or nonlocal vdW correlation with semilocalor hybrid exchange seems to be unable to describe thedelicate balance of the interactions in the late transition metals.For semiconductors PBEx-vdWc further increases the latticeconstants compared to PBEx-PBEc. Since for these systemsthe nonlocal correlation is less important than the semilocalcontribution, the results suggest that the semilocal part ofthe vdW correlation is effectively less attractive than PBEc.However, PBEx-PBEc worsens the atomization energies forsolids with larger atoms where the vdW correlation improvesthe trend. This again demonstrates the main trend observedin this study, that nonlocal correlations become increasinglyimportant with the increase of the ion size.
VII. DISCUSSION AND CONCLUSIONS
In this study we have compared solid-state propertiesobtained with different semilocal and nonlocal exchange-correlation functionals and we summarize the main results
TABLE V. Lattice constants in A of Ge evaluated using variousapproximations for the Enl
c for the optB86b-vdW functional. ThreePAW potentials were used: Ge has four valence electrons, Ge d andGe h fourteen, and Ge h has a smaller core radius. The FFT gridcontains 120 points in each direction, so that the grid spacing in thecell is ∼0.05 A. All the calculations used qcut
0 = 10 and Nα = 30 toallow for a comparison between VASP and the all-electron results.The differences in the optB86b-LDA lattice constants represent theerror given by the PAW potential. One can see that the all-electronbased evaluations of the vdW energy (�cut 20
ae and �no softae ) give almost
the same differences in lattice constants between the different PAWpotentials as optB86b-LDA. The optB86b-vdW lattice constantcalculated with VASP agrees well with the all-electron calculationsfor the hard potential; the agreement is worse for the Ge andGe d potentials. However, in the worst case of the Ge potentialthis deviation is 0.018 A, much smaller than the difference of∼0.07 A when only the real valence density (�val) is used.
Ge Ge d Ge h
optB86b-LDA 5.857 5.842 5.845optB86b-vdW 5.764 5.714 5.726�val 5.814 5.735 5.738�cut 20
ae 5.746 5.729 5.732�no soft
ae 5.740 5.723 5.726
in Table IV. The purpose of this study is mainly to understandhow the vdW-DF method performs for hard matter, beyondthe traditional soft matter and van der Waals bonded systemsto which it is primarily targeted. We have found that theparticular choices of exchange functionals made by Langrethand Lundqvist and co-workers for the revPBE-vdW andrPW86-vdW2 functionals (i.e., revPBE and rPW86) lead tolarge overestimations of lattice constants and underestimationsof bulk moduli and atomization energies for most of thesolids considered. In addition, the errors have a wide range;e.g., rPW86-vdW2 underestimates the lattice constant of Liby 1.5% but overestimates the value for Ag by 6.7%. Theatomization energies are underestimated by more than 0.3 eVon average. The optimized exchange functionals introduced inRef. 15 (i.e., optPBE-vdW and optB88-vdW) and the optB86b-vdW functional introduced here improve over revPBE-vdWand give lattice constants that are similar to those of PBE.This leads to similar improvements for the bulk moduli. Fromour study it seems that the vdW correlation functional doesnot improve dramatically over PBE except for the latticeconstants of the alkali metals. This means that there is stillsome spread of the errors in the lattice constants whichis not improved compared to PBE or PBEsol and furtherdevelopments are required to reduce this range of errors.Importantly, the atomization energies seem to be qualitativelyimproved when a nonlocal correlation functional is used. Thisis most notable for the alkali metals, where PBE and PBEsolincreasingly underbind with the increasing size of the ion butthe vdW functionals suffer no such deficiency. Moreover, theatomization energies of ionic solids are in very good agreementwith the experimental values.
Let us now discuss the results obtained here in a broadercontext. First, after the local and semilocal approximations,the nonlocal density functionals are the next logical step
TABLE VI. Dependence of the Ge lattice constant on thenumber Nα of q0 interpolation points and the qcut
0 . The electrondensity was smoothed above 20 a.u. and a very fine FFT grid with200 points in each direction was used (corresponding to 0.03 Aspacing).
Nα
qcut0 20 30 40 50
5 5.751 5.749 5.748 5.74810 5.740 5.734 5.731 5.73018 7.505 5.733 5.732 5.732
195131-8
VAN DER WAALS DENSITY FUNCTIONALS APPLIED TO . . . PHYSICAL REVIEW B 83, 195131 (2011)
before the orbitals are introduced in the exchange-correlationenergy such as is done in the RPA or hybrids. In thissense the nonlocal correlation functionals offer great promise.However, both revPBE-vdW and rPW86-vdW2 suffer fromtoo much repulsion at short distances, a well-known featureof revPBE-vdW for systems like the gas-phase dimers.3,21,63
In this study we have shown that lattice constants of solidsare subject to similar errors. This is a significant problemsince accurate lattice constants are crucial for the predictivepower of theory.35 One possible way to alleviate the problemsis to change the exchange functional. We have shown thatfunctionals with less steeply rising exchange enhancementfactors for small s will improve both results on the S22 setand, in this study, the lattice constants of solids. However, itis known from studies of GGA functionals that this changewill reduce the accuracy for molecular atomization energies.Although accurate atomization energies are often not crucialfor studies of surface adsorption, improved accuracy couldbe gained by using a meta-GGA or hybrid-GGA functionalif necessary. We stress that the observed differences betweenPBE correlation and vdW correlation discussed in Sec. VI willbe similar for GGA or hybrid functionals since both employGGA correlation.
At a more fundamental level, the question of what formof exchange and correlation to use is still to be resolved. Inprinciple one can try to find an exchange functional compatiblewith “dispersionless” interaction energies.71 Another approachmight be to fit a functional to interaction energies based on theso-called exact exchange (EXX) in the ACFDT formalism.This would allow the correlation part to be compared directlyto the ACFDT correlation energy (e.g., in the RPA approxima-tion). However, this might not be qualitatively that differentfrom trying to reproduce HF binding curves. Moreover, theEXX energy depends on the single-particle orbitals and thecorrelation part will be just EEXX
c = E(exact) − E(EXX).Therefore no “exact” correlation energy can be defined inthis sense. Even defining EEXX
c using some choice of orbitalswill mean that this needs to be reproduced by a given DFTfunctional which seems to be rather difficult. So far, even theform of semilocal correlation that should be used is an ongoingdebate.3,72 This includes the question of how much of thesemilocal correlation energy the vdW correlation functionalrecovers. In this light, there is a need for reference systemsto help the development, similar to GGA functionals wherelattice constants, atomization energies, bond lengths, and otherdata have been extremely useful. The doubts and discussionsconcerning the vdW functionals just highlight the need foraccurate reference data for gas-phase clusters, adsorbates,solids, and so on. The approach of using quantum chemistrymethods for the solid state17,73–77 is one that seems very usefuland deserves more attention.
To conclude, we have calculated solid-state properties ofa set of solids using a self-consistent implementation of thevdW-DF method in the VASP code. We have shown that themethod agrees well with all-electron data which are much moretime consuming to obtain. The lattice constants of solids are, inanalogy to what has been reported for gas phase dimers,3,21,63
too large with the original revPBE-vdW and rPW86-vdW2methods but improved when optimized exchange functionalsare used. Indeed, optB86b-vdW gives errors in lattice constants
between PBE and PBEsol and thus yields accurate bindingproperties for gas-phase clusters and also describes bulk mate-rials well. The atomization energies of solids are considerablyimproved when the optimized functionals are used. This workprovides some clear reference data as to how the vdW-DFfamily of functionals perform which should be useful in thefurther development of the method.
ACKNOWLEDGMENTS
A.M. is supported by the EURYI award scheme (seehttp://www.esf.org/euryi), the EPSRC, and the EuropeanResearch Council. D.R.B. is supported by the Royal Societyand JK by UCL and EPSRC through the PhD+ scheme.We are grateful to the London Centre for Nanotechnologyand UCL Research Computing for computational resources.Via our membership of the UK’s HPC Materials ChemistryConsortium, which is funded by EPSRC (EP/F067496), thiswork made use of the facilities of HECToR, the UK’s nationalhigh-performance computing service, which is provided byUoE HPCx Ltd. at the University of Edinburgh, Cray Inc., andNAG Ltd., and funded by the Office of Science and Technologythrough EPSRC’s High End Computing Programme.
APPENDIX A: OPTB86B
Here we briefly present the optB86b exchange functional;a more in-depth discussion will be published elsewhere. Fromdetailed studies of the exchange functionals and bindingcurves it became apparent that the behavior of the exchangeenhancement factor (Fx) for small reduced density gradients(s) affects the position of the repulsive Pauli wall. Functionalswith steeply increasing Fx are more repulsive, and moreimportantly, start to be repulsive for longer distances thanfunctionals with Fx less steep or flat, like LDA. Thereforelattice constants tend to be longer when one goes from LDAto PBEsol to PBE to revPBE50,52 and similar observations canbe made for equilibrium distances of gas-phase clusters, e.g.,the water dimer.68,78 This has been exploited in the PBEsolfunctional which decreases the average overestimation of thePBE equilibrium distances.58 In an analogous way the overes-timation of the revPBE-vdW binding distances, observed formany systems, can be reduced by choosing a functional thatrises less steeply for small s. Using the same small s behavioras PBEsol leads to a good agreement of the gas-phase dimerbinding curves with the reference data. For large s, it has beensuggested that Fx should have s2/5 behavior.42 We modifiedthe B86b exchange functional to obey these limits (althoughthe second with a coefficient slightly different from the onesuggested in Ref. 42). The form of the optB86b functional isthen F
optB86bx = 1 + μs2
(1+μs2)4/5 ,μ = 0.1234 , and the functionis shown in Fig. 2. The optB86b-vdW gives almost the sameresults on the S22 data set as the optB88-vdW functional;namely, the mean absolute deviations are 12 meV for the totalset and 13, 16, and 6 meV for the hydrogen, dispersion, andmixed bonding subsets (using the reference data of Podeszwaet al.79 on the geometries of Jurecka et al.16). However, sincethis form has a less steeply rising Fx for large s than optB88,it is less repulsive for distances larger than optimum. This
195131-9

KLIMES, BOWLER, AND MICHAELIDES PHYSICAL REVIEW B 83, 195131 (2011)
TABLE VII. Lattice constant of Ge calculated on the very finegrid with 200 points in each direction for different cutoffs of theall-electron density and different Nα interpolation points. The cutoffvalue for q0 was set to qcut
0 = 10. The change of the lattice constantis small overall when the density cutoff is increased for a constantNα . The variation is higher for constant cutoff and increasingnumber of interpolation points. For the highest density cutoff andthe highest number of interpolation points the data deviate becauseof an insufficient real-space grid.
Nα
�cut (a.u.) 20 30 40 50 80
20 5.740 5.734 5.731 5.730 5.733100 5.734 5.734 5.731 5.725 5.7421000 5.738 5.733 5.730 5.728 5.747
leads to a smaller error cancellation between exchange and theoverestimated correlation than for the optB88-vdW functional.
APPENDIX B: ALL-ELECTRON DENSITY BASEDLATTICE CONSTANTS
Our tests comparing the approximate vdW evaluation inVASP to all-electron calculations show very good agreementbetween both approaches. However, it is not clear whetherreference-quality calculations can be performed since the vdWenergy depends on the PAW potential used. In this part we aimto obtain all-electron based lattice constants and then assess theaccuracy of VASP against this benchmark. We start by showingthat by utilizing different PAW potentials the lattice constantsdiffer. For example, we show lattice constants of Ge evaluatedwith three different PAW potentials in Table V. The potentialsare Ge with 4 valence electrons, Ge d with 14 electrons,and a hard Ge h with 14 electrons. One can see that thedifferences between the optB86b-vdW lattice constants cannotbe completely attributed to the differences caused by the PAWpotential, shown by the optB86b-LDA values. Therefore in thefollowing we first test convergence of the various parametersinvolved. For this we use Ge because of its medium size andthe fact that three different PAW potentials are available for it.Later, in Sec. B 2 we obtain the all-electron based data for thewhole set.
To calculate the all-electron vdW energy we use a stand-alone program based on the vdW routines in SIESTA.46,80,81
However, the calculation of the AE based lattice constants isnot straightforward as several parameters need to be converged.Importantly, the AE density represented on a finite grid leadsto numerical errors close to the ionic cores. Therefore we firstsmoothly cut the electron density around the cores and testthe convergence of the other parameters. We then study theeffect of the cut of the density. Furthermore, we test whetherthe lattice constant can be evaluated using only the valenceelectron density. We use the lattice constant of Ge with theGe h PAW data set for the tests of the parameters.
1. Convergence testsThe efficient vdW algorithm introduces two basic parame-
ters that control the quality of interpolation of the q0 function:
TABLE VIII. Dependence of the Ge lattice constant on the all-electron density cutoff and the number of interpolation points Nα .The soft correction was not added to Enl
c . qcut0 = 10 was used. In this
case the all-electron density can be used without any cutoff (row ∞)since the contribution from the inner shells is small. The agreementwith data in Table VII is almost perfect, with the exception of thelattices obtained with �cut = 1000.
Nα
�cut (a.u.) 20 30 40 50 80
20 5.736 5.734 5.731 5.730 5.733100 5.731 5.734 5.731 5.725 5.7421000 5.732 5.731 5.728 5.726 5.743∞ 5.732 5.731 5.728 5.726 5.743
a cutoff qcut0 and number of interpolation points Nα . The vdW
energy also depends on the underlying FFT grid and the densitycutoff needed to avoid numerical errors close to the cores. TheFFT grid is the most straightforward parameter to convergeand we find that grid spacing around 0.03 A can be consideredconverged; compared to grid spacing of 0.04 A the latticeconstant changes by only 0.002 A.
The values of qcut0 and Nα affect the value of the lattice
constant more significantly. As can be seen in Table VI, thelattice constant seems to converge when both qcut
0 and Nα
are increased. The values of Nα = 30, qcut0 = 10 give results
that are in a very good agreement with the lattice constantsobtained with either Nα or qcut
0 increased. Moreover, the qcut0 =
10 values are almost identical to the values obtained withqcut
0 = 18. We therefore now set qcut0 = 10 and study how the
lattice constant depends on the density cutoff and Nα . Table VIIshows that the values first converge when Nα is increasedup to 40; further increase, to Nα = 50 and Nα = 80, givesoscillating values. This is more pronounced with higher densitycutoffs. This seems to be caused by “overinterpolation” of theq0 function, which would be probably less severe with an even
CuAg
Pd
RhLi
Na
KRb
Cs
CaSr
Ba
AlLiF
LiCl
NaFNaCl
MgO
CSiC
Si
GeGaAs
-2
-1
0
1
2
Dif
fere
nce
from
ref
eren
ce (
%)
optB86b-vdW VASPoptB86b-vdW valenceoptB86b-vdW AE no softoptB86b-vdW AE dens. cut
FIG. 7. (Color online) Lattice constants of various solids cal-culated with different approximations of the nonlocal van derWaals energy for the optB86b-vdW functional. The self-consistentimplementation in VASP and non-self-consistent calculations basedon the same density are reported. These use the real valence density(“valence”) and the all-electron density without (“AE no soft”) andwith (“AE dens. cut”) the soft correction. The VASP calculations tendto give better agreement with the AE calculations because of thepartial electronic core charge density added to the pseudo–valencedensity.
195131-10
VAN DER WAALS DENSITY FUNCTIONALS APPLIED TO . . . PHYSICAL REVIEW B 83, 195131 (2011)
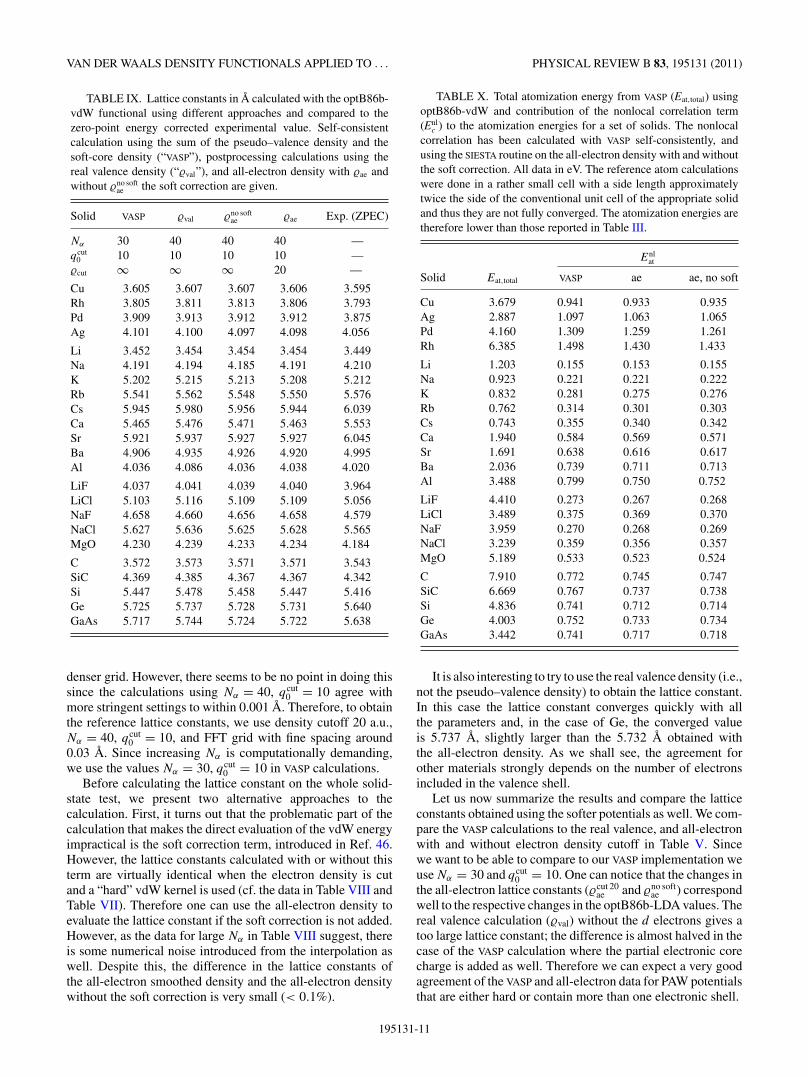
TABLE IX. Lattice constants in A calculated with the optB86b-vdW functional using different approaches and compared to thezero-point energy corrected experimental value. Self-consistentcalculation using the sum of the pseudo–valence density and thesoft-core density (“VASP”), postprocessing calculations using thereal valence density (“�val”), and all-electron density with �ae andwithout �no soft
ae the soft correction are given.
Solid VASP �val �no softae �ae Exp. (ZPEC)
Nα 30 40 40 40 —qcut
0 10 10 10 10 —�cut ∞ ∞ ∞ 20 —
Cu 3.605 3.607 3.607 3.606 3.595Rh 3.805 3.811 3.813 3.806 3.793Pd 3.909 3.913 3.912 3.912 3.875Ag 4.101 4.100 4.097 4.098 4.056
Li 3.452 3.454 3.454 3.454 3.449Na 4.191 4.194 4.185 4.191 4.210K 5.202 5.215 5.213 5.208 5.212Rb 5.541 5.562 5.548 5.550 5.576Cs 5.945 5.980 5.956 5.944 6.039Ca 5.465 5.476 5.471 5.463 5.553Sr 5.921 5.937 5.927 5.927 6.045Ba 4.906 4.935 4.926 4.920 4.995Al 4.036 4.086 4.036 4.038 4.020
LiF 4.037 4.041 4.039 4.040 3.964LiCl 5.103 5.116 5.109 5.109 5.056NaF 4.658 4.660 4.656 4.658 4.579NaCl 5.627 5.636 5.625 5.628 5.565MgO 4.230 4.239 4.233 4.234 4.184
C 3.572 3.573 3.571 3.571 3.543SiC 4.369 4.385 4.367 4.367 4.342Si 5.447 5.478 5.458 5.447 5.416Ge 5.725 5.737 5.728 5.731 5.640GaAs 5.717 5.744 5.724 5.722 5.638
denser grid. However, there seems to be no point in doing thissince the calculations using Nα = 40, qcut
0 = 10 agree withmore stringent settings to within 0.001 A. Therefore, to obtainthe reference lattice constants, we use density cutoff 20 a.u.,Nα = 40, qcut
0 = 10, and FFT grid with fine spacing around0.03 A. Since increasing Nα is computationally demanding,we use the values Nα = 30, qcut
0 = 10 in VASP calculations.Before calculating the lattice constant on the whole solid-
state test, we present two alternative approaches to thecalculation. First, it turns out that the problematic part of thecalculation that makes the direct evaluation of the vdW energyimpractical is the soft correction term, introduced in Ref. 46.However, the lattice constants calculated with or without thisterm are virtually identical when the electron density is cutand a “hard” vdW kernel is used (cf. the data in Table VIII andTable VII). Therefore one can use the all-electron density toevaluate the lattice constant if the soft correction is not added.However, as the data for large Nα in Table VIII suggest, thereis some numerical noise introduced from the interpolation aswell. Despite this, the difference in the lattice constants ofthe all-electron smoothed density and the all-electron densitywithout the soft correction is very small (< 0.1%).
TABLE X. Total atomization energy from VASP (Eat,total) usingoptB86b-vdW and contribution of the nonlocal correlation term(Enl
c ) to the atomization energies for a set of solids. The nonlocalcorrelation has been calculated with VASP self-consistently, andusing the SIESTA routine on the all-electron density with and withoutthe soft correction. All data in eV. The reference atom calculationswere done in a rather small cell with a side length approximatelytwice the side of the conventional unit cell of the appropriate solidand thus they are not fully converged. The atomization energies aretherefore lower than those reported in Table III.
Enlat
Solid Eat,total VASP ae ae, no soft
Cu 3.679 0.941 0.933 0.935Ag 2.887 1.097 1.063 1.065Pd 4.160 1.309 1.259 1.261Rh 6.385 1.498 1.430 1.433
Li 1.203 0.155 0.153 0.155Na 0.923 0.221 0.221 0.222K 0.832 0.281 0.275 0.276Rb 0.762 0.314 0.301 0.303Cs 0.743 0.355 0.340 0.342Ca 1.940 0.584 0.569 0.571Sr 1.691 0.638 0.616 0.617Ba 2.036 0.739 0.711 0.713Al 3.488 0.799 0.750 0.752
LiF 4.410 0.273 0.267 0.268LiCl 3.489 0.375 0.369 0.370NaF 3.959 0.270 0.268 0.269NaCl 3.239 0.359 0.356 0.357MgO 5.189 0.533 0.523 0.524
C 7.910 0.772 0.745 0.747SiC 6.669 0.767 0.737 0.738Si 4.836 0.741 0.712 0.714Ge 4.003 0.752 0.733 0.734GaAs 3.442 0.741 0.717 0.718
It is also interesting to try to use the real valence density (i.e.,not the pseudo–valence density) to obtain the lattice constant.In this case the lattice constant converges quickly with allthe parameters and, in the case of Ge, the converged valueis 5.737 A, slightly larger than the 5.732 A obtained withthe all-electron density. As we shall see, the agreement forother materials strongly depends on the number of electronsincluded in the valence shell.
Let us now summarize the results and compare the latticeconstants obtained using the softer potentials as well. We com-pare the VASP calculations to the real valence, and all-electronwith and without electron density cutoff in Table V. Sincewe want to be able to compare to our VASP implementation weuse Nα = 30 and qcut
0 = 10. One can notice that the changes inthe all-electron lattice constants (�cut 20
ae and �no softae ) correspond
well to the respective changes in the optB86b-LDA values. Thereal valence calculation (�val) without the d electrons gives atoo large lattice constant; the difference is almost halved in thecase of the VASP calculation where the partial electronic corecharge is added as well. Therefore we can expect a very goodagreement of the VASP and all-electron data for PAW potentialsthat are either hard or contain more than one electronic shell.
195131-11

KLIMES, BOWLER, AND MICHAELIDES PHYSICAL REVIEW B 83, 195131 (2011)
2. Comparison on the whole set
Now we proceed to calculate the lattice constants of thechosen solids using the approaches shown above. This allowsus to test whether we need to use the quite cumbersomeall-electron evaluation or whether VASP can be used. Weuse several ways to estimate the lattice parameter: First,we calculate it directly from VASP using the approximatedEnl
c . Second, the real valence density is used; third, theall-electron density without the soft correction. Finally, thevdW energy is calculated on the all-electron density witha density cutoff imposed to avoid numerical errors. TheVASP implementation uses Nα = 30 interpolation points withqcut
0 = 10; the real valence and all-electron calculations useNα = 40 interpolation points and qcut
0 = 10. The number ofFFT grid points is set by hand to a large number so that theintegration grid spacing is ∼0.03 A.
The lattice constants using optB86b-vdW are collected inTable IX and shown in Fig. 7. One can see that the data obtainedwith VASP (violet +) are in a very good agreement with theall-electron calculations (black +) that use smoothed electrondensity. This then justifies the approximations involved inthe evaluation of the vdW correlation energy in VASP. Thecalculations without the soft correction (green ×) on theall-electron density are generally very similar to the smootheddensity calculations. As we have shown earlier, this seemsto come more from the representation of the electron densityon the finite grid. We find the largest deviations from theAE results for alkali and alkali-earth metals, which are verysensitive to the errors in the vdW correction because oftheir small bulk moduli. This means that the lattice constantcalculated with the all-electron density has some error and thevery good agreement between the VASP and AE calculationsfor Cs might be accidental; the trend toward shortening thelattices with the increased size of the ion is not affected. Forthe other materials the differences are below 0.1%; i.e., theresults differ only at the third decimal place in most cases.This level of accuracy of our VASP calculations is more thansufficient to recover the trends and also similar to or betterthan the differences for the same solid and functional obtainedwith different codes.41
An interesting approach which would circumvent theproblematic calculation of the AE vdW correction would be to
use the real valence density to calculate Enlc . However, lattice
constants obtained with this approach (blue circles in Fig. 7)are slightly larger than the AE ones. This difference seemsto crucially depend on the number of shells included in thevalence; this is supported by the fact that the largest errors areobserved for Al (3 electrons in valence), Si (4), and As (5).Although the valence electron density based data cannot beused to obtain a reliable lattice constant in some cases, theyseem to give a good upper bound of the AE based values.
APPENDIX C: ALL-ELECTRON ATOMIZATIONENERGIES
To assess the validity of our implementation and to evaluateits accuracy we calculate the atomization energies of thesolids within VASP and with the all-electron postprocessingcorrection. A self-consistent calculation using optB86b-vdWis done for the solid close to the energy minimum and therespective atom or atoms in a large rectangular box (withapproximately two times larger sides). From this calculationwe obtain the approximate Enl
c . In the next step, the all-electrondensity from the VASP calculation is used to evaluate Enl,ae
c . Bysubtracting the solid energies per atom from the atomic ones,we obtain the nonlocal contribution to the atomization energyfor these two approaches which we can compare. The resultsare summarized in Table X where we show the Enl
c contributionto binding from VASP and from the all-electron calculationswith and without the soft correction, along with the totalatomization energy. The agreement is very good overall withthe errors in the total atomization energies below 2%. The softcorrection is not calculated in VASP; however, its effect on theatomization energies is negligible.
As was shown in the case of lattice constants the all-electrondensity based Enl,ae
c strongly depends on the underlying gridand high-density regions need to be cut. The problem is lesssevere in the case of atomization energies where we use exactlythe same grid spacing for the solid and atomic calculationsso that numerical inaccuracies cancel out. In most cases thecalculations with cut density give the same vdW contributionto the atomization energy (to within a meV). In a few casesthe contribution differs slightly (by up to 30 meV for Pd),and therefore we give the results calculated with the electrondensity cut above 100 a.u. in Table X.
*[email protected]. Andersson, D. C. Langreth, and B. I. Lundqvist, Phys. Rev. Lett.76, 102 (1996).
2J. F. Dobson and B. P. Dinte, Phys. Rev. Lett. 76, 1780 (1996).3M. Dion, H. Rydberg, E. Schroder, D. C. Langreth, and B. I.Lundqvist, Phys. Rev. Lett. 92, 246401 (2004).
4O. A. von Lilienfeld, I. Tavernelli, U. Rothlisberger, andD. Sebastiani, Phys. Rev. Lett. 93, 153004 (2004).
5J. Antony and S. Grimme, Phys. Chem. Chem. Phys. 8, 5287 (2006).6A. D. Becke and E. R. Johnson, J. Chem. Phys. 127, 154108(2007).
7S. Grimme, J. Antony, T. Schwabe, and C. Muck-Lichtenfeld, Org.Biomol. Chem. 5, 741 (2007).
8T. Sato, T. Tsuneda, and K. Hirao, J. Chem. Phys. 126, 234114(2007).
9A. Tkatchenko and M. Scheffler, Phys. Rev. Lett. 102, 073005(2009).
10T. Sato and H. Nakai, J. Chem. Phys. 131, 224104 (2010).11T. Sato and H. Nakai, J. Chem. Phys. 133, 194101 (2010).12Y. Zhang and W. Yang, Phys. Rev. Lett. 80, 890 (1998).13A. Gulans, M. J. Puska, and R. M. Nieminen, Phys. Rev. B 79,
201105(R) (2009).14A. K. Kelkkanen, B. I. Lundqvist, and J. K. Nørskov, J. Chem.
Phys. 131, 046102 (2009).15J. Klimes, D. R. Bowler, and A. Michaelides, J. Phys. Condens.
Matter 22, 022201 (2010).
195131-12

VAN DER WAALS DENSITY FUNCTIONALS APPLIED TO . . . PHYSICAL REVIEW B 83, 195131 (2011)
16P. Jurecka, J. Sponer, J. Cerny, and P. Hobza, Phys. Chem. Chem.Phys. 8, 1985 (2006).
17B. Li, A. Michaelides, and M. Scheffler, Surf. Sci. 602, L135 (2008).18B. Santra, A. Michaelides, M. Fuchs, A. Tkatchenko, C. Filippi,
and M. Scheffler, J. Chem. Phys. 129, 194111 (2008).19O. A. Vydrov and T. Van Voorhis, Phys. Rev. Lett. 103, 063004
(2009).20O. A. Vydrov and T. Van Voorhis, Phys. Rev. A 81, 062708 (2010).21K. Lee, E. D. Murray, L. Kong, B. I. Lundqvist, and D. C. Langreth,
Phys. Rev. B 82, 081101 (2010).22V. R. Cooper, Phys. Rev. B 81, 161104 (2010).23O. A. Vydrov and T. Van Voorhis, J. Chem. Phys. 133, 244103
(2010).24V. N. Staroverov, G. E. Scuseria, J. Tao, and J. P. Perdew, Phys.
Rev. B 69, 075102 (2004).25P. Lazic, Z. Crljen, R. Brako, and B. Gumhalter, Phys. Rev. B 72,
245407 (2005).26S. D. Chakarova-Kack, E. Schroder, B. I. Lundqvist, and D. C.
Langreth, Phys. Rev. Lett. 96, 146107 (2006).27P. Sony, P. Puschnig, D. Nabok, and C. Ambrosch-Draxl, Phys. Rev.
Lett. 99, 176401 (2007).28K. Johnston, J. Kleis, B. I. Lundqvist, and R. M. Nieminen, Phys.
Rev. B 77, 121404 (2008).29S. Yanagisawa, K. Lee, and Y. Morikawa, J. Chem. Phys. 128,
244704 (2008).30P. G. Moses, J. J. Mortensen, B. I. Lundqvist, and J. K. Nørskov, J.
Chem. Phys. 130, 104709 (2009).31K. Berland, T. L. Einstein, and P. Hyldgaard, Phys. Rev. B 80,
155431 (2009).32H. Chen, G. A. Voth, and N. Agmon, J. Phys. Chem. B 114, 333
(2010).33J. Carrasco, B. Santra, J. Klimes, and A. Michaelides, Phys. Rev.
Lett. 106, 026101 (2011).34M. S. Dyer, A. Robin, S. Haq, R. Raval, M. Persson, and J. Klimes,
ACS Nano 5, 1831 (2011).35P. J. Feibelman, Phys. Chem. Chem. Phys. 10, 4688 (2008).36J. Friedel, Proc. Phys. Soc. B 65, 769 (1952).37J. J. Rehr, E. Zaremba, and W. Kohn, Phys. Rev. B 12, 2062 (1975).38D. D. Richardson and J. Mahanty, J. Phys. C 10, 3971 (1977).39J. C. Upadhyaya and S. Wang, Phys. Lett. A 73, 238 (1979).40J. Tao, J. P. Perdew, and A. Ruzsinszky, Phys. Rev. B 81, 233102
(2010).41G. I. Csonka, J. P. Perdew, A. Ruzsinszky, P. H. T. Philipsen,
S. Lebegue, J. Paier, O. A. Vydrov, and J. G. Angyan, Phys. Rev.B 79, 155107 (2009).
42E. D. Murray, K. Lee, and D. C. Langreth, J. Chem. Theo. Comput.5, 2754 (2009).
43A. D. Becke, J. Chem. Phys. 85, 7184 (1986).44G. Kresse and J. Hafner, Phys. Rev. B 47, 558 (1993).45G. Kresse and J. Furthmuller, Comput. Mater. Sci. 6, 15 (1996).46G. Roman-Perez and J. M. Soler, Phys. Rev. Lett. 103, 096102
(2009).47P. E. Blochl, Phys. Rev. B 50, 17953 (1994).48G. Kresse and D. Joubert, Phys. Rev. B 59, 1758 (1999).49J. Paier, M. Marsman, K. Hummer, G. Kresse, I. C. Gerber, and
J. G. Angyan, J. Chem. Phys. 124, 154709 (2006).50P. Haas, F. Tran, and P. Blaha, Phys. Rev. B 79, 085104 (2009).51J. Harl, L. Schimka, and G. Kresse, Phys. Rev. B 81, 115126 (2010).
52A. E. Mattsson, R. Armiento, J. Paier, G. Kresse, J. M. Wills, andT. R. Mattsson, J. Chem. Phys. 128, 084714 (2008).
53J. Paier, R. Hirschl, M. Marsman, and G. Kresse, J. Chem. Phys.122, 234102 (2005).
54J. P. Perdew, A. Ruzsinszky, G. I. Csonka, L. A. Constantin, andJ. Sun, Phys. Rev. Lett. 103, 026403 (2009).
55R. Armiento and A. E. Mattsson, Phys. Rev. B 72, 085108 (2005).56Z. Wu and R. E. Cohen, Phys. Rev. B 73, 235116 (2006).57G. K. H. Madsen, Phys. Rev. B 75, 195108 (2007).58J. P. Perdew, A. Ruzsinszky, G. I. Csonka, O. A. Vydrov, G. E.
Scuseria, L. A. Constantin, X. Zhou, and K. Burke, Phys. Rev. Lett.100, 136406 (2008).
59D. C. Langreth and J. P. Perdew, Solid State Commun. 17, 1425(1975).
60O. Gunnarsson and B. I. Lundqvist, Phys. Rev. B 13, 4274(1976).
61D. C. Langreth and J. P. Perdew, Phys. Rev. B 15, 2884 (1977).62L. Schimka, J. Harl, and G. Kresse, J. Chem. Phys. 134, 024116
(2011).63A. Puzder, M. Dion, and D. C. Langreth, J. Chem. Phys. 124,
164105 (2006).64E. Ziambaras, J. Kleis, E. Schroder, and P. Hyldgaard, Phys. Rev.
B 76, 155425 (2007).65O. A. von Lilienfeld and A. Tkatchenko, J. Chem. Phys. 132,
234109 (2010).66P. Haas, F. Tran, P. Blaha, K. Schwarz, and R. Laskowski, Phys.
Rev. B 80, 195109 (2009).67F. Tran, R. Laskowski, P. Blaha, and K. Schwarz, Phys. Rev. B 75,
115131 (2007).68A. E. Mattsson and T. R. Mattsson, J. Chem. Theory Comput. 5,
887 (2009).69Although LDA is known to give shorter lattice constants, this is
because of the exchange part; the LDA correlation is underbinding.70T. van Mourik and R. J. Gdanitz, J. Chem. Phys. 116, 9620
(2002).71K. Pernal, R. Podeszwa, K. Patkowski, and K. Szalewicz, Phys.
Rev. Lett. 103, 263201 (2009).72O. A. Vydrov, Q. Wu, and T. Van Voorhis, J. Chem. Phys. 129,
014106 (2008).73K. Rosciszewski, B. Paulus, P. Fulde, and H. Stoll, Phys. Rev. B 60,
7905 (1999).74S. J. Nolan, M. J. Gillan, D. Alfe, N. L. Allan, and F. R. Manby,
Phys. Rev. B 80, 165109 (2009).75S. Tosoni and J. Sauer, Phys. Chem. Chem. Phys. 12, 14330 (2010).76G. R. Jenness, O. Karalti, and K. D. Jordan, Phys. Chem. Chem.
Phys. 12, 6375 (2010).77A. Gruneis, M. Marsman, and G. Kresse, J. Chem. Phys. 133,
074107 (2010).78B. Santra, A. Michaelides, and M. Scheffler, J. Chem. Phys. 127,
184104 (2007).79R. Podeszwa, K. Patkowski, and K. Szalewicz, Phys. Chem. Chem.
Phys. 12, 5974 (2010).80J. M. Soler, E. Artacho, J. D. Gale, A. Garcıa, J. Junquera,
P. Ordejon, and D. Sanchez-Portal, J. Phys. Condens. Matter 14,2745 (2002).
81E. Artacho, E. Anglada, O. Dieguez, J. D. Gale, A. Garcıa,J. Junquera, R. M. Martin, P. Ordejon, J. M. Pruneda, D. Sanchez-Portal et al., J. Phys. Condens. Matter 20, 064208 (2008).
195131-13