valuing adult learning: comparing wellbeing valuation to … · 2020-03-04 · to adult learning,...
TRANSCRIPT

1
BIS RESEARCH PAPER NUMBER 85
Valuing Adult Learning: Comparing Wellbeing Valuation to Contingent Valuation
NOVEMBER 2012
Authors: Paul Dolan and Daniel Fujiwara
With: The Centre for Economic and Social Inclusion, and Ipsos MORI
The views expressed in this report are the authors’ and do not necessarily reflect those of the Department for Business, Innovation and Skills.
Department for Business, Innovation and Skills
1 Victoria Street
London SW1H 0ET
www.bis.gov.uk Research paper number 85 November 2012
2

Contents Contents .......................................................................................................................................... 3
Executive summary ........................................................................................................................ 5
Background................................................................................................................................... 5
Methods ........................................................................................................................................ 5
Wellbeing valuation................................................................................................................... 5
Contingent valuation ................................................................................................................. 5
Results ...................................................................................................................................... 6
Conclusion ................................................................................................................................ 6
1. Background ............................................................................................................................. 7
2. Wellbeing valuation ................................................................................................................ 9
2.1. Wellbeing data................................................................................................................. 10
2.2. Wellbeing results ............................................................................................................. 13
2.2.1. Regression results ........................................................................................................ 13
2.2.2. Valuation results............................................................................................................ 15
2.3. Discussion of wellbeing valuation results ........................................................................ 17
3. Contingent valuation ............................................................................................................ 18
3.1. Study design.................................................................................................................... 18
3.1.1. Sample.......................................................................................................................... 20
3.2. Results ............................................................................................................................ 20
3.2.1. Main results................................................................................................................... 20
3.2.2 Effect of background variables....................................................................................... 22
3.3. Discussion of contingent valuation results ...................................................................... 23
4. Discussion................................................................................................................................ 25
3
Value Adult Learning: Comparing Wellbeing Valuation and Contingent Valuation
Annex 1: Wellbeing Evaluation – Additional Regression Results............................................ 26
Annex 2: Contingent Valuation Survey - Technical report........................................................ 27
Sample ........................................................................................................................................ 27
Fieldwork................................................................................................................................. 28
Cooperation Rates .................................................................................................................. 29
Annex 3: Contingent Valuation Survey - Questionnaire ........................................................... 31
References..................................................................................................................................... 38
4

Value Adult Learning: Comparing Wellbeing Valuation and Contingent Valuation
Executive summary
Background
Good adult learning benefits society and it benefits those who receive it. But just how good is it? Economists think about individual benefits in terms of utility. Since this is a rather abstract concept, we like to convert changes in utility to changes in money. This also has the great benefit of allowing us to compare the costs of adult learning with its benefits in the same currency, quite literally.
We can think about utility either as experienced utility – adult learning makes people think and feel better about life – or in terms of preference – or as decision utility – adult learning is something people desire. We explore the use of both methods in this project, and compare the results generated by each.
Methods
Wellbeing valuation
Experienced utility is typically proxied reports of subjective wellbeing, often captured by ratings of life satisfaction. The first step when using this approach is to establish the change in life satisfaction that is attributable to the ‘good’ in question, in this case adult learning. The second step is to establish the change in life satisfaction that is attributable to income. The final wellbeing valuation step shows the amount of income that brings about the same change in life satisfaction that is brought about by adult learning.
The data for the wellbeing valuation part of this study come from the British Household Panel Survey (BHPS). The BHPS is a nationally representative sample of over 10,000 adult individuals conducted between September and December of each year from 1991. Respondents are asked lots of things about their life and circumstances, including their income, and their life satisfaction. The BHPS also contains a number of variables related to adult learning, including whether someone is taking a part-time course, has received a qualification and the reason for undertaking the learning.
Contingent valuation
Decision utility is typically proxied by people’s willingness to pay, elicited, where no good market data are available, by asking people hypothetical contingent valuation questions. We must decide ‘what’ is to be valued; ‘how’ are values to be elicited; and ‘who’ should values be elicited from? The ‘what’ here are the main benefits from adult learning, such as being able to pursue a career – and also being more satisfied with life. The ‘how’ is out of pocket payments for a year. The ‘who’ are those with experience of adult learning.
The contingent valuation survey used disproportionately stratified random sampling of: 1) learners aged 18 or older were those who had recently completed (within a year of the interview) one of two broad categories of courses – informal Adult and Community Learning or Basic Skills Qualifications; and for the purposes of comparison 2) a group of learners of the same age were who had completed a full Level 2 National Vocational
5

Value Adult Learning: Comparing Wellbeing Valuation and Contingent Valuation
Qualification (NVQ) over the same time period. A total of 1,001 interviews were completed from an issued sample of 3,647 learners; the adjusted response rate was 47%.
Results
Using the wellbeing valuation method, we estimate that the value of undertaking a part-time course for work over the past year is £1,584. In other words, undertaking part-time adult learning has on average a positive effect on people's life satisfaction which is equivalent to £1,584 of income per year. The corresponding value for one part-time course for work is £754.
Using the contingent valuation method, we find that a course that enabled someone to progress in their work or career is, on average, valued at £1070. This is the most highly valued benefit. The least important benefit is "enabled you to help your children with school”, with an average WTP of £435. The impact on life satisfaction is valued as the second most important benefit: a course that made them more satisfied with their life overall is, on average, valued at £947.
Conclusion
It would not be unreasonable to conclude that an adult learning course that improves life satisfaction has a value to those who receive it of somewhere between £754 and £947. The estimates from the two methods, wellbeing valuation and contingent valuation, have been found to be reasonably close to one another. They are also quite similar to the market price of business-related courses, which lends support to the face validity of the estimates.
6

Value Adult Learning: Comparing Wellbeing Valuation and Contingent Valuation
1. Background There are essentially two main ways to value non-market goods – through people’s subjective wellbeing or through their preferences. In many respects, the wellbeing approach we discuss in Part 1 is the ‘new kid on the block’, but with an old history. Jeremy Bentham first defined utility in hedonic terms, as a measure of pleasure and pain and Francis Edgeworth even imagined a ‘hedonimeter’, an instrument that measures the utility of moments of experience and plots experienced utility as a continuous function of time (Kahneman et al., 1997; Read, 2007). He proposed that the area under the curve represents the individual’s total wellbeing over a given period.
The life satisfaction data we use in Part 1 are not a continuous function of time (rather, they are snapshot assessments) and they may reflect something more than hedonic experience alone (allowing for an evaluative of how well life is going in general). But they are in the spirit of experienced utility, where utility is conceptualised according to ‘mental states’; that is, things matter in accordance to their impact upon our thoughts and feelings (Dolan and White, 2007).
This might all sound rather odd to a mainstream economist. Economists abandoned experienced utility early in the twentieth century, in favour of a new interpretation, in which utility represents ‘wantability’ (Fisher, 1918). A person’s decision utilities are revealed by her choices. Neoclassical welfare economics rests on a concept of decision utility that is cleansed of any reference to hedonic experience and which assumes that decision utility can be inferred from the preferences that agents reveal in their market choices (Dolan and Kahneman, 2008).
Where markets do not exist, as in the valuation of non-market goods, economists have looked to using market data to make inferences about people’s preferences from market data. We do not have direct data on people’s preferences over jobs that involve different risks of death and injury, for example. But we do have data on the wages associated with those jobs. If markets work perfectly, we can control for all the things that make jobs different, leaving us with the wage premium associated with a higher risk. But markets do not work perfectly, of course (who really knows about the risk of injury in their workplace?) and in many areas, any (let alone good) market data simply do not exist.
Economists have therefore further developed procedures to measure decision utilities by eliciting hypothetical choices. The contingent valuation (CV) method is frequently used to value non-market goods, in the contexts of environmental litigation or cost-benefit analysis. The method involves surveys in which respondents are asked to state their willingness to pay (WTP) for a given benefit. WTP lies at the heart of the UK Treasury guidance on economic appraisal in its ‘Green Book’ (HM Treasury, 2003).
Decision utility and experienced utility will have the same extension if people want (most) what they will eventually enjoy (best), and this is an assumption that is implicitly adopted in many economic analyses. If the assumption held, it would not matter much whether we used a wellbeing approach or a CV approach to measuring the value of non-market goods.
7

Value Adult Learning: Comparing Wellbeing Valuation and Contingent Valuation
There are good grounds, and some pretty compelling evidence, to believe that decision utility and experienced utility will differ (Dolan and Kahneman, 2008), but there is actually very little direct evidence comparing wellbeing valuation and CV in the same policy area (Dolan and Metcalfe, 2008)
In Part 2 of this project, we elicit WTP values about stylised future benefits of adult learning from those with past experience of adult learning. The results from this study are not directly comparable to those from Part 1 on wellbeing valuation since the estimates come from different populations. But the two sets of values are drawn from the same overall sample; that is, those who have experienced some form of adult learning in the UK.
8

Value Adult Learning: Comparing Wellbeing Valuation and Contingent Valuation
2. Wellbeing valuation An increasingly popular approach to valuation uses measures of subjective wellbeing (SWB) from large national datasets. It is assumed that SWB represents a good proxy for an individual‘s wellbeing (or underlying utility in the language of economics). By using the latest developments in regression analysis, it is possible to show the degree to which different factors affect SWB. If income is included as one of these factors, we can estimate the exchange rate between income and any of the other factors (to estimate what economists refer to as equivalent and compensating variations).
For example, if a 20% reduction in local crime rates increases the SWB of an individual by one index point and an increase in household income of £5,000 per year also increases SWB by one index point, then we would conclude that the a 20% reduction in crime is worth £5,000 per year to them. Formally, willingness to pay (WTP) and willingness to accept (WTA) are estimated in this approach as follows:
(1)
(2)
Where = price levels, = the non-market good, = income and the superscripts 0 and 1 respectively signify the states before and after the non-market good is consumed.
In practice, (1) and (2) are estimated econometrically using the direct utility function: , where a measure of SWB is used for utility ( ). The most frequently used measure of SWB is life satisfaction (LS). LS provides a global measure of wellbeing in that it made up of a combination of affect (positive and negative emotions and feelings) with a cognitive assessment of how well life is going overall (Diener, 1984; Kahneman and Krueger, 2006).
In theory, LS can be seen to represent in some sense the economist‘s notion of utility (Frey et al., 2009; Frey et al., 2004), and there is some evidence to support such a view. For example, Sandvik et al (1993) demonstrate that there is a strong positive correlation between LS and emotions such as smiling and frowning. Urry et al. (2004) show that reports of LS are correlated with activity in the left pre-frontal cortex of the brain, which is the area associated with sensations of positive emotions and pleasure.
Furthermore, LS is a good predictor of health, such as heart disease, strokes and recovery from viruses and wounds (for more details see Fujiwara and Campbell, 2011). Krueger and Schkade (2008) find that LS responses have sufficiently high retest reliability. Therefore, in this paper we take the standard approach and focus on LS.
Using panel (longitudinal) data the following LS function is estimated:
(3)
9

Value Adult Learning: Comparing Wellbeing Valuation and Contingent Valuation
where = the income of individual i at time t, = the level of a non-market good consumed by individual i at t and = a vector of individual characteristics and other factors that impact on LS. To place a value on adult learning, we use variable(s) that proxy for whether the individual is undertaking adult learning for . Then WTP for adult learning can be estimated by calculating the MRS between income and the adult learning variable using the estimated coefficients from (3):
(4)
There are a number of advantages related to this approach. First, it does not rely on people having well-defined preferences about the non-market good and it does not require markets to be in equilibrium. The former is a critical assumption for stated preference valuation techniques, such as contingent valuation, and the latter is a requirement for revealed preference techniques. Second, it does not suffer from the survey-related biases that are prevalent in stated preference techniques. These include strategic bias, hypothetical bias, embedding effects and anchoring effects (for a full discussion see Frey et al., 2004 and Fujiwara and Campbell, 2011).
2.1. Wellbeing data
The data used to estimate equations (3) come from the British Household Panel Survey (BHPS). The BHPS is a nationally representative sample of over 10,000 adult individuals conducted between September and December of each year from 1991. Respondents are interviewed in successive waves, and all adult members of a household are interviewed.
The LS question was added to the BHPS in 1997.
Individuals are asked 'How dissatisfied or satisfied are you with your life overall?' and then asked to rate their level of satisfaction on a scale of 1 (not satisfied at all) to 7 (completely satisfied).
In terms of the explanatory variables to include in the LS function, we use guidelines set out in recent UK Government guidance (Fujiwara & Campbell, 2011) and include the following variables:
Income
Demographic factors
Marital status
Educational status
Employment status
Health status
10

Value Adult Learning: Comparing Wellbeing Valuation and Contingent Valuation
Housing and environmental conditions and crime levels in the vicinity
Number of children and other dependents (including caring duties)
Geographic region
Year
There is a large literature relating to the problem of endogeneity in the income variable in SWB regressions; that is, income is partly determined by SWB. We employ an over-identified instrumental variable model, where income is instrumented by (i) whether the person has a mortgage and (ii) whether their spouse is employed.
This is the same strategy as that employed by Dolan and Metcalfe (2008) who found these instruments to pass tests of over-identification and hence to be reasonably robust. We hypothesise that having a mortgage is positively related to income because people with mortgages are required to earn more money relative to people who rent housing. This is because renters can accommodate falls in income more readily by switching to lower rental properties, whereas home-owners are far less mobile. We propose that the exclusion restriction is valid because factors on which people may ‘select into’ having a mortgage such as education, marital status and health are controlled for in the first stage.
Spouse's employment variables have been used as income instruments by a number of studies (e.g., Chevalier and Lydon, 2002; Luttmer, 2005). We assume that human capital has positive externalities in that a spouse's education has a positive impact on own levels of human capital (Benham, 1974). Here, employment status is used as an indicator of the level of human capital and so we would expect spouse's employment to be positively correlated with own income.
The BHPS contains a number of variables related to adult learning, including whether someone is taking a part-time course, has received a qualification and the reason for undertaking the learning. For the adult learning variables ( in (3) we use the following:
Taken a part-time course in the past year and for what reasons (i.e. general learning or for work);
Number of courses taken in the past year;
Whether received a qualification in the past year.
The sample is restricted to people aged 18 and over and we exclude those undertaking full-time education.
The definitions of the variables and their descriptive statistics are presented in Table 1.
11

Value Adult Learning: Comparing Wellbeing Valuation and Contingent Valuation
Table 1: Life satisfaction regression (using the only adult learning variable that is significant)
Variable Description Mean Std. Dev
Life satisfaction reported satisfaction with life (on scale of 1 ‐ 7) 5.16 0.123
ln HH income log of equivalised household income 9.9 0.68
pt course for work = 1 if individual has taken part in part‐time work‐related course over the past year 0.21 0.41
Unemployed = 1 if individual is unemployed 0.13 0.34
Retired = 1 if individual is retired 0.05 0.22
Age age of individual 36.03 12.99
age2 age of individual squared N/A N/A
no. of children number of children the individual has 0.63 0.97
poor health = 1 if individual rates him/herself to be in poor health 0.07 0.26
Married = 1 if individual is married 0.45 0.5
Divorced = 1 if individual is divorced 0.05 0.22
Widowed = 1 if individual is widowed 0.01 0.11
Separated = 1 if individual is separated 0.02 0.14
never married = 1 if individual has never married 0.28 0.45
caring duties = 1 if individual provides caring duties for someone 0.04 0.2
live in safe area = 1 if individual rates their area as safe 0.82 0.38
Year year of the interview N/A N/A
Wales = 1 if individual lives in Wales 0.15 0.35
Scotland = 1 if individual lives in Scotland 0.18 0.38
N_Ireland = 1 if individual lives in Northern Ireland 0.1 0.3
12

Value Adult Learning: Comparing Wellbeing Valuation and Contingent Valuation
2.2. Wellbeing results
2.2.1. Regression results
The results from the two-stage least squares instrumental variable regressions are presented in Table 2. Overall, our results are consistent with the existing literature. In line with previous studies, we find employment status, health and marital status to be significant determinants of LS.
We find that only one adult learning variable has a statistically significant effect on LS. This is the binary variable indicating that the individual has taken a part-time course to improve job prospects (pt course for work). The results suggest that undertaking a part-time course that (i) helped to get the current job, (ii) increased skills for work or (iii) improved skills for work increases LS by 0.045 index points.
This is of a similar magnitude to Matrix's (2009) results that also use the BHPS. Matrix found that part-time learning that leads to a formal qualification (the closest definition of adult learning to ours) increased LS by 0.030 index points. Part-time courses to develop skills generally, the number of part-time courses undertaken and getting a qualification did not have any significant effects on LS.
It is therefore only possible to derive a monetary value for the variable pt course for work. It is clear that learning that has some specified purpose is valuable to the individual. Clearly, this type of learning will improve earnings and employment potential for individuals, but there are likely to be many other benefits such as improved confidence, self-esteem and social networks that are reflected in the positive coefficient on part-time learning for work. Because only pt course for work is significant these wider benefits may only be prevalent in these types of courses.
Our instrumental variables strategy for income results in an increase in the income coefficient from 0.086 to 0.336, which is in line with magnitude of increase found in the literature to date (in general there is a two to three-fold increase in the income coefficient in LS regressions when using instrumental variables for income (Pischke, 2010)). This suggests that in standard ordinary least squares estimation, the income variable is likely to suffer from measurement error and/or the bias is negative, in that happier or more satisfied people are likely to work and earn less (Dolan and Metcalfe, 2008).
13

Value Adult Learning: Comparing Wellbeing Valuation and Contingent Valuation
Table 2: Life satisfaction regression
Coefficient Standard error P>z
Constant 3.183*** 0.434 0.00
ln HH income 0.336*** 0.048 0.00
pt course for work 0.045** 0.020 0.03
unemployed ‐0.221*** 0.026 0.00
retired 0.189*** 0.050 0.00
age ‐0.066*** 0.006 0.00
age2 0.001*** 0.000 0.00
no. of children 0.017 0.014 0.24
poor health ‐0.906*** 0.042 0.00
married 0.083*** 0.025 0.00
divorced ‐0.253*** 0.050 0.00
widowed ‐0.297*** 0.087 0.00
separated ‐0.468*** 0.070 0.00
never married ‐0.266*** 0.027 0.00
caring duties ‐0.148*** 0.049 0.00
live in safe area 0.165*** 0.024 0.00
year ‐0.014*** 0.003 0.00
Wales 0.032 0.025 0.20
Scotland ‐0.020 0.022 0.37
N_Ireland 0.193*** 0.031 0.00
observations 21,225
Notes: *** 0.01 significance level, ** 0.05 significance level, * 0.10 significance level. 2SLS regression model. Income is instrumented by whether the individual has a mortgage and whether the spouse is in work. Reference groups: (i) for employment variables ref = employed; (ii) for marital status ref = non-married co-habiting; (iii) for region ref = England. Sample is restricted to those aged 18 and over and excludes students in full-time education.
Dolan et al (2011) show that even under instrumental variable estimation, the income coefficient is likely to be under-biased because the indirect effects of income cannot be picked up in standard regression models. This will lead to inflated value or WTP estimates in the WV approach.
As in Dolan et al (2011), we hypothesise that income has direct and indirect effects on wellbeing as income can lead to improvements in other determinants of LS that are controlled for in the model. For instance, income is likely to affect health, retirement status and the neighbourhood that people choose to live in. One way to test for magnitude of indirect effects is to run an auxiliary regression in which income is regressed on to the
14

Value Adult Learning: Comparing Wellbeing Valuation and Contingent Valuation
other explanatory variables in the model. The results of this auxiliary regression are presented in Table A1 in Annex A.
There is no statistical test for indirect effects or multi-collinearity, but using Klein's Rule of Thumb we find that income is likely to be highly correlated with the other variables in the regression, suggesting that many indirect effects of income may be controlled for (and hence excluded from the income coefficient) in our regression. Klein’s Rule of Thumb is a indicative examination for correlations between the explanatory variables. It states that if the R2 in the auxiliary regression is higher than the R2 from the original regression, then multi-collinearity is likely to be a problem (see Gujarati (2003) for further details).
We also ran an auxiliary regression for pt course for work but did not find a multi-collinearity problem and hence there are unlikely to be any significant indirect effects of part-time learning that we are not picking up in this model.
The magnitude of the indirect effects can be assessed by dropping the mediating variables from the regression. This can, however, lead to omitted variable bias and so instead we imitate Groot and van den Brink (2006) and use lagged variables for those mediators through which we hypothesise that income may affect LS. These are part-time course; health; marital status variables; retirement; caring; living in a safe area. The results of this regression can be found in Table A2 in the Annex.
Acknowledging the indirect effects of income through these variables results in an increase in the income coefficient as would be expected. There is a 70 per cent increase in the coefficient on income from 0.336 to 0.574. It is the latter value that we use in the calculation of monetary estimates.
2.2.2. Valuation results
Coefficients for pt course for work (from Table 2) and income from (Table A2) can be used to estimate equation (4) (median income for the sample is £21,000):
(4)
The value derived from the WTP calculation in (4) is based on annual survey readings of SWB and the other variables and hence is taken to be the annual level of WTP. Therefore, the WTP or value of undertaking a part-time course for work over the past year is £1,584. In other words, undertaking part-time adult learning has on average a positive effect on people's LS which is equivalent to £1,584 of income per year; people should therefore be willing to pay up to £1,584 per year to undertake part-time courses if they are seeking to maximise LS.
It should be noted that this WTP figure is calculated at the median level of income for the sample (median income (£21,000) enters equation (4)). From (4) it is clear that this figure would differ depending on the level of income used in the calculation. Since our modelling captures the phenomenon of decreasing marginal utility of income, marginal changes in income are worth more for poorer people. This means that for a given change in SWB, due to something like adult learning, lower levels of income will result in smaller values. So for example, we find above that a part time course (for work) leads to an increase in LS of 0.045 index points. Now, if income has a much greater impact for poorer groups it will not
15

Value Adult Learning: Comparing Wellbeing Valuation and Contingent Valuation
require much money to get the equivalent 0.045 index point-change in LS for poorer groups.
It must be clearly stated here, however, that we cannot tell from our results if poorer groups do actually value adult learning less. This is because the coefficient on adult learning in Table 2 is taken from an overall sample including both poor and rich groups. In fact we would need to run separate LS regression models for different income groups to answer this question. It may well be that although income has a much greater impact for poorer groups, adult learning may also have a much greater impact too (i.e., the coefficient on adult learning for poorer groups > 0.045) which would cancel out this effect and may even be large enough to result in a finding that poorer groups value adult learning more.
Note that the definition of average income for the sample used in equation (4) makes a difference. Here we have used median income since income data is usually highly positively skewed. If we had used mean income instead the value estimates we derive for the sample would have been slightly higher since mean income > median income.
This figure can be compared to Matrix's (2009) study on the value of formal and informal part-time adult learning. Matrix derive a value of £4,704 per year for formal (i.e. leading to a qualification) part-time learning. This is significantly higher than our estimate because our study uses a different instrumental variable for income and we also acknowledge the indirect effects of income. This leads to our income coefficient being significantly larger and this will have the effect of reducing the value estimate for adult learning.
We find that those who do undertake part-time courses for work on average take 2.1 courses per year. This allows us to calculate the value per course, which is a more intuitive measure. Our preferred approach thus suggests that the value of one part-time course for work is £754. People should therefore be willing to pay up to £754 per part-time course if they are seeking to maximise LS.
It is interesting to compare this figure against current market prices for work-related part-time courses. For example business-skills related courses featured in Courses Direct1 range from about £350 to £600 per course. Reed Learning2 is a large provider of professional business training courses: IT courses cost around £300 per course; marketing courses cost about £700 per course and professional development courses cost about £500 per course.
Our WTP estimate is higher than these average prices for work-related courses and this is what we would expect. If people have a reasonable understanding of the benefits of undertaking a part-time course, they will in theory pay up to £754 per course on average. The similarity between our WTP estimates and the market prices of work-related courses
1 http://coursesdirectonline.co.uk/?gclid=CNfVxaWrtK0CFWIntAodRBTdlg
2 http://www.reedlearning.co.uk/
16

Value Adult Learning: Comparing Wellbeing Valuation and Contingent Valuation
and the fact that market prices on average lie below average WTP provides strong support for the validity of the valuation figures we have derived.
2.3. Discussion of wellbeing valuation results
In this first part of the project, we look at the increase in SWB from participation in adult learning. We find that, on average, adults participating in part-time courses that (i) help people find work, (ii) increase skills for work or (iii) improve skills for work have higher levels of life satisfaction, controlling for other observable characteristics. This type of learning could improve earnings and employment potential for these individuals, but there are likely to be many other benefits, such as improved confidence, self-esteem and social networks that are reflected in the positive coefficient on part-time learning.
We use innovative econometric methods to estimate the monetary value of adult learning. Estimating the effects for those on median income, the positive effect on SWB is equivalent to having an extra £1,584 per year of income. As people who undertake this kind of adult learning take an average of just over 2 courses per year, this equates to a value of £754 per course. This figure is similar to the market price of business-related courses, which lends support to the face validity of the estimates.
We are currently extending the wellbeing valuation approach to capture more of the intangible benefits of adult learning, including health, civic participation and family interactions, as well as the impact on behaviours and attitudes (this has not received significant attention in the past, and it will provide a fuller picture of the wider benefits of learning). As with the analysis reported here, we are using the BHPS, and it is published alongside this report.
As things stand, we have demonstrated that the SWB approach to valuation provides a valid addition, and possible alternative, to more traditional valuation techniques, such as contingent valuation and revealed preference methods. In Part 2 of this project, we will derive values for adult learning using the contingent valuation method, so that we can compare values from SWB to more conventional WTP estimates.
17

Value Adult Learning: Comparing Wellbeing Valuation and Contingent Valuation
3. Contingent valuation
3.1. Study design
As with any valuation study, there are three main issues that need to be resolved when conducting a CV study, relating to ‘what’, ‘how’ and ‘who’. First, what exactly is to be valued (what is the valuation contingent upon)? Second, how are values to be elicited (what is the payment vehicle and duration)? And third, from whom should values be elicited (what is the sample of respondents)?
The ‘what’ is to be valued in this study are the main benefits from adult learning. We focus here on the outcomes of adult learning and not any costs and benefits associated with the process of learning. We are interesting in lasting benefits and not the fleeting pleasures or pains from the experience itself, such as those derived from the classroom environment, the smile on the face of the tutor, or the annoyance from a talkative classmate. We appreciate that processes matter, both in themselves and in terms of their impact upon consequences (Dolan et al.), but how to better design adult learning itself should be the subject of separate inquiry. A focus here on outcomes also allows for more direct comparison with the results from the wellbeing valuation, which similarly seeks to pick up the consequences of adult learning.
After discussion amongst the research group and with the funders, we settled on the following ‘top ten’ benefits:
1. Led to a certificate or qualification;
2. Enabled you to progress in work or a career;
3. Enabled you to improve your knowledge or skills;
4. Enabled you to progress into further learning;
5. Helped you to feel more confident in being with family and other people;
6. Helped to keep your body and mind active;
7. Improved your happiness on a day-to-day basis;
8. Made you more satisfied with your life overall;
9. To become a more confident parent;
10. To be able to help your children with school.
There are three main issues relating to ‘how’ to elicit values. The first is the form of payment e.g. through increased taxation, out of pocket payments etc. We opted for out of
18

Value Adult Learning: Comparing Wellbeing Valuation and Contingent Valuation
pocket payments, since this draws attention to the opportunity cost of the amount stated, as well as mitigating any concerns about how tax revenues would be spent. The second is the time frame over which payments are made. We opted for a one year time frame since this is not too short a period for people to come up against a budget constraint but not too long that future discounting might bias any estimates.
The third issue relates to how the values themselves are elicited. The way that generates the most data at least cost is to ask people an open-ended question about their maximum willingness to pay. Of course, giving an answer to that kind question is not itself straightforward, not least because ‘drawing down’ a number from a range of possible values is cognitively challenging task.
Some economists have therefore suggested making things easier for respondents by asking them whether they would or would not be willing to pay a stated amount. The NOAA Panel recommendations, for example, suggest dichotomous choice questions along these lines (Arrow et al., 1993). Whilst easier on respondents, dichotomous choice questions are harder on the data, in that large samples are required to generate WTP estimates. A ‘middle ground’ presents each respondent with a series of pairwise choices but this is quite burdensome on respondents. Because of resource constraints and the practicalities of the study, we adopted an open-ended format in this study.
The question of ‘who’ responses should be elicited from essentially boils down to a choice between getting values from a representative general population sample or from a sample that is representative of those with experience of the good in question. The clear steer in this project was to elicit values from those with experience of adult learning, thus lending credibility to the values generated. But note that the values were elicited in an ex ante (before the event) context which is consistent with much of the CV literature and fits well with the Green Book on the appraisal of policies before their implementation.
A crucial additional issue, irrespective of the precise answers to the ‘what’, ‘how’ and ‘who’ questions, is how to elicit truthful responses. A large number of studies have reported stated WTP for a good in a hypothetical setting is higher than actual WTP, when respondents are required to pay the amount they state. This has been named hypothetical bias and it has been found to inflate WTP values by two- or threefold (List and Gallet, 2001; Murphy et al., 2005).
An increasingly popular approach to reducing hypothetical bias is to use ‘cheap talk’ scripts (Cummings and Taylor, 1999; Loomis, 2011). These essentially tell the respondents about the potential problem of hypothetical bias and ask them to report their WTP as truthfully as possible as if it were a real market transaction. Under some circumstances ‘cheap talk’ scripts have been found to be effective in reducing hypothetical WTP to levels similar to actual WTP (Cummings and Taylor, 1999).
We therefore use the following script immediately before asking people about their WTP (in fact, it was randomised across the sample population so that we can test its effect): ‘Before I come to the next questions I would just like to say that experiences from similar studies show that people sometimes say they would do one thing but in reality they do something else. For example, when asking about how much a course is worth, some say a low amount of money or even nothing, because they believe everyone should get this learning free of charge. Or they may state a higher amount because they want to show the
19

Value Adult Learning: Comparing Wellbeing Valuation and Contingent Valuation
immense value they would get from the course. We do not want you to think in these ways when answering our questions but rather to give as honest a response about how much you would be willing to pay for the learning. Bearing this in mind, I’d now like you to think about doing more learning. I am going to ask how much you would pay per month for one year for learning that would give you each of the benefits we just talked about.’
Overall, our study is actually similar to Carlsson et al. (2009) who look at WTP to prevent power outages. The studies are similar in that (i) we question and elicit WTP values for multiple aspects of the good (ten elements of adult learning); (ii) we use an open-ended payment format; (iii) we use people with experience of the good; and (iv) we randomise a cheap talk script across respondents.
3.1.1. Sample
Details of the sampling and survey can be found at Annex 2. This survey used disproportionately stratified random sampling of: 1) learners aged 18 or older were those who had recently completed (within a year of the interview) one of two broad categories of courses – informal Adult and Community Learning or Basic Skills Qualifications; and for the purposes of comparison 2) a group of learners of the same age who had completed a full Level 2 National Vocational Qualification (NVQ) over the same time period. A total of 1,001 interviews were completed from an issued sample of 3,647 learners, giving an unadjusted response rate of 27%. Two in five leads in the sample (1,545 learners) was either ineligible, or of unknown eligibility (i.e. had telephone numbers that were missing or unobtainable, or withheld their ID). Accounting for this, the adjusted response rate was 47%.
3.2. Results
Our policy here, as everywhere, is to include as many respondents as possible in the analysis. We have only excluded three respondents, who gave WTP values of around £1m or more. We have weighted the responses to account for missing respondents; this is quite standard in the CV literature.
3.2.1. Main results
The first thing to note is that the cheap talk script did not have any effect on overall values and so we present results for all respondents. Interestingly, Carlsson et al. (2009) and Lusk (2003) found that ‘cheap talk’ has little or no effect when respondents have experience of the good, which relates to our CV study design. It is worth noting, however, that the script did reduce the number of ‘don’t knows’.
20
Value Adult Learning: Comparing Wellbeing Valuation and Contingent Valuation
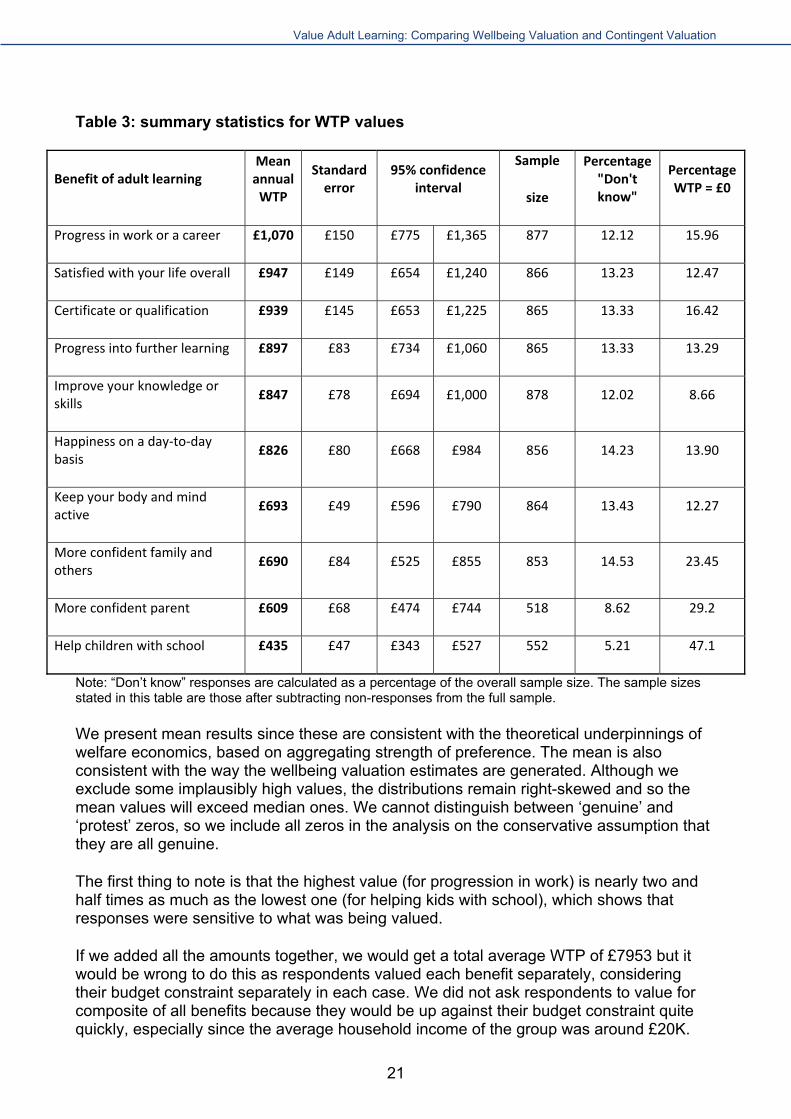
Table 3: summary statistics for WTP values
Benefit of adult learning Mean annual WTP
Standard error
95% confidence interval
Sample
size
Percentage "Don't know"
Percentage WTP = £0
Progress in work or a career £1,070 £150 £775 £1,365 877 12.12 15.96
Satisfied with your life overall £947 £149 £654 £1,240 866 13.23 12.47
Certificate or qualification £939 £145 £653 £1,225 865 13.33 16.42
Progress into further learning £897 £83 £734 £1,060 865 13.33 13.29
Improve your knowledge or skills
£847 £78 £694 £1,000 878 12.02 8.66
Happiness on a day‐to‐day basis
£826 £80 £668 £984 856 14.23 13.90
Keep your body and mind active
£693 £49 £596 £790 864 13.43 12.27
More confident family and others
£690 £84 £525 £855 853 14.53 23.45
More confident parent £609 £68 £474 £744 518 8.62 29.2
Help children with school £435 £47 £343 £527 552 5.21 47.1
Note: “Don’t know” responses are calculated as a percentage of the overall sample size. The sample sizes stated in this table are those after subtracting non-responses from the full sample.
We present mean results since these are consistent with the theoretical underpinnings of welfare economics, based on aggregating strength of preference. The mean is also consistent with the way the wellbeing valuation estimates are generated. Although we exclude some implausibly high values, the distributions remain right-skewed and so the mean values will exceed median ones. We cannot distinguish between ‘genuine’ and ‘protest’ zeros, so we include all zeros in the analysis on the conservative assumption that they are all genuine.
The first thing to note is that the highest value (for progression in work) is nearly two and half times as much as the lowest one (for helping kids with school), which shows that responses were sensitive to what was being valued.
If we added all the amounts together, we would get a total average WTP of £7953 but it would be wrong to do this as respondents valued each benefit separately, considering their budget constraint separately in each case. We did not ask respondents to value for composite of all benefits because they would be up against their budget constraint quite quickly, especially since the average household income of the group was around £20K.
21

Value Adult Learning: Comparing Wellbeing Valuation and Contingent Valuation
3.2.2 Effect of background variables
Some background characteristics were collected as part of the survey and we used some of them to assess determinants of WTP. These variables are listed in Table 4.
Table 4: Background characteristics
Sample mean
Male 33%
Couple 58%
Has children 61%
Annual household income £20,600
Life satisfaction (1‐10) 7.40
Happiness yesterday (1‐10) 7.34
Anxiety yesterday (1‐10) 3.51
Things you do worthwhile (1‐10) 7.80
Overall, nothing except for some of the wellbeing variables shows up as being a significant determinant of WTP at the 5% level. This does mask some differences across the individual questions, as summarised in Table 5 below (we only report results for the wellbeing questions and income). Higher levels of happiness yesterday are associated with a greater WTP for eight of the ten outcomes.
Notice that income is not a significant determinant of WTP. We would generally expect WTP to be related to ability to pay and the failure to find that in these data probably reflects the fact that income does not vary very much in the sample (mean = £20,634 and 95% confidence interval: £17,544 - £23,723). So higher levels of happiness drive WTP responses, and not because happier people tend to be richer.
22

Value Adult Learning: Comparing Wellbeing Valuation and Contingent Valuation
Table 5: Determinants of WTP for adult learning (significant results in bold)
Benefit of Learning
Factor
Career Satisfied Certificate Learning Skills Happy Active Confident Parent School
Satisfaction 0.220 ‐2.926 0.304 0.311 0.308 ‐2.287 8.762 8.569 ‐2.267 ‐5.344
Happiness 17.448 18.167 17.861 11.819 9.761 9.964 ‐1.730 2.274 7.267 7.693
Anxious ‐1.487 ‐1.170 ‐0.569 1.698 0.709 0.283 4.187 2.629 4.755 3.779
Worthwhile ‐14.978 ‐15.650 ‐16.430 ‐7.473 ‐8.696 ‐6.073 ‐1.939 ‐8.368 ‐0.556 ‐0.059
Income 0.000 0.000 0.000 0.000 0.000 0.000 0.000 0.000 ‐0.000 ‐0.000
Constant 83.900 94.280 77.677 37.260 61.638 56.243 4.835 32.620 11.456 12.715
We have one final comment on the results. Before the WTP questions, respondents were asked the importance to them of each of the ten possible benefits of adult learning on a scale from 1 (‘very important’) to 4 (‘not at all important’). Table 6 shows the three most important learning outcomes reported by the learning stream taken by the participant.
Table 6: Most important adult learning benefits
1st 2nd 3rd
Adult and Community learners skills active satisfied
Basic skills learners certificate skills active
Level 2 NVQ learners skills certificate active
After controlling for income, answers to these questions were not strong predictors of stated WTP. For family-related outcomes (confident in being with family and others, confident parent, helping kids at school), however, we did find that higher reports of importance were associated with higher subsequent WTP.
3.3. Discussion of contingent valuation results
In this second part of the project, we look at how much those with past experience of adult learning are willing to pay for stylised benefits in the future. Higher levels of happiness yesterday are associated with a greater WTP for eight of the ten outcomes. This is not
23

Value Adult Learning: Comparing Wellbeing Valuation and Contingent Valuation
altogether surprising since (Capra et al., 2006) have shown how better moods, which they induced in their experiments, lead to higher WTP responses. (Whilst the responses in our study relate to happiness yesterday, this is likely to be influenced by current mood).
We find that a course that enabled someone to progress in their work or career is, on average, valued at £1070. This is the most highly valued benefit. The least important benefit according to people’s stated preferences is "enabled you to help your children with school”, with an average WTP of £435.
In general, the more ‘specific’ and ‘direct’ benefits of adult learning (progressing a career, getting a qualification, getting in further learning and improving skills) are valued more highly than benefits which could be seen as more ‘general’ and ‘indirect (keeping body and mind active, being more confident with others and as a parent).
24

Value Adult Learning: Comparing Wellbeing Valuation and Contingent Valuation
4. Discussion Interestingly, in the contingent valuation results, the impact on life satisfaction is valued as the second most important benefit. A course that made them more satisfied with their life overall is, on average, valued at £947. This compares to the value of a part-time course from the wellbeing valuation method of £754, which is based on income compensations for life satisfaction changes in the British Household Panel Survey (see Part 1 of the project).
So, it is not unreasonable to conclude that an adult learning course that improves life satisfaction has an intangible (non-market) value of somewhere between £754 and £947. These figures are similar to the market price of business-related courses, which lends support to the face validity of the estimates. The estimates from a decision utility (preference) perspective and an experienced utility (wellbeing) perspective have been found to be reasonably close to one another. This is very interesting indeed, and would actually lend support to the idea that preferences are a pretty good approximation of experiences, at least in the context of adult learning.
In general, the literature shows that individual preferences suffer from a range of biases that mean that they are not a very good guide to future experiences. In particular, individuals have been shown to suffer from focussing effect problems, where attention in a preference elicitation task is drawn to things that may not be so salient in the experience of life (Dolan and Kahneman, 2008). If attention is instead drawn to life satisfaction itself (rather than to the case to one of its many determinants, which is typically the case), it might well be the case that we are not so bad at predicting how much a change in life satisfaction is worth to us (in monetary terms).
The broadly comparable estimates we report here are the first of their kind, not least because we use state of the art methods that more accurately account for the impact of income on wellbeing. Future research efforts should be directed towards testing their generalisability in the context of other non-market goods.
25

Value Adult Learning: Comparing Wellbeing Valuation and Contingent Valuation
Annex 1: Wellbeing Evaluation – Additional Regression Results
Table A1: Indirect effects regression results
CoefficientStandard error
P>z
Constant 1.016 1.018 0.32
ln HH income 0.574*** 0.105 0
lag_pt course for work
0.046 0.043 0.29
Unemployed ‐0.246*** 0.053 0
lag_retired ‐0.028 0.177 0.88
Age ‐0.089*** 0.012 0
age2 0.001*** 0 0
no. of children 0.112*** 0.031 0
lag_poor health ‐0.678*** 0.08 0
lag _married 0.025 0.055 0.65
lag _divorced ‐0.238** 0.105 0.02
lag _widowed 0.011 0.244 0.97
lag _separated ‐0.345** 0.144 0.02
lag _never married ‐0.129 0.053 0.02
lag _caring duties ‐0.124 0.097 0.2
lag _live in safe area
0.094 0.047 0.04
Year ‐0.01 0.013 0.41
Wales 0.108 0.052 0.04
Scotland ‐0.037 0.048 0.44
N_Ireland 0.231 0.061 0
observations 5,122
Notes: *** 0.01 significance level, ** 0.05 significance level, * 0.10 significance level. 2SLS regression model. 'lag' = lagged by one year. Income is instrumented by whether the individual has a mortgage and whether the spouse is in work. Reference groups: (i) for employment variables ref = employed; (ii) for marital status ref = non-married co-habiting; (iii) for region ref = England. Sample is restricted to those aged 18 and over and excludes students in full-time education.
26

Value Adult Learning: Comparing Wellbeing Valuation and Contingent Valuation
Annex 2: Contingent Valuation Survey - Technical report
As part of this research Ipsos MORI undertook a quantitative survey of adult learners using Computer Assisted Telephone Interviewing (CATI). This technical report describes the methodological design of the survey.
Sample
This survey used disproportionately stratified random sampling of learners who met the following criteria:
The core target learners aged 18 or older were those who had recently completed (within a year of the interview) one of two broad categories of courses – Informal Adult and Community Learning (now called Community Learning) or Basic Skills Qualifications.
For the purposes of comparison, a group of learners of the same age were also sampled who had completed a full Level 2 National Vocational Qualification (NVQ) over the same time period.
The sample was drawn from a subset of the Skills Funding Agency’s 2010/11 Individualised Learner Record (ILR). The subset was only those learners who had agreed to be contacted for research purposes3. The total eligible population numbered 1,870,980 of which 1,164,683 (62%) had given prior consent to be contacted on the ILR.
Selection weights were derived from the population data (Table 1) for all learners meeting the selection criteria, provided by BIS. The selection weights had two purposes:
a) The sample was drawn disproportionately by type of learner in order to ensure that enough interviews were completed within each stratum;
b) The ILR consent sample does not exactly match the ILR population data, so an adjustment was required to align the consent sample to the population.
Table 1 illustrates the relationship between the drawn sample, the consent data and the population profile. Note that despite the use of disproportionate sampling, the amount of weighting required to adjust for selection was relatively minor with the largest adjustment being made for the Level 2 NVQ stratum.
3 Only learners with a code 3 or 9 flagged for variable L27 were selected from the Individual Learner Record.
27

Value Adult Learning: Comparing Wellbeing Valuation and Contingent Valuation
Table 1: Final sample status
Sample strata Sample selected
Random selection
for interview
Consent sample
Total population
Selection weight
Adult and Community Learners
1,600 1,379 365,379 723,210 1.033
Basic Skills – funded by employer
800 800 320,397 470,504 1.159
Basic Skills – funded by learner
800 757 280,434 403,033 1.049
Level 2 NVQ 800 750 198,473 274,233 0.720
Total 4,000 3,686 1,164,683 1,870,980
Source: Ipsos MORI
Although disproportionate weighting was used to ensure a sufficient sample by type of learner, other demographic factors were drawn representatively. Each stratum was ordered by gender, age, ethnicity, disability and postcode after which 1-in-n records were drawn. The 1-in-n sampling fraction was derived by first removing all of the records from the consent sample without a telephone number and then dividing the total remaining consent sample with the amount of sample to draw.
For example, the total consent sample for Level 2 learners was 198,473 records. Of these, 68,826 records had no telephone number record and so could not be used in a CATI survey. The 800 records for this stratum were drawn from the remaining 129,647 consent sample using a sampling ratio of 1-in-162 records.
Fieldwork
Interviews were undertaken using Computer-Assisted Telephone Interviewing (CATI) conducted by Ipsos MORI Telephone. Prior to starting fieldwork, interviewers were fully briefed by the Ipsos MORI project team. They also received full written instructions about all aspects of the survey. The survey was conducted between 24th February and 9th April 2012. The average interview length was nine and a half minutes. The questionnaire used for the survey is provided in Annex 3.
Table 2 below shows the response rates calculated for each of the four primary sample strata. Given the random design, quotas were not set. Instead all of the sample that was loaded onto the CATI sample was exhausted so a specific outcome could be assigned to each record. In practice, all of the 800 lead sample was required for the “Basic Skills – funded by employer” stratum and nearly all of the sample for the “Basic Skills – funded by learner” and “Level 2 NVQ” strata were used. The nominal target number of interviews for each of these strata was 200 and, as shown, this was exceeded in two of the three, the
28
Value Adult Learning: Comparing Wellbeing Valuation and Contingent Valuation
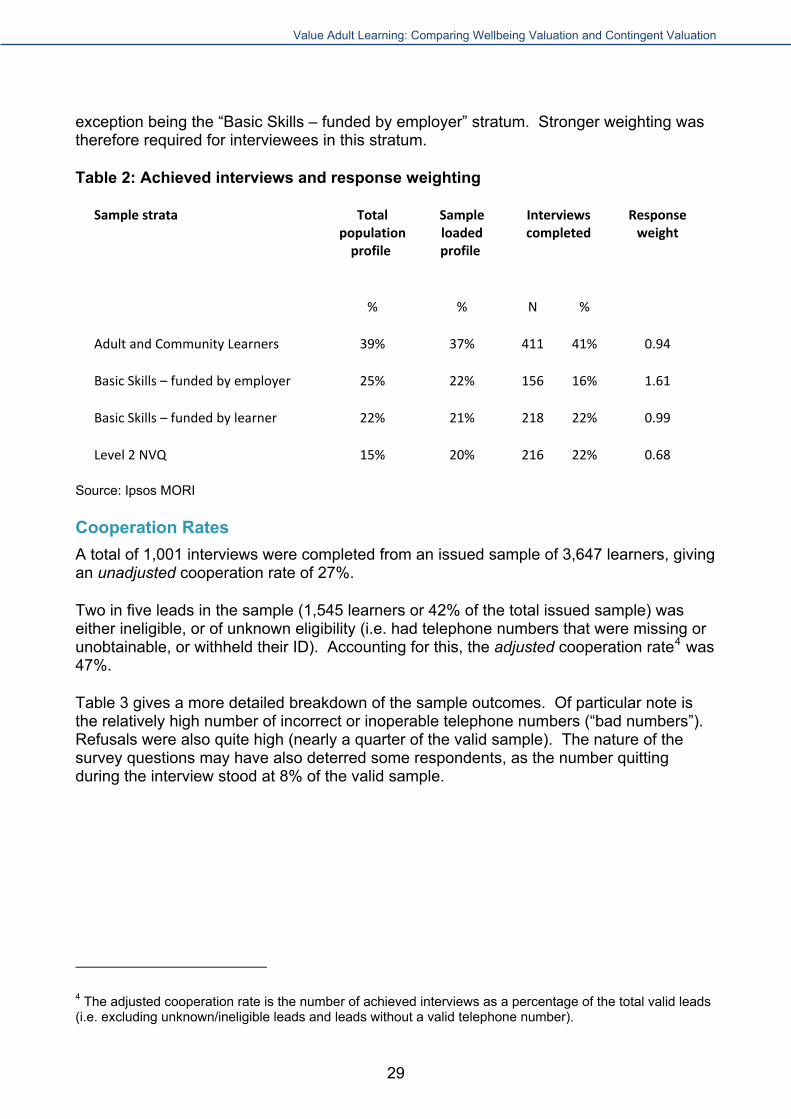
exception being the “Basic Skills – funded by employer” stratum. Stronger weighting was therefore required for interviewees in this stratum.
Table 2: Achieved interviews and response weighting
Sample strata Total population profile
Sample loaded profile
Interviews completed
Response weight
% % N %
Adult and Community Learners 39% 37% 411 41% 0.94
Basic Skills – funded by employer 25% 22% 156 16% 1.61
Basic Skills – funded by learner 22% 21% 218 22% 0.99
Level 2 NVQ 15% 20% 216 22% 0.68
Source: Ipsos MORI
Cooperation Rates
A total of 1,001 interviews were completed from an issued sample of 3,647 learners, giving an unadjusted cooperation rate of 27%.
Two in five leads in the sample (1,545 learners or 42% of the total issued sample) was either ineligible, or of unknown eligibility (i.e. had telephone numbers that were missing or unobtainable, or withheld their ID). Accounting for this, the adjusted cooperation rate4 was 47%.
Table 3 gives a more detailed breakdown of the sample outcomes. Of particular note is the relatively high number of incorrect or inoperable telephone numbers (“bad numbers”). Refusals were also quite high (nearly a quarter of the valid sample). The nature of the survey questions may have also deterred some respondents, as the number quitting during the interview stood at 8% of the valid sample.
4 The adjusted cooperation rate is the number of achieved interviews as a percentage of the total valid leads (i.e. excluding unknown/ineligible leads and leads without a valid telephone number).
29

Value Adult Learning: Comparing Wellbeing Valuation and Contingent Valuation
Table 3: Survey co-operation rates
Final sample status Total sample used (n)
Total sample used (%)
Valid sample (%)
Valid sample
Achieved interviews 1,001 27% 47%
Respondents quit during interview 169 5% 8%
Refusal 493 13% 23%
Leads tried max times / no reply 99 3% 5%
Not available during fieldwork period 338 9% 16%
Language barrier 41 1% 2%
Total valid 2,141 58% 100%
Invalid sample
Bad number 581 16%
Not known / no longer at address 612 17%
Ineligible 352 10%
Total invalid 1,545 42%
Total sample used 3,686
Source: Ipsos MORI
30

Value Adult Learning: Comparing Wellbeing Valuation and Contingent Valuation
Annex 3: Contingent Valuation Survey - Questionnaire
INTRO1 Good MORNING/AFTERNOON/EVENING. Could I please speak to (NAME FROM SAMPLE)?
USE STANDARD OUTCOME CODES. SEE INSTRUCTIONS FOR THOSE WHO ARE UNABLE TO TAKE PART BECAUSE OF LANGUAGE/LEARNING DIFFICULTIES OR DISABILITY. Yes 1 GO TO INTRO2 No - call back later 2 MAKE APPOINTMENT No - not available in fieldwork period 3 THANK & CLOSE No – refused 4 THANK & CLOSE Other - cannot continue 5 THANK & CLOSE
INTRO2 Good morning/afternoon/evening my name is (......) and I am calling from Ipsos MORI, the independent research agency. We are doing a survey for the Department for Business, Innovation and Skills about learners’ views on some aspects of their course. You should have received a letter in the post explaining what the survey is about. Would now be a good time to ask you a few questions – the survey should take around 12 minutes? INTERVIEWER ADD IF NECESSARY:
1. Department for Business, Innovation and Skills is the Government department in charge of learning for adults, to meet the needs of both individuals and employers.
2. We are not trying to sell you anything. We are simply conducting a survey about your course. All your answers are confidential; your responses will be reported back but not with names attached.
ASK IF RESPONDENT IS UNABLE TO TAKE PART DUE TO LANGUAGE DIFFICULTIES
QA. Is there someone who would be able to interpret for you?
1. Yes – arrange to call back to conduct interview when proxy is around 2. Yes – proceed with interview with proxy 3. No – THANK & CLOSE.
ASK IF RESPONDENT IS UNABLE TO TAKE PART DUE TO LEARNING DIFFICULTIES, HEARING OR SPEECH IMPAIRMENT, OR OTHER DISABILITY, READ OUT:
QB. Is there someone who would be able to help you to take part by telephone? IF NO: find out if they would be happy to take part using Type Talk?
1. Happy to proceed as normal without extra help 2. Yes – arrange to call back when someone is available to help 3. Yes – proceed with interview with proxy 4. Yes – happy to conduct interview using Type Talk 5. No - CLOSE.
31

Value Adult Learning: Comparing Wellbeing Valuation and Contingent Valuation
Course and employer details ASK ALL CHECK ELIGIBILITY QCHECK1. We are contacting you because we understand that you finished a course in <TEXT SUB: INSERT NAME OF COURSE FROM SAMPLE> within the last year. Can I check that this is correct?
1. Yes, PROCEED TO READ OUT ABOVE Q1 2. Yes, finished a course, but do not recognise name GO TO QCHECK2 3. Yes, recognise course, but was over a year ago GO TO QCHECK3 4. No, have not completed any learning in the last year CLOSE
ASK IF CODE 2 AT QCHECK1 QCHECK 2. Was the course you did with <TEXT SUB: INSERT LEARNING PROVIDER FROM SAMPLE>?
1. Yes, – PROCEED TO READ OUT ABOVE Q1 2. No, CLOSE
ASK IF CODE 3 AT QCHECK1 QCHECK 3. Did this training/course finish in 2011 or towards the end of 2010?
1. Yes, PROCEED TO READ OUT ABOVE Q1 2. No, CLOSE
Create dummy variable with name used by the learner for subsequent text substitution: USE COURSE NAME AT QCHECK1 IF CODE 1 AT QCHECK1 OR AT QCHECK3 IF CODE 1 AT QCHECK2 USE “COURSE WITH <LEARNING PROVIDER FROM SAMPLE>” READ OUT TO ALL Some of the questions we will ask later in the survey are aimed at adults who look after children. We would therefore like to identify parents and guardians at this point in the survey.
ASK ALL Q1. May I therefore ask, do you have any children?
INTERVIEWER NOTE: (include biological, adopted, step children, so parents and guardians are all eligible)
SINGLE CODE ONLY. DO NOT READ OUT.
1. Yes 2. No 3. Refused
ASK IF CODE 1 AT Q1 Q2. And are any of these children under the age of 16?
SINGLE CODE ONLY. DO NOT READ OUT.
1. Yes 2. No 3. Refused
32

Value Adult Learning: Comparing Wellbeing Valuation and Contingent Valuation
ASK ALL
Q3. On a scale where 0 is “not at all” and 10 is “completely”, please answer the following questions:
READ OUT. RANDOMISE A TO D. SINGLE CODE 0 TO 10.
A. Overall, how satisfied are you with your life nowadays? B. Overall, how happy did you feel yesterday? C. Overall, how anxious did you feel yesterday? D. Overall, how worthwhile are the things that you do in your life?
READ OUT TO ALL
Those who have participated in adult learning have told us about some of the benefits that came about from learning on a course. I am going to read out some of these benefits and, thinking about your experience on your [INSERT COURSE] course, I would like to state how important each is to you.
Q4. How important, if at all, were the following aspects of your [INSERT COURSE] course to you?
READ OUT. RANDOMISE A TO J. CODE TO IMPORTANCE SCALE. SINGLE CODE ONLY.
1. Very important 2. Fairly important 3. Not very important 4. Not at all important 5. Don’t know (DO NOT READ OUT)
1 2 3 4 Don’t know
A It led to a certificate or qualification
B It enabled you to progress in work or a career
C It enabled you to improve your knowledge or skills
D It enabled you to progress into further learning
E It helped you to feel more confident in being with family and other people
F It helped to keep your body and mind active
G It improved your happiness on a day-to-day basis
H It made you more satisfied with your life overall
I ASK IF CODE 1 AT Q1. It helped you to become a more confident parent
J ASK IF CODE 1 AT Q2. It helped you to help your
33

Value Adult Learning: Comparing Wellbeing Valuation and Contingent Valuation
children with school
READ OUT TO HALF OF RESPONDENTS ONLY [ALTERNATE BETWEEN THIS STATEMENT AND NEXT]. RANDOMISE IN SCRIPT
Before I come to the next questions I would just like to say that experiences from similar studies show that people sometimes say they would do one thing but in reality they do something else. For example, when asking about how much a course is worth, some say a low amount of money or even nothing, because they believe everyone should get this learning free of charge. Or they may state a higher amount because they want to show the immense value they would get from the course. We do not want you to think in these ways when answering our questions but rather to give as honest a response about how much you would be willing to pay for the learning.
Bearing this in mind, I’d now like you to think about doing more learning.
I am going to ask how much you would pay per month for one year for learning that would give you each of the benefits we just talked about.
READ OUT TO OTHER HALF OF RESPONDENTS. RANDOMISE IN SCRIPT.
I am going to ask how much you would pay per month for one year for learning that gave you each of the eight benefits we just talked about.
ASK ALL
RANDOMISE STATEMENTS A TO J
PROBE RESPONDENT FOR ANSWER. ONLY USE DON’T KNOW TO MOVE TO THE NEXT QUESTION.
Q5 If you did some learning that...
READ OUT EACH IN TURN.
A. Led to a certificate or qualification
... what would be the maximum (amount per month for one year ) you would be willing to pay for the course?
B. Enabled you to progress in work or a career
... what would be the maximum (amount per month for one year ) you would be willing to pay for the course?
C. Enabled you to improve your knowledge or skills
... what would be the maximum (amount per month for one year ) you would be willing to pay for the course?
D . Enabled you to progress into further learning
... what would be the maximum (amount per month for one year ) you would be willing to pay for the course?
34

Value Adult Learning: Comparing Wellbeing Valuation and Contingent Valuation
E. Helped you to feel more confident in being with family and other people
... what would be the maximum (amount per month for one year ) you would be willing to pay for the course?
F. Helped to keep your body and mind active
... what would be the maximum (amount per month for one year ) you would be willing to pay for the course?
G. Improved your happiness on a day-to-day basis
... what would be the maximum (amount per month for one year ) you would be willing to pay for the course?
H. Made you more satisfied with your life overall
... what would be the maximum (amount per month for one year ) you would be willing to pay for the course?
ASK IF CODE 1 AT Q1
I. Helped you become a more confident parent
... what would be the maximum (amount per month for one year ) you would be willing to pay for the course?
ASK IF CODE 1 AT Q2
J. Enabled you to help your children with school
... what would be the maximum (amount per month for one year ) you would be willing to pay for the course?
[Open ended question: Amount per month for one year - no coding, use the direct answer. USE ZERO IF RESPONDENT] WOULD NOT PAY.
ASK ALL
Q6 Can I just check, did you do any paid work last week - that is in the seven days ending last Sunday - either as an employee or self-employed?
SINGLE CODE ONLY. DO NOT READ OUT.
1. Yes..............................GO TO Q7 2. No...............................ASK Q6A 3. Don’t know.................GO TO Q7
ASK IF CODE 2 AT Q6
Q6A. Even though you weren't working did you have a job that you were away from last week?
SINGLE CODE ONLY. DO NOT READ OUT.
35

Value Adult Learning: Comparing Wellbeing Valuation and Contingent Valuation
1. Yes........................................................GO TO Q7 2. No..........................................................GO TO Q7 3. Don’t know.............................................GO TO Q7
ASK ALL
Q7. Are you currently claiming any state benefits or tax credits?
SINGLE CODE ONLY. DO NOT READ OUT.
1. Yes 2. No 3. Don’t know 4. Refused
ASK IF CODE 1 AT Q7 Q8. Which of the following types of benefits are you currently claiming?
READ OUT 1 TO 8. MULTICODE OK. SELECT ALL THAT APPLY.
1. Unemployment related benefits, or National Insurance Credits 2. Income support (not as an unemployed person) 3. Sickness or disability benefits 4. State Pensions 5. Family related benefits (excluding Child benefit and tax credits) 6. Child benefit 7. Tax Credits 8. Housing or Council Tax benefit 9. Other (specify) 10. Don’t know 11. Refused
ASK ALL Q9a. And what is your overall HOUSEHOLD income from all sources? This includes earnings from employment or self-employment, income from benefits and pensions and income from sources such as interest from savings.
INTERVIEWER: RESPONDENT CAN GIVE ANSWER FOR ANY PERIOD OF TIME (E.G. YEARLY, MONTHLY, WEEKLY ETC) AS THE PERIOD WILL BE CODED AT THE NEXT QUESTION). IF THE RESPONDENT DOES NOT KNOW ASK THEM TO GIVE THEIR BEST ESTIMATE
ASK ONLY IF DON’T KNOW AT Q9A Q9b Is it…? PROBE FOR BEST ESTIMATE IF CANNOT GIVE EXACT AMOUNT
1. Under £10,000 per year 2. £10,000 - £14,999 per year 3. £15,000 - £19,999 per year 4. £20,000 - £24,999 per year 5. £25,000 or more per year 6. Don’t know 7. Refused
36

Value Adult Learning: Comparing Wellbeing Valuation and Contingent Valuation
ASK ALL PROVIDING INCOME AT Q9a Q10. What period did this cover?
PROMPT TO PRECODES Soft check if above
1. Per one hour £ 50
2. One week £ 1,700
3. Two weeks £ 3,400
4. Three weeks £ 5,100
5. Four weeks £ 6,800
6. Calendar month £ 7,500
7. Two calendar months £ 15,000
8. Eight times a year £ 11,250
9. Nine times a year £ 10,000
10. Ten times a year £ 9,000
11. Three months / 13 weeks £ 22,500
12. Six months / 26 weeks £ 45,000
13. One year / 12 months / 52m weeks £ 90,000
14. Less than one week
15. Other (specify)
16. Don’t Know
17. Refused
ASK ALL Q11. Which of the following best matches your marital status?
READ OUT 1 TO 5. SINGLE CODE ONLY.
1. Married or living together as married 2. Single 3. Separated 4. Divorced 5. Widowed 6. Refused
37

Value Adult Learning: Comparing Wellbeing Valuation and Contingent Valuation
THANK AND CLOSE
References Arrow, K., Solow, R., Portney, P., Leamer, E., Radner, R., Schuman, H., 1993. Report of the NOAA Panel on Contingent Valuation. NOAA Publication.
Benham, L., 1974. Benefits of Women's Education within Marriage. Journal of Political Economy 82, 57-71.
Capra, C., Meer, S., Lanier, K., 2006. The Effects of Induced Mood on Bidding in Random Nth-price Auctions. Emory University.
Carlsson, F., Martinsson, P., Akay, A., 2009. The Effect of Power Outages and Cheap Talk on Willingness to Pay to Reduce Outages. IZA Discussion Papers, Institute for the Study of Labor (IZA). 4307.
Chevalier, A., Lydon, R., 2002. Estimates of the Effect of Wages on Job Satisfaction. CEP Discussion Paper 531.
Cummings, R.G., Taylor, L.O., 1999. Unbiased Value Estimates for Environmental Goods: A Cheap Talk Design for the Contingent Valuation Method. The American Economic Review 89, 649-665.
Diener, E., 1984. Subjective well-being. Psychological Bulletin 95, 542-575.
Dolan, P., Edlin, R., Tsuchiya, A., Wailoo, A., It ain’t what you do, it’s the way that you do it: Characteristics of procedural justice and their importance in social decision making Journal of
Economic Behavior & Organization 64, 157-170.
Dolan, P., Fujiwara, D., Metcalfe, R., 2011. A Step Towards Valuing Utility the Marginal and Cardinal Way. Centre of Economic Performance working paper.
Dolan, P., Kahneman, D., 2008. Interpretations Of Utility And Their Implications For The Valuation Of Health. Economic Journal 118, 215-234.
Dolan, P., Metcalfe, R., 2008. Comparing willingness to pay and subjective wellbeing in the context of non-market goods. Centre for Economic Performance (London School of Economics) Discussion paper 890.
Dolan, P., White, M.P., 2007. How Can Measures of Subjective Well-Being Be Used to Inform Public Policy? Perspectives on Psychological Science 2, 71-85.
Fisher, I., 1918. Is Utility the Most Suitable Term for the Concept it is Used Denoted. American Economic Review, 335-337
38

Value Adult Learning: Comparing Wellbeing Valuation and Contingent Valuation
Frey, B.S., Luechinger, S., Stutzar, A., 2009. The life satisfaction approach to environmental valuation. IZA Discussion Paper 4478.
Frey, B.S., Luechinger, S., Stutzer, A., 2004. Valuing Public Goods: The Life Satisfaction Approach. Institute for Empirical Research in Economics University of Zurich Working Paper Series 184.
Fujiwara, D., Campbell, R., 2011. Valuation Techniques for Social Cost-Benefit Analysis: Stated Preference, Revealed Preference and Subjective Well-Being Approaches, in: Pensions, H.T.a.D.f.W.a. (Ed.), London.
Groot, W., van den Brink, H.M., 2006. The compensating income variation of cardiovascular disease. Health Economics Letters 15, 1143-1148.
Gujarati, D., 2003. Basic Econometrics. 4th Edition. McGraw Hill, London.
Kahneman, D., Krueger, A.B., 2006. Developments in the Measurement of Subjective Well-Being. The Journal of
Economic Perspectives 20, 3-24.
Kahneman, D., Wakker, P.P., Sarin, R., 1997. Back to Bentham? Explorations of Experienced Utility. The Quarterly Journal of Economics 112, 375-405.
Krueger, A.B., Schkade, D.A., 2008. The reliability of subjective well-being measures. Journal of Public Economics 92, 1833-1845.
List, J.A., Gallet, C.A., 2001. What Experimental Protocol Influence Disparities Between Actual and Hypothetical Stated Values? Environmental and Resource Economics 20, 241-254.
Loomis, J., 2011. What's to know about hypothetica bias in stated preference valaution studies? Journal of Economic Surveys 25, 363-370.
Lusk, J., 2003. Effects Of Cheap Talk On Consumer Willingness-To-Pay For Golden Rice. American Journal of Agricultural Economics 85, 840-856.
Luttmer, E.F.P., 2005. Neighbors as Negatives: Relative Earnings and Well-Being. Quarterly Journal of Economics 120, 963-1002.
Matrix, 2009. Lifelong Learning and Well-being: An Analysis of the Relationship Between Adult Learning and Subjective Well-being. IFLL Public Value Paper 3.
Murphy, J., Allen, P., Stevens, T., Weatherhead, D., 2005. A Meta-analysis of Hypothetical Bias in Stated Preference Valuation. Environmental and Resource Economics 30, 313-325.
Pischke, J., 2010. Money and Happiness: Evidence from the Industry Wage Structure. CEP Discussion Papers CEPDP1051.
39

Value Adult Learning: Comparing Wellbeing Valuation and Contingent Valuation
40
Read, D., 2007. Utility Theory from Jeremy Bentham to Daniel Kahneman. Thinking and Reasoning 13, 45-61.
Sandvik, E., Diener, E., Seidlitz, L., 1993. Subjective Well-Being: The Convergence and Stability of Self-Report and Non-Self-Report Measures. Journal of Personality 61, 317-342.
(HM) Treasury, 2003. Green Book.
Urry, H.L., Nitschke, J.B., Dolski, I., Jackson, D.C., Dalton, K.M., Mueller, C.J., Rosenkranz, M.A., Ryff, C.D., Burton, H.S., Davidson, R.J., 2004. Making a Life Worth Living: Neural Correlates of Well-Being. Psychological Science 15, 367-372.

© Crown copyright 2012
You may re-use this information (not including logos) free of charge in any format or medium, under the terms of the Open Government Licence. Visit www.nationalarchives.gov.uk/doc/open-government-licence, write to the Information Policy Team, The National Archives, Kew, London TW9 4DU, or email: [email protected].
This publication is also available on our website at www.bis.gov.uk
Any enquiries regarding this publication should be sent to:
Department for Business, Innovation and Skills 1 Victoria Street London SW1H 0ET Tel: 020 7215 5000 If you require this publication in an alternative format, email [email protected], or call 020 7215 5000. URN 12/1127