values chains, organic certification, and organic markets douglas h. constance sam houston state...
Post on 20-Dec-2015
214 views
TRANSCRIPT

Values Chains, Organic Certification, and Organic Markets
Douglas H. ConstanceSam Houston State University
20th Anniversary of SAREKansas City, Missouri
March 25th. 2008

Four Parts
• Values Chains• Organics: The Origins• Organics: The Change• Organics: What to do?
– Some evidence from Texas

Commodity/Value Chains • “Commodity Chains in the World Economy Prior
to 1800” , Hopkins and Wallerstein (1986)• “Commodity System Analysis: An Approach to
the Sociology of Agriculture”, Friedland (1984). • “Commodity Chains and Global Capitalism”,
Gereffi and Korzeniewicz (1994)• “The Governance of Global Value Chains”, Gereffi
et al. (2004)

Commodity Chains to Value Chains:
• Commodity Chains focus on tracing the network of labor and production processes whose end result is a finished commodity.
• Value Chains focus on the location along the chain where value is extracted.
• Where is the value extracted? • Who makes the money? • Are chains “seller” or “buyer” driven?

Organics: The Origins• Lady Balfour and Sir Albert Howard in UK• Rodale in the US• Hippies in California – 1960s/70s• Decentralized: scale specific • Philosophical: agro-ecological• Holistic: crops/livestock cycle• “Deep Organics”• Characteristics of the value chain??? • Who drives the chain?

Organics: The Change - California• California Certified Organic Farmers: 1973• California Organic Foods Act: 1990• The “list” - acceptable materials • Third party certifiers • Model for other states/national programs• Entry by California agribusiness• Characteristics of the value chain??• Who drives the chain?

Organics: The Change - US• Organic Standards Protection Act: 1990• National Organic Standards Board• Proposed Rule: The BIG 3 – 1997• Allowable inputs versus agro-ecology• 2001 USDA National Organic Program• No government transition subsidies • Final Rule: 2002
– purposefully framed “certified organic” as a market label based on consumer preference with no claims to health benefits or environmental superiority

Organics: The Change • Certified organic land doubles between 1990
and 2002, then again by 2005. • Rate of certified organic land up rapidly, but
rate of new certified operations slows. • Markets grow at average of 20% through the
1990s and early 2000s. • Entry by national/global agribusiness. • Characteristic of the value chain?• Who drives the chain?

Table 1: U.S. Certified Organic Crop Acreage, Livestock Numbers, and Farm Operations:1992 – 2005 (in thousands)
Item 1992 1997 2002 2005 92-97% change
97-02% change
02-05% change
Farmland
Total 935.5 1,346.6 1,925.5 4,054.4 45 43 111
Pasture/rangeland 532.1 496.4 625.9 2,331.2 (7) 26 272
Cropland 403.4 850.1 1,299.6 1,723.3 111 53 33
Animals
Livestock 11.6 18.5 108.4 196.6 59 485 81
Poultry 61.4 798.3 6,270.2 13,757.3 1,201 685 119
Operations* 3,587 5,021 7,323 8,493 40 46 16
*number does not include subcontracted organic farm operations. Source: USDA/ ERS (2007), Table 2: based on information from USDA-accredited State and private organic certifiers.

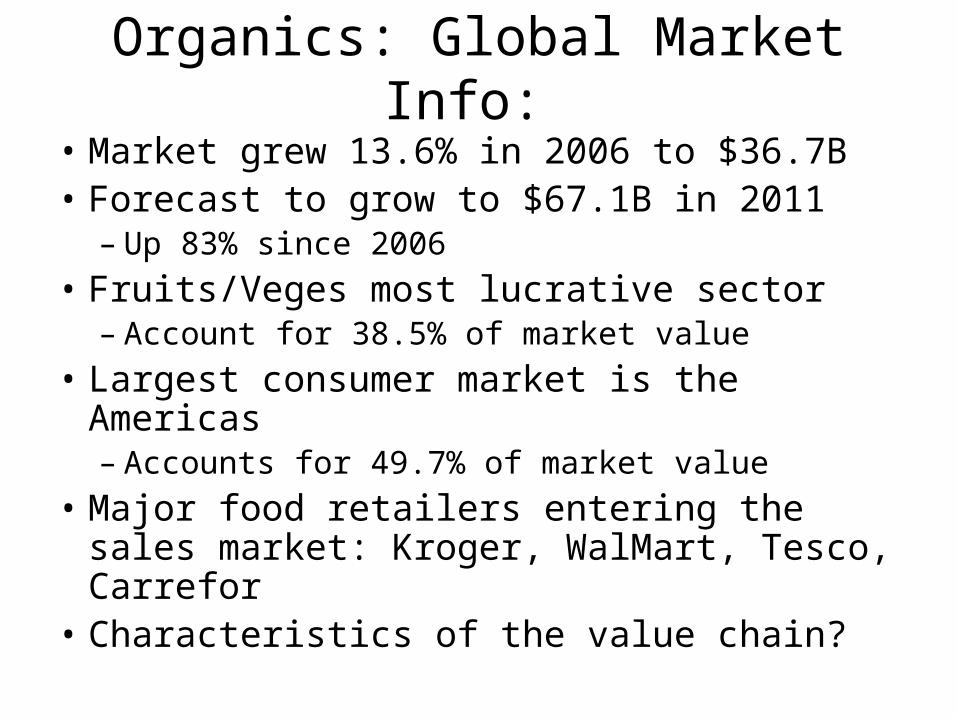
Organics: Global Market Info: • Market grew 13.6% in 2006 to $36.7B• Forecast to grow to $67.1B in 2011
– Up 83% since 2006• Fruits/Veges most lucrative sector
– Account for 38.5% of market value• Largest consumer market is the Americas
– Accounts for 49.7% of market value• Major food retailers entering the sales
market: Kroger, WalMart, Tesco, Carrefor• Characteristics of the value chain?

Organics: Global Info.
• In North, demand often > than supply.• North American companies “scouring the
globe” for organic ingredients. • Beans/seeds/nuts – China/Turkey/Brazil• Herbs/spices – India/Paraguay/ Pakistan. • Fruits/vegetables - Africa/Asia• Meats - Latin America/Australasia

Organics: Global Info.
• Demand mostly in the North• Supply growing fastest in South – exports• Triple digit growth of organic land in South
from 2000-06 versus double digit in North• Organic acres up > 700% in China 02-06. • Most organic acres in Australia/Argentina –
grazing land (de facto organic). • Government supported/subsidized • Who is “driving” the value chain?

Some Agri-Sociology• With organic standards/certification you get
entry to capture the organic price premium. – Early adopters capture the premium
• Conventionalization – Appropriationism: agricultural processes move off
the farm- upstream/ downstream– Substitutionism: post-production activities – value
added, processing, retailing • Bifurcation
– Certified: indirect markets (Organic Lite?)– Non- Certified: direct markets (Deep Organic?)
Some More Agri-Sociology
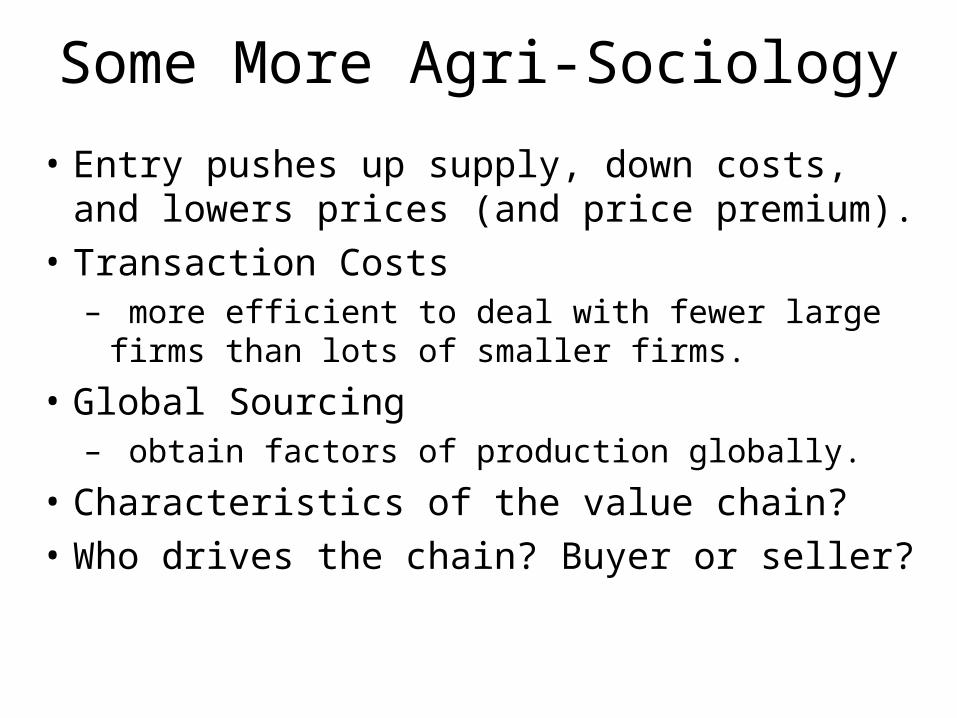
• Entry pushes up supply, down costs, and lowers prices (and price premium).
• Transaction Costs– more efficient to deal with fewer large firms than
lots of smaller firms.
• Global Sourcing– obtain factors of production globally.
• Characteristics of the value chain?• Who drives the chain? Buyer or seller?

Organics: What to do?
• What kind of operation competes/survives in this environment?
• Indirect markets? • Direct markets? • Which are more /less sustainable? • Which are more/less risky? • What about certification?
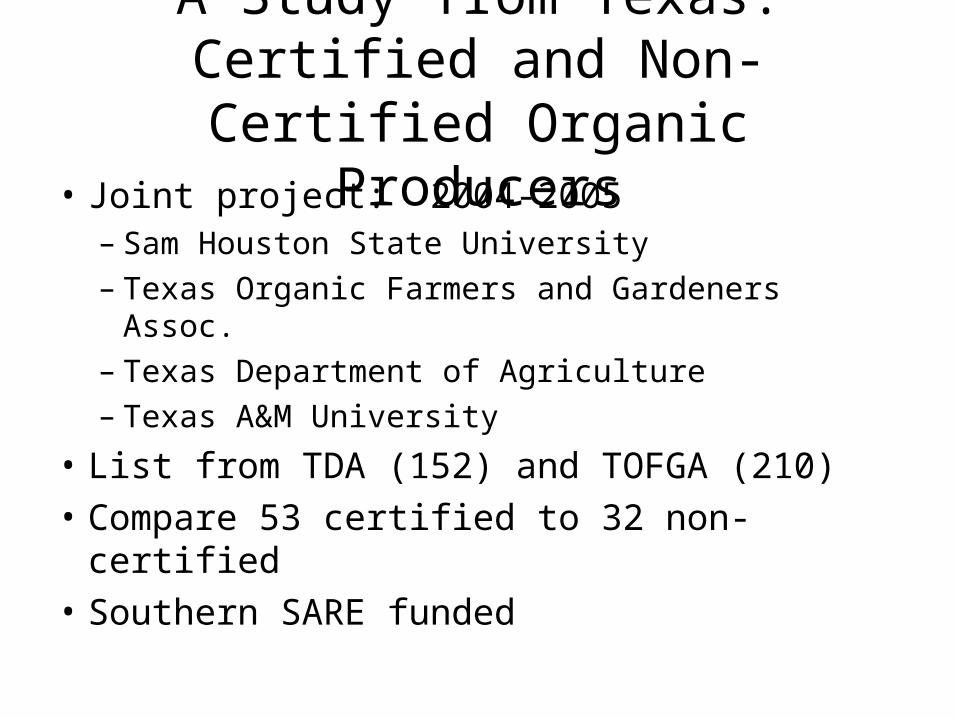
A Study from Texas: Certified and Non-Certified Organic Producers
• Joint project: 2004-2005– Sam Houston State University– Texas Organic Farmers and Gardeners Assoc.– Texas Department of Agriculture– Texas A&M University
• List from TDA (152) and TOFGA (210) • Compare 53 certified to 32 non-certified• Southern SARE funded

General Hypotheses• Certified and Non-Certified producers will be
different– Demographically– Structurally– Attitudinally
• Certified will be more like “conventional producers” – “organic lite”
• Non-Certified will be more like “alternative producers” – “deep organic”
Demographics
• Age• Education*• Race/Ethnicity• Gender

Age
0%
5%
10%
15%
20%
25%
30%
35%
40%
30 and less 31-40 41-50 51 to 60 61 +
CERT
NON-CERT

Gender
0
10
20
30
40
50
60
70
80
Male Female
CERT
NON-CERT
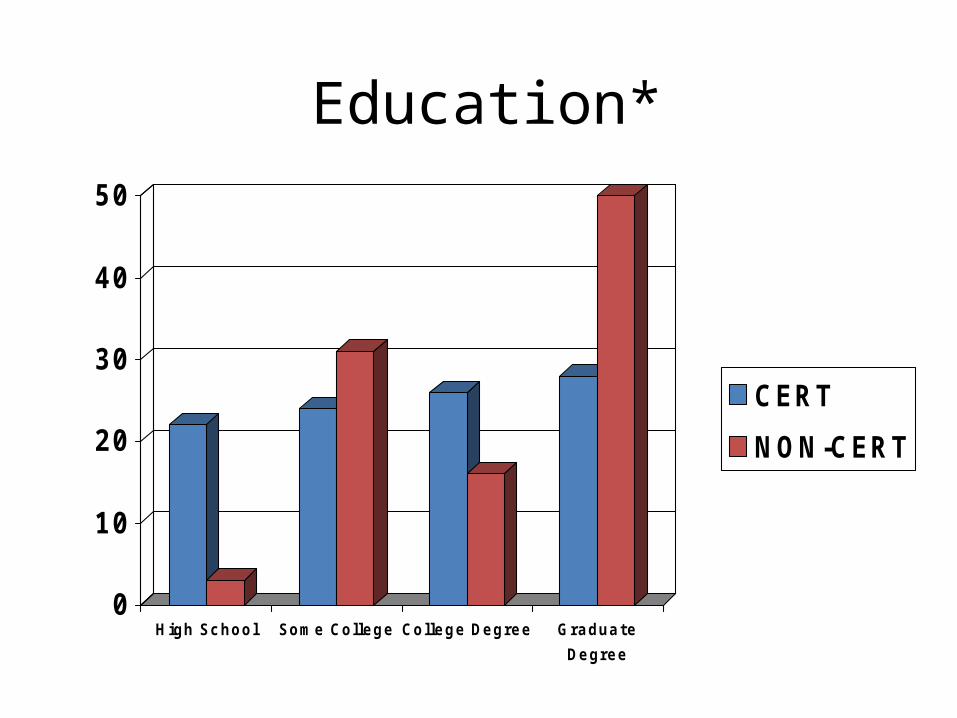
Education*
0
10
20
30
40
50
High Sc hool Some College College Degree Graduate
Degree
CERT
NON-CERT

Summary
• The only significant variable was education.

Structural
• Direct or indirect markets. • Size; sales; household dependence• Years farming; years farming organically• Tenure: own/lease• Farm operation: full/part time• Hired labor: full/part time• Organic origins: begin/transition? • Plans for the future? • Problems with distance to organic markets?

Table 2. Markets of Organic Products :
*p<.1; **: p<.05; ***: p<.01
Types of Markets Certified Non-certified
Direct markets *
Yes 56.0 76.5
No 44.0 23.5
Indirect Markets **
Yes 64.0 41.2
No 36.0 58.8
Natural Food Store ***
Yes 36.0 8.8 No 64.0 91.2

Size of Operation in Acres – 2003
0
5
10
15
20
25
30
35
40
45
50
20 or less 21 to 100 101 to
500
500 +
CERT
NON-CERT

Gross Organic Farming Income in Thousands – 2003*~
0
10
20
30
40
50
60
$4,999
and less
$5,000 to
$29999
$30,000
to
$99,999
$100,000
and
above
CERT
NON-CERT

Percentage of Household Income from Organic Sales – 2003*~
0
10
20
30
40
50
60
70
80
1-25% 26-50% 51-75% 76-100%
CERT
NON-CERT

Years Farming *~
0
10
20
30
40
50
1-5
years
6-10
years
11-20
years
21 +
years
CERT
NON-CERT

Years Farming Organically *~
0
10
20
30
40
50
60
1-5
years
6-10
years
11-20
years
21 +
years

Own or Lease Organic Farming Land
0
10
20
30
40
50
60
70
80
Own Lease Both
CERT
NON-CERT

Full or Part-Time Farming*
0
10
20
30
40
50
60
70
80
Full Part
CERT
NON-CERT

Non-Family Member Working Full Time
0
10
20
30
40
50
60
70
80
Yes No
CERT
NON-CERT

Non-Family Member Working Part Time
0
10
20
30
40
50
60
70
Yes No
CERT
NON-CERT
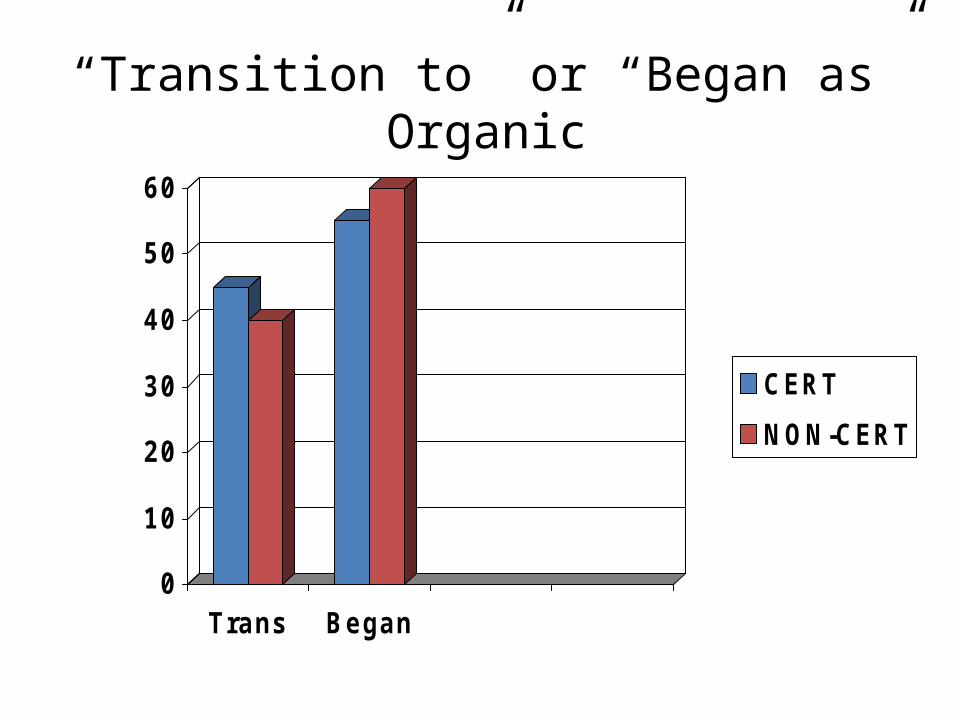
“Transition to” or “Began as” Organic
0
10
20
30
40
50
60
Trans Began
CERT
NON-CERT

Distance to Available Organic Markets~
0
5
10
15
20
25
30
35
not a
problem
moderate
problem
severe
problem
CERT
NON-CERT

The Future: Expand, Same, Decrease, or Close
0
10
20
30
40
50
60
70
80
90
Exp Same Dec Close
CERT
NON-CERT

Summary: Structural Issues • Cert > indirect; NonCert>direct markets*• Gross organic farming income – Cert>NonCert*• Percentage of household income –
Cert>NonCert*• Years farming – Cert>NonCert*• Years farming organically – Cert>NonCert*• Certs more likely to be full time. *• Distance to markets problem- NonCert>Cert*• Hired labor – no sig. diff. • Organic origins. – no sig. diff. • Future plans – no sig. diff.
Attitudinal: Reasons for Farming Organically
• Organic Price Premiums*• Growing Consumer Demand*• To Reduce Inputs Costs• Maintain Farm Economic Sustainability • Quality of Organic Products Grown• Chemical Avoidance for Environment• Chemical Avoidance for Personal Health

Attitudinal: Reasons for Farming Organically (cont)
• Land Stewardship; Ecological Sustainability• Response to Chemical Regulation*• Philosophical; Spiritual; Ethical• Community Values; Tradition; Quality of Life• Challenging; Interesting; Intellectually Appealing • Animal Welfare* • Economic Support on Fewer Acres*

Organic Price Premiums *~
0
10
20
30
40
50
Not
important
Important Very
Important
CERT
NON-CERT

Growing Consumer Demand *
0
10
20
30
40
50
Not
Important
Important Very
Important
CERT
NON-CERT

Provides Economic Support on Fewer Acres*~
0
5
10
15
20
25
30
35
Not
important
Important Very
important
CERT
NON-CERT

To Reduce Input Costs
0
5
10
15
20
25
30
Not
Important
Important Very
Important
CERT
NON-CERT
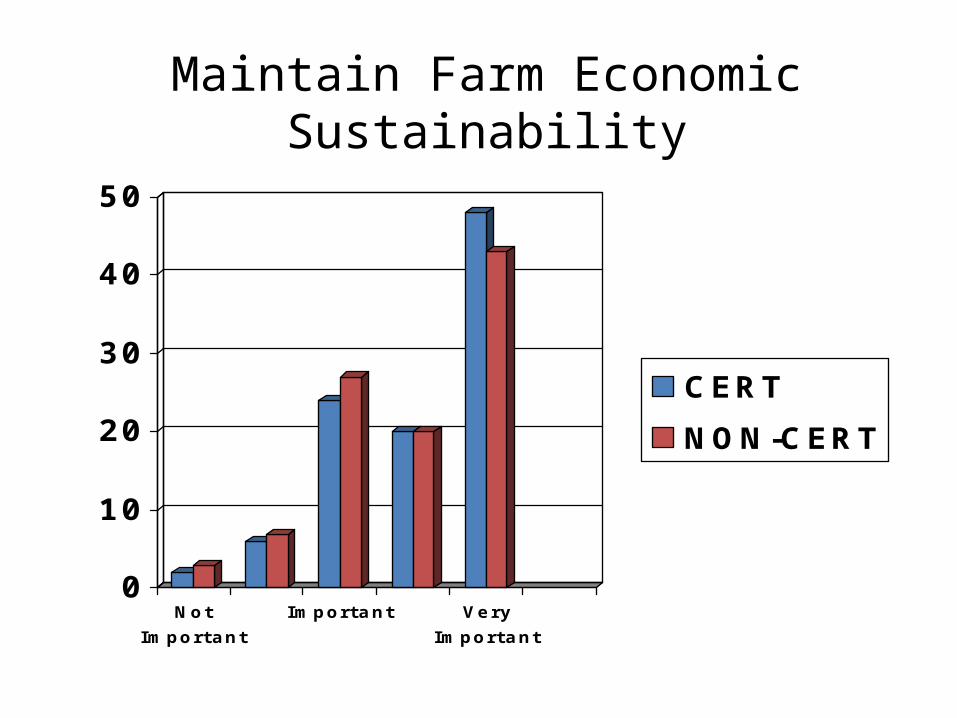
Maintain Farm Economic Sustainability
0
10
20
30
40
50
Not
Important
Important Very
Important
CERT
NON-CERT

Quality of Organically Grown Products
0
10
20
30
40
50
60
70
Not
Important
Important Very
Important
CERT
NON-CERT

Land Stewardship; Ecological Sustainability
0
10
20
30
40
50
60
70
80
Not
Important
Important Very
Important
CERT
NON-CERT

Chemical Avoidance for Environmental Health
0
10
20
30
40
50
60
70
Not
Important
Important Very
Important
CERT
NON-CERT
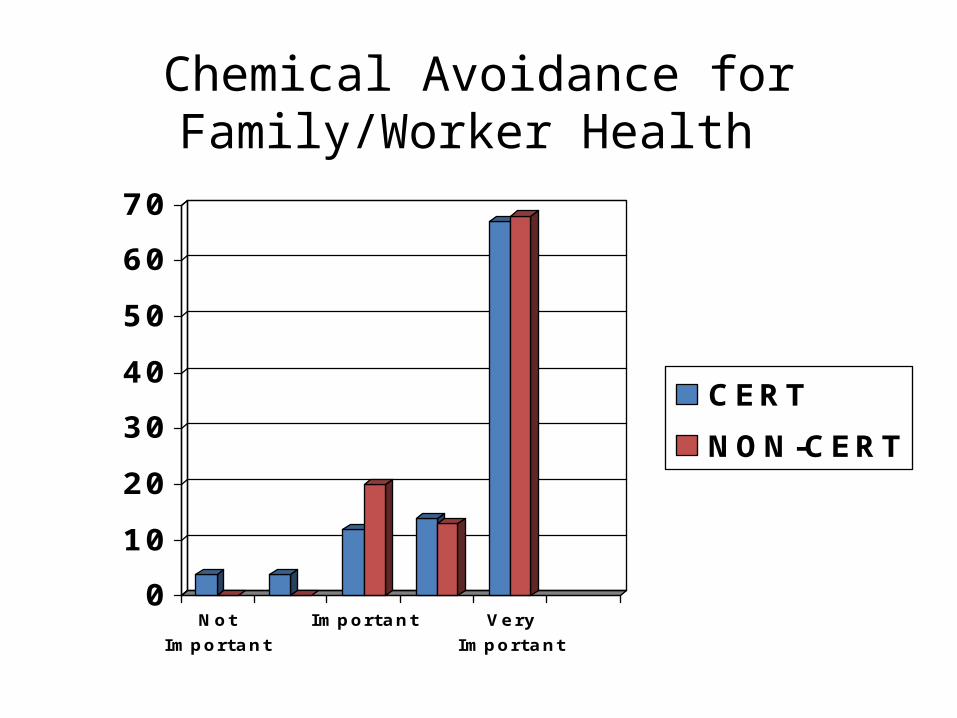
Chemical Avoidance for Family/Worker Health
0
10
20
30
40
50
60
70
Not
Important
Important Very
Important
CERT
NON-CERT

Philosophical; Spiritual; Ethical Reasons
0
10
20
30
40
50
60
70
Not
Important
Important Very
Important
CERT
NON-CERT

Community Values; Tradition; Quality of Life
0
10
20
30
40
50
60
70
Not
Important
Important Very
Important
CERT
NON-CERT

Challenging; Interesting; Intellectually Appealing
0
10
20
30
40
50
Not
Important
Important Very
Important
CERT
NON-CERT

Response to Farm Chemical Regulation *~
0
10
20
30
40
50
60
70
Not
important
Important Very
important
CERT
NON-CERT

Animal Welfare Issues*
0
10
20
30
40
50
Not
important
Important Very
important
CERT
NON-CERT
Summary• Economic based attitudinals were significant
with a positive relationship to certified farmers-price premiums, consumer demand, regulation response, fewer acres.
• No differences on other philosophical variables.
Attitudes Regarding Organic Certification

With NOP Standards, Organic Certification is Simpler and Easier
0
10
20
30
40
50
DS D NO A SA
CERT
NON-CERT

Organic Certification Helps Me Make a Better Living*
0
10
20
30
40
50
60
DS D NO A SA
CERT
NON-CERT

Customers Expect Me to Be Certified*
0
10
20
30
40
50
60
DS D NO A SA
CERT
NON-CERT

Organic Certification Not Needed for Small Scale Direct Sales*
0
5
10
15
20
25
30
35
40
DS D NO A SA
CERT
NON-CERT

Don’t Need Certification Because My Customers Trust Me*
0
5
10
15
20
25
30
35
DS D NO A SA
CERT
NON-CERT

Am Not Certified Because it is too Expensive for My Small Operation*
0
10
20
30
40
50
DS D NO A SA
CERT
NON-CERT

Am Certified Because Have to Be to Sell as Organic*
0
10
20
30
40
50
DS D NO A SA
CERT
NON-CERT

Am Certified Because Most of My Product is Sold in Indirect Markets
0
10
20
30
40
50
60
DS D NO A SA
CERT
NON-CERT

Conclusions:
• Demographics: As expected? • Structurally: As expected? • Attitudinally: As expected?
• Several significant differences between certified and non-certified organic producers.
• Some support for “conventionalization” and “bifurcation.”

Back to the Value Chain
• What are the trends in value chain governance? – Who drives the chain?
• Which system is more sustainable? – Indirect markets– Direct markets
• Which system is more risky for the producer? – Indirect markets– Direct markets
• To Certify or Not Certify?