value tree for physical atmosphere and ocean …
TRANSCRIPT
VALUE TREE FOR PHYSICAL ATMOSPHERE AND OCEAN
OBSERVATIONS IN THE ARCTIC
RAPORTTEJA
RAPPORTER
REPORTS
2019:3
MIKKO STRAHLENDORFF
KATRIINA VEIJOLA
JASON GALLO
VITO VITALE
HANNELE SAVELA
ALEXANDER SMIRNOV
HAJIME TANAKA
TETSUO SUEYOSHI
RODICA NITU
JAN RENÉ LARSEN
Value tree for physical atmosphere and ocean observations in the Arctic
Mikko Strahlendorff, Katriina Veijola, Jason Gallo , Vito Vitale , Hannele Savela , Alexander Smirnov , 1 2 3 4
Hajime Tanaka , Tetsuo Sueyoshi , Rodica Nitu , Jan René Larsen 5 6 7 8
This project has received funding from the Ministry for Foreign Affairs of Finland and the European Union’s Horizon 2020 research and innovation programme under grant agreement No 689443
1 IDA Science and Technology Policy Institute 2 National Research Council of Italy, Institute for Atmospheric Sciences and Climate 3 University of Oulu, Thule Institute 4 Arctic Portal NGO, Iceland 5 Ocean Policy Research Institute of Japan 6 Arctic Environment Research Center, National Institute of Polar Research of Japan 7 World Meteorological Organization 8 Sustaining Arctic Observing Networks (SAON) Secretariat

Published by Finnish Meteorological Institute (Erik Palménin aukio 1), P.O. Box 503
Series title and number of publication Raportteja - Rapporter - Reports 2019:3
FIN-00101 Helsinki, Finland Date 1.4.2019
Author(s) Name of project Mikko Strahlendorff, Katriina Veijola, Jason Gallo, Arktisen havaintotoiminnan arvo / Value tree for Vito Vitale, Hannele Savela, Alexander Smirnov, Hajime Tanaka, Tetsuo Sueyoshi, Rodica Nitu, Jan René Larsen
physical atmosphere and ocean observations in the Arctic Commissioned by Sustaining Arctic Observing Networks
Title Value tree for physical atmosphere and ocean observations in the Arctic
Abstract
This report describes the first instance to employ the international assessment framework for arctic observations developed by SAON and IDA STPI in 2017. Earth Observation (EO) inputs like SYNOP station measurements of physical atmosphere and in other stations ocean variables were linked to key products/outcomes/services like numerical weather prediction and through groups like in this case weather service connected to key objectives of the assessment framework. Representative yearly unit costs of EO inputs and modelling components were estimated by station experts or estimated based on European Union projects or Copernicus program tenders. The WMO OSCAR database for satellite and surface observation systems north of 60°N was used for numbers of the different station and mission categories in the Arctic. The total yearly value of this observation system including EO inputs and modeling is over 204 million €. Compared to the observing system estimated costs in the area 30°N to 60°N this is only about a fifth.
The value tree can now follow and combine the value invested in these components as it flows towards services. The key objectives have been connected by SAON/AMAP project members in a workshop to the services to build the first full value tree for a certain kind of observations. These observations are mainly produced by national meteorological and marine institutes in an operational mode.
The yearly value invested in the observation can now be distributed between the 12 Societal Benefit Areas and their sub areas identified in the assessment framework. The value tree is presented at a web page by FMI and Spatineo (2019) with a browser that can highlight single components to analyze which inputs and which SBA targets its being used for. This can help to more holistically support the whole observation system for optimal impact on societal benefit.
The value tree tool will be available for further work to address the many more EO domains like atmospheric composition or biodiversity. All in all this report can hopefully start a continuous action to update and improve the value tree. EO inputs are not static, the network changes, the costs are fluctuating and as the Arctic is becoming more accessible, it would be important to extend the observation system accordingly.
Keywords Cost-benefit analysis, meteorology, oceanography, complex system, sensor network, satellite
Language Pages
Publishing unit FMI Arctic Space Centre
ISSN and series title 0782-6079 Raportteja - Rapporter - Reports
ISBN 978-952-336-072-3 English 28
Contents
Part I Background 4 1 Value tree methodology 4 2 Observation system 5
Part II Observation system value weighting 6 3 Station costs 6
3.1 Airport and -plane observation 6 3.2 Argo float 7 3.3 Climate reference station 7 3.4 Coastal station 7 3.5 DBCP moorings 7 3.6 Hydrological station 8 3.7 Radiosonde station 8 3.8 Synop station 8 3.9 Weather radar 8 3.10 Research station 8
4 Satellite costs 8 4.1 Optical EO satellites 9 4.2 Microwave EO satellites 9 4.3 Altimetry EO satellites 9
5 Modeling costs 9 5.1 Climate prediction 9 5.2 Hydrological model 10 5.3 Numerical weather prediction 10 5.4 Ocean prediction model 105.5 Observation grids 10 5.6 Reanalysis 11
Part III Connecting the tree 11 6 Observations to services 11 7 Services to SBA key objectives 12
Part IV The Value Trees 13 8 Individual SBA trees 14
14 15 16 17 18 19 20
8.1 Disaster Resilience8.2 Environmental Quality8.3 Food Security8.4 Fundamental Understanding of the Arctic System8.5 Human Health8.6 Infrastructure and Operations8.7 Marine and Coastal Ecosystem Processes 8.8 Natural Resources8.9 Resilient Communities
21 22

8.10 Sociocultural Services 23 8.11 Terrestrial and Freshwater Ecosystem Processes 24 8.12 Weather and Climate 25
9 Combined tree 26
Part V How to use trees 26 10 Station managers 27 11 Policy-makers 27
Part VI Next steps 28
Thanks 29
References 29
4
Part I BackgroundA SAON (2019) project for this topic was formed in 2017 with participation from SAON and AMAP (2019) parties to produce for the Finnish Arctic Council presidency a report on the value tree of physical atmosphere and ocean observations in the Arctic. This work continued the International Arctic observations assessment framework (2017) started by IDA STPI (2019) and SAON. The Finnish organisation of this task has received funding by the Ministry for Foreign Affairs of Finland (2019) as the project ‘Arktisen havaintotoiminnan arvo’. The satellite observation related inves-tigation has received additional funding from the European Union's Horizon 2020 research and innovation programme under grant agreement No 689443 via project iCUPE (2019) (Integrative and Comprehensive Understanding on Polar Environments). The latter is a part of the European Union ERA-Planet (2018) network.To be able to build the tree a software tool developed by Spatineo (2019) with the Foreign ministries financing was essential. This web application enabled the project team to efficiently make nodes, link and weight connections. It is also a key asset to be able to utilize the value tree at large.
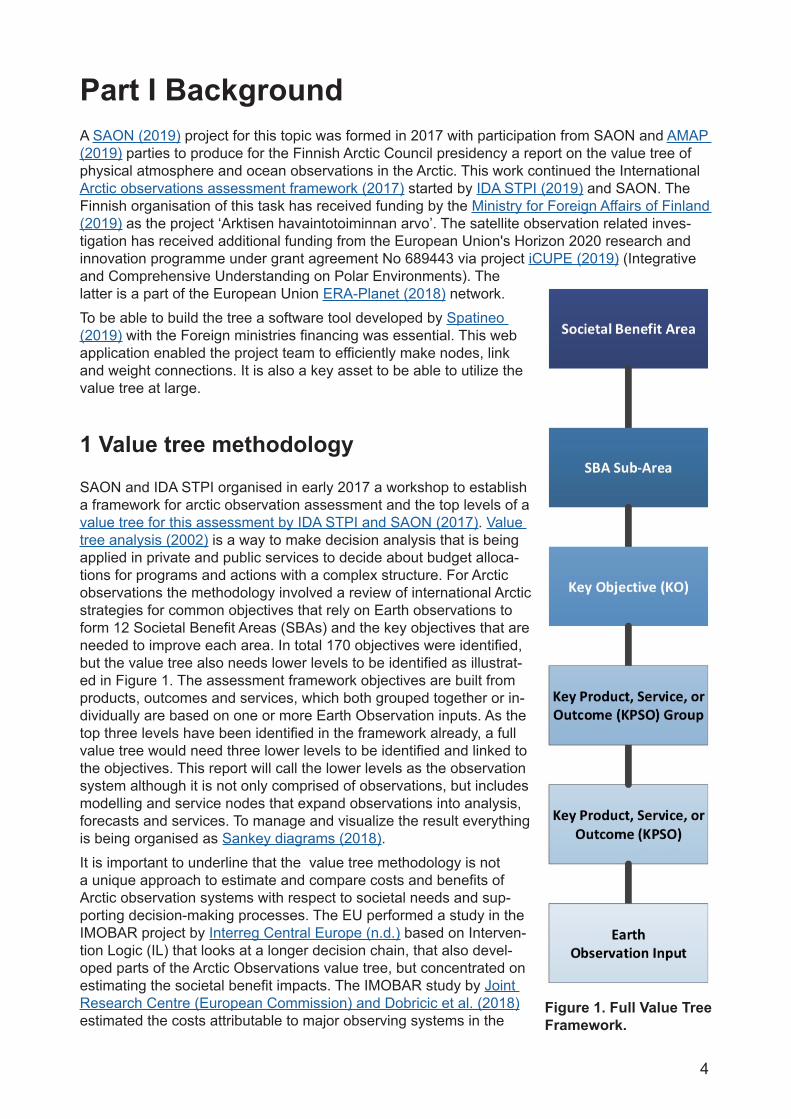
1 Value tree methodologySAON and IDA STPI organised in early 2017 a workshop to establish a framework for arctic observation assessment and the top levels of a value tree for this assessment by IDA STPI and SAON (2017). Value tree analysis (2002) is a way to make decision analysis that is being applied in private and public services to decide about budget alloca-tions for programs and actions with a complex structure. For Arctic observations the methodology involved a review of international Arctic strategies for common objectives that rely on Earth observations to form 12 Societal Benefit Areas (SBAs) and the key objectives that are needed to improve each area. In total 170 objectives were identified, but the value tree also needs lower levels to be identified as illustrat-ed in Figure 1. The assessment framework objectives are built from products, outcomes and services, which both grouped together or in-dividually are based on one or more Earth Observation inputs. As the top three levels have been identified in the framework already, a full value tree would need three lower levels to be identified and linked to the objectives. This report will call the lower levels as the observation system although it is not only comprised of observations, but includes modelling and service nodes that expand observations into analysis, forecasts and services. To manage and visualize the result everything is being organised as Sankey diagrams (2018).It is important to underline that the value tree methodology is not a unique approach to estimate and compare costs and benefits of Arctic observation systems with respect to societal needs and sup-porting decision-making processes. The EU performed a study in the IMOBAR project by Interreg Central Europe (n.d.) based on Interven-tion Logic (IL) that looks at a longer decision chain, that also devel-oped parts of the Arctic Observations value tree, but concentrated on estimating the societal benefit impacts. The IMOBAR study by Joint Research Centre (European Commission) and Dobricic et al. (2018) estimated the costs attributable to major observing systems in the
Figure 1. Full Value Tree Framework.
5
Arctic, and developed for ten case studies the links between observing systems, their outcomes and impacts on twelve societal benefit areas and a partial quantification of economic benefits. It did not consider numerical weather or ocean prediction or other intermediate products and services in their costs, but they did have estimates for how valuable the information was for end users in their case studies.The big difference of the IMOBAR action to this report is in the position of the observing system. This report is trying to as comprehensively as possible capture the bottom levels and the next steps of products like modelling to be able to answer to all key objectives of the assessment framework, while in IMOBAR the value chain was defined from 10 case objectives point of view. The IMOBAR cost estimates had very large uncertainties, which we try to improve on. This report is not trying to quantify the societal benefit, it just shows the value invested currently in the ob-serving system and which part would be attributable to which societal benefit objectives.
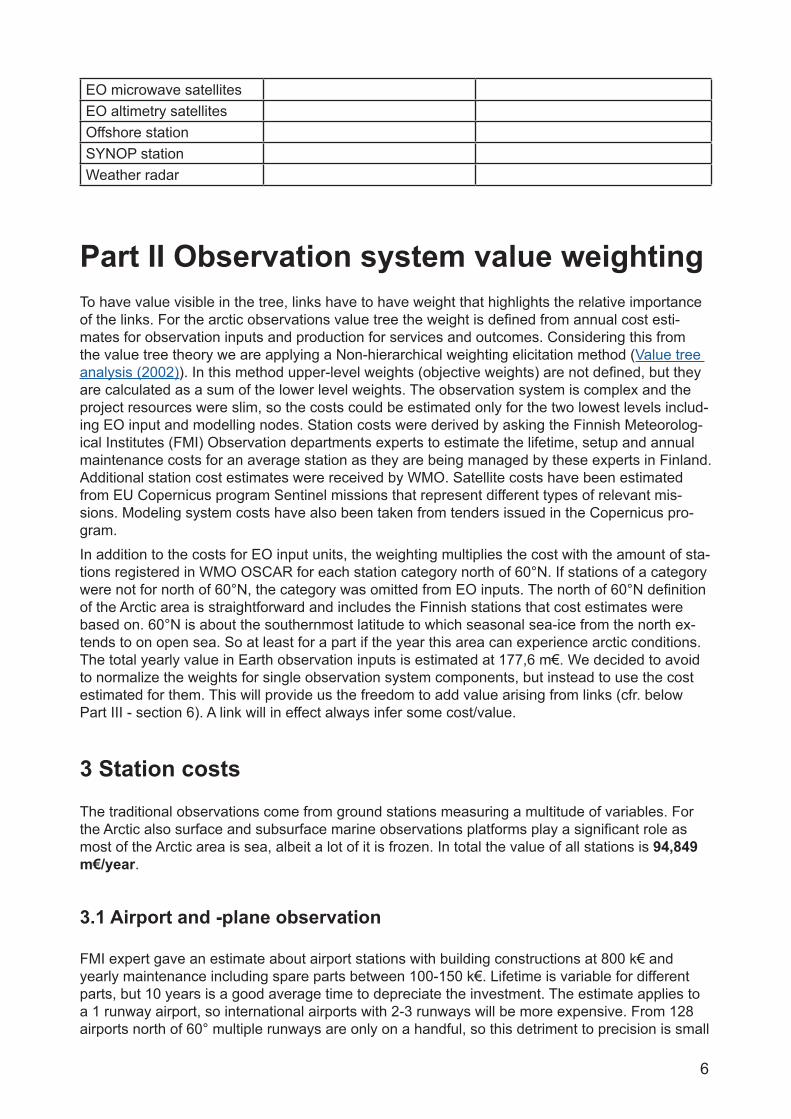
2 Observation systemObservation system includes different observation input groups. They largely follow the grouping from WMO Oscar (2019) for satellite and surface based capabilities by OSCAR (2019). Most of observation input groups (see Table 1) are as defined in station classes from WMO Oscar, al-though for example forecasts and wind related groups are not included. The amount of stations are from the situation on the 9th of January 2019, when the descriptions of observation input groups in the value trees were made.In addition, different Key Product, Service or Outcomes (KPSOs) and KPSO groups were defined. KPSOs include modeling and combining observations to next level products and KPSO groups contain Services and research outcomes. All choices are somewhat arbitrary, so the list in table 1 needs to be considered as intentional to address a challenging target. For the observing system we can for the atmospheric and ocean variables included in our study refer to a long-term con-solidated classification by WMO. This scheme is well accepted. The same holds for KPSOs and KPSO groups. Choices are derived by the scientific vision of the group participating to the project. For KPSO groups on considering time and resources at disposal, it was decided to identify large and general groups, to be sure to capture all products and services.
Table 1. Observation input groups, KPSOs and KPSO groups. The Key word is dropped for efficiency
Observation input Product, Service and Out-come
Product, Service and Outcome groups
Airport and –plane obs Climate Prediction model Arctic Council working groups report
Argo floats Hydrological model Climate serviceClimate reference station Numerical Weather prediction Environmental information serviceCoastal station Observation grids Marine serviceDBCP moorings Ocean prediction mode Research serviceObserving ship Reanalysis Weather serviceRadiosonde stationHydrological stationMountain stationResearch stationEO radiometer satellites
6
EO microwave satellitesEO altimetry satellitesOffshore stationSYNOP stationWeather radar
Part II Observation system value weightingTo have value visible in the tree, links have to have weight that highlights the relative importance of the links. For the arctic observations value tree the weight is defined from annual cost esti-mates for observation inputs and production for services and outcomes. Considering this from the value tree theory we are applying a Non-hierarchical weighting elicitation method (Value tree analysis (2002)). In this method upper-level weights (objective weights) are not defined, but they are calculated as a sum of the lower level weights. The observation system is complex and the project resources were slim, so the costs could be estimated only for the two lowest levels includ-ing EO input and modelling nodes. Station costs were derived by asking the Finnish Meteorolog-ical Institutes (FMI) Observation departments experts to estimate the lifetime, setup and annual maintenance costs for an average station as they are being managed by these experts in Finland. Additional station cost estimates were received by WMO. Satellite costs have been estimated from EU Copernicus program Sentinel missions that represent different types of relevant mis-sions. Modeling system costs have also been taken from tenders issued in the Copernicus pro-gram. In addition to the costs for EO input units, the weighting multiplies the cost with the amount of sta-tions registered in WMO OSCAR for each station category north of 60°N. If stations of a category were not for north of 60°N, the category was omitted from EO inputs. The north of 60°N definition of the Arctic area is straightforward and includes the Finnish stations that cost estimates were based on. 60°N is about the southernmost latitude to which seasonal sea-ice from the north ex-tends to on open sea. So at least for a part if the year this area can experience arctic conditions. The total yearly value in Earth observation inputs is estimated at 177,6 m€. We decided to avoid to normalize the weights for single observation system components, but instead to use the cost estimated for them. This will provide us the freedom to add value arising from links (cfr. below Part III - section 6). A link will in effect always infer some cost/value.
3 Station costsThe traditional observations come from ground stations measuring a multitude of variables. For the Arctic also surface and subsurface marine observations platforms play a significant role as most of the Arctic area is sea, albeit a lot of it is frozen. In total the value of all stations is 94,849 m€/year.
3.1 Airport and -plane observation
FMI expert gave an estimate about airport stations with building constructions at 800 k€ and yearly maintenance including spare parts between 100-150 k€. Lifetime is variable for different parts, but 10 years is a good average time to depreciate the investment. The estimate applies to a 1 runway airport, so international airports with 2-3 runways will be more expensive. From 128 airports north of 60° multiple runways are only on a handful, so this detriment to precision is small
7
and taking the upper price for maintenance this is further reduced. Calculating the total weight the yearly investment 80 000 and maintenance 150 000 yield a total 230 k€/year.This category includes also profiles measured by airplanes during takeoff and landing. The yearly costs for these are added at 20 k€ per year per airport based mainly on the costs for communica-tion as planes include already the sensors and are considered a free resource. Airplane commu-nication is satellite based and rather expensive. There was no real source for the estimate, it is based on speculation. Multiplied by airports in the Arctic the grand total yearly value is 32 million €.
3.2 Argo float
A standard float with temperature and salinity measurements price is about 15 k€ based on Euro-ARGO procurement information. Floats last globally 4 years on average, but conditions are more demanding in sea areas north of 60°N. Floats have to be able to deal with sea ice in Arctic sea areas, special floats able to detect ice to not surface or abilities to be navigated away from ice areas need to be used. Float pricing was determined from an EU project MOCCA, grant agree-ment EASME/EMFF/2015/1.2.1.1/SI2.709624 that with 5 million € procured and deployed 150 new floats. Operating time was averaged to 3 years leading to a 11 k€ price per float. As MOCCA included standard floats, Arctic extra gear lead to a 15 k€ estimate for yearly costs per float and with 337 floats in WMO OSCAR the grand total is 5,055 m€.
3.3 Climate reference station
Climate reference stations as a more demanding SYNOP station was added by WMO. As mea-surements have more stringent precision requirements setup and replacements will be more costly. An estimated 20 k€/year is used with the number of stations in OSCAR being 134. Value is 2,68 m€/year in total. Here only the surface network was considered although there are 3 GRU-AN and 14 GUAN stations in the Arctic. All of them are however also included in the radiosonde stations so in an effort not to duplicate value instances these are omitted from this category. The extra value for the climate reference status is smaller than the general cost for an upper air sta-tion. For surface stations it is a more significant value addition.
3.4 Coastal station
FMI expert estimated coastal stations as measuring wind, air temperatures, moisture and pres-sure only compared to full fledged SYNOP stations. This leads to cheaper setup costs of 15 k€, but similar maintenance costs of 5 k€, because additional costs accrue from sensors needing more often replacement and stations tending to be on more demanding logistics routes.In OS-CAR 87 coastal stations have been identified. The total value is 0,435 m€/year.
3.5 DBCP moorings
337 platforms are identified in OSCAR as DBCP moorings. These mean in fact many different types of stations observing oceans surface and subsurface variables. Pricing is therefore quite impossible and the 20 k€/year has been derived from concluding that DBCP stations are on aver-age more complex than ARGO floats and setup, especially installation costs are significant. The total weight is 6,74 m€/year.
8
3.6 Hydrological station
The value is estimated at 3,890 m€/year based on unit costs of 10k€ / year for observations for surface and groundwater. In the Arctic hydrology needs to be coupled with snow observations, preferably snow water content. 389 stations are identified as daily stations from the Arctic runoff database by GRDC (2018). Daily stations represent better the inputs to hydrological models, so the extra 26 stations with monthly data were excluded.
3.7 Radiosonde station
FMI expert estimated setup costs for a radiosonde launch container and corresponding systems to be around 500 k€ while yearly costs for refilling balloons, sondes, gas and other parts and maintenance are 175 k€. 10 years lifetime is a useful timing for depreciating the investment. OSCAR counts 87 stations in our target area, which at 225 k€/year/station brings together 19,125 m€/year weight to distribute into the observation system.
3.8 Synop station
FMI expert estimated a fully featured SYNOP station to need in addition to temperatures, air pressure, humidity and winds also a ceilometer for cloud heights and a sensor for precipitation forms. This adds up a 60 k€ setup cost. 10 years lifetime and yearly 5 k€ for maintenance and sensor replacement bring a 11 k€/year station cost. OSCAR refers to 1 334 SYNOP stations north of 60°N for a total weight of 14,674 million €.
3.9 Weather radar
FMI expert estimated a weather radar to cost 1,5-2 m€, maintenance 50-100 k€ yearly and a 15 year depreciation time. Annually an average 230 k€ per radar with OSCAR having 32 radars, gives a total weight of 7,36 m€.
3.10 Research station
Observing stations operated by research institutions independently, or as part of collaborative programs, are essential for addressing observing gaps and investigating new capabilities. Long term cryosphere related observations are a good example. WMO estimated unit costs at 100k€ / year. There is no one category to identify these stations in OSCAR, this list (including number of sites) was chosen: OceanSites 24, CryoNet 2 and GRUAN 3. 29 stations mean a yearly value of 2,9 m€.
4 Satellite costsThree different satellite types were distinguished from WMO OSCAR to be relevant for Arctic observations: optical, microwave and altimetry Earth Observation missions. Satellites are an essential component of an Arctic Observing system and in our tree we estimate 82,89 million €/year value for it.
9
4.1 Optical EO satellites
The reference mission for pricing setup costs is the Sentinel-3 mission, which was reported to cost 265 m€ to produce and launch into orbit. Sentinel-3 has several instruments with many data products, which nicely addresses many atmosphere and ocean relevant monitoring needs. Past missions have on average served almost 15 years, which means 18 m€/year costs, but we need to consider that the whole cost should not be focused on the Arctic area as the bigger use of EO data is in fact where humans are settled. In this case we however consider that Earth Observa-tion is most valuable for its capability to cover the whole Earth surface, so the part of EO systems relevant for the Arctic is in relation to the Arctic surface area compared to the whole Earth sur-face. North of 60°N are about 15% of polar orbit global coverage. In WMO satellite OSCAR 17 optical missions are currently operational and delivering data on a regular basis. In total this adds to a yearly value of 45,9 m€, which represents the single biggest EO input value.
4.2 Microwave EO satellites
Synthetic Aperture Radar missions and other microwave mission types in OSCAR were combined for this category. The Sentinel-1 mission is chosen as the reference mission costing 200 m€ to launch and operate. With generally narrower swaths than in optical missions the coverage per-centage for these missions is only 13,4%. Past microwave missions have also a shorter lifetime at a little short of 12 years yielding 17*0.134= 2,278 m€/year. OSCAR identifies 14 missions cur-rently delivering data from orbit totalling 31,892 m€ yearly EO input weight.
4.3 Altimetry EO satellites
The third missions are especially important for measuring global sea level precisely directly be-neath the satellite. The reference mission is Jason-3 costing 60 m€ to produce and launch into service. Yearly costs are 5,3 m€, but only 8 % of the surface of the mission observes Arctic area. There are currently 12 mission up and observing according to OSCAR SAT. Total weight is 5,09 m€/year.
5 Modeling costsAlso for the next value chain component the additional value was added to the weight to be dis-tributed further. The additional value from modeling is in total 26,06 m€/year.
5.1 Climate prediction
Climate prediction value is estimated at 14,400 m€/year. The cost is based on the Copernicus climate change service tender C3S_34b in ECMWF (2019a) for Regional climate projections. The range for offers was set at between 2,55 and 3,665 m€ leading to use 3,2 m€ as the estimate, which for a 4 year lifespan means yearly 800k€.Arctic CORDEX by CliC (n.d.) has 18 modeling groups identified.
10
5.2 Hydrological model
For atmosphere and ocean variables hydrological modeling seems irrelevant, but most hydrologi-cal models run primarily from precipitation inputs, which come from atmosphere models or ob-servations. It is also important for understanding the variability of the land-ocean-ice-atmosphere system. Hydrological model value is estimated at 2 m€/year based on unit costs of 200k€ / year. The Swedish Meteorological and Hydrological Institute SMHI is known to run operational arctic hydrological model, but a total of 10 relevant models were estimated based on information from WMO Hydrohub (2019) and the Global runoff database by GRDC (2019) on active arctic hydrol-ogy. In particular Arctic-HYCOS project by WHYCOS (2014) refers to 8 partner countries and in a few of them there are multiple teams.
5.3 Numerical weather prediction
Weather forecast modeling value is difficult to scale for the Arctic as most models are run with a focus towards other areas, but the Arctic will also be covered at least partly. Compared to climate prediction modeling, weather predictions need to assimilate near real time observation infor-mation from both many ground stations and many satellite systems. Also weather prediction is performed several times a day in many cases demanding supercomputing resources continuous-ly. This makes weather prediction more expensive and the yearly unit cost was estimated at 1 000 k€. 8 models oriented towards the Arctic have been estimated based on Arctic Council member countries all having numerical weather prediction activities and all having at least parts of the Arctic covered in their domain. The Norwegian weather service met.no is having a specific Arctic Arome model covering the whole Arctic hemisphere.The total value is 8 m€/year.
5.4 Ocean prediction model
For Ocean prediction value estimation was again helped by a recent Copernicus marine environ-mental monitoring service call 69-CMEMS-MFC-ARCTIC by Mercator Ocean (2019) for the Arctic monitoring and forecasting centre. The 4,45m€ for 3,25 years lead to a unit cost of 1 369 k€ /year. 4 models are estimated to be equally feature complete as the Copernicus model leading to a value of 5,476 m€/year. There are several sea ice models operational as well, but these have been added to the observation grids node. Here a model is defined to be including both sea state from surface to significant depths and surface sea-ice and even icebergs are all included in the pricing unit. Similar other examples were difficult to find, but we assume a similar capability for further 3 Arctic nations.
5.5 Observation grids
A very common and simpler means to combine station or satellite data are used to get obser-vation grids. These have a variety of methodology, but all try to join single variable fields over geographical areas. Their effort is mainly in developing the algorithm, while production costs are marginal. A yearly unit price of 1 k€ is used although this is not a good one. The number of such grids is also difficult to define. 200 was taken from different models having about this many sur-face parameters. For ice charts a better estimate of 20 k€/year could be established and 3 differ-ent Arctic products are available. Total value ended up at 0,26 m€/year.
11
5.6 Reanalysis
To be able to benchmark climate prediction models reanalysis is essential, but it is also a very po-tent tool for any historical analysis using several environmental variables as the reanalysis model ensures consistency across all variables so that the earth system has not lost energy or mass. A total yearly value of 2,4 m€ could be derived from the Copernicus climate change service tender C3S_322 by ECMWF (2019b) Regional Climate Reanalysis which had a specific lot for Arctic reanalysis. The range in the call was determined at 3,04 and 3,8 m€, but instead of using the average 3,41 m€, 3,2 were used as the estimate as other Arctic reanalysis actions were deemed less ambitions than the C3S. The unit cost is eventually 800k€ / year, because the tender was run for 4 years. There should be 2 other Arctic reanalysis efforts in the US based on a 2014 workshop report by NOAA (2014).
Part III Connecting the treeThe key task for the project was to build a full value tree for certain Earth Observation inputs. As the assessment framework in 2017 had connected the upper levels, the lower tree for atmo-sphere and ocean physical variables value chains needed to be established and these chains needed to be connected to the existing top half of the tree. The value chain components including their weighting has been described in the Part II. This part will describe the choices made in con-necting the value chains to the key objectives. A design choice was made in that no Earth Obser-vation input or modelling output will directly feed to SBA key objectives, but that were always is a service layer involved. These services were grouped as Arctic council working group reports, climate service, environmental information service, marine service, research service and weath-er service. The working group reports were raised as a distinction to research service, because Arctic Council reports are a politically checked consensus between SBA stakeholders.
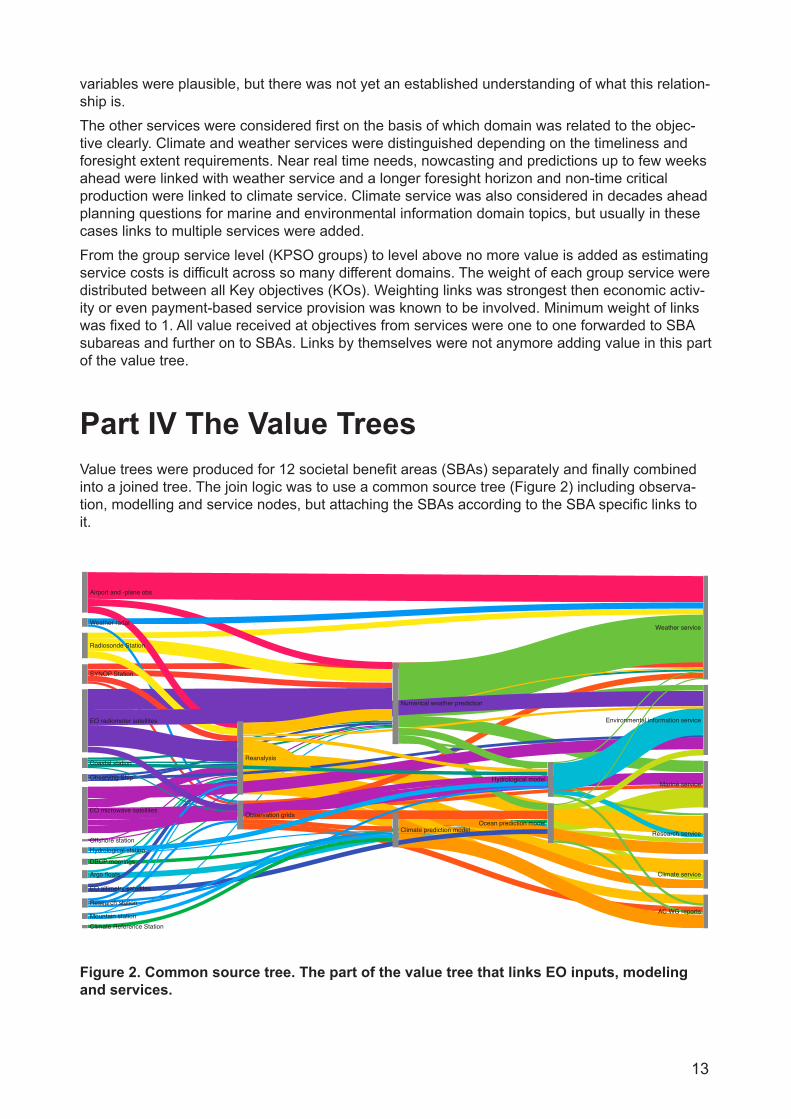
6 Observations to servicesThe value chains for Earth Observation inputs to services will not be discussed in this report exhaustively as the weight distribution is easier to check visually from the value trees. Generally links from EO inputs will go to modeling or gridding activities, but in many cases the data is also used directly in the services. For example airport and -plane observations will feed numerical weather prediction and reanalysis, but by far the most important use is directly in the aviation weather service. The aviation METAR product is defining the observation needs, but even the TAF short-term forecast product is dominated by observation inputs compared to weather model data. In this way 23 m€ weight was going directly to weather service and 6 m€ each to numerical weather prediction and reanalysis. Notice that the total is 35 as in the weight 32 of value identified in part II and 3 for having as many links identified. The same logic is followed in all the observ-ing system linking. It is also important to understand that only substantial relations were used for linking the lower levels. For example airport observations were not linked to observation grids although airport data might be used for observation grids as well. But SYNOP stations are the main source used for many meteorological grids so this chain is the most important to highlight. By refraining from having every single link included, the tree is visually still readable. The full ini-tial weights from the observation are anyhow forwarded to the service level, so this practice is not losing value, just carrying it forward in the most important links.Earth Observation input will have one to four links only, but in the intermediate level, Reanalysis, can have up to 14 connections to EO inputs, while a maximum of 6 connections towards services are possible. Numerical weather prediction is ingesting 10 inputs including reanalysis, as the background climatology constraining predictions to stay realistic are based on reanalysis data.
12
This is an important role of reanalysis, but this example describes also how the lower tree needs complexer links than the assessment framework initially has foreseen. One can not just have lev-els where only input links go to products and outcomes, which then are linked to service groups. The complexer model where products can link to products, needs to be used. Ocean predic-tion models use as an important input the wind forcing and surface temperature from numerical weather prediction, which is another case of needing to link products to products for a correct value chain. In Figure 2 this visually changes the three lower levels structure planned in Figure 1 into having actually five levels. This should still be simple enough to be looked at as a full tree in a glance.For climate prediction it is good to highlight that much less observation inputs are used as a climate prediction model runs on its own. Tuning the model to represent past climate correctly is done with observations and these are mainly drawn from reanalysis, observation grids and select-ed long term observation stations.The services end up receiving value according to Table 2:
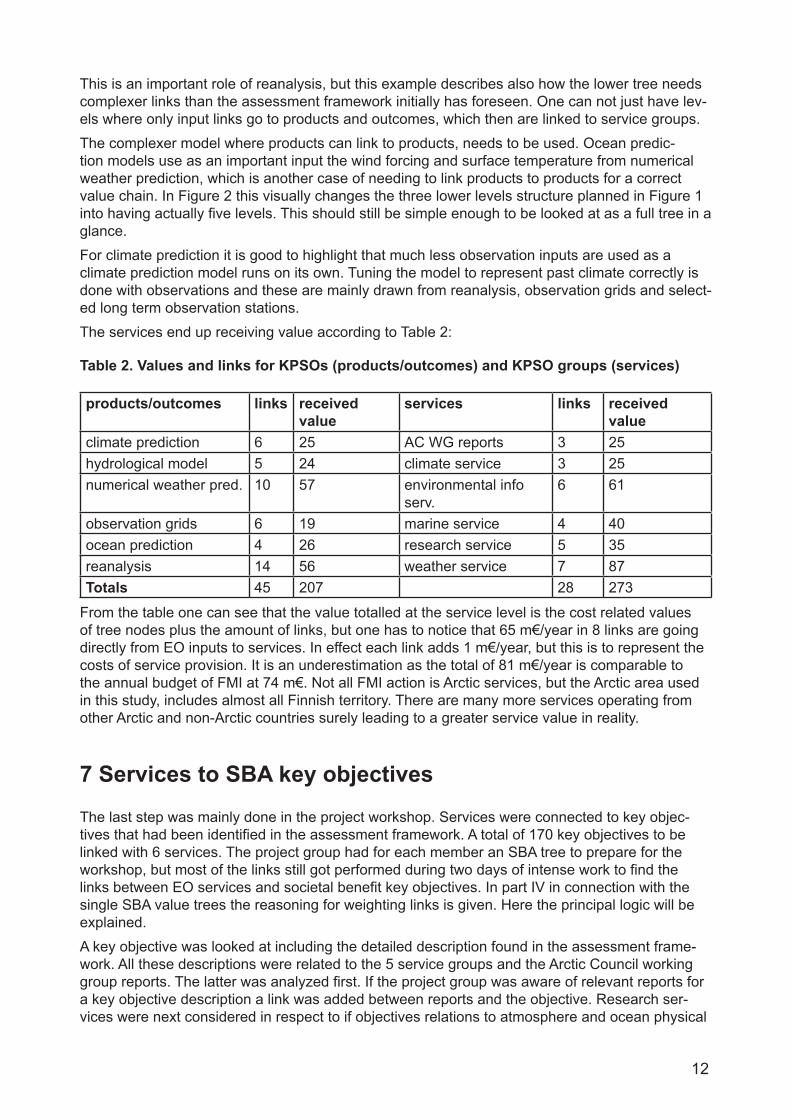
Table 2. Values and links for KPSOs (products/outcomes) and KPSO groups (services)
products/outcomes links received value
services links received value
climate prediction 6 25 AC WG reports 3 25hydrological model 5 24 climate service 3 25numerical weather pred. 10 57 environmental info
serv.6 61
observation grids 6 19 marine service 4 40ocean prediction 4 26 research service 5 35reanalysis 14 56 weather service 7 87Totals 45 207 28 273
From the table one can see that the value totalled at the service level is the cost related values of tree nodes plus the amount of links, but one has to notice that 65 m€/year in 8 links are going directly from EO inputs to services. In effect each link adds 1 m€/year, but this is to represent the costs of service provision. It is an underestimation as the total of 81 m€/year is comparable to the annual budget of FMI at 74 m€. Not all FMI action is Arctic services, but the Arctic area used in this study, includes almost all Finnish territory. There are many more services operating from other Arctic and non-Arctic countries surely leading to a greater service value in reality.
7 Services to SBA key objectivesThe last step was mainly done in the project workshop. Services were connected to key objec-tives that had been identified in the assessment framework. A total of 170 key objectives to be linked with 6 services. The project group had for each member an SBA tree to prepare for the workshop, but most of the links still got performed during two days of intense work to find the links between EO services and societal benefit key objectives. In part IV in connection with the single SBA value trees the reasoning for weighting links is given. Here the principal logic will be explained.A key objective was looked at including the detailed description found in the assessment frame-work. All these descriptions were related to the 5 service groups and the Arctic Council working group reports. The latter was analyzed first. If the project group was aware of relevant reports for a key objective description a link was added between reports and the objective. Research ser-vices were next considered in respect to if objectives relations to atmosphere and ocean physical
13
variables were plausible, but there was not yet an established understanding of what this relation-ship is. The other services were considered first on the basis of which domain was related to the objec-tive clearly. Climate and weather services were distinguished depending on the timeliness and foresight extent requirements. Near real time needs, nowcasting and predictions up to few weeks ahead were linked with weather service and a longer foresight horizon and non-time critical production were linked to climate service. Climate service was also considered in decades ahead planning questions for marine and environmental information domain topics, but usually in these cases links to multiple services were added. From the group service level (KPSO groups) to level above no more value is added as estimating service costs is difficult across so many different domains. The weight of each group service were distributed between all Key objectives (KOs). Weighting links was strongest then economic activ-ity or even payment-based service provision was known to be involved. Minimum weight of links was fixed to 1. All value received at objectives from services were one to one forwarded to SBA subareas and further on to SBAs. Links by themselves were not anymore adding value in this part of the value tree.
Part IV The Value TreesValue trees were produced for 12 societal benefit areas (SBAs) separately and finally combined into a joined tree. The join logic was to use a common source tree (Figure 2) including observa-tion, modelling and service nodes, but attaching the SBAs according to the SBA specific links to it. Source Tree
SYNOP Station
Radiosonde Station
Airport and -plane obs
Coastal station
Offshore station
Observing Ship
Weather radar
Mountain station
Argo floats
DBCP moorings
Numerical weather prediction
Ocean prediction model
Reanalysis
Climate prediction model
Observation grids
Weather service
Marine service
Environmental information service
AC WG reports
Research service
Climate service
EO microwave satellites
EO radiometer satellites
EO altimetry satellites
Research station
Hydrological station
Hydrological model
Climate Reference Station
http://arctic-obs.fmi.fi
Figure 2. Common source tree. The part of the value tree that links EO inputs, modeling and services.
14
The following chapters will present the individual value trees and explain the reasoning behind the weighting of links. To highlight where observation system value is creating societal benefit the value is carried from the products, services and outcomes groups to objectives and onwards to SBAs. The sum of weight received to each node from the left is put on the link to the right. In this way the total SBA node height is representing the value of the observation system dedicated to this area. We need to consider that our analysis started from observing system component costs. So this analysis can only lead to evaluate in which percentage these costs are distributed/used for each SBAs. Analysis of benefits need more information about all commercial products devel-oped and at disposal, as well as the value of the private sector connected to services and results. Finally a deep evaluation of positive consequence of a more appropriate decision-making process in different areas would be necessary. In general it is well known that sound information applied to decisions brings extra benefits. For weather services in Finland it has been shown to be at least 5-6 times the value of producing the service (Leviäkangas et al. (2009)).
8 Individual SBA treesTo follow the value flow from observations to objectives a single societal benefit area is most suitable, as 8-20 objectives are not too many to still distinguish the links and their weights. In the Value Trees, connections were made from different observations, to key products and services and to key products and services groups towards the SBA key objectives. In order to meet the key objectives in different SBA Value Trees, different services need to be used depending on the key objective that we are looking at. The connections from services to the key objectives of the Arctic Observations Assessment Framework were thought of and discussed during the Workshop in Helsinki. It is important to know what information is needed to meet those objectives.
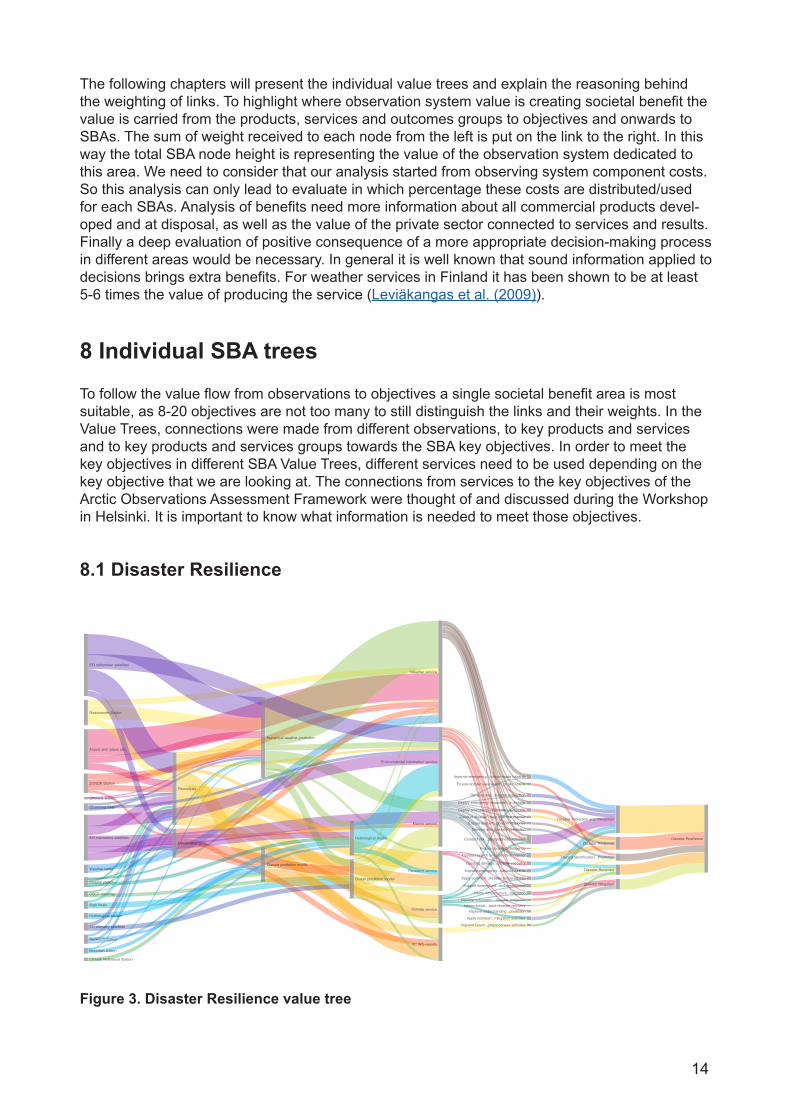
8.1 Disaster Resilience
Figure 3. Disaster Resilience value tree
15
In the Disaster Resilience Value Tree, most earth observation information is needed to meet the key objective of ‘Conducting risk assessments to inform disaster preparedness activities’. There data from weather service, environmental service, marine service and climate service are need-ed. Those services are needed to meet many other of the key objectives as well. More weight can also be seen with weather data in order to meet the objective of ‘Improving emergency preparedness for human-made hazards’. Many links have been identified and several have been associated with extra weight as well-established services exist including economic transactions to substantiate these.
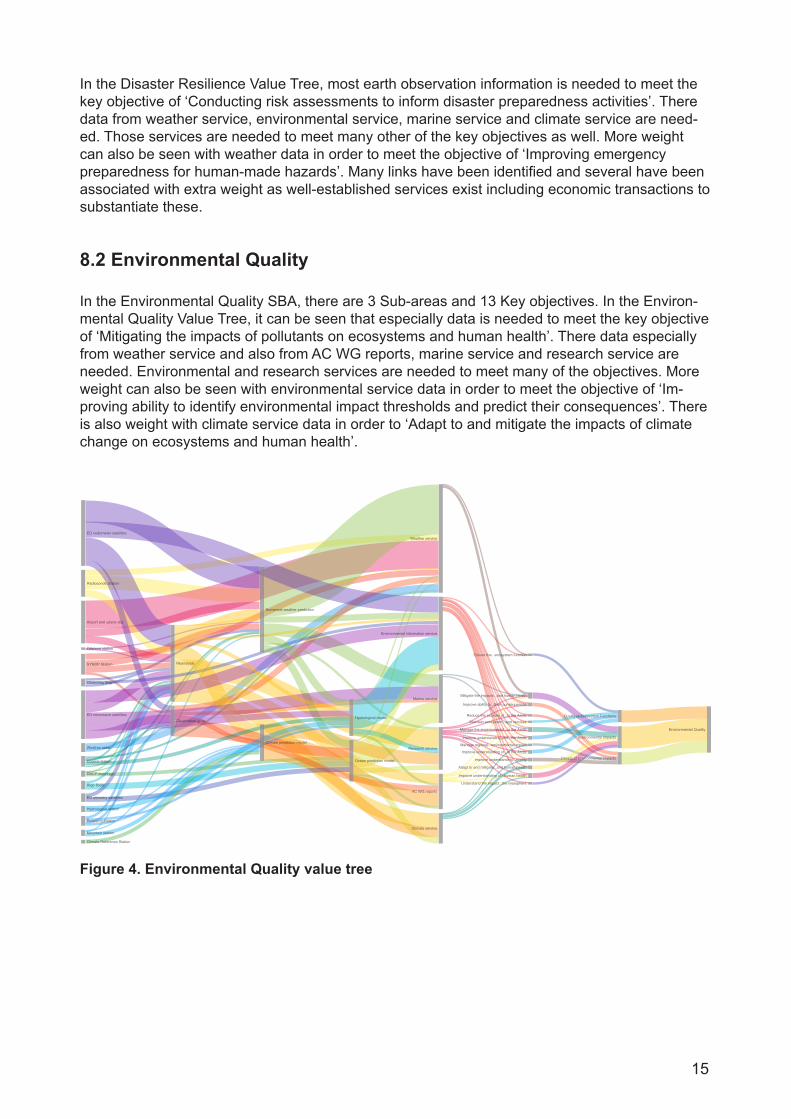
8.2 Environmental Quality
In the Environmental Quality SBA, there are 3 Sub-areas and 13 Key objectives. In the Environ-mental Quality Value Tree, it can be seen that especially data is needed to meet the key objective of ‘Mitigating the impacts of pollutants on ecosystems and human health’. There data especially from weather service and also from AC WG reports, marine service and research service are needed. Environmental and research services are needed to meet many of the objectives. More weight can also be seen with environmental service data in order to meet the objective of ‘Im-proving ability to identify environmental impact thresholds and predict their consequences’. There is also weight with climate service data in order to ‘Adapt to and mitigate the impacts of climate change on ecosystems and human health’.
Figure 4. Environmental Quality value tree
16
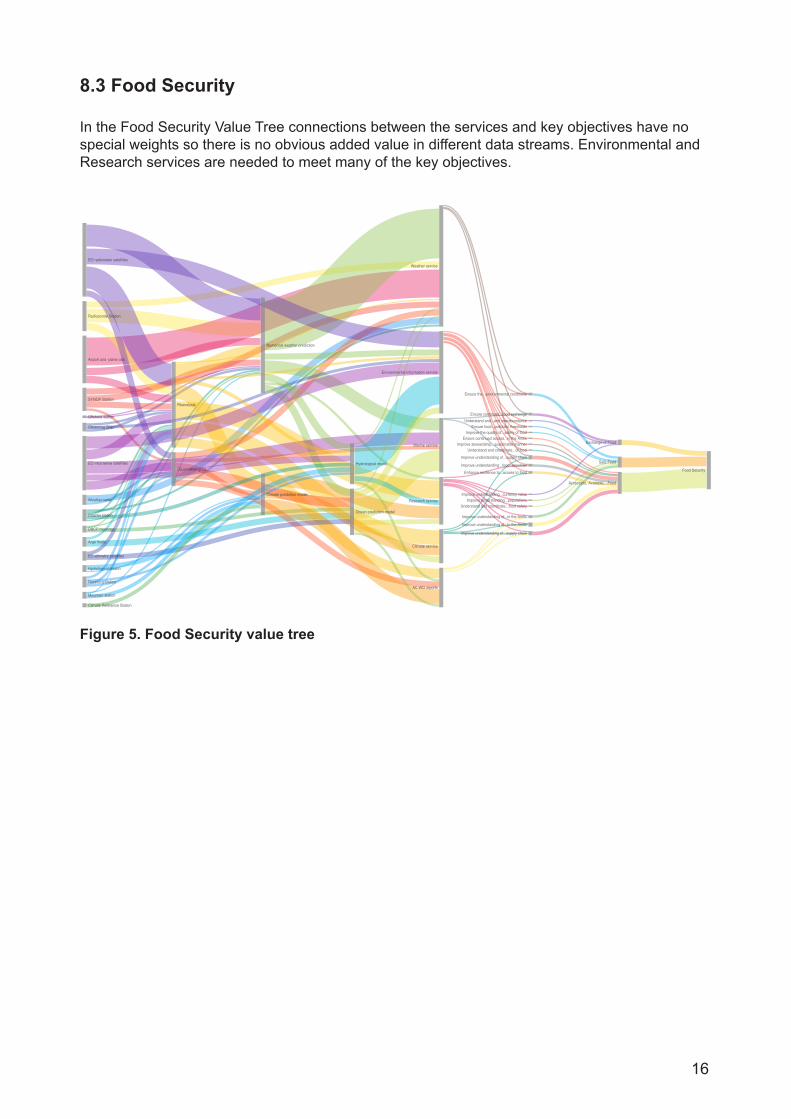
8.3 Food Security
In the Food Security Value Tree connections between the services and key objectives have no special weights so there is no obvious added value in different data streams. Environmental and Research services are needed to meet many of the key objectives.
Figure 5. Food Security value tree
17
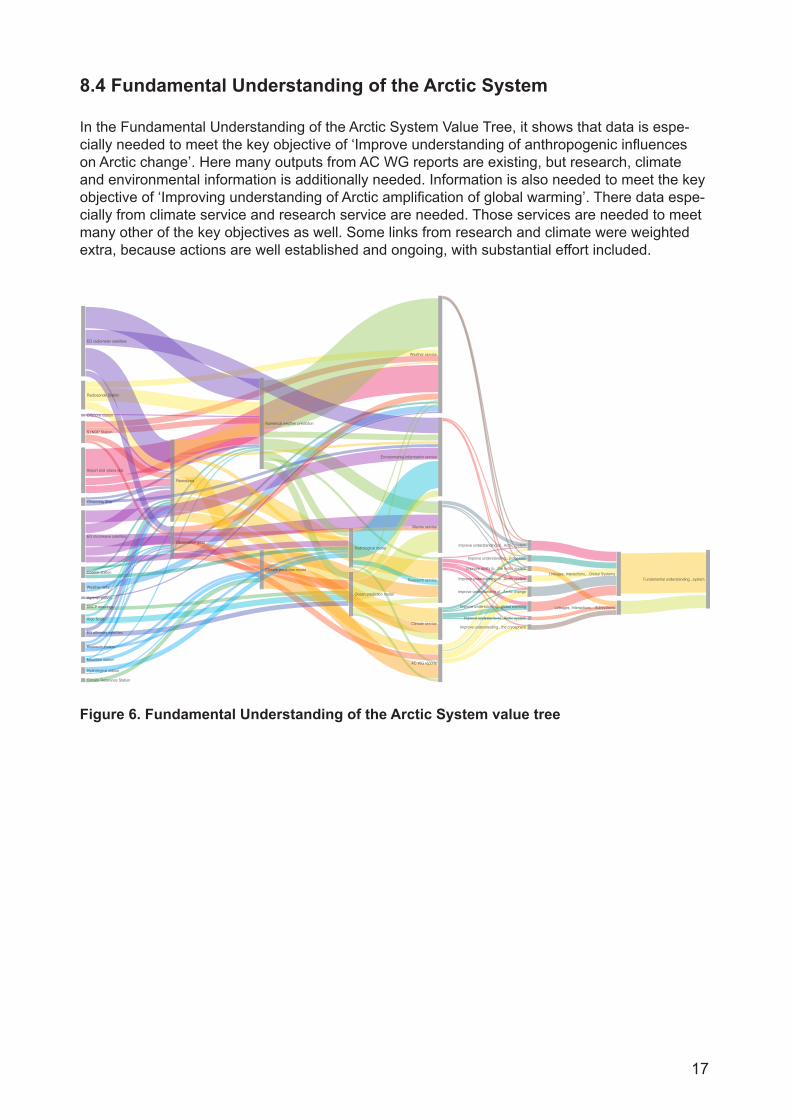
8.4 Fundamental Understanding of the Arctic System
In the Fundamental Understanding of the Arctic System Value Tree, it shows that data is espe-cially needed to meet the key objective of ‘Improve understanding of anthropogenic influences on Arctic change’. Here many outputs from AC WG reports are existing, but research, climate and environmental information is additionally needed. Information is also needed to meet the key objective of ‘Improving understanding of Arctic amplification of global warming’. There data espe-cially from climate service and research service are needed. Those services are needed to meet many other of the key objectives as well. Some links from research and climate were weighted extra, because actions are well established and ongoing, with substantial effort included.
Figure 6. Fundamental Understanding of the Arctic System value tree

18
8.5 Human Health
Figure 7. Human Health value tree
In the Human Health Value Tree links are not weighted as generally the links are not very strong. Data from several services was identified to be needed to meet the key objective of ‘Improving understanding of the risks and benefits of climatic and environmental changes on community, household and individual mental health’. There data from weather service, environmental service and climate service are needed, although the weights couldn’t be substantiated. Environmental service is needed to meet many of the objectives, else the links are weak or non-existing.
19
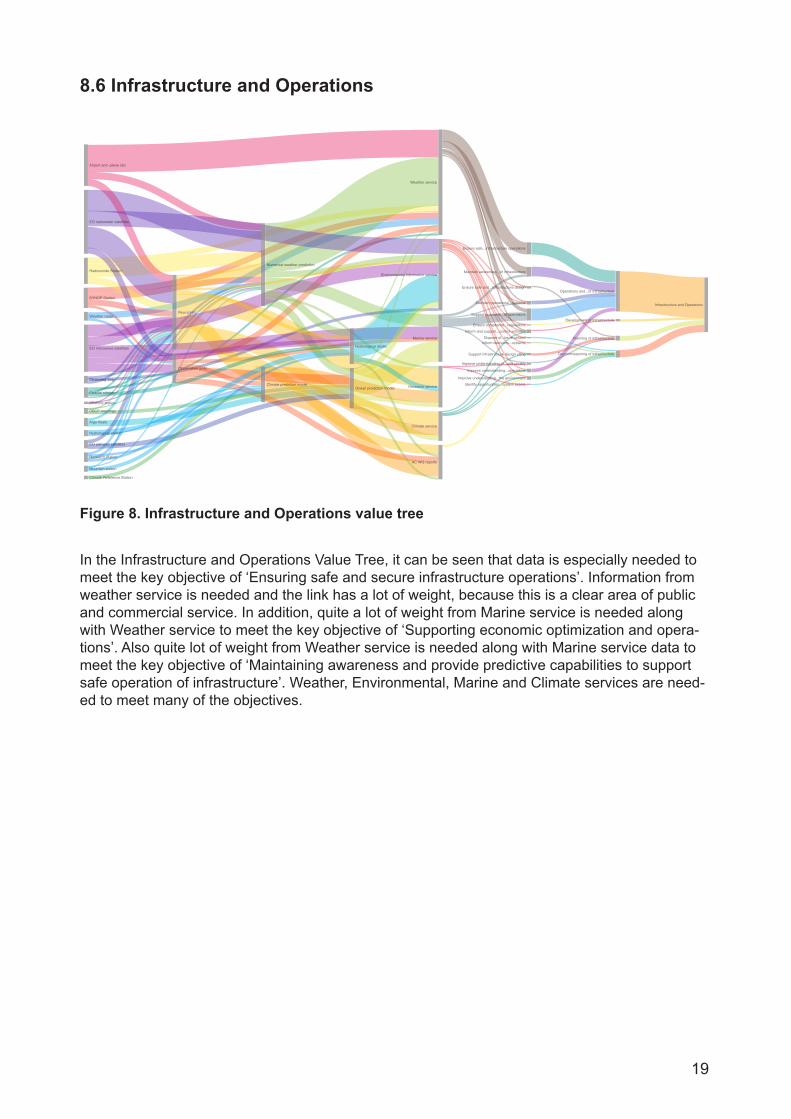
Figure 8. Infrastructure and Operations value tree
In the Infrastructure and Operations Value Tree, it can be seen that data is especially needed to meet the key objective of ‘Ensuring safe and secure infrastructure operations’. Information from weather service is needed and the link has a lot of weight, because this is a clear area of public and commercial service. In addition, quite a lot of weight from Marine service is needed along with Weather service to meet the key objective of ‘Supporting economic optimization and opera-tions’. Also quite lot of weight from Weather service is needed along with Marine service data to meet the key objective of ‘Maintaining awareness and provide predictive capabilities to support safe operation of infrastructure’. Weather, Environmental, Marine and Climate services are need-ed to meet many of the objectives.
8.6 Infrastructure and Operations
20
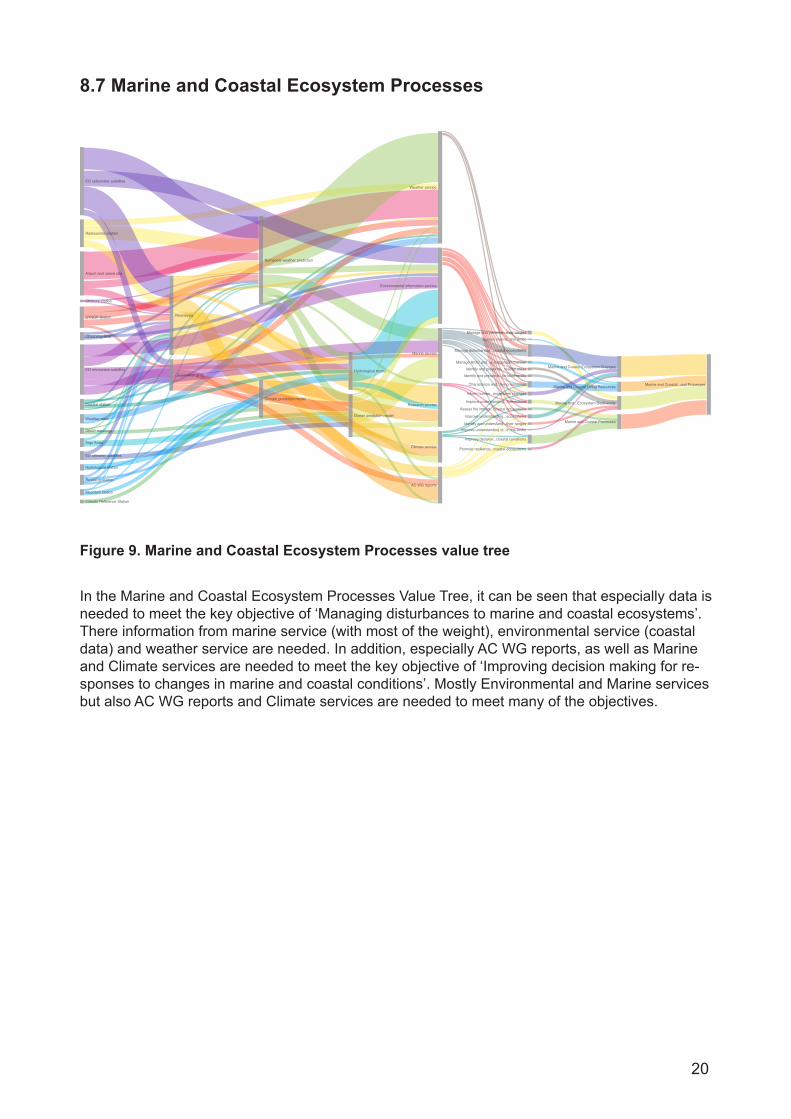
Figure 9. Marine and Coastal Ecosystem Processes value tree
In the Marine and Coastal Ecosystem Processes Value Tree, it can be seen that especially data is needed to meet the key objective of ‘Managing disturbances to marine and coastal ecosystems’. There information from marine service (with most of the weight), environmental service (coastal data) and weather service are needed. In addition, especially AC WG reports, as well as Marine and Climate services are needed to meet the key objective of ‘Improving decision making for re-sponses to changes in marine and coastal conditions’. Mostly Environmental and Marine services but also AC WG reports and Climate services are needed to meet many of the objectives.
8.7 Marine and Coastal Ecosystem Processes
21
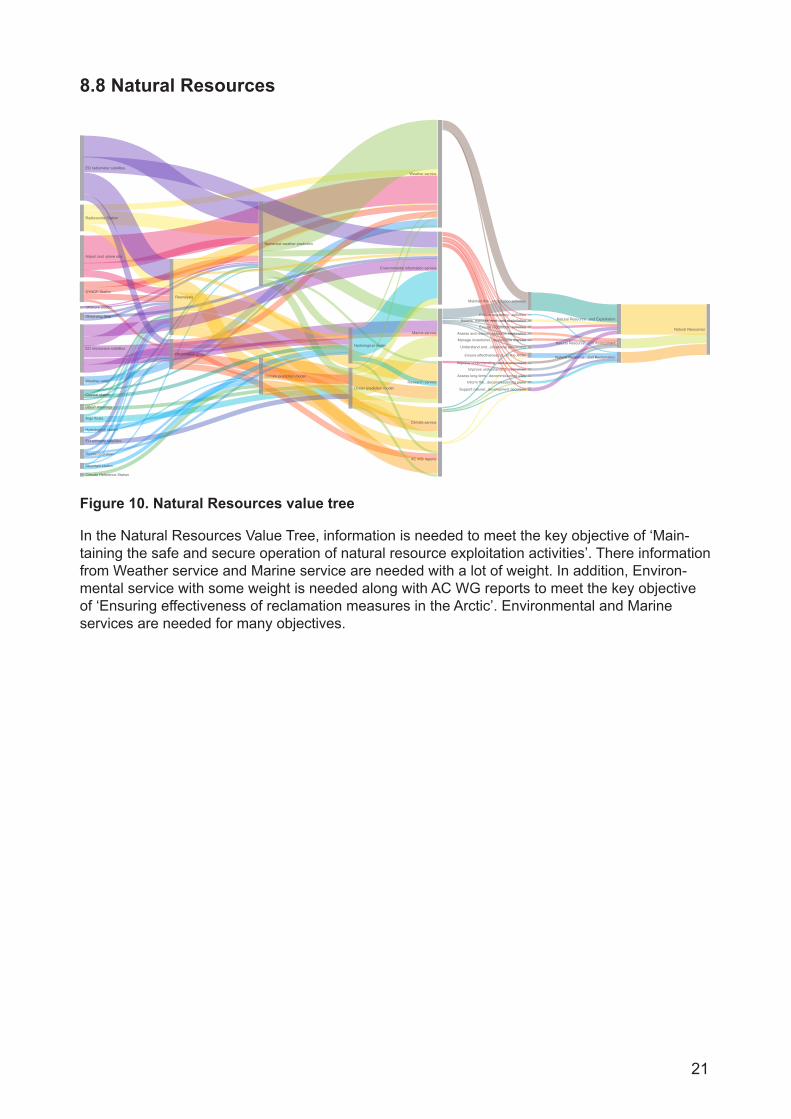
Figure 10. Natural Resources value tree
In the Natural Resources Value Tree, information is needed to meet the key objective of ‘Main-taining the safe and secure operation of natural resource exploitation activities’. There information from Weather service and Marine service are needed with a lot of weight. In addition, Environ-mental service with some weight is needed along with AC WG reports to meet the key objective of ‘Ensuring effectiveness of reclamation measures in the Arctic’. Environmental and Marine services are needed for many objectives.
8.8 Natural Resources
22
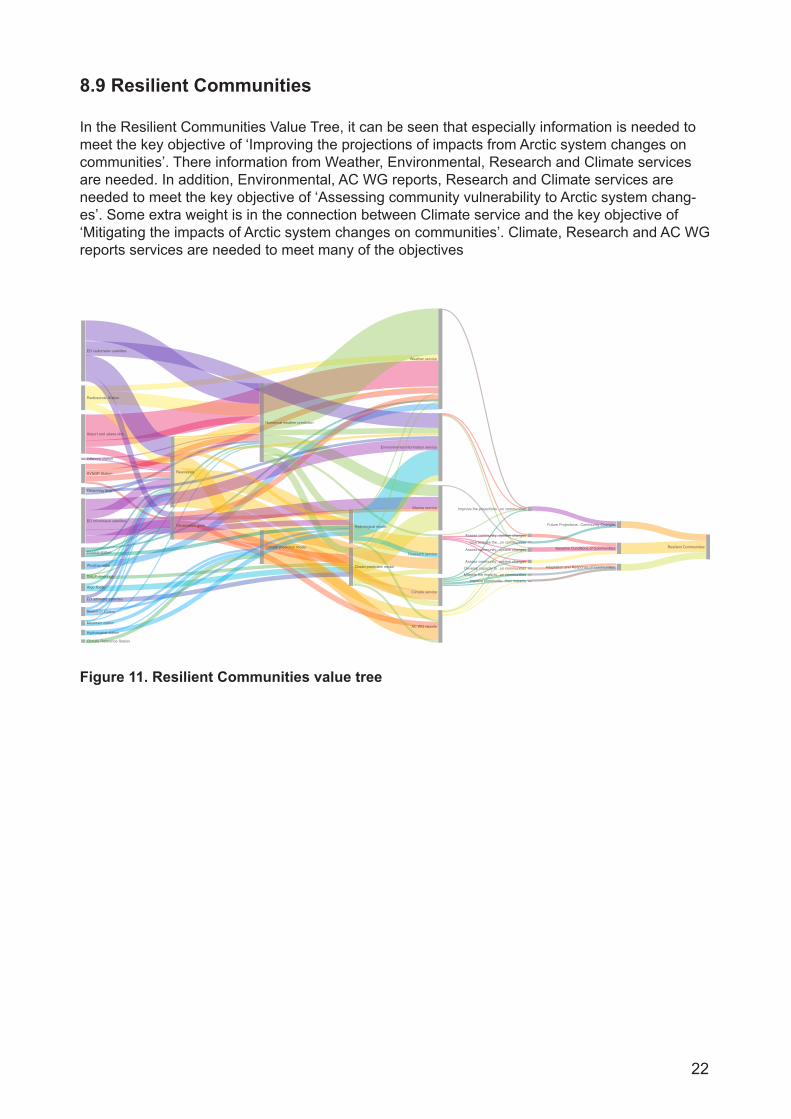
8.9 Resilient Communities
In the Resilient Communities Value Tree, it can be seen that especially information is needed to meet the key objective of ‘Improving the projections of impacts from Arctic system changes on communities’. There information from Weather, Environmental, Research and Climate services are needed. In addition, Environmental, AC WG reports, Research and Climate services are needed to meet the key objective of ‘Assessing community vulnerability to Arctic system chang-es’. Some extra weight is in the connection between Climate service and the key objective of ‘Mitigating the impacts of Arctic system changes on communities’. Climate, Research and AC WG reports services are needed to meet many of the objectives
Figure 11. Resilient Communities value tree
23
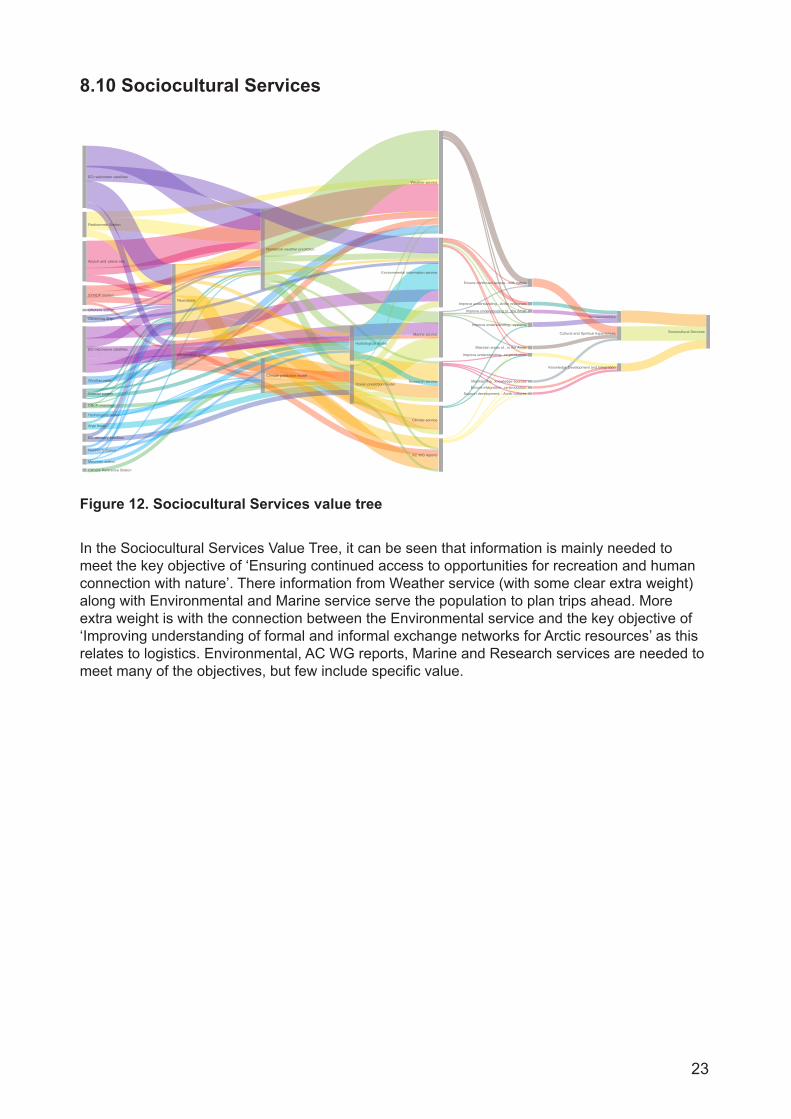
8.10 Sociocultural Services
In the Sociocultural Services Value Tree, it can be seen that information is mainly needed to meet the key objective of ‘Ensuring continued access to opportunities for recreation and human connection with nature’. There information from Weather service (with some clear extra weight) along with Environmental and Marine service serve the population to plan trips ahead. More extra weight is with the connection between the Environmental service and the key objective of ‘Improving understanding of formal and informal exchange networks for Arctic resources’ as this relates to logistics. Environmental, AC WG reports, Marine and Research services are needed to meet many of the objectives, but few include specific value.
Figure 12. Sociocultural Services value tree
24
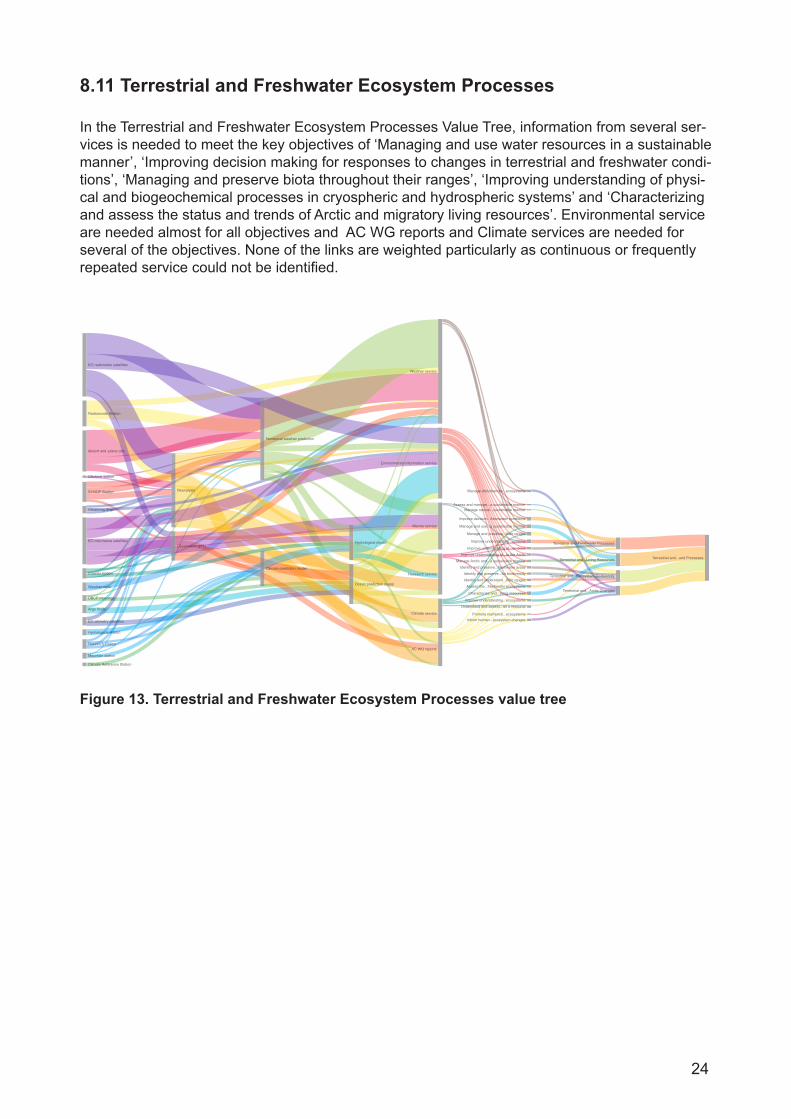
8.11 Terrestrial and Freshwater Ecosystem Processes
In the Terrestrial and Freshwater Ecosystem Processes Value Tree, information from several ser-vices is needed to meet the key objectives of ‘Managing and use water resources in a sustainable manner’, ‘Improving decision making for responses to changes in terrestrial and freshwater condi-tions’, ‘Managing and preserve biota throughout their ranges’, ‘Improving understanding of physi-cal and biogeochemical processes in cryospheric and hydrospheric systems’ and ‘Characterizing and assess the status and trends of Arctic and migratory living resources’. Environmental service are needed almost for all objectives and AC WG reports and Climate services are needed for several of the objectives. None of the links are weighted particularly as continuous or frequently repeated service could not be identified.
Figure 13. Terrestrial and Freshwater Ecosystem Processes value tree
25
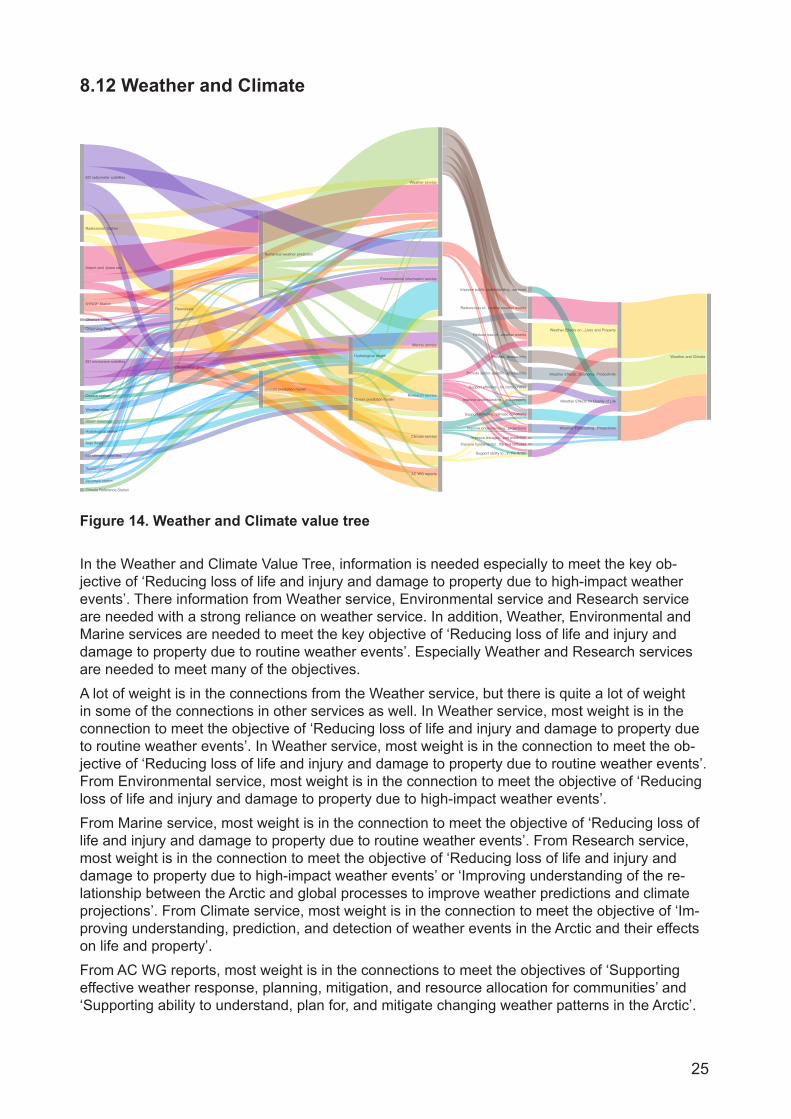
Figure 14. Weather and Climate value tree
In the Weather and Climate Value Tree, information is needed especially to meet the key ob-jective of ‘Reducing loss of life and injury and damage to property due to high-impact weather events’. There information from Weather service, Environmental service and Research service are needed with a strong reliance on weather service. In addition, Weather, Environmental and Marine services are needed to meet the key objective of ‘Reducing loss of life and injury and damage to property due to routine weather events’. Especially Weather and Research services are needed to meet many of the objectives. A lot of weight is in the connections from the Weather service, but there is quite a lot of weight in some of the connections in other services as well. In Weather service, most weight is in the connection to meet the objective of ‘Reducing loss of life and injury and damage to property due to routine weather events’. In Weather service, most weight is in the connection to meet the ob-jective of ‘Reducing loss of life and injury and damage to property due to routine weather events’. From Environmental service, most weight is in the connection to meet the objective of ‘Reducing loss of life and injury and damage to property due to high-impact weather events’. From Marine service, most weight is in the connection to meet the objective of ‘Reducing loss of life and injury and damage to property due to routine weather events’. From Research service, most weight is in the connection to meet the objective of ‘Reducing loss of life and injury and damage to property due to high-impact weather events’ or ‘Improving understanding of the re-lationship between the Arctic and global processes to improve weather predictions and climate projections’. From Climate service, most weight is in the connection to meet the objective of ‘Im-proving understanding, prediction, and detection of weather events in the Arctic and their effects on life and property’. From AC WG reports, most weight is in the connections to meet the objectives of ‘Supporting effective weather response, planning, mitigation, and resource allocation for communities’ and ‘Supporting ability to understand, plan for, and mitigate changing weather patterns in the Arctic’.
8.12 Weather and Climate
26
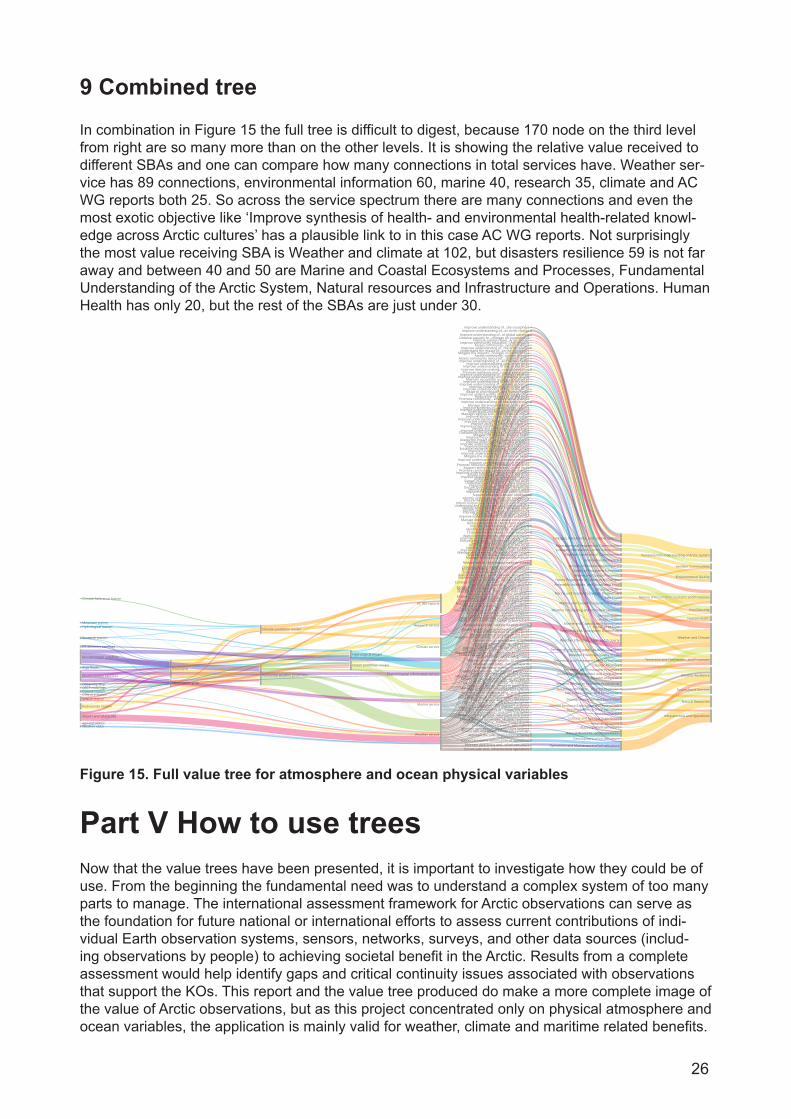
9 Combined treeIn combination in Figure 15 the full tree is difficult to digest, because 170 node on the third level from right are so many more than on the other levels. It is showing the relative value received to different SBAs and one can compare how many connections in total services have. Weather ser-vice has 89 connections, environmental information 60, marine 40, research 35, climate and AC WG reports both 25. So across the service spectrum there are many connections and even the most exotic objective like ‘Improve synthesis of health- and environmental health-related knowl-edge across Arctic cultures’ has a plausible link to in this case AC WG reports. Not surprisingly the most value receiving SBA is Weather and climate at 102, but disasters resilience 59 is not far away and between 40 and 50 are Marine and Coastal Ecosystems and Processes, Fundamental Understanding of the Arctic System, Natural resources and Infrastructure and Operations. Human Health has only 20, but the rest of the SBAs are just under 30.
SYNOP Station
Radiosonde Station
Airport and -plane obs
Coastal stationOffshore station
Observing Ship
Weather radar
Mountain station
Argo floats
DBCP moorings
Numerical weather prediction
Ocean prediction modelReanalysis
Climate prediction model
Observation grids
Weather service
Marine service
Environmental information service
AC WG reports
Research service
Climate service
EO microwave satellites
EO radiometer satellites
EO altimetry satellites
Research station
Hydrological station
Hydrological model
Climate Reference Station
Disaster ResilienceDisaster Mitigation
Disaster Protection and Prevention
Disaster Recovery
Disaster Response
Hazard Identification...Disaster Prediction
Apply common indices...mitigation activities
Develop education,...disaster mitigation
Ensure access to...environmental intelligence
Inform infrastructure...disaster mitigation
Apply common indices...disaster preparedness
Conduct risk...preparedness activities
Deploy emergency responder...to a disaster
Develop and execute...for disaster prevention
Improve emergency...human-made hazards
Improve emergency...natural hazards
Conduct damage assessments...disaster recovery
Improve future...preparedness activities
Inform social,...post-disaster recovery
Support disaster aid planning and deployment
Conduct disaster...cost-effective manner
Conduct search and...and effective manner
Deploy emergency responder...after a disaster
Ensure domain awareness...disaster response
Develop and maintain...and disaster prediction
Ensure domain awareness for...of all hazards
Improve understanding of...disaster prediction
Environmental Quality
Drivers of Environmental Impacts
Environmental Impacts
Quality of Ecosystem Functions
Improve ability to...their consequences
Improve understanding...environmental quality
Manage regional and...environmental impact
Reduce the sources of...in the ArcticAdapt to and mitigate...and human health
Improve understanding of...and human health
Manage the environmental...in the Arctic
Mitigate the impacts of...and human health
Understand the impact of...on the cryosphere
Ensure the availability...ecosystem function
Improve understanding and...in the ArcticImprove understanding of the...in the Arctic
Maintain ecosystem quality,...and services
Food Security
Accessible, Available, and Sustainable Food
Exchange of Food
Safe Food
Ensure continued access to...in the ArcticImprove stewardship of...sustainable manner
Improve understanding of...of food resources
Improve understanding of...food supply chain
Improve understanding of the...in the ArcticImprove understanding of...food supply chain
Understand and coordinate...of food
Ensure continued operation...for food exchange
Improve understanding of...its currency value
Understand and coordinate...and overabundance
Ensure food supplies...pollutant thresholds
Ensure the safety...environmental conditions
Improve the quality of...and safety of food
Improve understanding of the...in the Arctic
Improve understanding of...Arctic populationsUnderstand and coordinate...food safety
Enhance resilience to changes...access to food
Agrimet station
Fundamental understanding of Arctic systemLinkages, Interactions,...Arctic Subsystems
Linkages, Interactions, and...Global Systems
Improve ability to scale...the Arctic system
Improve systems-level...Arctic system
Improve understanding of...the cryosphereImprove understanding of...on Arctic change
Improve understanding of...of global warming
Improve understanding of...the Arctic system
Improve understanding of...the Arctic system
Improve understanding of...oceanic processes
Human HealthMental Health
Physical Health
Public Health
Improve understanding of...of Arctic residents
Improve understanding of...mental health
Mitigate the impacts...mental health
Promote community,...environmental changes
Improve understanding of...of Arctic residents
Improve understanding of...physical health
Mitigate the impacts...physical health
Promote community,...environmental changes
Ensure access to...health promotion services
Improve access to...sanitation infrastructure
Improve early warning...health emergencies
Improve synthesis of...across Arctic cultures
Improve understanding of...and strategies
Improve understanding of...in the Arctic
Reduce presence of...Arctic food supplies
Infrastructure and Operations
Planning of Infrastructure
Development of Infrastructure
Operations and Maintenance of Infrastructure
Decommissioning of Infrastructure
Ensure safe and secure infrastructure design
Improve understanding of...and society
Support infrastructure design siting
Ensure compliance...environmental regulations
Inform and support...and control activities
Ensure safe and...infrastructure operations
Improve understanding...operations
Maintain awareness and...of infrastructure
Maintain operational...infrastructure systems
Support economic optimization of operations
Dispose of infrastructure...be re-utilized
Identify opportunities for...system assets
Improve understanding of...and the environment
Inform decisions...infrastructure systems
Marine and Coastal Ecosystems and ProcessesMarine and Coastal Ecosystem Biodiversity
Marine and Coastal Ecosystem Changes
Marine and Coastal Living Resources
Marine and Coastal Processes
Identify and preserve...and coastal areas
Identify and preserve...areas for biodiversity
Identify and understand...their ranges
Manage and preserve...throughout their ranges
Promote resilience and...coastal ecosystems
Improve understanding of...coastal ecosystems
Improve understanding of...in the Arctic
Inform human adaptation to ecosystem changes
Manage disturbances to...coastal ecosystems
Characterize and assess...living resources
Manage Arctic and...a sustainable manner
Sustain marine bioprospecting in the Arctic
Assess the impact of...and coastal ecosystems
Improve decision making...coastal conditions
Improve understanding of...their interactions
Natural ResourcesNatural Resource Exploration and Assessment
Natural Resource...and Exploitation
Natural Resource...and Reclamation
Assess and reduce...resource exploration
Improve understanding of...and environment
Improve understanding of...natural resources
Manage inventories of...a sustainable manner
Assess, manage, and...and exploitationEnsure regulatory...development activities
Maintain the safe...exploitation activities
Support natural...development decisions
Understand and project...situational awareness
Assess long-term risks...decommissioned sites
Ensure effectiveness of...in the Arctic
Ensure regulatory...decommissioning activities
Inform the development...decommissioning plans
Resilient Communities
Adaptation and Response of Communities
Baseline Conditions of Communities
Future Projections of Community Changes
Develop capacity to...changes on communitiesImprove community education...their impacts
Mitigate the impacts...changes on communitiesAssess community resources...system changes
Assess community...system changes
Assess community...system changes
Characterize the magnitudes...on communitiesImprove the projections...on communities
Sociocultural Services
Cultural and Spiritual Experiences
Knowledge Development and Integration
Socioeconomics
Ensure continued access...with nature
Maintain areas of cultural...in the Arctic
Maintain the vitality...knowledge sources
Ensure integration...knowledge co-production
Improve understanding...co-production
Support development,...Arctic cultures
Improve understanding of...Arctic resources
Improve understanding of...impact the Arctic
Improve understanding...socioeconomic systems
Terrestrial and Freshwater...and Processes
Terrestrial and...Ecosystem Biodiversity
Terrestrial and Freshwater...to Arctic Changes
Terrestrial and Freshwater Living Resources
Terrestrial and Freshwater Processes
Identify and preserve...and freshwater areasIdentify and preserve...areas for biodiversity
Identify and understand the...their ranges
Manage and preserve...throughout their ranges
Promote resilience and...freshwater ecosystems
Improve understanding...freshwater ecosystems
Improve understanding of...in the Arctic
Manage disturbances to...freshwater ecosystems
Assess and manage land...a sustainable manner
Manage and use water...in a sustainable manner
Manage natural resources...sustainable manner
Understand and assess the...as a resource
Assess the impact...and freshwater ecosystems
Improve decision...freshwater conditions
Improve understanding...hydrospheric systems
Improve understanding of the...cycle on biota
Weather and Climate
Weather Effects on Economic Productivity
Weather Effects on...Lives and Property
Weather Effects on Quality of Life
Weather Forecasting and Climate Projections
Provide community-specific...productivity
Provide sector-specific...productivity
Improve understanding,...and property
Reduce loss of...high-impact weather events
Reduce loss of life...routine weather events
Improve public understanding...and services
Support ability to understand,...in the Arctic
Support effective weather...for communities
Improve understanding of...climate projections
Improve linkages between...and predictionImprove fundamental...the mid-latitudes
Support effective...climatic conditions
Figure 15. Full value tree for atmosphere and ocean physical variables
Part V How to use treesNow that the value trees have been presented, it is important to investigate how they could be of use. From the beginning the fundamental need was to understand a complex system of too many parts to manage. The international assessment framework for Arctic observations can serve as the foundation for future national or international efforts to assess current contributions of indi-vidual Earth observation systems, sensors, networks, surveys, and other data sources (includ-ing observations by people) to achieving societal benefit in the Arctic. Results from a complete assessment would help identify gaps and critical continuity issues associated with observations that support the KOs. This report and the value tree produced do make a more complete image of the value of Arctic observations, but as this project concentrated only on physical atmosphere and ocean variables, the application is mainly valid for weather, climate and maritime related benefits.
27
The assessment framework was intended to support two objectives identified in the 2016 Arctic Observing Summit (shortened): Propose to the highest levels of government, the business case for a comprehensive pan-Arctic observing system. This proposal should assess the costs and demonstrate the benefits for soci-ety at various levelsPrioritize, on an ongoing basis, observations that should be started and maintained over the long-term by operational and other relevant agencies.This is however the top-down view of what a value tree could help to analyze. The bottom-up perspective is equally compelling. It is very useful for operators of EO inputs to have a more com-plete understanding of how their data is valuable. This exercise is only giving a general view, as the EO inputs are pooled together in categories and not resolved individually, but still this tree is highlighting how an observation is becoming valuable and where.
10 Station managersIt is usually the station managers that have to do most work for motivating financing to the in-frastructure that they are running. By having a more complete picture of where the information produced is valuable, the station managers can broaden their support for proposals and also write a more compelling story of what their observation is good for. The topics and political ter-minology used in the key objectives is not discussed in planning and implementing observation infrastructure across all its benefits. Usually the station holder represents one domain only and there is genuine lack of knowing about larger interest for similar observations. It might not even need a different setup, just a new distribution to have more impact on society. Nowadays data is open and freely available on the internet, the connection from producers to users can stay hidden in internet traffic statistics. Only then observations are missing the users tend to react and cry for support. This might be too late to rescue a station that has been decided to be terminated. The value trees should help station managers generally understand better in which modeling and services their data ends up in. A more detailed investigation is then useful to find concretely users and supporters to improve observation operations and funding.The viewing tool by FMI and Spatineo (2019) has a feature then choosing an EO input, all paths towards key objectives will be highlighted with the relative weight of the input value distributed across the objectives. This will show where the value that is invested in the input is distributed in the tree. In a way one could turn it around and say that these objectives should pay according amounts to arrange the observations. If all SBAs would have the corresponding ministries iden-tified, operators would concretely understand from which ministries how much of their funding should come from.
11 Policy-makers This main target group should understand now, how complex the value chains for earth obser-vation information are and that investments should be made accordingly in a more holistic way. There is little use in only funding to research to establish new observation stations for projects limited to a few years of operation. The potential for use in modeling and operational services should be evaluated as this chain of use will help to stabilize the funding for a longer term. On the other hand it should become clear that benefit to society come from services made from obser-vation, so the investment should look more into a full chain, not just the satellite mission or a new station for scientific questions. To really reap benefit, a value chain needs to be established and this needs investments in several actions.
28
To aid policy-makers the viewing tool has a feature there choosing a key objective all inputs with the relatively weighted value will be highlighted. This could show how one would need to be spreading out investments into different components of the Observation system to achieve prog-ress for a full SBA or one of its subcomponents. As a practical application it could also show how project consortia should have partners to be able to form a value chain and tree for a societal benefit area.For comparing the costs for the current Arctic Observing system the viewing tool has also a source tree for the observing system between 30°N and 60°N, which represents an area of highly developed and population rich Earth. The costs for the observing system is for EO inputs over 810 m€/year compared to the 177,6 for the Arctic about a fifth. Modelling efforts are considerably more common for populated areas, but these could not be investigated further. The comparison tree is passing on the value according to the same linking as for the Arctic observations system source tree. The comparison would suggest that doubling the current efforts would be a suitable goal then a warming climate will increase human presence in the Arctic.
Part VI Next stepsThis work had to be done in haste, so there was not sufficient time to find out about some of the estimations needed for weighting the value in the tree. Especially finding out about operational modeling was challenging, because internet searching is often not returning more than meeting or project reports. These research gatherings are usually referring to well over 10 teams, but check-ing on the web if output would be available reveals very few concrete results. Another problem is the close relationship between climate, ocean and weather modeling. Climate modeling related sea-ice components are not necessarily relevant for the ocean prediction part. To find out about these details follow-up actions would definitely improve the weighting exercise. One can still use the current tree, as errors are surely below one magnitude of value. For more detailed findings, more precision would make a more convincing case. Also as indicated already above, the values discussed here, are the observing system costs. A deep analysis is necessary in order to eval-uate all benefits and economic activity or even payment-based service provision that observing system and related services can generate in/for the different SBAs.An interesting next step is to expand the thematic area of Arctic observations. This project could be performed in a very efficient manner, because the WMO has so many informations easily available on the web, physical variable observations for atmosphere and ocean have a long history, the operators are well established and collaboration is the norm. For other observation networks more work is needed to identify stations, estimate costs, identify the products/outcomes/services components and link it all together. Atmospheric composition and hydrology related data would seem almost as efficient to add as the components in this project, so this could be next. Biodiversity and pollution are topics that seem very important as the Arctic is changing and impacts can be felt already. Another direction that needs to be explored on a longer time horizon is to build the value tree au-tomatically from internet resources, publish data better and taking better care of crediting all the inputs for products downstream of a value chain. Currently metadata on this is sparsely available and not in a consistent manner. Open Geospatial Consortium standards are in some cases de-manding for simple data providers to fulfill. As an initial steps simpler data publishing that includes the recognition of data used. The Spatio Temporal Asset Catalogue as in the web page by GitHub (2019) could be developed for this and allow a value tree to be connected automatically by going through all catalogue to catalogue links for recognition.A full tree with more details should be the ultimate aim and it is with the tools developed here not too much for motivated people to do and code for more automation. The Arctic Council working groups would be logical entities to pick up the leadership for observation components in their domain to continue this work.
29
ThanksThe writers want to thank the Finnish Meteorological Institute experts running in Finland the observation network and helping to estimate general station costs for the many different stations categorized in WMO OSCAR: Minna Huuskonen for SYNOP and coastal stations, Anne Hirsikko for Weather radars, Anu Lång for airport station costs and Timo Laine for Radiosonde Stations.Further thanks go to the other project team members that could not participate in the workshop: Sandy Starkweather (best of strengths for your recovery; USA), Thorsteinn Gunnarsson (IS), Ketil Isaksen(NO), Ulf Jonsell(SE), Martin Stendel(DK), Aleksander Makshtas and Igor Ashik(RU).Big thanks go to Anita Koivuselkä for getting very effectively the formalities settled for this fill-in project to receive IBA-funding and make this report possible.Final thanks go to the coder behind the value tree tool, Sampo Savolainen from Spatineo Oy. Fast and responsive actions on feedback sometimes even in the evening or on weekends made a tremendous impact. Without our web tool’s efficiency this timetable wouldn’t have been sufficient.
References
FMI and Spatineo (2019). Value trees. Retrieved from http://arctic-obs.fmi.fi/
SAON. (2019). SAON sustaining arctic observing networks. Retrieved from https://www.arcticob-serving.org/
AMAP. (2019). AMAP. Retrieved from https://www.amap.no/
Arctic observations assessment framework. (2017). SAON news: The International Arctic Obser-vations Assessment Framework released. Retrieved from https://www.arcticobserving.org/news/268-international-arctic-observations-assessment-framework-released
IDA STPI. (2019). IDA science and technology policy institute. Retrieved from https://www.ida.org/STPI
Ministry for Foreign Affairs of Finland. (2019). Ministry for Foreign Affairs of Finland. Retrieved from https://um.fi/frontpage
iCUPE. (2019). iCUPE Interactive and Comprehensive Understanding on Polar Environments. Retrieved from https://www.atm.helsinki.fi/icupe/
ERA-Planet. (2018). The European network for observing our changing planet. Retrieved from http://www.era-planet.eu/
Spatineo. (2019). Spatineo. Retrieved from https://www.spatineo.com/
IDA STPI and SAON. 2017. International Arctic Observations Assessment Framework . IDA Science and Technology Policy Institute, Washington, DC, U.S.A., and Sustaining Arctic Observing Networks, Oslo, Norway, 73 pp. Retrieved from https://www.arcticobserving.org/images/pdf/misc/STPI-SAON-International-Arctic-Observations-Framework-Report-2017.pdf
30
Value tree analysis theory. (2002). Retrieved from http://mcda.aalto.fi/value_tree/theory/theory.pdf
Sankey diagrams. (2018). Retrieved from https://en.wikipedia.org/wiki/Sankey_diagram
Interreg Central Europe. (n.d.). What is the project intervention logic and why is it an important starting point? Retrieved from http://www.interreg-central.eu/Content.Node/faq/pd/What_is_the_project_intervention_logic_and_why_is_it_an_i.html
Joint Research Centre (European Commission) and Dobricic et al. (2018). IMBORAR-Study. Re-trieved from https://publications.europa.eu/en/publication-detail/-/publication/1196aad5-d737-11e8-9424-01aa75ed71a1/language-en
WMO Oscar. (2019). OSCAR Observing Systems Capability Analysis and Review Tool. Re-trieved from https://www.wmo-sat.info/oscar/
OSCAR. (2019). OSCAR Observing Systems Capability Analysis and Review Tool. Welcome to OSCAR/Surface. Retrieved from https://oscar.wmo.int/surface
GRDC. (2018). Arctic Runoff Database: A basic network of monitoring the Arctic Hydrological Cycle (work in progress). Retrieved from https://www.bafg.de/GRDC/EN/04_spcldtbss/41_ARDB/ArcticHYCOSData.html?nn=201698
ECMWF. (2019a). Ted-tenders electronic daily: Services-326109-2016: C3S_34b. Retrieved from C3S_34b https://ted.europa.eu/udl?uri=TED%3ANOTICE%3A326109-2016%3ATEX-T%3AEN%3AHTML
CliC. (n.d.). CliC: Climate and Cryosphere: Understanding the changing cryosphere and its climate connections, Arctic CORDEX. Retrieved from http://www.climate-cryosphere.org/activities/targeted/polar-cordex/arctic
WMO Hydrohub. (2019). WMO HydroHub: Enhancing water monitoring systems worldwide. Retrieved from https://hydrohub.wmo.int/en/home
GRDC. (2019). GRDC: Welcome to the Global Runoff Data Centre. Retrieved from https://www.bafg.de/GRDC/EN/Home/homepage_node.html
WHYCOS. (2014). Arctic-HYCOS Draft Website. Retrieved from http://arctic-hycos.net/
Mercator Ocean. (2019). Ted-tenders electronic daily: Services-366769-2017: 69-CMEMS-MFC-ARCTIC. Retrieved from https://ted.europa.eu/TED/notice/udl?uri=TED:NO-TICE:366769-2017:TEXT:EN:HTML
ECMWF. (2019b). Ted-tenders electronic daily: Services-385751-2016: C3S_322. Retrieved from https://ted.europa.eu/TED/notice/udl?uri=TED%3ANOTICE%3A385751-2016%3A-TEXT%3AEN%3AHTML
NOAA. (2014). Predicting Arctic Weather and Climate and Related Impacts, Status and Re-quirements for Progress, Findings from the NOAA Science Challenge Workshop. Retrieved from https://www.esrl.noaa.gov/psd/events/2014/arctic-prediction-science/pdf/arctic-predic-tion-workshop-report.v1.pdf

31
Leviäkangas et al. (2009) Benefits and value of meteorological information services: The case of Finnish Meteorological Institute. Meteorological Applications, 16(3), 369-379. https://doi.org/10.1002/met.135. Retrieved from https://cris.vtt.fi/en/publications/benefits-and-val-ue-of-meteorological-information-services-the-cas
GitHub. (2019). SpatioTemporal Asset Catalog.Retrieved from https://github.com/radiantearth/stac-spec

FINNISH METEOROLOGICAL INSTITUTE
Erik Palménin aukio 1
P.O. Box 503
FI-00560 HELSINKI
tel. +358 29 539 1000
WWW.FMI.FI
FINNISH METEOROLOGICAL INSTITUTE
RAPORTTEJA - RAPPORTER - REPORTS 2019:3
ISSN 0782-6079
ISBN 978-952-336-072-3 (pdf)
Helsinki 2019