value stream transformationdirect and indirect) kaizen six sigma value stream mapping process...
TRANSCRIPT

Value Stream Transformation
1
From the shop floor to the board room
Chris BeaulieuExecutive Director – CBS Global Operations


UNDERSTANDS POWER — PA S T, P R E S E N T A N D F U T U R E .
CUMMINS
100 years serving
customers
1M+ engines annually
produced
15Mengines in the
field

6
Global
Network
190Countries & territories
600Distributor locations
56,000Employees
7,200Dealer locations
Shaded locations indicate CMI and JV territory

The COS 10 Practices
1. Put the
customer first
and provide real
value
2. Synchronize
flows (material,
physical and
information)
3. Design quality
in every step of
the process
4. Involve people
and promote
teamwork
5. Ensure equipment
and tools are available
and capable
7. Establish the
right
environment
6. Create
functional
excellence
8. Treat preferred
suppliers as
partners
9. Follow common
problem solving
techniques
10. Use Six Sigma
as the primary process
improvement method
7

31 Key Processes under COS
8

Bringing COS Alive in CBS
Plant leadership
led training
Operational Excellence
Standard Work
of Operations
Excellence
Training
material QSI
docs
Assessments of 31
Key Processes
Cummins Operating SystemPrinciples and Behaviours
Definitions of
Key
Processes,
training
material and
QSI docs
Put the Customer First and Provide Real Value
Synchronize Flows (Material, Physical and Information)
Customer Visibilityand Measures
Involve People and Promote Teamwork
People Involvement
Ensure Equipment and Tools are Available
and Capable
Create Functional Excellence
Establish the Right Environment
Treat Preferred Suppliers as Partners
Follow Common Problem Solving Techniques
Six SigmaDesign Quality in Every
Step of the Process
Quality System Crisis ManagementFunctional Excellence
StructureContinuous
Improvement CultureSupplier Improvement
(Direct and Indirect)Kaizen Six Sigma
Value Stream Mapping
Supplier QualityProcess Control
Bottleneck Management
Takt Time and Line Balancing
Scheduling and Load Leveling
Engineered Material Flows/Plan for Every Part
Team Measures Equipment Maintenance
Setup Reduction
Process Capability
Standard Woorking Methods
Workforce Capability and Flexibility
Goal Tree and Performance Measures
"Go, See, Act" Management
Communication
Health, Safety and Environmental Management
5S (Sort, Set in Order, Shine, Standardize, Sustain)
Visual Management
Supply Chain Management (Direct and Indirect)
Process Change Management
Problem Solving Techniques
1 2 4 5 6 7 8 9 103
10 COS PRACTICES
31 O.E. KEY PROCESSES
F.E. ACCOUNTABILITY
Customer Visibilityand Measures
Value Stream Mapping
Bottleneck Management
Takt Time and Line Balancing
Scheduling and Load Leveling
Engineered Material Flows/Plan for Every Part
Quality System
Process Change Management
Process Control
People Involvement
Team Measures
Crisis Management
Equipment Maintenance
Setup Reduction Process Capability
Functional Excellence Structure
Standard Woorking Methods
Workforce Capability and Flexibility
Continuous Improvement Culture
Goal Tree and Performance Measures
"Go, See, Act" Management
Communication
Health, Safety and Environmental Management
5S (Sort, Set in Order, Shine, Standardize, Sustain)
Supplier Improvement (Direct and Indirect)
Supply Chain Management (Direct and Indirect)
Supplier QualityKaizen
Problem Solving Techniques
Six Sigma
Visual Management

Value Stream Transformation
Value Stream:
A collection of all the process steps involved in bringing a service from initiation to completion, raw information etc. to finished process(es) to serve our customers.
Value Stream Transformation (VST):
Value Stream Transformation (VST) – a systematic approach to achieve sustainable improvements in People, Quality, Delivery and Cost whilst developing a continuous improvement culture within our Business .
Value Stream Transformation is an enabling process within Operations Excellence
A preferred Cummins Continuous Improvement methodology

5 Steps – high level overview
Define the Value
Streams
Capture the
Current State
Design the
future State
Create
implementation plan
Implement &
Sustain
Products (goods or services)
with common process steps
The basis for the future
state; 70 – 80% accurate is
OK (directionally correct)
Creating flow through the
elimination of waste found
in your current state map
Your RACI with ownership
and timeframes –
Simulation models
This is THE goal of mapping
D
M
A
I
C

Value Stream Transformation (VST)
Supply Chain vs. Silo Visualize Current State
Common Mindset
Identify OpportunitiesDevelop Future State
Multi-Round VST Improvement
Quick Win/Systematic/Deep
12

Cummins VST – Operations
VST launched in 2013 (2016 VST standardized & became a 6S methodology)
Trained over 450 people(over 1000 engaged - extended team members)
Utilized in Supply chain / Plants and non-manufacturing
locations
Closed 161 VST projects in 2017.
13Public

14Public
CBS by the Numbers
20 yrs.
9,175servers
1,080sites
supported
94,128WWIDs supported
9.9 PB storage
(Petabytes)
1,000+employees
27countries
9Regional
Centers
4Service
Lines
59,744CGDs
(7 models)
7.3M+payment invoices100,000+
travel reservations
24,000+
lines of GL
1,242 intercompany
disputed items
32,000 +accounts
reconciled
52,000variable
comp payments3,191
immigration
initiations
5,000people
onboarded
32,915pension
distributions
51,000+contact
calls
1,099education
assistances
2,145surveys
427translation
requests
1,388,500survey
responses
2017 data

Framework for Deployment
• 6S Charter created and approved
• Quality, Delivery & Cost improvements defined
• Project PrioritizedPrepare
• 3 Day in region training delivered by OE team / building regional capability
• 4 Projects per Wave
• Min 20 people to be trained per wave
• Current State Map created
• Opportunities documented and ranked
• RACI created
Build Capability
• 90 day delivery plan
• Weekly Stakeholder reviews to share progress and remove roadblocks
• Monthly metric pack to track improvement to our results (Quality , Delivery & Cost)Deliver and Support
15Public

16
Project CharterObjective:
Increase production rate from 159 per day to 180 per day
without affecting product quality
Benefits:
Improved on time delivery, Reduced risk of losing business,
reduced special transport costs, reduced inspection costs,
reduced supplier management costs

Value stream mapping The process was walked to understand all steps and activities.
An initial waste walk was conducted to capture non value added activities
The current state value stream map was created during the training
workshop
17Public
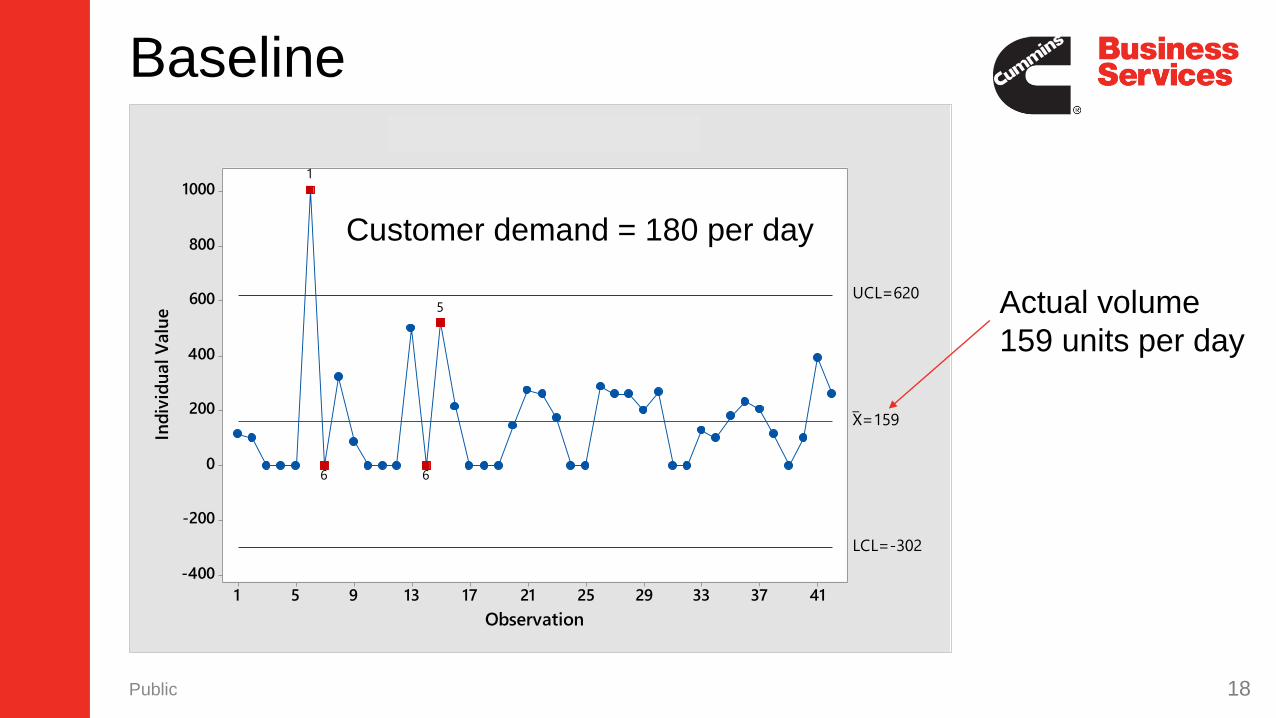
Baseline
18Public
4137332925211713951
1000
800
600
400
200
0
-200
-400
Observation
Ind
ivid
ual V
alu
e
_X=159
UCL=620
LCL=-302
5
66
1
I Chart of Diffuser_Volume
Customer demand = 180 per day
Actual volume
159 units per day

Key X’s identified
X1 - 5s required across all processes
X2 - Workload balancing required to achieve target time
X3 - Workflow sequencing required
X4 - Standard work implementation required
X5 - Hourly production monitoring required
19Public

Improvement Final capability chart
20
Production volume
increased from 159 to
255 parts per day(using same amount of resource in
the same amount of time)
TransitionBaseline
1000
800
600
400
200
0
Diff_Vol_Stage
Dif
fuse
r_V
olu
me
Boxplot of Diffuser_Volume
Target improvement 13%. Actual achieved 60%

First VST Project in CBS
21
Y :Increase invoice Paid On Time % for direct materials suppliers,
without impacting headcount.
Results• Improved paid on time by 25%
• Worst case lead time reduced from 140
days to 50 days (SLA is 60 days)
• Team won Silver Shooting Star
recognition award

22
CBS – VST Global Roll-out
Latin America
11th Oct 2016
4 projects Launched
North America 2 Waves complete
7 Projects launched
Africa2 May 2017
4 Projects Launched
Europe5 Waves complete
South Pac & SE Asia10 July 2017
4 projects launched
India19 Sept 16
4 Projects Launched
China & NE Asia
1 Aug 16
4 Projects Launched

Value StreamTransformation
Launched 41 projects and closed 25
3 Global Impact awards in 2017 projects
15% of CBS trained on VST1 2
3 4 Delivered People , Quality , Delivery and Cost improvements

24
QuestionsThank you