value relevance of the fair value hierarchy of ifrs … · the fair value measurement of –nancial...
TRANSCRIPT

WO
RK
ING
PA
PE
RS
SE
S
F A C U L T É D E S S C I E N C E S E C O N O M I Q U E S E T S O C I A L E S
W I R T S C H A F T S - U N D S O Z I A L W I S S E N S C H A F T L I C H E F A K U L T Ä T
U N I V E R S I T É D E F R I B O U R G | U N I V E R S I T Ä T F R E I B U R G
12.2012N° 439
Value Relevance of the Fair Value Hierarchy of IFRS 7 in Europe - How reliable are mark-to-model Fair Values?
Patrick Bosch

Value Relevance of the Fair Value Hierarchy of IFRS 7 in
Europe —How reliable are mark-to-model Fair Values?
Patrick Bosch∗
Abstract
According to IFRS 7, banks have to disclose the inputs used in measuring the fair value
of financial instruments. For this purpose the standard defines a three-level measurement
hierarchy. The reliability of fair values is expected to decrease with decreasing hierarchy
level due to the lower quality of the input factors. Using a value relevance research setting, I
find that investors perceive the reliability of level 3 fair values as significantly lower than the
reliability of level 1 fair values. However, in contrast to expectations, level 2 fair values are
not perceived as less reliable. Thus, investors only doubt the reliability of fair values whose
inputs are based on discretionary assumptions. Additionally, this paper analyses the impact
of the reclassification of financial assets and of the regulatory capital ratio on the reliability
of fair values. While I find a weakly significant impact of the regulatory capital ratio, the
reclassification has in general no influence on the reliability of reported fair values.
Keywords: Fair Value Hierarchy, Reclassification, Reliability, Value Relevance
JEL Classification: C23, G14, G21, M41
∗Patrick Bosch, Chair of Finance and Accounting, University of Fribourg / Switzerland, Bd. de Pérolles 90,CH-1700 Fribourg, Tel.: +41 26 300 8289, Fax: +41 26 300 9659, Email: [email protected].
1

1 Introduction 2
1 Introduction
Fair value accounting has been one of the most controversial issues in financial reporting over
the last 20 years. Proponents argue that full fair value accounting (FFVA) improves market
discipline and reveals risks from maturity transformation and changes in credit risks earlier
than historic cost accounting. Thus, it can reduce the procyclicality of the financial system.
Opponents, on the other hand, argue that FFVA increases earnings and equity volatility, reduces
the resilience of financial institutions against financial shocks, and lacks reliability when markets
are inactive and valuation models have to be used to measure fair values (e.g. Enria et al. (2004)).
Nevertheless, the International Accounting Standards Board (IASB) continually expanded the
application of fair values in IFRS.1
During the financial crisis, the debate about fair value accounting, especially for financial in-
struments, gained momentum (see for a broad discussion Laux and Leuz (2009)). Fair value
accounting was again criticized for being unreliable. The reliability of fair values has been widely
discussed before in the value relevance research (e.g. Barth (1994), Barth et al. (1996), Nelson
(1996)). This research can be seen as an instrument to operationalize IASB’s most important
qualitative characteristics of decision useful accounting information, relevance and reliability
(Barth et al. (2001)).2 While fair values undoubtedly possess relevance for economic decision
making, a lack of reliability can diminish the value relevance of fair values significantly. A
vast majority of value relevance studies finds evidence that fair values are overall value relevant
and have incremental explanatory power in comparison to historic cost measures. Nonetheless,
several studies show that fair values of illiquid financial instruments are significantly less value
relevant than fair values of liquid financial instruments (e.g. Petroni and Wahlen (1995), Ec-
cher et al. (1996)). Accordingly, illiquid financial instruments are perceived as less reliable by
investors. Since market illiquidity was one of the major problems during the subprime crisis,
this supports the current criticism of fair value accounting for financial instruments.
1 Some observes even supposed that the IASB was following a hidden agenda to introduce FFVA. See e.g.Whittington (2008).
2 In the new Conceptual Framework the IASB replaces reliability by faithful representation. However, Barth(2007) argues that the new term is just a more accurate specification of reliability. Hence, I will use the termreliability instead of faithful representation throughout this paper.

1 Introduction 3
The IASB reacted to the reliability issue and increased the disclosure requirements concerning
the fair value measurement of financial instruments by amending IFRS 7 Financial Instruments:
Disclosures. Entities applying IFRS now have to disclose financial instruments measured at
fair value by using a three-level hierarchy. The levels of this fair value hierarchy are based on
the quality of the input factors used in the measurement process. Level 1 inputs are quoted
prices in active markets, level 2 inputs include all observable data other than quoted prices, and
level 3 inputs comprise all non-observable data. This fair value hierarchy is equivalent to the
hierarchy of SFAS 157 (now Topic 820), albeit limited to financial instruments, and anticipates
the disclosure requirements established in IFRS 13 Fair Value Measurement. Any measurement
based on inputs of the first level of this hierarchy is also labelled as mark-to-market, while fair
value measurement based on inputs of lower levels is called mark-to-model, which Warren Buffett
famously denounced as mark-to-myth (Buffett (2003)). Even though he said that mark-to-model
only in rare cases declines to a mark-to-myth, it can clearly be stated that the reliability of fair
values is decreasing with a decreasing measurement level. The reduced reliability of level 2 and
level 3 fair values arises from two factors. First, model-based fair values can be biased due to
unintentional measurement errors. Second, management can deliberately use discretion in fair
value measurement for earnings management. Thus, fair values based on mark-to-model might
be noisy measures of the “true”value. Goh et al. (2009), Kolev (2008), and Song et al. (2010)
investigate the value relevance of this fair value hierarchy for the U.S. market. They show that
fair values of all hierarchy levels are value relevant. However, as expected, fair values based on
level 2 or 3 inputs are significantly less value relevant than fair values based on quoted prices.
Another concern about fair value accounting for financial instruments was its procyclical effect
on the financial sector. This effect occurs when banks adjust their balance sheet structures
following asset price changes (e.g. Plantin et al. (2008)). If prices of assets which are marked
to market decrease, leverage ratios increase, and regulatory capital requirements can necessitate
banks to sell assets to reduce their leverage. These asset sales might further depress asset
prices. Therefore, European politicians pressed the IASB during the financial crisis to relax fair
value accounting for financial instruments by allowing banks to reclassify their financial assets
measured at fair value to categories which require amortized cost measurement. The IASB
conceded and created new reclassification options by amending IAS 39 Financial Instruments:

1 Introduction 4
Recognition and Measurement. Studies of Bischof et al. (2010) and Kholmy and Ernstberger
(2010) analyze which intentions banks pursued by reclassifying financial assets. Bischof et al.
(2010) find that banks reclassified financial assets to avoid a violation of regulatory capital
requirements. Kholmy and Ernstberger (2010) analyze additionally whether profitability might
have had an impact on reclassification decisions. The authors conclude that banks use the new
reclassification options for general earnings management.
This study focusses on the first concern about fair values, i.e. the lack of reliability. Therefore,
the fair value hierarchy for financial instruments is examined in a value relevance research setting
similar to Song et al. (2010). However, it extends the existing literature (Goh et al. (2009), Kolev
(2008), Song et al. (2010)) by analyzing, for the first time, the value relevance and the reliability
of the IFRS 7 fair value hierarchy based on the financial data of European banks. Furthermore,
this study covers a longer time period than prior studies. While Goh et al. (2009), Kolev (2008),
and Song et al. (2010) focus on data from 2008, I use financial data from 2006 to 2010. The
results show that fair values of all measurement levels are value relevant. Further, level 3 fair
values are significantly less reliable than level 1 or level 2 fair values. In a next step, the study
analyzes the impact of regulatory capital and of reclassification decisions on the reliability of
mark-to-model fair values. In contrast to the results of Goh et al. (2009), it can be shown that
the regulatory capital ratio has no significant influence on the reliability of level 3 fair values.
Additionally, notwithstanding the results of Bischof et al. (2010) and Kholmy and Ernstberger
(2010) that banks use the new reclassification option for earnings management and to avoid
violating regulatory requirements, capital markets do not perceive mark-to-model fair values of
reclassifying banks as less reliable than fair values of non-reclassifying banks.
In the next Section the institutional background, i.e. the relevant accounting standards, is
discussed. Section 3 summarizes the related literature and discusses the contribution of this
study. Section 4 contains the empirical investigation, including sample selection, hypotheses
development, empirical modelling, and results. Section 5 concludes.

2 Institutional Background 5
2 Institutional Background
I will refer to IAS 39 and IFRS 7 throughout this study without considering IFRS 9 and IFRS
13. IFRS 9 Financial Instruments and IFRS 13 Fair Value Measurement, which were issued in
2009 and 2011 respectively, have amended both IAS 39 and IFRS 7. While IFRS 13 was not
applicable during the sample period, the IASB would have allowed an early voluntary application
of IFRS 9 starting with November 2009. However, the European Commission has not endorsed
the new standard until today. Therefore, the sample banks could not apply the new accounting
standards during the sample period.
2.1 IFRS 7 - Fair Value Hierarchy
IAS 39.9 defines fair value as “the amount for which an asset could be exchanged, or a liabil-
ity settled, between knowledgeable, willing parties in an arm’s length transaction.”From this
definition follows that the fair value is a measure which is closely related to the market value.
Yet, it cannot be assumed that fair and market values are identical in all cases, because fair
values can be based on valuation models. IAS 39 defines a hierarchy for the measurement of fair
values of financial instruments. The quoted market price of a financial instrument is always the
best estimate for the fair value if an active market exists. However, if there is no active market,
entities have to use established valuation approaches to measure the fair value of a financial
instrument. In this case, the reliability of the fair value deteriorates because of two reasons.
First, the model-based valuation might include an undeliberate measurement error. Second,
entities could use the discretion in valuation models to manage earnings. Hence, mark-to-model
fair values might be noisy measures of the “true”values. For financial markets it is thus vital to
get information about the fair value hierarchy because accounting information has to be both
relevant and reliable to be useful for decision making. While markets usually do not doubt the
relevance of fair values for the decision making process, the reliability of fair values became more
important at the climax of the last financial crisis. Although IFRS 7 required some disclosures
regarding the measurement of fair values prior to 2009, entities did not have to disclose sep-
arately which amount of financial instruments measured at fair value was based on valuation
models.
2.2 IAS 39 - Reclassification of Financial Instruments 6
Eventually, the IASB reacted to the information needs of capital market participants and
amended IFRS 7 in March 2009 (IASB (2009)). This amendment implemented an input-based
measurement hierarchy for financial instruments (IFRS 7.27A). There are three levels of inputs:
• Level 1: Quoted market prices of identical financial instruments.
• Level 2: Inputs based on observable market data.
• Level 3: Inputs not based on observable market data.
Entities have to classify their financial instruments measured at fair values according to this input
hierarchy. The level of a fair value is determined by the lowest level of significant inputs used in
the valuation process. The amendment does not only define this fair value hierarchy but adds
several quantitative disclosure requirements regarding the fair value measurement (IFRS 7.27B).
For example, entities have to disclose significant transfers between different measurement levels
and a reconciliation from the opening balance to the closing balance for level 3 fair values. But
most important for this study, entities have to make quantitative disclosures regarding the fair
values measured at the different levels of the fair value hierarchy.
When it adopted this fair value hierarchy for financial instruments, the IASB clearly followed
SFAS 157 (now Topic 820) and anticipated the results of the Fair Value Measurement Project
(IFRS 13). However, this “new”measurement hierarchy can rather be seen as a further speci-
fication of the hierarchy defined in IAS 39 and, accordingly, fair values based on level 2 and 3
inputs should suffer from a reduced reliability.
2.2 IAS 39 - Reclassification of Financial Instruments
The second major issue regarding fair value accounting during the financial crisis was the reclas-
sification of financial instruments. Generally, in IFRS, similar to US-GAAP, the measurement of
financial instruments is determined by a classification of these instruments at initial recognition
in one of five categories. While the categories “at fair value through profit or loss”(AFV) and
“available for sale”(AFS) require a measurement at fair value, the categories “held to maturity”
(HTM), “loans and receivables”(LAR), and “other liabilities”(OL) demand a measurement at
amortized costs. Prior to the amendment to IAS 39 and IFRS 7 from October 2008 (IASB
2.2 IAS 39 - Reclassification of Financial Instruments 7
(2008)), the reclassification options were very limited. An entity could only reclassify financial
instruments, without facing sanctions, from the category AFS to the category HTM. In addition,
entities could reclassify financial instruments from the category HTM to the category AFS, but
would face sanctions if reclassifying more than an insignificant amount. The IASB’s intention
behind these very limited reclassification options was to restrain earnings management. Politi-
cians however, concerned about the procyclical effect of fair value accounting, at the climax of
the financial crisis pressed the IASB to relax reclassification rules. The EU Commission even
threatened the IASB with another carve-out from IAS 39 that would allow European firms to
reclassify financial instruments (McCreevy (2008)). Eventually, the IASB conceded to the po-
litical pressure and amended IAS 39 and IFRS 7, primarily to avoid new reclassification options
without accompanying disclosure requirements (Bischof et al. (2010)). The amendment did not
follow the IASB’s due process for standard-setting, went effective retroactively in July 2008 and
had no impact on the existing reclassification options. Thus, it can clearly be identified as an
emergency measure.
The new reclassification rules allow entities to reclassify financial assets from the trading to
the banking book, i.e. from categories which require measurement at fair value to categories
which require measurement at amortized costs (IAS 39.50-50F). More precisely, entities can now
reclassify financial assets held for trading into the categories AFS, HTM and LAR and financial
assets available for sale into the category LAR. However, entities are not allowed to reclassify
financial derivatives and financial instruments which were designated at initial recognition as
AFV. Furthermore, financial assets can only be reclassified from AFV into AFS or HTM in rare
circumstances. The definition of a rare circumstance is, however, somewhat imprecise. The
IASB assumes that it is due to a “single event that is unusual and highly unlikely to recur in the
near term”(IAS 39.BC104D). Therefore, the identification of such a market condition might be
open for dispute.
As mentioned before, the IASB conceded to the political pressure because it wanted to avoid
new reclassification options without accompanying disclosures. Therefore, the IASB did not
only amend IAS 39 in October 2008 but also IFRS 7. According to this amendment, entities
are obliged to follow extensive disclosure requirements regarding reclassified financial assets
3 Related Literature 8
(IFRS 7.12A). For example, entities have to disclose reclassified amounts, involved categories,
carrying amounts, and fair values of financial assets which were reclassified in current or previous
reporting periods. Furthermore, entities have to disclose the facts that might indicate that a
rare circumstance is existent.
Overall, the new reclassification rules draw criticism. First, the standard-setting process was
the result of a severe interference in the independence of the standard-setting body. Second
and most important, the relaxed reclassification rules open up new possibilities for earnings
management. Hence, the amendment from October 2008 had most likely a negative effect on
the overall accounting quality of IFRS.
3 Related Literature
This study is based on the vast body of value relevance literature on fair value accounting for
financial instruments. These studies generally find, beginning with Barth (1994), that disclosed
(e.g. Ahmed and Takeda (1995), Eccher et al. (1996), Simko (1999)) as well as recognized (e.g.
Park et al. (1999), Carroll et al. (2003), Ahmed et al. (2006)) fair values are value relevant and
provide investors with incremental information in comparison to historic cost measures. Several
studies, however, cast doubt to the value relevance of illiquid financial instruments (Petroni
and Wahlen (1995), Eccher et al. (1996)). The results of these studies indicate that market
participants perceive the reliability of illiquid financial instruments as substantially deteriorated.
This might be due to the fact that entities have to use valuation models to estimate the fair values
of these instruments. Hence, the fair values might be only, as argued before, noisy measures of the
“true”values. Nevertheless, Carroll et al. (2003) find for their sample of closed-end investment
funds that investors do not value fair values of liquid and illiquid financial assets differently.
This striking result could be explained by private information an entity can provide by using
valuation models. Some evidence for such an effect of private information is provided by Beaver
and Venkatachalam (2003). They split loan fair values into discretionary, non-discretionary, and
noise components and show that the discretionary component is priced higher by investors than
its balance sheet value indicates. The positive effect of discretion on the relevance of accounting

3 Related Literature 9
information might thus outweigh its negative effect on reliability. Summing up the evidence, it
is not obvious whether the value relevance of model-based fair values is significantly reduced.
More recent studies have focused on the reliability of fair values of financial instruments during
the last financial crisis. While Kolev (2008), Goh et al. (2009), and Song et al. (2010) analyze
the value relevance of the SFAS 157 fair value hierarchy in 2008, Fiechter and Novotny-Farkas
(2011) lay their focus on the value relevance of financial instruments of IFRS-adopting banks for
the period from 2006 to 2008. Kolev (2008), Goh et al. (2009), and Song et al. (2010) find that
fair values of all measurement levels are value relevant. However, they also show consistently
that level 3 fair values have significantly reduced valuation coeffi cients. Goh et al. (2009) even
find evidence that investors perceive level 2 fair values as significantly less value relevant than
level 1 fair values. Overall, these findings indicate that the reduced reliability of mark-to-model
fair values outweighs any positive effect of private information on the relevance of fair values.
The results of Fiechter and Novotny-Farkas (2011) support this notion. They analyze fair values
of IFRS-adopting banks, but do not use fair value hierarchy disclosures because they were not
obligatory in IFRS until 2009. Instead, they use fair values of financial instruments held for
trading and of financial instruments which were designated at initial recognition at fair value
through profit or loss. They assume that designated financial instruments are less reliable
because it is a discretionary decision to measure them at fair value and banks can use this
discretion for earnings management. The authors show that investors, indeed, perceive these
fair values as less value relevant than the fair values of financial instruments held for trading.
Yet the theoretical foundation of this study is disputable because the discretion in designating
financial instruments at fair value is very limited (IAS 39.9b, IAS 39.12A) and the designation
is an irrevocable decision.
Additionally, the studies show that the value relevance of mark-to-model fair values is less
reduced for banks with better corporate governance (Song et al. (2010)), big-4 auditors, and
high regulatory capital (Goh et al. (2009)). Thus, capital markets discount mark-to-model fair
values of banks with lower incentives for earnings management less.
Overall, the recent evidence supports the hypothesis that mark-to-model fair values are less
reliable than mark-to-market fair values. Nevertheless, there are several limitations to this

4 Empirical Analysis 10
conclusion. First, the studies focus on the subprime crisis in 2008 and do not cover the post-
crisis period. Hence, the perception of the reliability of mark-to-model fair values could have
changed in 2009 or 2010. Second, Kolev (2008), Goh et al. (2009), and Song et al. (2010) analyze
the fair value hierarchy only for U.S. banks. Third, the study of Fiechter and Novotny-Farkas
(2011), which indeed focuses on fair value accounting in European banks, does not analyze the
fair value hierarchy and lacks a convincing theoretical foundation. Accordingly, there is currently
no study analyzing the value relevance of the IFRS 7 fair value hierarchy. This study is aimed
to mitigate these limitations by analyzing the IFRS 7 fair value hierarchy for European banks
from 2006 to 2010.
Another string of research this study picks up, is the accounting choice literature. This litera-
ture provides essential inputs for the question which intentions banks pursued by using the new
reclassification options. The studies show that banks used the relaxed rules to avoid violating
regulatory capital requirements (Bischof et al. (2010)) and, in very general terms, for earnings
management (Kholmy and Ernstberger (2010)). Therefore, one would expect an overall dete-
riorated accounting quality for reclassifying banks. This study will investigate whether this is
also reflected in the value relevance of mark-to-model fair values. In this context, I also exam-
ine whether capital markets price the difference between the fair value and the book value of
reclassified financial assets.
4 Empirical Analysis
4.1 Sample Selection and Descriptive Statistics
Although both IAS 39 and IFRS 7 are not industry-specific standards, this paper focuses on the
banking sector. This is due to the fact that the largest part of banks’balance sheets consists of
financial instruments, while they usually only represent marginal positions in other industries.3
I limit the sample to European banks, i.e. banks from EU 27 and EFTA states, for a sample
period from 2006 to 2010. As mentioned before, quantitative fair value disclosures only became
3 With the notable exception of Simko (1999), all value relevance studies on fair value accounting for financialinstruments focus on the financial sector.

4.1 Sample Selection and Descriptive Statistics 11
obligatory in 2009. However, there were banks which already started to disclosure fair value
hierarchy information in 2006. While one can easily argue that banks which made fair value
hierarchy disclosures in 2008 were early adopters of the IFRS 7 amendment, the case of banks
disclosing fair value hierarchy information in 2006 and 2007 is more diffi cult because there was
not even an IASB discussion paper. The early quantitative disclosures could have been caused
by a US-GAAP orientation of the disclosing banks, where SFAS 157 was issued in October 2006.
An example supporting this hypothesis is Deutsche Bank. Deutsche Bank adopted US-GAAP
in 2001, but had to apply IFRS in accordance with EU law (European Union (2002)) since 2007.
In its annual report from 2007 Deutsche Bank makes quantitative disclosures, but states that it
is following the IFRS fair value hierarchy (Deutsche Bank (2007), pp. 158-159). Thus, the bank
might have used SFAS 157 to interpret the disclosure requirements of IFRS 7.
I include all publicly traded European banks which are either listed in Bureau von Dijk Bankscope
or Thomson Reuters Datastream. From these I exclude all non-IFRS banks and banks without
readily available reports. The latter step is necessary because both databases do not include any
information regarding the fair value hierarchy or the reclassification of financial assets. Thus,
my sample is essentially hand-collected. In a further step, all banks with fiscal-year end other
than 31st December are excluded from the sample to avoid confounding economic effects in the
empirical analysis. Subsequently, bank-years without quantitative hierarchy disclosures are ex-
cluded. Most of these excluded bank-years are obviously in 2006, 2007, and 2008 (see Table 1).
Quite remarkably, even in 2009 and 2010 some banks did not make the required fair value hier-
archy disclosures. For example, OTP Banka Slovensko does not make such disclosures in 2009
(OTP Banka Slovensko (2009)). Other previous studies found similar or even more appalling ev-
idence regarding the non-compliance with obligatory disclosure requirements (e.g. Bischof et al.
(2010)). Finally, I exclude all banks without suffi cient data on the market capitalization and
outliers. Because the sample size is rather limited, I do not use quantitative methods to exclude
or to correct for outliers but I select them manually. Three banks with overall six bank-years are
excluded from the final sample, Crédit Industriel et Commercial, Dexia Banka Slovensko, and
Tatra Banka Slovensko. Both Dexia Banka Slovensko and Tatra Banka Slovensko have several
tranches of stocks of which some are highly illiquid. Therefore, it is impossible to calculate an
accurate firm value. Crédit Industriel et Commercial, on the other hand, has a per stock book
4.1 Sample Selection and Descriptive Statistics 12
value of assets that deviates substantially from the median value of the total sample4 which
could bias the empirical results. The remaining sample consists of 408 bank-years, 85.8% of
them in 2009 and 2010.
[Insert Table 1 about here]
Table 2 displays descriptive statistics of this bank sample. Panel A provides absolute values,
Panel B relative values, i.e. values compared to total assets, and Panel C values per share. Panel
B reveals that fair value positions, in contrast to their prominence in the public debate during
the financial crisis, only comprise a relatively small part of the balance sheet. On average, fair
value assets account for 26.1% of total assets, while fair value liabilities account only for 11.2%.
The median values are even lower. While the median value of fair value assets is 14.9%, it is just
1.5% for fair value liabilities. The largest part of financial assets (liabilities) measured at fair
value are based on level 1 (level 2) inputs. Though, the lower relevance of fair value accounting
for financial liabilities does not come unexpected with regard to the restrictive fair value option
of IAS 39. The low amount of financial liabilities measured at fair value and the significant
number of banks which do not recognize any liabilities at fair values might, however, impair the
significance of the results of further statistical analysis.
[Insert Table 2 about here]
Another important observation is that for Panel A as well as for Panel C the mean values are
substantially higher than the median values. Hence, the absolute values and the values per
share have a highly right skewed distribution. While one expects a substantial impact of large
observations in Panel A, the skewed distribution in Panel C is more critical. The number of
outstanding shares is often used in market-based accounting research as a deflator to mitigate
scale effects, i.e. the undue influence of large observations on regression results. However, the
descriptives indicate that the number of outstanding shares might only replace one scaling factor
4 The deviation is higher than ten times the standard deviation.
4.2 Hypotheses Development 13
(market value of equity) by another (price per share). This problem will be discussed in more
detail in the robustness checks.
4.2 Hypotheses Development
The value relevance research design is a means to operationalize the trade-off between relevance
and reliability which is inherent in every accounting information (Barth (2000), pp. 16-17).
Therefore, if an accounting information is value relevant, i.e. the regression coeffi cient is signif-
icantly different from zero, its relevance at least outweighs any lack of reliability. One can also
state that accounting information is more relevant for equity investors if it is forward-looking.
However, any forward-looking accounting information can be biased by measurement error or
deliberate manipulation and thus lacks reliability. An example for forward-looking information
are fair values because they generally represent present values of expected future cash flows.
Accordingly, they are highly relevant for investors, but might lack reliability. However, it seems
to be unlikely that investors do not price fair values at all and therefore I expect the relevance
of fair values of financial instruments to outweigh any lack of reliability, even for mark-to-model
fair values.
• H1a: Fair value assets and liabilities of all hierarchy levels are value relevant.
It is reasonable to expect the value relevance of fair value assets to decrease with decreasing
hierarchy level, because the reliability declines with decreasing level. The effect is more diffi cult
to predict for financial liabilities. Basically, the coeffi cients on fair value liabilities should increase
with decreasing hierarchy level because banks might use their discretion to recognize lower values
and thus show higher profits. On the other hand, measurement errors and the overall very low
relative amounts of fair value liabilities might add a significant noise component to the estimated
coeffi cients. Hence, I do not include fair value liabilities in H1b.
• H1b: The value relevance of fair value assets decreases with decreasing hierarchy level.
As mentioned before, the accounting choice literature on the relaxed reclassification option finds
evidence that banks use the option to manage earnings and to avoid violating regulatory cap-
ital requirements (Bischof et al. (2010), Kholmy and Ernstberger (2010)). Hence, reclassifying

4.2 Hypotheses Development 14
banks are likely to being perceived by capital market participants as less committed to a high
accounting quality because these banks have shown their willingness to actively manage earnings
and balance sheet relations, i.e. the decision to reclassify will be interpreted as a signal of low
accounting quality. This negative signal also casts doubt on the reliability of mark-to-model fair
values because banks which have used the reclassification option for earnings management are
more likely to use their discretion in measuring fair values for the same purpose. Therefore, I
expect the value relevance of mark-to-model fair values to be significantly lower for reclassifying
banks than for non-reclassifying banks.
• H2a: The value relevance of level 2 and 3 fair value assets is lower for reclassifying banks
than for non-reclassifying banks.
The early literature on the value relevance of fair values of financial instruments essentially
investigates whether disclosed fair values can provide incremental information to recognized
historic costs. Most of these studies find supporting evidence (e.g. Barth et al. (1996), Eccher
et al. (1996)). I expand the basic idea of this research to the reclassification of financial assets.
While banks recognize their reclassified assets at amortized costs, they still have to disclose the
fair values of these assets. If one assumes that banks use the reclassification option to manage
earnings and not to faithfully report their financial position, investors should price the fair value
information disclosed in the notes. Therefore, the difference between disclosed fair values and
recognized amortized costs should be value relevant and explain cross-sectional variations of
share prices.
• H2b: The difference between fair values and book values of reclassified financial assets can
explain cross-sectional and time-series variations of share prices.
The third and last hypothesis regards the financial position of the sample banks. As a proxy
for the financial position I use the Tier 1 capital ratio. I assume that banks with lower Tier 1
capital, i.e. banks in a poor financial position, have higher incentives to use discretion to manage
earnings and balance sheet relations. Consequently, similar to H2a, mark-to-model fair values
of banks with low Tier 1 capital ratios should have a reduced value relevance.

4.3 Empirical Model 15
• H3: The value relevance of level 2 and 3 fair value assets is lower for banks with low Tier
1 capital ratio than for banks with high Tier 1 capital ratios.
It must be stated that the Tier 1 capital ratio might be a noisy proxy for the financial position
of a bank. Solvent and profitable banks could intentionally hold less equity capital in order to
increase their return on equity, while banks which have suffered a severe deterioration of the
credit quality of their loan portfolios might still show a high Tier 1 capital ratio because the
Tier 1 capital does not reflect this deterioration immediately due to the incurred loss model for
financial assets recognized at amortized costs. Furthermore, H2a and H3 are likely to overlap
at least to some extent because banks with low Tier 1 capital ratios are more likely to reclassify
financial assets.
4.3 Empirical Model
Market-based accounting research is based on different valuation models. The most common
models are the balance sheet approach and the residual income approach. The balance sheet
approach was introduced to the value relevance literature by Landsman (1986). This approach
uses the balance sheet identity, i.e.
BVE ≡m∑i=1
BVAi −n∑j=1
BVLj , (1)
where BVE, BVA, and BVL are the book values of equity, assets, and liabilities. The corre-
sponding valuation model assumes that the market value of equity (MVE ) is solely determined
by the market value of balance sheet assets (MVA) and liabilities (MVL):
MVE =
m∑i=1
MVAi −n∑j=1
MVLj . (2)
Although this valuation approach seems to be very appealing because of its simplicity, the
empirical implementation reveals several weaknesses. First, not all assets and liabilities are
measured at fair value. Hence, the book value is, in general, a very noisy proxy for the market
value. Second, not all items satisfy the recognition criteria of the IASB Framework. Any
empirical implementation of this valuation model will thus rely on accounting information, which

4.3 Empirical Model 16
does neither represent all assets and liabilities of a company nor in any case market values. Thus,
in the absence of perfect markets, a valuation model that is solely based on balance sheet data
might not be descriptive. Therefore, when implementing this approach, it is common practice
to include a proxy for non-recognized assets, which is typically net income (NI ) (Barth and
Landsman (1995), Aboody et al. (1999)).
An alternative valuation approach is the Ohlson (1995) residual income valuation model. It
explicitly models information dynamics, i.e. the time-series behavior of residual income:
MVEt = BVEt + α1RIt + α2υt, (3)
where RI is residual income, υ captures other (non-accounting) information, and α1 and α2
are valuation coeffi cients dependent on interest rates and information dynamics. The main
advantages of this valuation model in comparison to the balance sheet approach are the strong
theoretical foundation and the allowance for other information. However, there does not yet
seem to be a conclusive empirical measure for other information. While some studies explicitly
assume that other information is represented in the error term (e.g. Barth and Clinch (1998)),
other studies make the same assumption implicitly (e.g. Song et al. (2010)), even though this
limits the Ohlson (1995) model substantially (Liu and Ohlson (2000)). In the end, the empirical
implementation of both valuation approaches does not differ significantly. Some studies even
state explicitly that their empirical model can be seen as based either on the balance sheet
approach or on the Ohlson (1995) model (e.g. Aboody et al. (1999), Barth et al. (1998)).
Following Song et al. (2010), I use a regression model which can be regarded as based on either
a modified Ohlson (1995) model or the balance sheet approach:5
Pit = β0 + β1NFVAit + β2NFVLit + β3FVA1it + β4FVA2it + β5FVA3it
+ β6FVL1it + β7FVL2it + β8FVL3it + β9NIit + εit (4)
where P is the price per share three months after fiscal-year end, NFVA (NFVL) are non-
fair value assets (liabilities), and FVA1 (FVL1 ), FVA2 (FVL2 ), and FVA3 (FVL3 ) are fair
5 Song et al. (2010), however, argue that their regressions are based on a modified Ohlson (1995) model.

4.3 Empirical Model 17
value assets (liabilities) of the three IFRS 7 measurement levels. The study uses the number of
outstanding shares as a deflator to mitigate scale effects (Barth and Clinch (2009)). Hence, all
variables are on a per share basis. Another factor that has to be considered are possible cross-
sectional (time fixed effects) and time-series dependencies (firm fixed effects) of the regression
residuals. Following Petersen (2009), I use clustered standard errors to control for fixed effects.
In order to test H2a, the variable ReclassAssets is included in the regression model. ReclassAssets
is a dummy variable that takes the value of one if a bank has reclassified financial assets on
its balance sheet and zero otherwise. The variable is interacted with fair value assets of all
measurement levels. I do not interact it with fair value liabilities because these in general
account for only a very low percentage of total assets, and a substantial number of banks does
not report any liabilities at fair value.
Pit = β0 + β1NFVA+ β2NFVLit + β3FVA1it + β4FVA1it ·ReclassAssetsit
+ β5FVA2it + β6FVA2it ·ReclassAssetsit + β7FVA3it + β8FVA3it
·ReclassAssetsit + β9FVL1it + β10FVL2it + β11FVL3it + β12NIit
+ β13ReclassAssetsit + εit (5)
In addition, I expand Equation 5 by including the variable ReclassAssetsFVBV which is the
difference between disclosed fair values and recognized amortized costs of assets which were
reclassified in accordance with the relaxed reclassification option.
Pit = β0 + β1NFVA+ β2NFVLit + β3FVA1it + β4FVA1it ·ReclassAssetsit
+ β5FVA2it + β6FVA2it ·ReclassAssetsit + β7FVA3it + β8FVA3it
·ReclassAssetsit + β9FVL1it + β10FVL2it + β11FVL3it + β12NIit
+ β13ReclassAssetsFVBVit + β14ReclassAssetsit + εit (6)
For the third hypothesis, the variable ReclassAssets is replaced by the variable LowTier1Ratio.
This variable is another dummy which is one for all banks with a Tier 1 capital ratio below the

4.3 Empirical Model 18
median Tier 1 capital ratio and zero otherwise. Again, the dummy is interacted with fair value
assets but not with fair value liabilities.
Pit = β0 + β1NFVA+ β2NFVLit + β3FVA1it + β4FVA1it · LowTier1Ratioit
+ β5FVA2it + β6FVA2it · LowTier1Ratioit + β7FVA3it + β8FVA3it
· LowTier1Ratioit + β9FVL1it + β10FVL2it + β11FVL3it + β12NIit
+ β13LowTier1Ratioit + εit (7)
In the final model, I combine Equations 5 and 7, i.e. I include both dummy variables in order to
control for confounding effects. Confounding effects might occur in Equations 5 and 7 because
banks use, as Bischof et al. (2010) show, new reclassification options to avoid violating regulatory
capital requirements. Accordingly, these banks most likely have less regulatory capital than the
median bank. Significant results in Equation 5 might therefore be solely driven by the effect of
low capital ratios and not by the effects of a reclassification decision on the perceived accounting
quality.
Pit = β0 + β1NFVA+ β2NFVLit + β3FVA1it + β4FVA1it ·ReclassAssetsit
+ β5FVA1it · LowTier1Ratioit + β6FVA1it ·ReclassAssetsit · LowTier1Ratioit
+ β7FVA2it + β8FVA2it ·ReclassAssetsit + β9FVA2it · LowTier1Ratioit
+ β10FVA2it ·ReclassAssetsit · LowTier1Ratioit + β11FVA3it + β12FVA3it
·ReclassAssetsit + β13FVA3it · LowTier1Ratioit + β14FVA3it ·ReclassAssetsit
· LowTier1Ratioit + β15FVL1it + β16FVL2it + β17FVL3it + β18NIit
+ β19ReclassAssetsit + β20LowTier1Ratioit + β21ReclassAssetsit
· LowTier1Ratioit + εit (8)

4.4 Results 19
4.4 Results
Table 3 shows the results of the basic OLS regression model (Equation 4). These results show
that all fair value assets and liabilities, even level 3 fair values, are value relevant, i.e. their
coeffi cients are significantly different from zero. Hence, the evidence supports H1a. Furthermore,
when comparing the coeffi cients of the different fair value levels, it can be seen that only the
coeffi cients of level 3 fair values are significantly different from the coeffi cients of other levels.
This is true both for assets and liabilities. Accordingly, only level 3 fair values are perceived
by capital markets as less reliable than level 1 fair values. One can thus not assert that every
mark-to-model is some kind of mark-to-myth because investors distinguish between level 2 and
level 3 fair values and even price the least reliable fair values. The fact that the coeffi cients of
fair value liabilities decrease with decreasing hierarchy level is somewhat striking. Following the
consideration that banks use their discretion in fair value measurement for earnings management,
increasing coeffi cients would be expected. However, as argued before, most banks have very low
or even zero amounts of fair value liabilities. Thus, the coeffi cients on fair value liabilities might
not be representative or even biased. Summing up, the evidence only weakly supports H1b.
[Insert Table 3 about here]
Based on the balance sheet model one would expect coeffi cients of 1 for assets and -1 for lia-
bilities. A deviation from these expected coeffi cients could be explained by a lack of reliability.
The results show, indeed, that all fair value assets and liabilities have coeffi cients which are
significantly different from the theoretically expected coeffi cients. But the results also seem to
suggest that the investors even discount fair value assets and liabilities of the first hierarchy
level, i.e. fair values based on quoted market prices. Hence, the observed discounts cannot
be explained only by a lack of reliability of single accounting positions. They might, though,
reflect institutional characteristics of the reporting banks or country fixed effects which are not
considered in the valuation approach. To test for these effects I split the sample first by coun-
try groups (Table 4) and then by bank size (Table 5). For the first split I define two country
groups, i.e. EU 15 and Other European. The latter includes all new EU member states and

4.4 Results 20
the EFTA states. As the results of Fiechter and Novotny-Farkas (2011) indicate, investors place
higher discounts on fair values of banks from non-EU 15 countries. These discounts might be
explained by lower regulatory quality and less sophisticated capital markets in those countries.
The results in Table 4 show indeed that for EU 15 banks, only the coeffi cients on level 3 fair
values deviate significantly from expected values, while for banks from other European coun-
tries, all coeffi cients on fair value assets and liabilities deviate from expected values. Panel B
even reveals that level 3 fair values totally lose value relevance for banks from other European
countries. Therefore, the deviation from expected values in the complete sample seems to be
driven by banks from other European countries. Another factor influencing the results could
be institutional characteristics of the sample banks. These characteristics might be reflected in
bank size (e.g. Song et al. (2010)). Therefore, I split the sample in large banks (above median
total assets) and small banks (below median total assets). The results of this partitioning are
reported in Table 5. While all fair value assets and liabilities are value relevant and coeffi cients
do not significantly differ from expected values for small banks (Panel B), they do differ for large
banks, and level 3 fair values even lose value relevance (Panel A). At first glance these results are
striking. For large banks one would expect higher scrutiny by capital market participants and
an intense analyst coverage. Therefore, the reliability of recognized fair values should be higher
for large banks than for small banks. On the other hand, one could also argue that investors
can use other sources of information than financial statements when valuing large banks, while
for small banks they have to rely on this one source of information. Accordingly, the value of
large banks could be driven by other information. This, however, should have no impact in
value relevance research as long as this information is reflected in financial statement positions.
The low coeffi cients of large banks could therefore indicate that the additional information is a
correlated omitted variable in the regression model which casts some doubts on the valuation
approach. As discussed before, there is no convincing empirical measure for other information
and therefore a change to the Ohlson (1995) or Feltham and Ohlson (1995) model is not a
feasible solution to this problem. Another possible explanation for the low coeffi cients for large
banks could be confounding effects, i.e. the majority of large banks could be situated in other
European countries. However, the data show that EU 15 banks have on average assets worth
EUR 276.94bn, while banks from other European countries only have EUR 36.92bn. Hence, the

4.4 Results 21
low coeffi cients of large banks cannot be explained by less sophisticated markets or a weaker
regulatory environment. Overall, the low coeffi cient on level 1 fair value assets (FVA1 ) in the
full sample and the low coeffi cients on fair value assets of all measurement levels in the subsam-
ples for banks from other European countries and large banks might indicate that the valuation
model is not descriptive for all banks. Therefore, the empirical results must be interpreted with
caution.
[Insert Table 4 about here]
[Insert Table 5 about here]
The results of the expanded empirical models (Equations 5-8) are shown in Table 6. The first
model analyzes the effect of the reclassification of financial assets. For this purpose, the sam-
ple period is reduced to the years 2008 to 2010 because the relaxed reclassification rules went
effective retroactively in July 2008. The results on the interaction terms between ReclassAssets
and the different levels of fair value assets are rather weak. The coeffi cients on the interaction
terms do neither have the expected signs nor are they significant. The decision to reclassify
financial assets does not seem to be interpreted by capital market participants as a signal of
a lower accounting quality. One could argue that these results are driven by a self-selection
bias because for the year 2008, the sample includes only those banks which voluntarily disclose
fair value hierarchy data. Voluntary disclosing might indicate that these banks are committed
to a higher accounting quality. However, when the observations from 2008 are excluded from
the sample, the coeffi cients on the interaction terms remain far from significant at conventional
levels (untabulated). Another potential problem might be caused by the variable ReclassAs-
sets. This variable has a value of one as long as a bank has reclassified financial assets on its
balance sheet. Yet, the actual reclassification of the financial assets might have occurred in the
previous fiscal years. If investors only interpret the decision to reclassify as a signal of a lower
accounting quality, the regression results might be flawed. Therefore, I replace ReclassAssets
by the variable ReclassDecision which is one if the bank has reclassified financial assets in the
current reporting period and zero otherwise. Again, the relevant coeffi cients are insignificant
(untabulated). Accordingly, the evidence suggests that investors do not perceive the fair value

4.4 Results 22
disclosures of reclassifying banks as less value relevant. In a further step, the variable Reclas-
sAssetsFVBV is included in the regression model. As mentioned above, this variable covers the
difference between the fair value and the book value of reclassified financial assets. Again, the
coeffi cients of this variable and of the interaction terms remain insignificant. Summing up, the
results do not support H2a and H2b.
In the third expanded empirical model, I test for the effects of regulatory capital on the perceived
reliability of fair values. Again, the sample period includes all sample years, i.e. 2006 to 2010,
but without bank-years where information about Tier 1 ratios is missing. As stated in H3, I
expect mark-to-model fair values to be less value relevant for banks with low regulatory capital
than for banks with high regulatory capital. In contrast to results for the reclassification, two
of three coeffi cients on the interaction terms are significant at conventional levels. The effect
of regulatory capital is significant for level 1 and level 2 fair values. While I do not make any
assumption about the impact on level 1 fair values, the results show, contrary to my predictions,
a significantly positive effect of low regulatory capital on the value relevance of level 2 fair values.
The coeffi cient on the interaction between low regulatory capital and level 3 fair values has the
expected sign but is not significant.6
[Insert Table 6 about here]
In a final step, I test for both the effects of reclassification and of low regulatory capital in a
combined model to control for possible confounding effects. The sample for this combined model
differs from the samples of the separate models because it reflects the constraints of both mod-
els. The sample period spans from 2008 to 2010 and all bank-years without regulatory capital
information are excluded. The findings are again very weak. Coeffi cients on the interaction
terms only get significant for level 2 fair values. Here, one can observe a positive significant
effect of low regulatory capital and of the decision to reclassify financial assets. Even if a bank
has reclassified financial assets and low regulatory capital, markets value its level 2 fair values
6 Goh et al. (2009) find a significantly negative impact of low regulatory capital on the reliability of level 3 fairvalues in their study for U.S. banks.

4.5 Robustness Checks 23
at a premium (11 cents for each Euro of level 2 assets) in comparison to non-reclassifying banks
with high regulatory capital.
Overall, the results of the expanded models do not seem to support hypotheses H2 and H3.
Nevertheless, one can ascertain that generalizations about mark-to-model fair values are not
feasible because market participants value level 2 and 3 fair values differently. The insignificant
impact of low regulatory capital on the perceived reliability of mark-to-model fair values remains
noticeable. This result might be explained by the fact that most banks with low Tier 1 ratios
are situated in the EU 15. This means that the indicator variable LowTier1Ratio might also
cover differences in value relevance between EU 15 and other European countries.
4.5 Robustness Checks
My descriptive statistics cast some doubt on the ability of the number of outstanding shares
to mitigate scale effects. Therefore, I test the basic regression model with alternative deflators.
Since the number of outstanding shares is rather unrelated to the economics of the sample firms,
I use two more strongly related deflators, book value and market value of equity, to test for
the robustness of the regression results. Book value of equity is a very common deflator in the
value relevance literature (e.g. Eccher et al. (1996), Nelson (1996)). Market value of equity, on
the other hand, is less common. This deflator was proposed by Easton and Sommers (2003).
They argue that market capitalization as of fiscal-year end represents the scale in a sample.
Therefore, they suggest to use market capitalization as a deflator. This would result in the
following regression model:
MVEitMVEit
= β01
MVEit+ β1
NFVAitMVEit
+ β2NFVLitMVEit
+ β3FVA1itMVEit
+ β4FVA2itMVEit
+ β5FVA3itMVEit
+ β6FVL1itMVEit
+ β7FVL2itMVEit
+ β8FVL3itMVEit
+ β9NIitMVEit
+ εit. (9)
The obvious problem is that the dependent variable will take a value of one for every observation.
So an OLS estimation is no longer feasible. The authors recommend to use a WLS regression
with the inverted square of the market capitalization as a weight, which is consistent with the
regression above.

5 Conclusion 24
[Insert Table 7 about here]
The results of the regressions based on these alternative deflators are reported in Table 7 (BVE
in Panel A, MVE in Panel B). They reveal that the fair values of all levels remain significant for
both alternative deflators, with the notable exception of level 3 assets in the regression deflated
by the book value of equity. Overall, the results still support H1a. However, the absolute values
of the coeffi cients are substantially lower for the regression models based on the alternative
deflators. Furthermore, the coeffi cient of level 2 fair value assets is now significantly smaller
than the coeffi cient of level 1 fair value assets and - when using the market value of equity as
a deflator - level 2 assets are no longer more value relevant than level 3 assets. This strongly
supports H1b. Rather striking is the very low adjusted R2 of the regression deflated by the
book value of equity. This means that accounting measures can only explain a small part of the
cross-sectional and time-series variation of market-to-book ratios, as is well known from previous
literature (e.g. Eccher et al. (1996), Nelson (1996)).
Summing up, the results based on the alternative deflators substantially deviate from the results
of the share-deflated regression model. Though the basic hypotheses hold when testing the
regressions for robustness, the decreased value of the coeffi cients in models based on book value
and market value of equity indicates that there are scale effects which cannot be effectively
mitigated by the number of shares.
5 Conclusion
This study is the first which analyses the value relevance of the IFRS 7 fair value hierarchy. The
main result is that fair values of financial instruments are value relevant, but level 3 fair values
are perceived as less reliable than other fair values. In addition, Investors price fair values of EU
15 banks substantially higher than fair values of banks from other European countries, which
can be explained by differences in regulatory quality and financial market sophistication. I also
find that capital markets price fair values of small banks higher than fair values of large banks.

5 Conclusion 25
This might indicate that market prices of large banks are more strongly driven by information
not reflected in financial statements.
The study also analyses the effects of a reclassification of financial assets and of regulatory capital
on the reliability of fair value assets. While it finds no significant effects for the reclassification,
there is a weakly significant impact of the regulatory capital on the reliability of mark-to-model
fair values.
A limitation this study shares with all value relevance studies is that it is based on the assumption
of effi cient markets. This assumption might be, however, particularly questionable during the
financial crisis. The low coeffi cients could be explained by these extraordinary circumstances.
Overall, the results show that fair values of all measurement levels remain value relevant even
during the financial crisis. Finally, the significant variation of the coeffi cients of the different fair
value levels proves that the new disclosure requirements provide decision-useful information for
investors.

References 26
References
Aboody, D., Barth, M. E. and Kasznik, R. (1999). Revaluations of fixed assets and future firm
performance: Evidence from the UK, Journal of Accounting and Economics 26(1-3): 149—
178.
Ahmed, A. S., Kilic, E. and Lobo, G. J. (2006). Does Recognition versus Disclosure Matter?
Evidence from Value-Relevance of Banks’Recognized and Disclosed Derivative Financial
Instruments, The Accounting Review 81(3): 567—588.
Ahmed, A. S. and Takeda, C. (1995). Stock market valuation of gains and losses on commercial
banks’investment securities - An empirical analysis, Journal of Accounting and Economics
20(2): 207—225.
Barth, M. E. (1994). Fair Value Accounting: Evidence from Investment Securities and the
Market Valuation of Banks, The Accounting Review 69(1): 1—25.
Barth, M. E. (2000). Valuation-based accounting research: Implications for financial reporting
and opportunities for future research, Accounting and Finance 40(1): 7—31.
Barth, M. E. (2007). Standard-setting measurement issues and the relevance of research, Ac-
counting and Business Research 37(3): 7—15.
Barth, M. E., Beaver, W. H. and Landsman, W. R. (1996). Value-Relevance of Banks’Fair
Value Disclosures under SFAS No. 107, The Accounting Review 71(4): 513—537.
Barth, M. E., Beaver, W. H. and Landsman, W. R. (2001). The relevance of the value-relevance
literature for financial accounting standard setting: another view., Journal of Accounting
and Economics 31(1-3): 77 —104.
Barth, M. E., Clement, M. B., Foster, G. and Kasznik, R. (1998). Brand Values and Capital
Market Valuation, Review of Accounting Studies 3(1-2): 41—68.
Barth, M. E. and Clinch, G. (1998). Revalued Financial, Tangible, and Intangible Assets: Asso-
ciations with Share Prices and Non-Market-Based Value Estimates, Journal of Accounting
Research 36(Supplement): 199—233.

References 27
Barth, M. E. and Clinch, G. (2009). Scale Effects in Capital Market-Based Accounting Research,
Journal of Business Finance and Accounting 36(3-4): 253—288.
Barth, M. E. and Landsman, W. R. (1995). Fundamental Issues Related to Using Fair Value
Accounting for Financial Reporting, Accounting Horizons 9(4): 97—107.
Beaver, W. H. and Venkatachalam, M. (2003). Differential Pricing of Components of Bank Loan
Fair Values, Journal of Accounting, Auditing and Finance 18(1): 41—67.
Bischof, J., Brüggemann, U. and Daske, H. (2010). Relaxation of Fair Value Rules in Times of
Crisis: An Analysis of Economic Benefits and Costs of the Amendment to IAS 39,Working
paper.
Buffett, W. E. (2003). Chairman’s letter, Annual Report 2002, Berkshire Hathaway, pp. 3—23.
Carroll, T. J., Linsmeier, T. J. and Petroni, K. R. (2003). The Reliability of Fair Value versus
Historical Cost Information: Evidence from Closed-End Mutual Funds, Journal of Account-
ing, Auditing and Finance 18(1): 1—23.
Deutsche Bank (2007). Annual review 2007, Report.
Easton, P. D. and Sommers, G. A. (2003). Scale and the Scale Effect im Market-based Account-
ing Research, Journal of Business Finance and Accounting 30(1-2): 25—55.
Eccher, E. A., Ramesh, K. and Thiagarajan, S. R. (1996). Fair value disclosure by bank holding
companies, Journal of Accounting and Economics 22(1-3): 79—117.
Enria, A., Cappiello, L., Dierick, F., Grittini, S., Haralambous, A., Maddaloni, A., Molitor, P.,
Pires, F. and Poloni, P. (2004). Fair Value Accounting and Financial Stability, Occasional
Paper Series 13, European Central Bank.
European Union (2002). REGULATION (EC) No 1606/2002 OF THE EUROPEAN PAR-
LIAMENT AND OF THE COUNCIL of 19 July 2002 on the application of international
accounting standards, Regulation.
Feltham, J. A. and Ohlson, J. A. (1995). Valuation and Clean Surplus Accounting for Operating
and Financial Activities, Contemporary Accounting Research 11(2): 689—731.
Fiechter, P. and Novotny-Farkas, Z. (2011). Pricing of Fair Values during the Financial Crisis:
International Evidence, Working paper.

References 28
Goh, B. W., Ng, J. and Yong, K. O. (2009). Market Pricing of Banks’Fair Value Assets Reported
under SFAS 157 during the 2008 Economic Crisis, Working paper.
IASB (2008). Reclassification of Financial Assets - Amendments to IAS 39 Financial Instru-
ments: Recognition and Measurement and IFRS 7 Financial Instruments: Disclosures,
Amendment.
IASB (2009). Improving Disclosures about Financial Instruments - Amendments to IFRS 7
Financial Instruments: Disclosures, Amendment.
Kholmy, K. and Ernstberger, J. (2010). Reclassification of Financial Instruments in the Financial
Crisis - Empirical Evidence from the European Banking Sector, Working paper.
Kolev, K. (2008). Do Investors Perceive Marking-to-Model as Marking-to-Myth? Early Evidence
from FAS 157 Disclosure, Working paper, NYU Stern School of Business.
Landsman, W. (1986). An Empirical Investigation of Pension Fund Property Rights, The Ac-
counting Review 61(4): 662—691.
Laux, C. and Leuz, C. (2009). The crisis of fair-value accounting: Making sense of the recent
debate, Accounting, Organizations and Society 34(6-7): 826—834.
Liu, J. and Ohlson, J. A. (2000). The Feltham-Ohlson (1995) Model: Empirical Implications,
Journal of Accounting, Auditing and Finance 15(3): 321—331.
McCreevy, C. (2008). Lamfalussy follow up: future structure of supervision, Euro-
pean Parliament Plenary Session, 8 October 2008, URL: http://europa.eu/rapid/
pressReleasesAction.do?reference=SPEECH/08/513&format=HTML&aged=0&language=
EN&guiLanguage=en.
Nelson, K. K. (1996). Fair Value Accounting for Commercial Banks: An Empirical Analysis of
SFAS No. 107, The Accounting Review 71(2): 161—182.
Ohlson, J. A. (1995). Eamings, Book Values, and Dividends in Equity Valuation, Contemporary
Accounting Research 11(2): 661—687.
OTP Banka Slovensko (2009). Annual report 2009, Report.

References 29
Park, M. S., T., P. and Park, B. T. (1999). Fair Value Disclosures for Investment Securities and
Bank Equity: Evidence from SFAS No. 115, Journal of Accounting, Auditing and Finance
14(3): 347—370.
Petersen, M. A. (2009). Estimating Standard Errors in Finance Panel Data Sets: Comparing
Approaches, Review of Financial Studies 22(1): 435—480.
Petroni, K. R. and Wahlen, J. M. (1995). Fair Values of Equity and Debt Securities and Share
Prices of Property-Liability Insurers, Journal of Risk and Insurance 62(4): 719—737.
Plantin, G., Sapra, H. and Shin, H. S. (2008). Fair value accounting and financial stability,
Research Paper 08-15, The University of Chicago Graduate School of Business.
Simko, P. J. (1999). Financial Instrument Fair Values and Nonfinancial Firms, Journal of
Accounting, Auditing and Finance 14(3): 247—274.
Song, C. J., Thomas, W. B. and Yi, H. (2010). Value Relevance of FAS No. 157 FairValue Hier-
archy Information and the Impact of Corporate Governance Mechanisms, The Accounting
Review 85(4): 1375—1410.
Whittington, G. (2008). Fair Value and the IASB/FASB Conceptual Framework Project: An
Alternative View, Abacus 44(2): 139—168.

Tables 30
Table 1: Sample Selection
2006 2007 2008 2009 2010 TotalInclude all publicly traded European banks from Bankscope and Datastream: 273 273 273 273 273 1365
Exclude banks without available reports 40 29 25 26 41 161Exclude NonIFRS banks 47 46 47 44 41 225Exclude banks not reporting on 31st December 6 7 7 6 4 30Exclude banks not disclosing fair value levels 175 178 153 5 2 513Exclude banks with missing data on market capitalization 7 15 22Exclude outliers 1 3 2 6
Final Sample 5 13 40 182 168 408
This table depicts the sample select ion process. First, both BvD Bankscope and T homson Reuters Datastream were used to identify all publiclytraded European (EU 27 + EFT A) banks. Then, all firmyears without readily available reports were excluded. Based on the reports all banks notreporting on 31st December and firmyears without fair value level disclosures were eliminated. In a final step, I excluded firmyears with missingdata on market capitalizat ion and outliers.

Tables 31
Table 2: Descripitive Statistics
Panel A: Absolute Value (in billions of Euros)
Mean Std. Dev.25th
Percentile50th
Percentile75th
PercentileObs.
(firmyears)MVE 7.910 17.577 0.247 1.286 5.327 408Total Assets 195.168 440.226 2.937 14.488 120.682 408BVE 8.997 18.831 0.224 1.179 6.910 408NFVA 113.181 229.941 1.988 9.655 92.090 408NFVL 131.723 272.802 2.256 11.260 99.512 408FVA1 27.557 75.259 0.196 1.606 10.142 408FVA2 51.361 167.343 0.045 0.721 10.449 408FVA3 3.069 10.004 0.002 0.044 0.453 408FVL1 8.167 39.076 0.000 0.001 0.759 408FVL2 44.485 144.779 0.005 0.339 5.442 408FVL3 1.796 6.235 0.000 0.000 0.068 408NI 0.533 2.858 0.008 0.062 0.362 408
Panel B: Relative Value
Mean Std. Dev.25th
Percentile50th
Percentile75th
PercentileObs.
(firmyears)BVE / Total Assets 0.108 0.135 0.053 0.071 0.098 408NFVA / Total Assets 0.739 0.208 0.613 0.799 0.893 408NFVL / Total Assets 0.780 0.203 0.715 0.863 0.914 408FVA1 / Total Assets 0.126 0.126 0.044 0.091 0.161 408FVA2 / Total Assets 0.111 0.148 0.013 0.054 0.141 408FVA3 / Total Assets 0.024 0.096 0.000 0.003 0.012 408FVL1 / Total Assets 0.016 0.052 0.000 0.000 0.011 408FVL2 / Total Assets 0.081 0.141 0.002 0.015 0.106 408FVL3 / Total Assets 0.015 0.103 0.000 0.000 0.001 408NI / Total Assets 0.008 0.108 0.002 0.005 0.009 408
Panel C: Value per Share
Mean Std. Dev.25th
Percentile50th
Percentile75th
PercentileObs.
(firmyears)Share Price 18.001 26.662 3.341 8.015 21.767 408NFVA / Number of Shares 218.791 350.402 27.362 99.247 251.042 408NFVL / Number of Shares 248.773 410.137 29.700 102.286 298.553 408FVA1 / Number of Shares 39.815 84.077 2.034 13.386 33.115 408FVA2 / Number of Shares 56.618 199.090 0.766 6.526 31.135 408FVA3 / Number of Shares 6.821 33.569 0.018 0.357 2.204 408FVL1 / Number of Shares 7.891 42.601 0.000 0.012 2.123 408FVL2 / Number of Shares 40.815 157.519 0.097 2.147 18.545 408FVL3 / Number of Shares 3.253 20.828 0.000 0.000 0.096 408NI / Number of Shares 2.054 7.622 0.108 0.570 1.733 408
This table presents descriptive statistics for the whole sample of banks from 2006 to 2010. Panel A reportsabsolute values in billions of Euros, Panel B relat ive values in per cent of total assets, and Panel C values pershare. MVE (Share Price) is the market value of equity (share price) three months after fiscal year end. BVErepresents the book value of equity. NFVA (NFVL) is nonfair value assets (liabilites). FVA1 (FVL1), FVA2(FVL2), and FVA3 (FVL3) represent fair value assets (liabilities) of the three IFRS 7 hierarchy levels. NI is netincome.

Tables 32
Table 3: Value Relevance of Fair Value Assets and Liabilities
Dependent Variable: Share Price (fiscal year end + three months)
CoefficientRobust
Std. Errortstat
(coeff.=0) pvaluetstat
(|coeff.|=1) pvalueIntercept 7.071 1.215 5.818 0.000NFVA 0.561 0.146 3.845 0.000NFVL 0.585 0.157 3.719 0.000FVA1 0.687 0.151 4.547 0.000 2.068 0.039FVA2 0.690 0.160 4.302 0.000 1.930 0.054FVA3 0.321 0.160 2.005 0.046 4.237 0.000FVL1 0.633 0.154 4.120 0.000 2.393 0.017FVL2 0.700 0.160 4.370 0.000 1.874 0.062FVL3 0.390 0.168 2.327 0.020 3.634 0.000NI 0.065 0.076 0.847 0.397Adj. R² 0.484Obs. 408Comparison Fstat pvalueFVA1=FVA2 0.013 0.910FVA1=FVA3 58.205 0.000FVA2=FVA3 49.620 0.000FVL1=FVL2 2.334 0.127FVL1=FVL3 12.145 0.001FVL2=FVL3 18.906 0.000
The table presents OLS coefficient estimates, standard errors, tstats, and pvalues. The comparison section tests for significant differences between the OLS coefficient estimates of fair value assets (liabilities) of different measurement levels. The sample period spansfrom 2006 to 2010. NFVA (NFVL) is nonfair value assets (liabilites). FVA1 (FVL1), FVA2 (FVL2), and FVA3 (FVL3) represent fairvalue assets (liabilities) of the three IFRS 7 hierarchy levels. NI is the net income. All variables are on a per share basis. The standarderrors are clustered to control for fixed effects (Petersen (2009)).

Tables 33
Table 4: Value Relevance of Fair Value Assets and Liabilities: EU15 and other European Banks
Dependent Variable: Share Price (fiscal year end + three months)
Panel A: EU 15 Banks
CoefficientRobust
Std. Errortstat
(coeff.=0) pvaluetstat
(|coeff.|=1) pvalueIntercept 3.315 1.003 3.304 0.001NFVA 1.058 0.121 8.733 0.000NFVL 1.097 0.126 8.703 0.000FVA1 1.082 0.112 9.697 0.000 0.737 0.462FVA2 1.219 0.154 7.933 0.000 1.426 0.155FVA3 0.544 0.273 1.996 0.047 1.673 0.095FVL1 1.070 0.108 9.947 0.000 0.647 0.518FVL2 1.205 0.151 7.994 0.000 1.359 0.175FVL3 0.738 0.171 4.325 0.000 1.536 0.126NI 0.274 0.138 1.984 0.048
Adj. R² 0.760Obs. 269Comparison Fstat pvalueFVA1=FVA2 34.287 0.000FVA1=FVA3 32.045 0.000FVA2=FVA3 41.282 0.000FVL1=FVL2 18.591 0.000FVL1=FVL3 11.143 0.001FVL2=FVL3 17.574 0.000
Panel B: Other European Banks
CoefficientRobust
Std. Errortstat
(coeff.=0) pvaluetstat
(|coeff.|=1) pvalueIntercept 10.537 1.653 6.373 0.000NFVA 0.275 0.079 3.458 0.001NFVL 0.277 0.088 3.162 0.002FVA1 0.448 0.087 5.164 0.000 6.352 0.000FVA2 0.342 0.095 3.596 0.000 6.911 0.000FVA3 0.005 0.133 0.038 0.970 7.542 0.000FVL1 1.517 0.237 6.403 0.000 10.624 0.000FVL2 0.558 0.088 6.343 0.000 5.020 0.000FVL3 0.048 0.120 0.402 0.689 7.929 0.000NI 0.113 0.101 1.118 0.266Adj. R² 0.600Obs. 139Comparison Fstat pvalueFVA1=FVA2 4.327 0.039FVA1=FVA3 27.430 0.000FVA2=FVA3 16.062 0.000FVL1=FVL2 65.953 0.000FVL1=FVL3 31.985 0.000FVL2=FVL3 17.640 0.000
This table represents the OLS regression results for two subsamples. Panel A includes all banks in EU 15 states while Panel B comprises allother European banks, i.e. banks from new EU member states and EFTA states. The sample period spans from 2006 to 2010. NFVA(NFVL) is nonfair value assets (liabilites). FVA1 (FVL1), FVA2 (FVL2), and FVA3 (FVL3) represent fair value assets (liabilities) of thethree different hierarchy levels. NI is the net income. All variables are on a per share basis. The standard errors are clustered to control forfixed effects (Petersen (2009)).
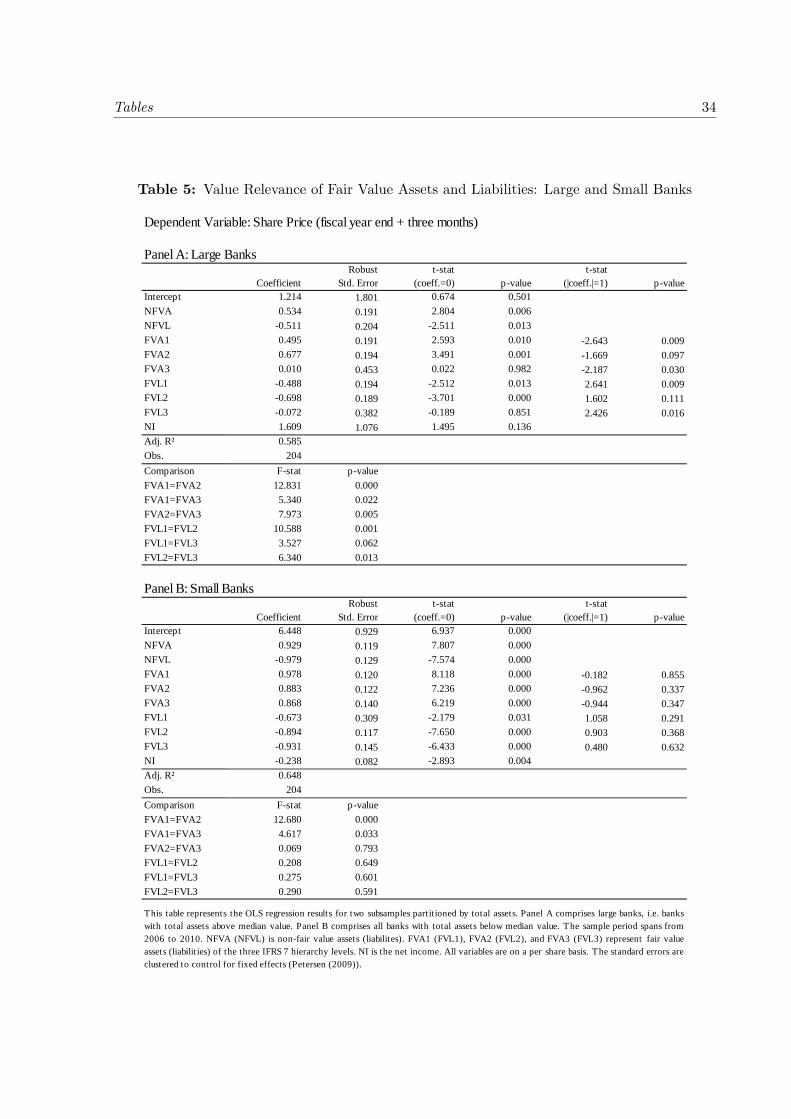
Tables 34
Table 5: Value Relevance of Fair Value Assets and Liabilities: Large and Small Banks
Dependent Variable: Share Price (fiscal year end + three months)
Panel A: Large Banks
CoefficientRobust
Std. Errortstat
(coeff.=0) pvaluetstat
(|coeff.|=1) pvalueIntercept 1.214 1.801 0.674 0.501NFVA 0.534 0.191 2.804 0.006NFVL 0.511 0.204 2.511 0.013FVA1 0.495 0.191 2.593 0.010 2.643 0.009FVA2 0.677 0.194 3.491 0.001 1.669 0.097FVA3 0.010 0.453 0.022 0.982 2.187 0.030FVL1 0.488 0.194 2.512 0.013 2.641 0.009FVL2 0.698 0.189 3.701 0.000 1.602 0.111FVL3 0.072 0.382 0.189 0.851 2.426 0.016NI 1.609 1.076 1.495 0.136Adj. R² 0.585Obs. 204Comparison Fstat pvalueFVA1=FVA2 12.831 0.000FVA1=FVA3 5.340 0.022FVA2=FVA3 7.973 0.005FVL1=FVL2 10.588 0.001FVL1=FVL3 3.527 0.062FVL2=FVL3 6.340 0.013
Panel B: Small Banks
CoefficientRobust
Std. Errortstat
(coeff.=0) pvaluetstat
(|coeff.|=1) pvalueIntercept 6.448 0.929 6.937 0.000NFVA 0.929 0.119 7.807 0.000NFVL 0.979 0.129 7.574 0.000FVA1 0.978 0.120 8.118 0.000 0.182 0.855FVA2 0.883 0.122 7.236 0.000 0.962 0.337FVA3 0.868 0.140 6.219 0.000 0.944 0.347FVL1 0.673 0.309 2.179 0.031 1.058 0.291FVL2 0.894 0.117 7.650 0.000 0.903 0.368FVL3 0.931 0.145 6.433 0.000 0.480 0.632NI 0.238 0.082 2.893 0.004Adj. R² 0.648Obs. 204Comparison Fstat pvalueFVA1=FVA2 12.680 0.000FVA1=FVA3 4.617 0.033FVA2=FVA3 0.069 0.793FVL1=FVL2 0.208 0.649FVL1=FVL3 0.275 0.601FVL2=FVL3 0.290 0.591
This table represents the OLS regression results for two subsamples partitioned by total assets. Panel A comprises large banks, i.e. bankswith total assets above median value. Panel B comprises all banks with total assets below median value. The sample period spans from2006 to 2010. NFVA (NFVL) is nonfair value assets (liabilites). FVA1 (FVL1), FVA2 (FVL2), and FVA3 (FVL3) represent fair valueassets (liabilit ies) of the three IFRS 7 hierarchy levels. NI is the net income. All variables are on a per share basis. The standard errors areclustered to control for fixed effects (Petersen (2009)).

Tables 35
Table6:ValueRelevanceofFairValueAssetsandLiabilities:EffectsofReclassificationandRegulatoryCapital
Dep
ende
nt V
ariab
le: S
hare
Pric
e (fi
scal
year
end
+ th
ree
mon
ths)
Coe
ff.
Rob
ust
Std.
Err
ort
stat
(coe
ff.=
0)p
valu
eC
oeff
.R
obus
tSt
d. E
rror
tst
at(c
oeff
.=0)
pva
lue
Coe
ff.
Rob
ust
Std.
Err
ort
stat
(coe
ff.=
0)p
valu
eC
oeff
.R
obus
tSt
d. E
rror
tst
at(c
oeff
.=0)
pva
lue
Inte
rcep
t8.
014
1.64
34.
878
0.00
08.
069
1.50
15.
375
0.00
07.
033
1.59
54.
410
0.00
07.
935
1.40
25.
660
0.00
0N
FVA
0.54
90.
142
3.86
60.
000
0.55
00.
143
3.83
80.
000
0.80
70.
153
5.26
10.
000
0.88
30.
129
6.84
90.
000
NFV
L0
.573
0.15
23
.760
0.00
00
.574
0.15
43
.730
0.00
00
.856
0.16
45
.227
0.00
00
.927
0.13
56
.864
0.00
0FV
A1
0.64
50.
154
4.19
50.
000
0.64
80.
158
4.10
50.
000
1.01
70.
155
6.56
30.
000
0.99
20.
132
7.51
50.
000
FVA
1 *
Rec
lass
Ass
ets
0.08
00.
091
0.87
30.
383
0.08
30.
086
0.95
90.
338
0.09
30.
099
0.93
40.
351
FVA
1 *
Low
Tie
r1R
atio
0.1
410.
079
1.7
840.
075
0.0
480.
090
0.5
360.
593
FVA
1 *
Rec
lass
Ass
ets
* Lo
wT
ier1
Rat
io0
.140
0.11
61
.211
0.22
7FV
A2
0.67
70.
156
4.34
30.
000
0.67
90.
157
4.31
60.
000
0.94
40.
172
5.48
20.
000
0.92
40.
155
5.95
50.
000
FVA
2 *
Rec
lass
Ass
ets
0.00
30.
040
0.08
40.
933
0.0
070.
041
0.1
790.
858
0.10
70.
038
2.80
70.
005
FVA
2 *
Low
Tie
r1R
atio
0.05
30.
022
2.39
10.
017
0.18
60.
055
3.41
00.
001
FVA
2 *
Rec
lass
Ass
ets
* Lo
wT
ier1
Rat
io0
.182
0.04
34
.231
0.00
0FV
A3
0.33
60.
161
2.08
30.
038
0.34
20.
158
2.16
60.
031
0.56
90.
132
4.29
80.
000
0.69
50.
099
7.02
80.
000
FVA
3 *
Rec
lass
Ass
ets
0.00
50.
135
0.04
00.
968
0.0
390.
239
0.1
650.
869
0.2
790.
348
0.8
020.
423
FVA
3 *
Low
Tie
r1R
atio
0.3
150.
226
1.3
920.
165
0.07
90.
071
1.10
60.
270
FVA
3 *
Rec
lass
Ass
ets
* Lo
wT
ier1
Rat
io0.
340
0.46
10.
737
0.46
2FV
L10
.670
0.15
44
.361
0.00
00
.669
0.15
44
.337
0.00
00
.809
0.19
44
.181
0.00
00
.837
0.18
24
.603
0.00
0FV
L20
.693
0.14
94
.652
0.00
00
.692
0.15
14
.598
0.00
00
.974
0.17
05
.736
0.00
01
.044
0.15
86
.621
0.00
0FV
L30
.406
0.16
72
.434
0.01
50
.411
0.16
52
.496
0.01
30
.629
0.15
34
.112
0.00
00
.777
0.11
26
.951
0.00
0N
I0
.062
0.07
70
.809
0.41
90
.053
0.05
90
.900
0.36
90
.029
0.07
70
.377
0.70
70
.021
0.07
60
.274
0.78
5R
ecla
ssA
sset
sFV
BV
2.9
354.
737
0.6
200.
536
Rec
lass
Ass
ets
3.1
881.
581
2.0
160.
044
3.3
791.
267
2.6
670.
008
1.5
821.
334
1.1
860.
237
Low
Tie
r1R
atio
0.2
501.
671
0.1
500.
881
3.6
931.
878
1.9
670.
050
Rec
lass
Ass
ets
* Lo
wT
ier1
Rat
io0
.130
2.73
00
.048
0.96
2A
dj. R
²0.
475
0.47
50.
578
0.60
6O
bs.
390
390
339
322
Rec
lass
ifica
tion
and
Reg
ulat
ory
Cap
ital
Rec
lass
ifica
tion
Rec
lass
ifica
tion
and
Diff
eren
ce o
f Fai
rV
alue
s an
d B
ook
Val
ues
Reg
ulat
ory
Cap
ital
Thi
sta
ble
pres
ents
OLS
resu
ltsof
four
regr
essio
nm
odel
s.T
hese
mod
els
are
base
don
the
basic
regr
essio
nm
odel
(Equ
atio
n3)
.NFV
A(N
FVL)
isno
nfa
irva
lue
asse
ts(li
abili
tes)
.FVA
1(F
VL1)
,FVA
2(F
VL2)
,and
FVA
3(F
VL3)
repr
esen
tfai
rval
ueas
sets
(liab
ilitie
s)of
the
thre
eIF
RS7
hier
arch
yle
vels.
NIi
sth
ene
tin
com
e.T
hest
anda
rder
rors
are
clus
tere
dto
cont
rolf
orfix
edef
fect
s(Pe
ters
en(2
009)
).M
odel
1in
clud
esth
edu
mm
yva
riabl
eRe
clas
sAss
ets
whic
his
one
forb
anks
with
recl
assif
ied
finan
cial
asse
tsan
dze
root
herw
ise.M
odel
2is
base
don
mod
el1
and
incl
udes
ath
eva
riabl
eRe
clas
sAss
etsF
VBV
whic
his
the
diff
eren
cebe
twee
nth
efa
irva
lue
and
the
book
valu
eof
recl
assif
ied
finan
cial
asse
ts.I
nm
odel
3th
edu
mm
yRe
clas
sAss
etsi
srep
lace
dby
the
dum
my
LowT
ier1
Ratio
.Low
Tie
r1Ra
tiois
one
ifa
bank
has
abe
low
med
ian
Tie
r1
capi
talr
atio
and
zero
othe
rwise
.Mod
el4
incl
udes
both
Recl
assA
sset
sand
LowT
ier1
Ratio
.All
dum
my
varia
bles
are
inte
ract
edwi
thth
efa
irva
lue
asse
tsof
allt
hree
leve
ls.T
hesa
mpl
epe
riod
for
mod
els1
,2,a
nd4
span
sfr
om20
08to
2010
beca
use
the
addi
tiona
lrec
lass
ifica
tion
optio
nswe
rein
trod
uced
in20
08. F
or m
odel
s 3 a
nd 4
I ex
clud
e al
l ban
kye
ars f
rom
the
sam
ple
with
out d
ata
on T
ier 1
cap
ital r
atio
.

Tables 36
Table 7: Value Relevance of Fair Value Assets and Liabilities: Robustness Checks
Dependent Variable: Market Value of Equity (fiscal year end + three months)
Panel A: Deflator Book Value of Equity
CoefficientRobust
Std. Errortstat
(coeff.=0) pvaluetstat
(|coeff.|=1) pvalueIntercept 0.641 0.119 5.394 0.000NFVA 0.347 0.098 3.554 0.000NFVL 0.352 0.098 3.595 0.000FVA1 0.469 0.090 5.214 0.000 5.911 0.000FVA2 0.353 0.121 2.918 0.004 5.348 0.000FVA3 0.061 0.077 0.789 0.430 12.145 0.000FVL1 0.531 0.165 3.213 0.001 2.841 0.005FVL2 0.297 0.095 3.114 0.002 7.389 0.000FVL3 0.117 0.069 1.699 0.090 12.795 0.000NI 0.011 0.082 0.133 0.894Adj. R² 0.130Obs. 408Comparison Fstat pvalueFVA1=FVA2 15.560 0.000FVA1=FVA3 8.911 0.003FVA2=FVA3 4.250 0.040FVL1=FVL2 12.102 0.001FVL1=FVL3 7.974 0.005FVL2=FVL3 1.981 0.160
Panel B: Deflator Market Value of Equity (WLS approach of Easton and Sommers (2003))
CoefficientRobust
Std. Errortstat
(coeff.=0) pvaluetstat
(|coeff.|=1) pvalueIntercept 0.001 0.003 0.317 0.751NFVA 0.423 0.101 4.195 0.000NFVL 0.435 0.105 4.127 0.000FVA1 0.473 0.101 4.699 0.000 5.232 0.000FVA2 0.394 0.124 3.175 0.002 4.882 0.000FVA3 0.340 0.080 4.277 0.000 8.295 0.000FVL1 0.381 0.081 4.688 0.000 7.631 0.000FVL2 0.389 0.128 3.039 0.003 4.765 0.000FVL3 0.340 0.085 4.010 0.000 7.789 0.000NI 0.058 0.060 0.971 0.332Adj. R² 0.491Obs. 408Comparison Fstat pvalueFVA1=FVA2 21.040 0.000FVA1=FVA3 19.806 0.000FVA2=FVA3 2.588 0.108FVL1=FVL2 0.071 0.790FVL1=FVL3 1.032 0.310FVL2=FVL3 2.315 0.129
This table represents the results of the robustness checks. Following the long standing debate about the appropriate deflator in marketbased accounting research I replace the number of shares outstanding by book value of equity (Panel A) and market value of equity (PanelB). As Easton and Sommers (2003) argue, deflating by market value of equity can be done by using a WLS regression. Accordingly, PanelA reports OLS regression results while Panel B reports WLS regression results. The sample period spans from 2006 to 2010. NFVA(NFVL) is nonfair value assets (liabilites). FVA1 (FVL1), FVA2 (FVL2), and FVA3 (FVL3) represent fair value assets (liabilit ies) of thethree IFRS 7 hierarchy levels. NI is the net income. The standard errors are clustered to control for fixed effects (Petersen (2009)).

AuthorPatrick BOSCHPhD Candidate, Chair of Finance and Accounting, University of Fribourg / Switzerland, Bd. de Pérolles 90, CH-1700 Fribourg, Tel.: +41 26 300 8289, Fax: +41 26 300 9659, Email: [email protected].
Abstract According to IFRS 7, banks have to disclose the inputs used in measuring the fair value of financial instruments. For this purpose the standard defines a three-level measurement hierarchy. The reliability of fair values is expected to decrease with decreasing hierarchy level due to the lower quality of the input factors. Using a value relevance research setting, I find that investors perceive the reliability of level 3 fair values as significantly lower than the reliability of level 1 fair values. However, in contrast to expectations, level 2 fair values are not perceived as less reliable. Thus, investors only doubt the reliability of fair values whose inputs are based on discretionary assumptions. Additionally, this paper analyses the impact of the reclassification of financial assets and of the regulatory capital ratio on the reliability of fair values. While I find a weakly significant impact of the regulatory capital ratio, the reclassification has in general no influence on the reliability of reported fair values. KeywordsFair Value Hierarchy, Reclassification, Reliability, Value Relevance JEL Classification C23, G14, G21, M41 Citation proposalBosch Patrick. 2012 «Value Relevance of the Fair Value Hierarchy of IFRS 7 in Europe - How reliable are mark-to-model Fair Values?». Working Papers SES 439, Faculty of Economics and Social Sciences, University of Fribourg (Switzerland)
Working Papers SESLast published : 427 Wallmeier M.: Smile in Motion: An Intraday Analysis of Asymmetric Implied Volatility; 2012428 Isakov D., Weisskopf J.-P.: Are Founding Families Special Blockholders? An Investigation of
Controlling Shareholder Influence on Firm Performance; 2012429 Gmür M.: Werden Frauen und Männer in NPO gleich bezahlt?; 2012430 Reiser H., Gmür M.: Selbstverwaltete Betriebe zwischen Tradition und Markt; 2012431 Bürgisser S.: Zusammenarbeit zwischen Vorstand und Geschäftsführung in Verbänden und andere
Nonprofit Organisationen; 2012432 Gmür M., Ribi Y.: Erfolgsfaktoren der Mitgliederbindung in Berufsverbänden; 2012433 Wallmeier M., Tauscher K.: A Note on the Impact of Portfolio Overlapping in Tests of the Fama and
French Three-Factor Model; 2012434 Gmür M., Gmür M.: Bezahlte Freiwilligenarbeit - ein Widerspruch?; 2012435 Gmür M., Wolf M., Schafer J.: Professionelles Management und Zielerreichung im Verein; 2012436 Felbermayr G., Grossmann V., Kohler W.: Migration, International Trade and Capital Formation:
Cause or Effect?; 2012437 Schafer J.: Erfolgsfaktoren der Nachwuchsförderung in Sportverbänden; 2012438 Zeides R., Gmür M.: Management Excellence in Pflegeeinrichtungen; 2012
Catalogue and download links:http://www.unifr.ch/ses/wphttp://doc.rero.ch/collection/UNIFR_WORKING_PAPERS_SES