value of lbd recreation - department of water
TRANSCRIPT

The value of recreation at
Logue Brook Dam
Prepared for the Department of Water
June 2006

© ACIL Tasman Pty Ltd
This work is copyright. The Copyright Act 1968 permits fair dealing for study, research, news reporting, criticism or review. Selected passages, tables or diagrams may be reproduced for such purposes provided acknowledgment of the source is included. Permission for any more extensive reproduction must be obtained from ACIL Tasman on (03) 9600 3144.
Reliance and Disclaimer
The professional analysis and advice in this report has been prepared by ACIL Tasman for the exclusive use of the party or parties to whom it is addressed (the addressee) and for the purposes specified in it. This report is supplied in good faith and reflects the knowledge, expertise and experience of the consultants involved. The report must not be published, quoted or disseminated to any other party without ACIL Tasman’s prior written consent. ACIL Tasman accepts no responsibility whatsoever for any loss occasioned by any person acting or refraining from action as a result of reliance on the report, other than the addressee.
In conducting the analysis in this report ACIL Tasman has endeavoured to use what it considers is the best information available at the date of publication, including information supplied by the addressee. Unless stated otherwise, ACIL Tasman does not warrant the accuracy of any forecast or prediction in the report. Although ACIL Tasman exercises reasonable care when making forecasts or predictions, factors in the process, such as future market behaviour, are inherently uncertain and cannot be forecast or predicted reliably.
ACIL Tasman shall not be liable in respect of any claim arising out of the failure of a client investment to perform to the advantage of the client or to the advantage of the client to the degree suggested or assumed in any advice or forecast given by ACIL Tasman.
ACIL Tasman Pty Ltd ABN 68 102 652 148 Internet www.aciltasman.com.au
Melbourne Level 6, 224-236 Queen Street Melbourne VIC 3000
Telephone (+61 3) 9600 3144 Facsimile (+61 3) 9600 3155 Email [email protected]
Canberra 103-105 Northbourne Avenue Turner ACT 2612 GPO Box 1322 Canberra ACT 2601
Telephone (+61 2) 6249 8055 Facsimile (+61 2) 6249 7455 Email [email protected]
Brisbane Level 15, 127 Creek Street Brisbane QLD 4000 GPO Box 32 Brisbane QLD 4001
Telephone (+61 7) 3236 3966 Facsimile (+61 7) 3236 3499 Email [email protected]
Sydney PO Box 170 Northbridge NSW 1560
Telephone (+61 2) 9958 6644 Facsimile (+61 2) 8080 8142 Email [email protected]
Perth Level 12, 191 St Georges Terrace Perth WA 6000 PO Box 7035 Cloisters Square Perth WA 6850
Telephone (+61 8) 9485 0300 Facsimile (+61 8) 9485 0500 Email [email protected]
Darwin Telephone (+61 8) 8927 8237 Email [email protected]
For information on this report
Please contact:
Antonia Hodby
Telephone (08) 9485 0300
Mobile 0404 822 301
Email [email protected]

The value of recreation at Logue Brook Dam
iii
Contents
1 Introduction 1
2 Recreation and tourism at Logue Brook Dam 1 2.1 Recreational activities 1 2.2 Infrastructure 2 2.3 Visitor trends 3 2.4 Visitor numbers 4
3 Social and economic description 5
4 Economic impact of recreation 6 4.1.1 Visitor expenditure at Logue Brook Dam 6 4.1.2 Value of expenditure 8 4.1.3 Employment 9
5 Value of recreational demand 9 5.1 Consumer surplus 9 5.2 Travel cost method 10 5.3 Previous studies 12
5.3.2 Value of Logue Brook Dam based on Lucas estimates 15 5.3.3 Other studies 15
6 Conclusion 18
A Visitor expenditure assumptions 20
Boxes, charts, figures and tables
Figure 1 Visitors by month to Logue Brook Dam 4
Figure 2 Measuring consumer surplus 10
Table 1 Estimated visitor numbers at Logue Brook Dam 4
Table 2 Estimated overnight visitor numbers at Logue Brook Dam 5
Table 3 Estimated expenditure by visitors to the Logue Brook Dam 8
Table 4 Estimates of consumer surplus of recreational activity at Logue Brook Dam 13
Table 5 Present values of total recreational benefits for Logue Brook Dam 14
Table 6 Present values of total recreational benefits for Logue Brook Dam: selected discount rates (1991 dollars) 14
Table 7 Comparison of estimates of individual consumer surplus 15
Table 8 Average consumer surplus values per activity per day per person from recreation demand studies – 1967 to 1998 (2005 A$) 17
Table 9 Expenditure assumptions (excluding accommodation) based on visitor group 20

The value of recreation at Logue Brook Dam
Introduction 1
1 Introduction
This report on the value of recreation at Logue Brook Dam has been prepared
by ACIL Tasman for the Department of Water. The report provides estimates
of the economic value of recreation using an update of a travel cost analysis of
recreational demand carried out by Lucas (1991)1. It also provides an estimate
of the economic impact of visitors to the dam on the local economy. The
economic value of the dam is an estimation of the value a person places on
having access to that resource whilst the economic impact is the economic
activity generated by spending at and around the resource.
The economic impact of recreation at Logue Brook Dam can be measured by
the amount of expenditure by visitors to the dam on goods and services in the
local economy. The economic value of the dam is estimated by adjusting the
Lucas results to 2005 dollars and comparing them with similar studies carried
out elsewhere. This report should not be interpreted as a critique of the Lucas
study.
Logue Brook Dam is located in the Shire of Harvey approximately 120
kilometres south of Perth. The current primary uses of the dam are irrigation
and recreation.
This report focuses on the economic and social value of recreation in and
around the Logue Brook Dam. All recreation activities within a two kilometre
radius of Logue Brook Dam have been considered in this analysis as this is the
approximate area that would become inaccessible should recreation activities
be excluded from the dam.
2 Recreation and tourism at Logue Brook Dam
2.1 Recreational activities
Logue Brook Dam is a popular recreation area for day trippers and overnight
visitors. The dam and surrounding forest offer a number of recreation
activities including:
• Land based activities
– Cycling – Munda Biddi trail
1 Lucas, S. (1991). An Estimation of the Economic Benefits of Recreation Activities Occurring
at Waroona and Logue Brook Reservoirs, Phase 2 Supplementary Paper No. 1 South West Irrigation Strategy Study, Water Authority of Western Australia.
The value of recreation at Logue Brook Dam
Recreation and tourism at Logue Brook Dam 2
– Bushwalking – unmarked and marked trails
– Sightseeing by vehicle along the many tracks around the dam
– Horse riding
– Picnics and barbeques
– Camping and caravanning
– Off road motorcycle and four wheel driving
• Water based activities
– Water skiing – there is a gazetted water skiing area preventing skiers from going too close to the dam wall and outlet tower. There is also a recommended skiing route.
– Canoeing
– Sailing and windsurfing
– Swimming
– Marroning and fishing – the marron season is regulated by the Department of Fisheries. There are bag limits and regulations for trout fishing which are managed by the Department of Fisheries.
Activities further afield include the towns along the South West Highway and
the growing number of tourist related activities along this route including
wineries, historic sights, cheese factory, and nature-based activities (including
the nearby Harvey, Waroona and Drakesbook dams).
2.2 Infrastructure
There is a good level of public infrastructure that supports recreation at the
dam. This includes:
• Tracks to allow vehicles access to the dam and forest
• Boat ramp
• Picnicking facilities including tables, barbeques, a gazebo
• Marked walking trails including supporting information boards
• Lookout
• Munda Biddi bicycle trail
• Public toilets.
There are also several privately owned businesses which are used by those
participating in recreation activities at the dam. These include the Lake
Brockman Tourist Park (café, caravan, park home chalet and camping sites)
and Camp Logue Brook which is a 7th Day Adventist holiday camp. The
Tourist Park is the only formal area where camping is allowed however
wild/bush camping outside the Tourist Park occurs particularly in peak

The value of recreation at Logue Brook Dam
Recreation and tourism at Logue Brook Dam 3
accommodation periods. The Tourist Park collects camping fees and
maintains these sites on behalf of CALM.
2.3 Visitor trends
Consultation with key tourism stakeholders indicated that:
• The majority of visitors visit the Logue Brook area in summer to take advantage of water-based activities. However, school groups and semi-permanent residents of the Lake Brockman Tourist Park visit the area all year round
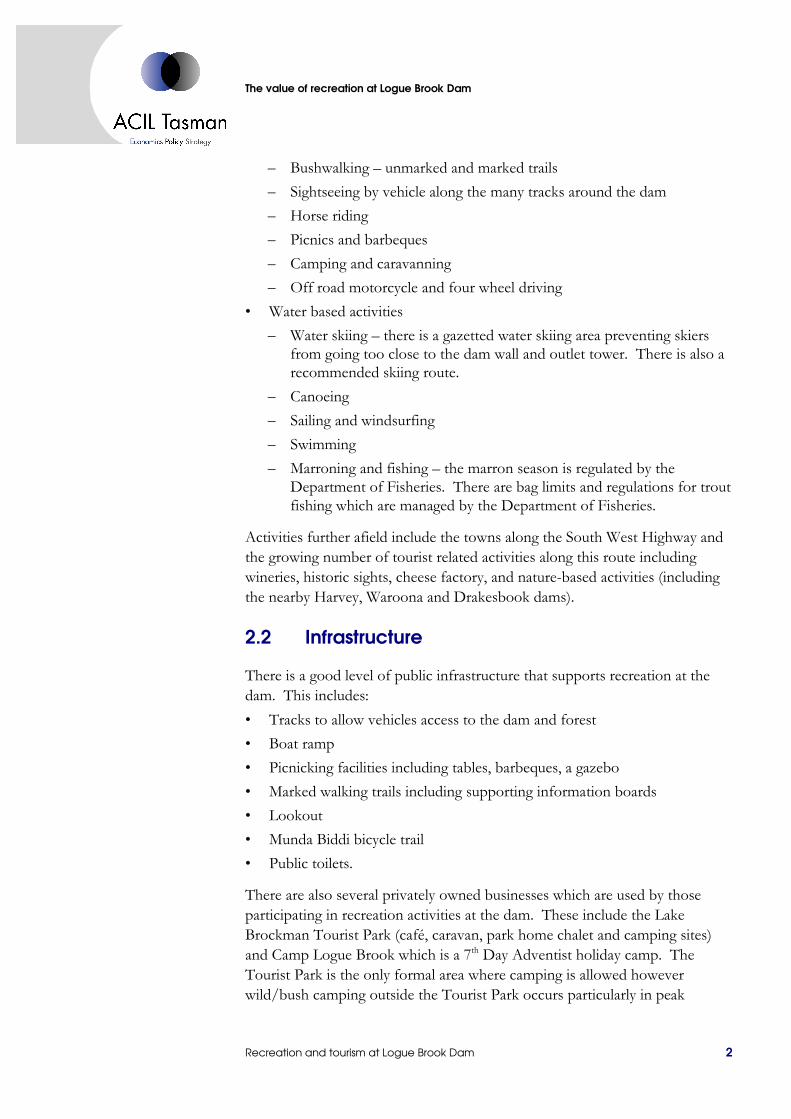
• Peak visitor times are the Christmas and New Year period and the Easter holidays as per Figure 1
• CALM estimates that two thirds of visitors stay for the day and the remainder stay overnight. However, consultation with local businesses suggested overnight visitors make up around 20 per cent of visitors
• The primary visitor groups are:
– local people who visit the area as a day trip
– families and young groups from Perth who stay overnight and sometimes longer in the school holidays
– school groups who stay from Monday to Friday (four nights)
• The primary reason for locals to visit the Logue Brook area is to swim, picnic and/or waterski
• The primary reason for overnight visitors to visit the area is to waterski, bush walk, ride off road bikes, go 4WD’ing, camp and to use the area as a base to visit the region
• The primary reason for school groups to visit the area is to use the facilities at and around Camp Logue Brook and to use the area as a base to visit the region.
There is also a growing amount of people using the Munda Biddi bicycle trail.
The value of recreation at Logue Brook Dam
Recreation and tourism at Logue Brook Dam 4
Figure 1 Visitors by month to Logue Brook Dam
0
2000
4000
6000
8000
10000
12000
14000
16000
July
Augus
t
Septe
mber
Octobe
r
Novem
ber
Decem
ber
Janu
ary
Febru
ary
Mar
chApr
ilM
ayJu
ne
Data source: There are no values associated with this figure as it is based on confidential data supplied by
Lake Brockman Tourist Park
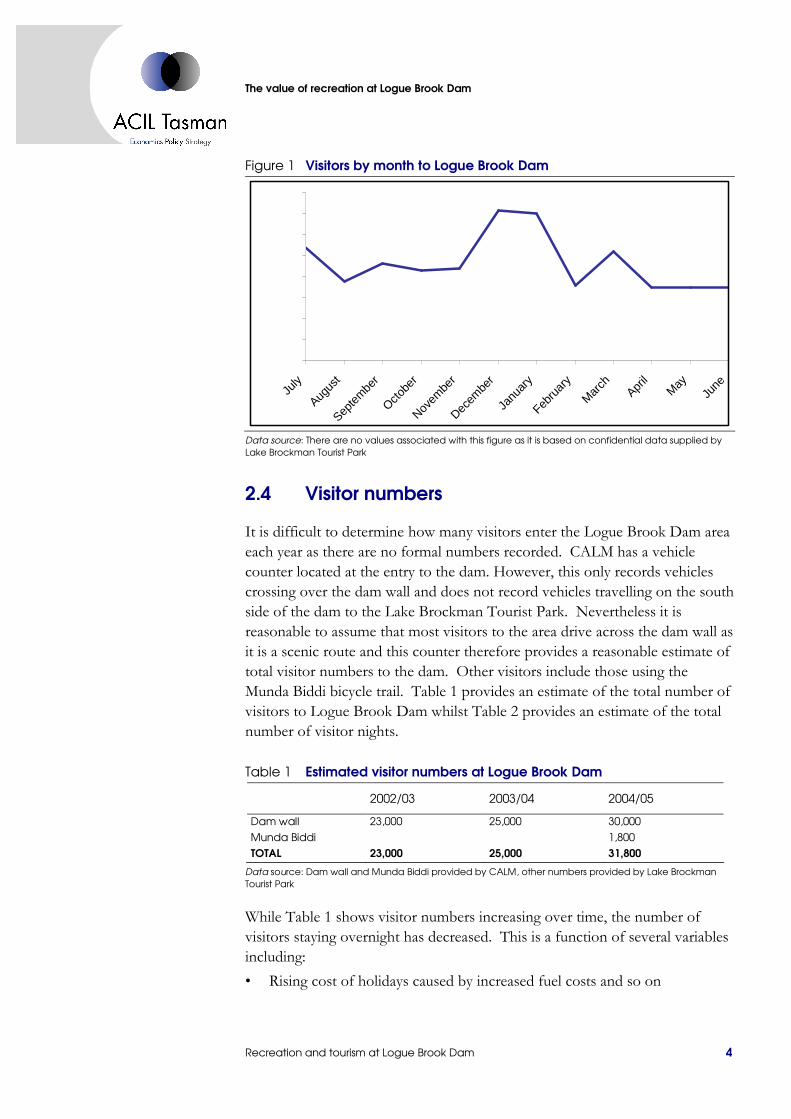
2.4 Visitor numbers
It is difficult to determine how many visitors enter the Logue Brook Dam area
each year as there are no formal numbers recorded. CALM has a vehicle
counter located at the entry to the dam. However, this only records vehicles
crossing over the dam wall and does not record vehicles travelling on the south
side of the dam to the Lake Brockman Tourist Park. Nevertheless it is
reasonable to assume that most visitors to the area drive across the dam wall as
it is a scenic route and this counter therefore provides a reasonable estimate of
total visitor numbers to the dam. Other visitors include those using the
Munda Biddi bicycle trail. Table 1 provides an estimate of the total number of
visitors to Logue Brook Dam whilst Table 2 provides an estimate of the total
number of visitor nights.
Table 1 Estimated visitor numbers at Logue Brook Dam
2002/03 2003/04 2004/05
Dam wall 23,000 25,000 30,000
Munda Biddi 1,800
TOTAL 23,000 25,000 31,800
Data source: Dam wall and Munda Biddi provided by CALM, other numbers provided by Lake Brockman
Tourist Park
While Table 1 shows visitor numbers increasing over time, the number of
visitors staying overnight has decreased. This is a function of several variables
including:
• Rising cost of holidays caused by increased fuel costs and so on

The value of recreation at Logue Brook Dam
Social and economic description 5
• Low dam water levels which have resulted in the early closure of the water ski season.
Table 2 Estimated overnight visitor numbers at Logue Brook Dam
2001 2003 2005
Lake Brockman Tourist Park 2,000 2,000 2,000
Camp Logue Brook 3,150 2,190 2,750
Wild camping 600 600 600
TOTAL 5,750 4,790 5,350
Data source: Lake Brockman Tourist Park, Camp Logue Brook
Note: the number of visitors to Camp Logue Brook increased in 2005 due to a longer water ski season
because of improved water levels.
3 Social and economic description
The Shire of Harvey is located in the South West region of Western Australia.
Both the Shire and the South West support a diverse economy and a large
population base.
In 2005 the population of the South West was estimated to be 140,846 or 7 per
cent of the population of Western Australia. This is the largest population of
any region in Western Australia. The majority of the population lives in and
around the major centres of Bunbury and Busselton on the coast and at Collie
in the Darling Range.
The population of the Shire of Harvey was estimated to be 19,669, which is the
third largest of any South West Local Government Authority behind Bunbury
and Busselton. Major towns in the Shire of Harvey include Australind, Harvey
and Brunswick whilst there are smaller populations in the towns of Benger,
Binningup, Cookernup, Myalup, Roelands, and Wokalup.
The South West has the largest Gross Regional Product of any region valued at
$6.8 billion in 2004/05. This contribution is a reflection of the sophisticated
nature of the economy with the agriculture, mining, retail, tourism and
construction sectors providing a valuable source of employment and economic
activity.
The Shire of Harvey has a number of industries which provide a significant
contribution to the South West economy. These include agriculture,
agricultural processing, minerals processing and tourism.

The value of recreation at Logue Brook Dam
Economic impact of recreation 6
4 Economic impact of recreation
The tourism industry is an important component of the South West economy.
It not only provides employment for local residents, it provides an additional
economic contribution through spending on goods and services by visitors.
Around 1.7 million visitors stayed overnight in the South West in 2003/04 and
1.6 million people visited the region for a day trip. Nearly all (85%) visitors
were Western Australian. It is estimated that overnight visitors from Western
Australia stayed on average of 3.5 nights in the region spending around $608.8
million or around $358 per head.
Most tourism activity in the South West is focussed on the coastal areas and
the wine regions. Tourism activity in the Shire of Harvey is centred close to
the coast and in the Darling Range. The Darling Range and surrounds
provide a number of tourism and recreation opportunities that take advantage
of local reservoirs, the jarrah forest, historical towns, wineries, and the
Bibbulmun and Munda Biddi tracks.
The tourism industry therefore provides an important economic contribution
to the Shire of Harvey. Tourism WA2 reports that in 2004 there were 362
people employed in the tourism sector in the Shire of Harvey, which
represented 8 per cent of employed people in the Shire.
4.1.1 Visitor expenditure at Logue Brook Dam
One method for estimating the value of recreation to the local economy is to
measure its economic impact by providing an estimate of the direct and
indirect expenditure made by visitors to Logue Brook Dam on goods and
services in and around the region. In other words, this is the extra expenditure
made in the region as a result of visitors to Logue Brook Dam. Stakeholder
consultation found that the main direct expenditure for visitors to Logue
Brook Dam is:
• Accommodation
• Fuel for cars, bikes and boats
• Supplies such as food, hardware and so on
• Other expenditure such as gifts, souvenirs and meals.
Indirect expenditure includes purchases by the businesses located at Logue
Brook Dam on goods and services to maintain their business. This
expenditure may include items such as fuel, food and so on.
2 Tourism WA (2004). South West Tourism Factsheet 2004, p 15.

The value of recreation at Logue Brook Dam
Economic impact of recreation 7
Accommodation
Nearly all overnight visitors to Logue Brook Dam stay at the Lake Brockman
Tourist Park, Camp Logue Brook and at informal camp sites around the dam.
Some visitors stay at motels in Harvey and in rural accommodation
surrounding the dam, but this share of overnight visitors is thought to be low.
Fuel
Consultation suggested that most visitors to Logue Brook Dam travel to and
from the site without purchasing fuel in the surrounding area. However, those
that visit the area for an extended stay tend to purchase fuel. It is thought that
most fuel is purchased in the town of Harvey.
Significant fuel purchases are made by owners of ski boats who carry enough
fuel from Perth for one or two days skiing but require additional supplies. As
the boats require premium quality fuel, purchases are made at the BP service
station in Harvey, which is the only fuel outlet in the vicinity that carries this
product. Other fuel is purchased for fuel intensive activities such as
motorcycle riding and 4WD’ing.
Supplies
It is thought that the majority of visitors to Logue Brook Dam bring the bulk
of their food and hardware supplies with them. Local businesses report that
overnight visitors purchase “top up” supplies from supermarkets in Harvey.
The Cookernup General Store also reported sales of ice, basic foods and
hardware such as tarpaulins, fishing gear and so on.
There is some evidence that liquor is purchased from Cookernup and Harvey
however, it is thought that most visitors bring their own supplies.
Other expenditure
There is a small amount of expenditure on other activities such as at wineries,
the cheese factory, and arts and crafts. However, this value is difficult to
determine.
There is some evidence that overnight visitors to the Logue Brook Dam
purchase evening meals in restaurants and cafes in Harvey.
Indirect expenditure
Businesses located at Logue Brook Dam indicated that the majority of their
purchases were for catering purposes and were made from companies in Perth

The value of recreation at Logue Brook Dam
Economic impact of recreation 8
and Bunbury. Minor purchases such as “top up” supermarket groceries and so
on were made in Harvey. This expenditure has not been estimated as it is
considered to be small and there is a risk of double counting as it is often
already recognised in the costs of goods and services (such as accommodation
and meals) provided by these businesses.
4.1.2 Value of expenditure
Overnight visitors provided the most valuable per capita expenditure on local
goods and services through their purchase of accommodation and in some
instances purchases on other goods and services such as fuel, groceries and so
on. Per capita expenditure amongst day visitors is smaller as these visitors tend
to spend less in the region by fuelling up near their homes and bringing their
own supplies.
Whilst it is not possible to provide an exact estimation of visitor expenditure,
Table 3 provides an estimation of likely expenditure. The assumptions
underlying these calculations are listed in Appendix A.
Table 3 Estimated expenditure by visitors to the Logue Brook Dam
Overnight visitors Day visitors Total
Accommodation 144,062 0 144,062
Fuel 152,857 0 152,857
Supplies 76,429 75,571 152,000
Souvenirs etc 7,643 37,786 45,429
Meals 61,143 5,571 136,714
TOTAL 442,133 188,929 631,062
Note: Expenditure by businesses located at Logue Brook Dam have not been included in this analysis
Based on these assumptions it is thought that overnight visitors account for
around $440,000 or 70 per cent per annum of expenditure whilst day visitors
account for around $190,000 of expenditure. Total expenditure is around
$630,000 per annum equating to around $20 per person per day. In
comparison, Tourism WA3 estimates that per person expenditure on tourism
in the South West is $102 per day. The difference in values at Logue Brook
Dam and the South West is a function of the high level of day visitors to the
dam compared to the South West where most visitors are overnight visitors,
and the relatively low cost of accommodation at Camp Logue Brook and the
Lake Brockman Tourist Park compared to higher end accommodation offered
in the remainder of the Region.
3 Tourism WA (2004). South West Tourism Factsheet 2004. p 15 states that per person
expenditure is $358 over 3.5 nights

The value of recreation at Logue Brook Dam
Value of recreational demand 9
4.1.3 Employment
Employment at the businesses located at Logue Brook Dam is estimated to be
around four full time equivalent staff. This estimation is based on two staff at
Camp Logue Brook and two staff (the owners) at Lake Brockman Tourist
Park.
As the impact of visitor expenditure on local businesses located in Yarloop,
Harvey and Cookernup is relatively small compared to their overall turnover, it
is doubtful that Logue Brook Dam has an impact on employment levels at
these businesses.
5 Value of recreational demand
5.1 Consumer surplus
The monetary value an individual places on a recreation site can be measured
by the consumer surplus. In the context of this study consumer surplus is an
estimate of the welfare loss as a result of the closure of Logue Brook Dam to
recreation. This is the difference between amount the individual currently pays
to visit the dam (the market price) and the maximum amount the individual
would be willing to pay rather than forgo visiting the dam.
In other words it is the difference between the willingness to pay for a trip to
the dam (area A+B) and total trip cost (area B) in Figure 2. Figuratively, it is
the area below the demand curve (the willingness to pay for a trip) and above
the price line (the price actually paid), i.e. the shaded area A in Figure 2.
Individual consumer surpluses can be aggregated to measure the total welfare
change.4 .
4 See Chapter 9 in Boadway, R.W. and N Bruce (1984). Welfare Economics. Basil Blackwell:
Oxford, for a discussion on the aggregation of individual consumer surpluses.

The value of recreation at Logue Brook Dam
Value of recreational demand 10
Figure 2 Measuring consumer surplus
$
Consumer surplus
Demand curve
Number of visits
A
B
Recreation sites typically do not command a price in the market (i.e. they are
non-market goods) so there is a need to find an alternative means of estimating
their value. A range of techniques have been developed to provide valuations
of non-market goods and services. One such method is the travel cost method
(TCM).
In the case of recreation sites, market prices do not exist because the inputs
and outputs are not sold in the market. However, a range of techniques have
been developed to provide valuations of these non-marketed goods and
services.
5.2 Travel cost method
TCM uses the cost of travel incurred by individuals visiting a recreation site as
a measure of how much they are willing to pay (WTP) to visit the site. Travel
costs typically include fuel, entry fees, meals and accommodation and the
opportunity cost of travel time. Individual WTPs are aggregated to provide a
total valuation of the recreation site in question5.
The economic value measured by TCM is the ‘use value’. Use value relates to
actual use of the recreation site (e.g. a visit to the site), planned use (e.g. a visit
planned in the future) or possible use (the option value). The other component
of economic value is the ‘non-use’ value. The non-use value refers to the
5 The travel cost method is a prominent example of the revealed preference approach to the
valuation of environmental amenities and natural resources. The other basic approach to valuation is the stated preference method. Contingent valuation is the most notable example of this approach.

The value of recreation at Logue Brook Dam
Value of recreational demand 11
willingness to pay to maintain a recreation site in existence even though there is
no actual, planned or possible use.
Both use value and non-use value can incorporate the social benefits of
recreation. What they do not include is the intrinsic value of a recreation site.
Intrinsic value is the value residing in the site that is unrelated to human
preferences or even human observation6.
TCM exploits the basic demand relationship where the quantity demanded
varies negatively with price. People living closer to the site face a lower cost of
travelling to the site and, all else constant, therefore probably take more trips.
Two alternative methods are commonly used in the travel cost model to
measure WTP:
• The individual travel cost method uses the annual number of visits per person to the recreation site
• The zonal travel cost method measures the annual number of trips per capita from a specified geographic zone. Zones are defined by dividing the area around the site so that the average cost of travel to and from the site is the same across each zone.
The zonal model has fallen out of favour because of its lack of consistency
with basic theory. However, it has fewer data requirements and adjusts
automatically for frequency of visits by individuals. That is, zones that are
farther away from the site of interest will produce fewer trips for given
individuals and smaller frequencies of households taking trips. Nevertheless,
when data are limited, the zonal model can provide a useful approximation7.
While the individual TCM is preferable for statistical precision, the choice of
method is often dictated by the degree of variability in the number of trips
taken. The zonal model is used where it is necessary to incorporate enough
variation into the number of trips taken to be able to estimate a demand
function.
The number of visits to a site is assumed to be influenced by:
• The cost and time of travel to the site
• The quality of the recreational site
• The amount of discretionary time available to the individual
• Income
6 Pearce, D., Atkinson, G. and S Mourato (2006). Cost-Benefit Analysis and the Environment:
Recent Developments. OECD: Paris.
7 Parsons, G.R. (2003). ‘The Travel Cost Model’. Chapter 9 in Champ, P.A., Boyle, K.J. and T.C. Brown, (Eds), A Primer on Nonmarket Valuation, Dordrecht, Kluwer Academic Publishers, The Netherlands:.

The value of recreation at Logue Brook Dam
Value of recreational demand 12
• Opportunity cost of time (as reflected in the wage rate or some fraction thereof)
• Availability of substitute sites.
In its simplest form the travel cost model is a single-site model of the number
of trips to a recreation site a person makes over a year (or any other time
period). The price of the trip is the cost of reaching the site, which includes a
person’s travel expenses and the time cost of making the trip.
However, travel costs alone will not explain an individual’s demand for a
recreation site. Other factors, including demographic variables, tastes and
preferences, substitute and complementary goods, site quality and congestion,
also determine demand.
The basic TCM makes the following assumptions:
• Individual behaviour related to increasing costs of travel corresponds to the changes in demand for the activity, which would occur if process changed
• Individuals derive no utility or disutility from the time spent travelling to the site
• The purpose of the trip is to visit the site and there are no alternative recreation sites available
• All visits are assumed to involve the same amount of time at the site
• Part of the cost of travel is the opportunity cost of the individual’s time.
Data on costs and time of travel to the site and other relevant variables are
collected from individual visitors in surveys. These data are used to estimate a
demand function for recreation at the site.
5.3 Previous studies
Lucas 1991 study
The only reported study of the value of recreation at Logue Brook Dam is the
Lucas (1991) study of the economic benefits of recreation activities occurring
at Waroona and Logue Brook dams8. This study, which compared TCM (the
zonal model) and contingent valuation as techniques for valuing the
recreational benefits of the two reservoirs, found TCM to be the most
appropriate technique.
8 Lucas, S. (1991). An Estimation of the Economic Benefits of Recreation Activities Occurring
at Waroona and Logue Brook Reservoirs, Phase 2 Supplementary Paper No. 1 South West Irrigation Strategy Study, Water Authority of Western Australia.

The value of recreation at Logue Brook Dam
Value of recreational demand 13
Using survey information collected from visitors to Logue Brook and Waroona
Reservoirs, Lucas constructed demand curves for recreation at both sites9. The
consumer surplus, which provides an estimate of the visitors’ willingness to
pay for recreation opportunities available at the recreation site for recreational
activity, was estimated as the area under the demand curve.
A key assumption in Lucas’s study is the opportunity cost of travel time.
Lucas follows Cesario (1976) and uses a proportion of the hourly wage rate as
a proxy for the opportunity cost of time travel10.
Table 4 presents Lucas’s estimates of consumer surplus for four different
proportions of the hourly wage rate taken to represent the opportunity cost of
time travel. The Lucas standard case assumed a proportion of post-tax hourly
rate of 0.3 as the opportunity cost of travel time. This is consistent with
Cesario’s finding that the value of time with respect to non-work travel is
between one-fourth and one-half and the figure suggested by the US Water
Resources Council at that time11. In contrast, Larson (1993) argued that a long
run view suggests that the full wage is the appropriate opportunity cost of
time12.
Table 4 Estimates of consumer surplus of recreational activity at Logue Brook Dam
Proportion of post-tax hourly wage taken to represent the opportunity cost of travel time
0.1 0.3 0.6 1.0
Estimate of consumer surplus ($1991)
43,574 74,725 116,875 167,225
Estimate of consumer surplus ($2005)
60,993 104,598 163,598 234,076
Note: The standard case is shaded. Figures inflated to 2005 dollars using RBA Inflation Calculator at
http://www.rba.gov.au/calculator/calc.go.
Data source: Lucas (1991), Table 6, p.25.
Lucas used the estimates of consumer surplus (annual recreational benefit) to
derive a present value of the future stream of total recreational benefits. These
are shown in Table 5.
9 Lucas derived four demand curves based on the assumption made about the opportunity cost
of travel time.
10 Cesario, F.J. (1976).’Value of Time in Recreation Benefit Studies’. Land Economics, 52: 32-41.
11 Cesario, F.J. (1976), p.37, US Water Resources Council (1983). Economic and Environmental Principles and Guidelines for Water and Related Land Resources Implementation Studies, Washington, DC..
12 Larson, D.M. (1993). ‘Separability and the Shadow Value of Leisure Time’. American Journal of Agricultural Economics, 75: 572-577.

The value of recreation at Logue Brook Dam
Value of recreational demand 14
Table 5 Present values of total recreational benefits for Logue Brook Dam
Present value of recreational benefit ($) Annual recreation benefit ($) 5 years 10 15 20 25 30 50
43,574 183,551 320,709 423,199 499,789 557,024 599,787 686,809
74,725 314,771 549,983 725,744 857,088 955,239 1,028,575 1,177,808
116,875 492,324 860,211 1,135,113 1,340,544 1,494,060 1,608,761 1,842,172
167,225 704,418 1,230,793 1,624,122 1,918,054 2,137,537 2,301,818 2,635,783
Note: Present value calculated using a discount rate of 6% and an opportunity cost of travel time of 0.3 of
the post-tax hourly wage. The standard case is shaded.
Data source: Lucas (1991), Table 16, p.33.
As part of a sensitivity analysis, Lucas examined the impact on the present
value of the future stream of total recreational benefits at discount rates of 4
per cent, 6 per cent and 8 per cent. The results of this analysis are shown in
Table 6.
Table 6 Present values of total recreational benefits for Logue Brook Dam: selected discount rates (1991 dollars)
Present value of recreational benefit ($) Discount rate
5 years 10 15 20 25 30 50
4% 332,661 606,087 830,822 1,015,535 1,167,361 1,292,144 1,605,257
6% 314,771 549,983 725,744 857,088 955,239 1,028,575 1,177,808
8% 298,354 501,412 639,609 733,657 797,674 841,239 914,148
Note: Present value calculated using an opportunity cost of travel time of 0.3 of the post-tax hourly wage
Data source: Lucas (1991), Tables 16, 17 and 18, p.33. The standard case is shaded.
In the Lucas standard case of a:
• 30 year time horizon
• six per cent discount rate, and
• opportunity cost of travel time equal to 0.3 times the average post-tax hourly wage rate,
The present value of the recreation benefits is $1,028,575 (1991 dollars) and
$1,439,764 (2005 dollars). If the opportunity cost is equal to the average post-
tax hourly wage rate, the present value of the recreation benefits increases to
$2,301,818 (1991 dollars) and $3,222,005 (2005 dollars). This is the Lucas
upper estimate.
Based on the estimates of the consumer surplus, the average amount of
consumer surplus received by individuals visiting Logue Brook Dam varies
from $5.45 to $20.90 (in 1991 dollars). The estimate for the Lucas standard
case was $9.34 in 1991 dollars. The estimates in 2005 dollars are $7.63 to

The value of recreation at Logue Brook Dam
Value of recreational demand 15
$29.26 per person per visit and $13.07 for the Lucas standard case13. Given
that around 80 per cent of visitors are day visitors, these figures can be
assumed to per person per day for the purpose of comparison with other
studies.
5.3.2 Value of Logue Brook Dam based on Lucas estimates
The volume of water proposed to be taken from Logue brook dam is 5.3
gigalitres. On the basis of this amount the standard Lucas estimate yields a
value of water for recreation of 0.91 cents per kilolitre of water14. If we use the
Lucas upper estimate the value of water increases to 2.03 cents per kilolitre.
Note that as the number of recreation substitutes becomes more limited, (the
area for recreation diminishes), this value is likely to rise.
5.3.3 Other studies
The Lucas comparison
Table 7 shows a comparison of the Lucas estimates of individual consumer
surplus with estimates of average consumer surplus from similar studies of
recreation benefits quoted by Lucas.
Table 7 Comparison of estimates of individual consumer surplus
Study Recreation Site TCM Method Average individual consumer surplus (2005
dollars)
Lucas (1991) Logue Brook & Waroona dams Zonal TCM $7.63 - $29.26
Seller, Stoll and Chavas (1984)(US) Four lakes in East Texas Individual TCM $31.47, $58.08, $77.44, $249.27
Ralston and Park (1989)(US) Lake in Tennessee Zonal TCM $128.11
Farber (1988)(US) Coastal wetlands in Louisiana Zonal TCM $11.00 - $33.01
Harris and Meister (1983)(NZ) Lake in New Zealand Zonal TCM $19.61
Note: Lucas’s figures inflated to 2005 dollars using RBA Inflation Calculator at http://www.rba.gov.au/calculator/calc.go. The figures
in the US studies inflated to 2005 dollars using the US Department of Labour Bureau of Labor Statistics Inflation Calculator at
http://www.bls.gov/cpi/. US figures converted to $A using exchange rate of 1$A = $0.75US. The figure in the NZ study inflated to 2005
dollars using the Reserve Bank of New Zealand CPI Inflation Calculator at http://www.rbnz.govt.nz/statistics/0135595/html. The NZ
figure converted to $A using exchange rate of 1$A = $1.18NZ.
Data source: Lucas (1991), p. 34, Seller, C., Stoll, J.R. and J.P. Chavas (1985). ‘Validation of Empirical Measures of Welfare Change: A
Comparison of Non Market Techniques’. Land Economics, 61: 156-175, Ralston, S.N. and W.M. Park (1989). ‘Estimation of Potential
Reductions in Recreation Benefits Due to Sedimentation’. Water Resources Bulletin, 25: 1259-1265, Farber, S. (1988). ‘The Value of
Coastal Wetlands for Recreation: An Application of Travel Cost and Contingent Valuation Methodologies’. Journal of Environmental
Management, 26: 299-312, Harris, B.S. and A.D. Meister (1983). ‘The Use of Recreation Analysis in Resource Management: A Case
Study’. Journal of Environmental Management, 16: 117-124.
13 See note to Table 7 for details on the inflation of the Lucas estimates.
14 This figure is calculated by dividing the present value of the recreation benefits over 30 years (from Table 6) by 5.3 GL times 30 years.

The value of recreation at Logue Brook Dam
Value of recreational demand 16
The estimates of average individual consumer surplus in the papers by Seller,
Stoll and Chavas (1984), Ralston and Park (1989) and Harris and Meister
(1983) apply to the recreation benefits of lakes. The estimates provided by
Farber (1988) relate to the recreation benefits of coastal wetlands and are
probably less relevant as a comparator.
Overall, the recreation benefits estimated in these studies range from $11.00 to
$249.27 per person, excluding the Farber (1988) study. Although Lucas
considered that the estimates of recreation benefit for Logue Brook Dam are
reasonably consistent with these estimates, the range is quite large, with the
Lucas estimates falling in the lower end.
Given the timeframe and resources available for this study, primary research to
estimate the recreation value of Logue Brook Dam was not considered.
Therefore, despite the reservations expressed above and the absence of any
other studies, the Lucas standard estimate (adjusted to 2005 dollars) of around
$13 per person per visit is the best available estimate of the recreation value of
Logue Brook Dam.
Benefit transfer
A technique called benefit transfer was used further test the validity of the
Lucas estimates Benefit transfer, which involves the use the results of previous
studies to derive estimates of the value of a site or resource being studied, is
used in situations where valuation using primary research is too expensive or
time consuming15.
In benefit transfer jargon the site where the original study was conducted is
called the ‘study site’ and the site where the benefit estimate is to be applied is
the ‘policy site’.
Several benefit transfer methods have been developed to estimate the value of
the ‘policy site’. These are broadly classified into:
• Value transfer, which is the direct application of estimates from original research summary statistics to the ‘policy site’. There are three approaches to conducting value transfers, including transfers of point estimates, transfers of measures of central tendency, and transfers of administratively-approved estimates
• Function transfer, which is the transfer of functions or statistical models that define relationships in the data collected at the ‘study site’. Types of functions include demand functions and meta-regression analysis functions.
15 See Loomis, J.B. (1992). ‘The Evolution of a More Rigorous Approach to Benefit Transfer:
Benefit Function Transfer’. Water Resources Research, 28: 701-705.

The value of recreation at Logue Brook Dam
Value of recreational demand 17
The approach taken in this study was to apply the measures of central tendency
approach to value transfer using the mean of estimates of average consumer
surplus values of recreation activities from an annotated bibliography of
outdoor recreation use valuation studies undertaken by Rosenberger and
Loomis (2001) over the period 1967 to 199816. These estimates, which were in
1996 US dollars, were adjusted to 2005 US dollars, and then converted to
Australian dollars17.
The average consumer surplus values are shown in Table 8. The estimates
across all activities range from around $1 to $362. Once again, this range is too
wide to enable an estimate of the recreation value of the ‘policy site’, namely
Logue Brook Dam to be made.
Table 8 Average consumer surplus values per activity per day per person from recreation demand studies – 1967 to 1998 (2005 A$)
Activity No. of studies
No. of estimates
Mean of Estimates
Median of
estimates
Std error of mean
Range of estimates
Camping 22 40 $50.39 $30.04 $9.13 $2.80-310.53
Picnicking 7 12 47.01 40.19 16.02 12.36-197.41
Swimming 9 12 28.11 30.19 7.40 3.04-81.45
Sightseeing 9 20 47.84 35.07 15.61 0.89-290.12
Off-road driving 3 4 23.24 26.31 10.40 7.25-55.83
Motorised boating 9 14 46.33 30.12 19.33 7.31-281.61
Hiking 17 29 48.84 38.52 13.07 2.59-362.41
Biking 3 5 60.20 91.12 13.95 29.23-104.36
Fishing 39 122 59.96 33.50 5.68 2.87-350.09
General recreation 12 16 40.27 16.64 12.41 1.96-356.15
Data source: Rosenberger, R.S. and J.B. Loomis (2001), p.4.
A significant refinement to this approach would be to screen the original
studies examined by Rosenberger and Loomis for relevance. Questions that
would need to be answered would include:
• How well does the original research context correspond to the Logue brook dam context?
• Are the point estimates in the right units, or can they be adjusted to the right units?
• What is the quality of the original research18?
16 Rosenberger, R.S. and J.B. Loomis (2001). This study covered 21 recreational activities plus a
category for wilderness recreation. It contains 163 individual studies referenced, providing 760 benefit measures.
17 See note to Table 7 for details.
18 Rosenberger, R.S. and J.B. Loomis (2003)’ ‘Benefit Transfer’. Chapter 12 in Champ, P.A., Boyle, K.J. and T.C. Brown, (Eds), A Primer on Non-market Valuation, Dordrecht, Kluwer Academic Publishers, The Netherlands:.

The value of recreation at Logue Brook Dam
Conclusion 18
Another source of data is Environment Canada’s (1998) Environmental Values
Reference Inventory (EVRI) database19. This database is subscription based
and was not considered in this study.
6 Conclusion
This report has sought to provide an estimation of the value of recreation of
Logue Brook Dam in the Shire of Harvey. The report has estimated the
economic impact of the dam on the local region by providing an estimation of
visitor expenditure in the region. It has also estimated the economic value of
the dam by updating previous estimations undertaken by Lucas in 1991. These
values must be viewed as estimations only as they rely on incomplete data sets.
The report found that some 32,000 people visit the Logue Brook Dam each
year with around 20 per cent of these people staying overnight. The primary
recreation activities at the dam are swimming and water skiing which occur in
the summer months and Easter school holidays however, the dam is visited
throughout the year particularly by school groups.
Given this visitor profile, it is estimated that economic impact of the dam on
the local region based on annual visitor expenditure in the Logue Brook Dam
area is around $630,000 which is equivalent to $20 per person per day with
most of this expenditure incurred by overnight visitors on accommodation at
the dam or on general services in the town of Harvey. There is also some
expenditure at Cookernup being the closest town and at nearby tourist
attractions such as wineries. Overnight visitors accounted for 70 per cent of
total expenditure.
While it is recognised that the businesses at Logue Brook Dam incur some
expenditure in the local area, the majority of their expenditure is in Perth or
Bunbury.
The estimate of the value of recreation at Logue Brook Dam is 0.91 cents per
kilolitre. This value was derived by adjusting the Lucas standard estimate to
inflate it to 2005 dollars. It is based on Lucas’s travel cost model and
assumptions. The results of the comparative analysis were too broad to be able
to define any confidence limits for the Lucas standard estimate. However,
given the results of the comparative studies, the Lucas standard estimate is of
the right order of magnitude. Furthermore, as the number of recreation sites
19 Environment Canada(1998). Environmental Valuation Resource Inventory homepage.
Available: www.evri.ec.gc.ca/evri.

The value of recreation at Logue Brook Dam
Conclusion 19
that can be substituted for Logue Brook Dam diminishes, these values are
likely to rise.

The value of recreation at Logue Brook Dam
Visitor expenditure assumptions 20
A Visitor expenditure assumptions • 32,000 visitors per annum of which around 5,500 stay overnight
• Accommodation based on figures supplied by Camp Logue Brook and the Lake Brockman Tourist Park
• All other estimations based on consultation and estimated by visitor group assuming 3.5 visitors per group. This method was used as it was difficult to determine expenditure per person given that most visitors enter the dam area in groups and therefore share expenses such as supplies, fuel and so on. See Table 9 for estimations
• Expenditure on fuel by day visitors in the Logue Brook Dam area is assumed to be zero as consultation found that most day trippers filled their fuel tanks at the source of their journey.
Table 9 Expenditure assumptions (excluding accommodation) based on visitor group
Overnight visitors Day visitors
$ per group Total
$ per group Total
Fuel 100 152,857 Fuel 0
Supplies 50 76,429 Supplies 20 75,571
Souvenirs 5 7,643 Souvenirs 5 37,786
Meals 40 61,143 Meals 20 75,571
Total $298,071 Total $188,929