value investment based on data analysis with comparison of
TRANSCRIPT

Value Investment Based on Data Analysis with Comparison of Three Food Corporations in the US
Jing Qin1,a
1Shandong Technology and Business University, Shandong, China
Keywords: Value investing, Food corporations, Data analysis, Ratios, Stock price.
Abstract. Analysis on value investment is always necessary to all kinds of companies, especially for
those that have a close relationship with people’s daily life. Analysis plays a significant role in the
development of corporations, even if they are in different stages. Because this not only helps a
corporation to decrease the possibility of making a wrong investment decision but also helps to guide
it into the right direction, according to figure out whether it is worth continuing to invest and how to
invest by synthesized factors. And this paper is mainly about analyzing value investment of three
food corporations using certain data and then select the one with the most investment value,
combined with the present situation of this area.
1. Introduction
Value investing is to seek for a stock whose price is lower than its intrinsic value, and hold it for a
period until their price outweighs the intrinsic value. If succeeds, investors make profits from selling
the stock. During this process, lots of factors need to be taken into consideration in order to make a
better decision, such as market condition, management and financial position (e.g. cash flow) of those
corporations. And this paper will most focus on whether it is good to invest in the future of the
corporations by virtue of several indexes, which are called PE, PB, PEG, PBG ratio separately. Those
ratios play important roles in summarizing and evaluating financial condition and operating
performance of a company, which, on the other hand, reflects the potential value of it.
Three food corporations were chosen to be discussed in the following passage. They are Mondelez
International, Hershey’s, PepsiCo which produce snacks rather than staple foods. The participants of
the snack industry chain are increasingly mature now. The logistics and production processes are
progressing, the standardization, digital production managing system and the maturity of the flexible
supply chain promote the new format of snacks. Thus, it is very important for determining the
direction of development of those corporations. The analysis about ratios of each corporation will be
made in the following parts and will be combined with graphs when necessary.
2. Financial Status of the three corporations
The paper will discuss the financial condition from several important indicators mostly.
Firstly, the P/E ratio[1], The price-to-earnings ratio (P/E ratio) is the ratio for valuing a company that
measures its current share price relative to its per-share earnings. P/E ratios are used by investors and
analysts to determine the relative value of a company’s shares in an apples-to-apples comparison. It
can also be used to compare a company against its historical record or to compare aggregate markets
against one another or over time. The equation for it is showing below:
P/E Ratio =market value per share
earnings per share (1)
As for PEG[2], it is used to determine a stock's value while taking the company’s earnings growth
into account and is considered to provide a more complete picture than the P/E ratio.
In terms of PB ratio[3], a financial ratio is used to compare a company’s current market price to
its book value. It is also sometimes known as a Market-to-Book ratio. A higher P/B ratio implies that
investors expect management to create more value from a given set of assets, all else equal (and/or
4th International Conference on Humanities Science, Management and Education Technology (HSMET 2019)
Copyright © 2019, the Authors. Published by Atlantis Press. This is an open access article under the CC BY-NC license (http://creativecommons.org/licenses/by-nc/4.0/).
Advances in Social Science, Education and Humanities Research, volume 334
108

that the market value of the firm's assets is significantly higher than their accounting value). P/B
ratios do not, however, directly provide any information on the ability of the firm to generate profits
or cash for shareholders. The equation for it is showing below:
P B⁄ Ratio =stock price
book value per share (2)
2.1 Mondelez International
The predecessor of Mondelez International is Kraft Foods Inc, the number one food company in the
US and the second largest in the world. Kraft Foods was divided into two independent corporations in
2012, and one of them is Mondelez International, abbreviated as MDLZ. This corporation is a
manufacturer famous for producing chocolate, gum, cookies, confectionery and powdered beverages.
Hershey’s owns plenty of brands and those famous ones are Chips Ahoy!, Oreo, LU and so on. And
its shares are listed at Nasdaq stock exchange.
In terms of its financial condition, since the stock price of each stock is not constant, to improve
the accuracy, the price on 31st, December 2018 and on 31st, January 2019 were chosen in this paper.
To begin with, it can be told from Figure 1 how much the stock price and EPS were in different
fiscal quarters in 2018 and 2019 [4][5]. According to Equation 1, it can be figured out that P/E ratio
for 2018 and 2019 was 18.45 and 18.03 respectively and thus it decreased by 0.42, which was lower
than S&P500 index and showed a favorable trend due to that before making an investment, the lower
P/E is, the more valuable a stock is.
In addition, the graph also depicted that the total stockholder’s equity was 25,457 million, shares
outstanding was 1445,385,415 in total, the market value of common shares was $6.37 and BV per
share was 17.36 in 2018. According to Equation 2, the value of P/B was calculated to be 2.52.
Fig.1. Financial Indicators of MDLZ
2.2 Hershey’s
The Hershey Company, also called Hershey’s, is one of the largest chocolate manufacturers in the
world, which was established in America in 1894 and was listed in New York Stock Exchange.
Indeed, MDLZ used to have a plan of purchasing Hershey’s but was refused, otherwise, MDLZ could
have surpassed the scale of Mars and become the largest food company all over the world.
Nevertheless, this event did have a positive influence on the later prices change of both stocks. In the
later several days, MDLZ’s stock price was $45.13, increased by 5 percent, compared with 15 percent
for Hershey’s, which increased to $118.87. The reason why MDLZ failed to make a deal with
Hershey’s was unclear, but media supposed that maybe it was because they did not achieve a
satisfying negotiation on trading price.
109

In terms of Hershey’s itself, it mainly produces chocolate and baked products, such as cookies,
cakes, milkshake, drinks and many more, which increase its variety of range[6]. And some of its
brands are M&M's, Hershey’s Kisses, Cadbury’s, Krave, Reeses and so on.
When it comes to the financial condition of Hershey’s, the price was chosen for the same reason as
MDLZ, whose previous price was $113.51, while the current one is $105.58.
Using the same method as computing the financial indicators above, each value was calculated and
shown in Figure 2. It can be told from this graph that P/E ratio was 22.39 in the past and 18.65 at
present, which dropped below the S&P500 index, decreased by 3.74 in total which is 8 times more
than that of MDLZ. Thus, from this perspective, it seems to be a better choice. Besides, the PB ratio
can be figured out by using Equation 2 and the result is 17.93.
Fig.2. Financial Indicators of Hershey’s
2.3 PepsiCo.
EPepsiCo, Inc was a corporation established in America in 1965 with the merger of the Pepsi-Cola
Company and Frito-Lay, Inc. PepsiCo has a global market, serving customers from more
than 200 countries and territories[7], which concludes North and South America, Europe, Africa and
Asia[8]. In 2016, this corporation was separated into six main divisions: North America, Latin
America, Europe and Sub-Saharan African, Asia, the Middle East, and North Africa. It manufactures
both food and beverage and has a wide range of brands as well as the other two corporations, such as
Pepsi, Lay’s, Mountain Dew, 7 Up and so like.
Despite that PepsiCo does own a large market around the world, The Coca-Cola Company is
always considered to be its primary competitor in selling beverage[9]. These two corporations have
competed with each other for more than a hundred years, and in December 2005, it was the first time
that PepsiCo surpassed The Coca-Cola Company in market value. However, in 2009, they gained a
higher market share in two different areas compared with each other. For the Coca-Cola Company, it
stayed in a dominant position in carbonated soft drink sales in the U.S., at the same time, PepsiCo
won in the U.S. refreshment beverage market, which also indicated how distinctive they are in
product lines. In the 1990s and 2000s, PepsiCo expanded its service and produced beverage as well as
foods and snacks. And as a result, beverages occupied less than 50 percent of its revenue in 2009.
Having a wide variety of business helps to decrease the risk of losses when selling a certain kind of
food enter the depression. Besides, with more categories of food and beverages, it can also provide
more options and satisfy different needs of consumers.
And as it can be seen in Figure 3, between the 1990s and the 2000s, stock price showed an upward
tendency in an overview, while fluctuating some during this period. In 2008, there was a drop due to
capital write-down and outlay on the arrangement, but seldom had an impact on the stock trend. And
110
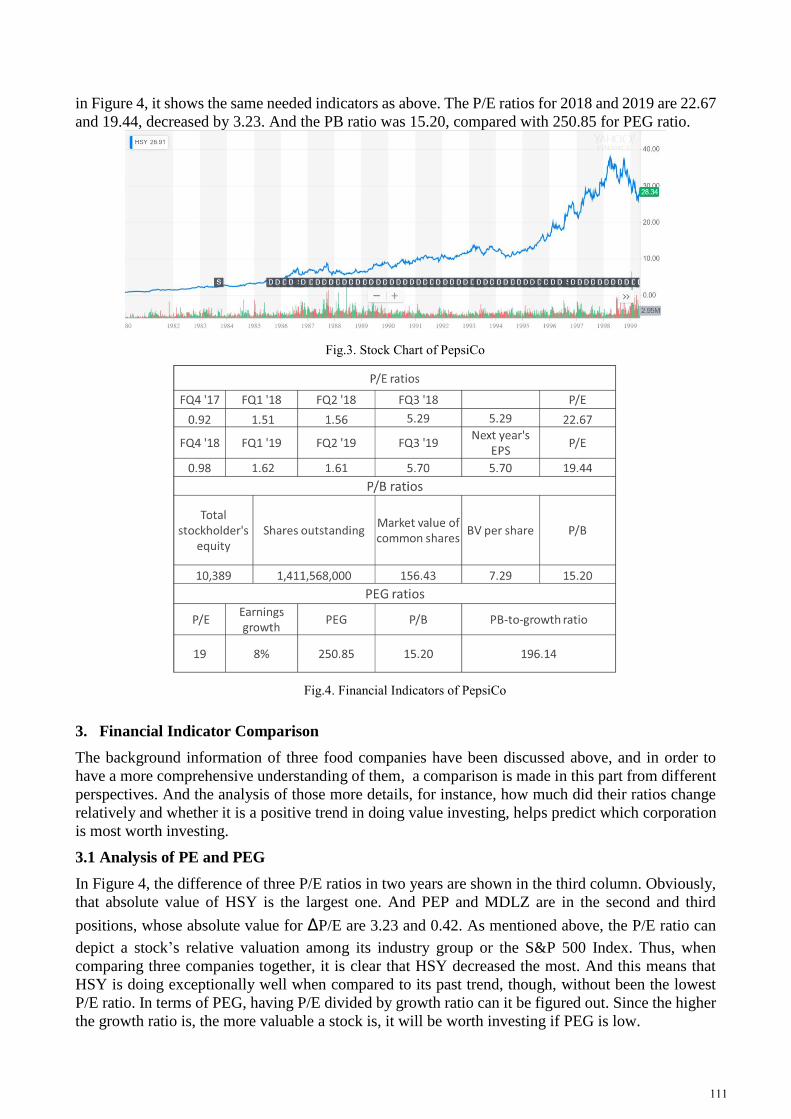
in Figure 4, it shows the same needed indicators as above. The P/E ratios for 2018 and 2019 are 22.67
and 19.44, decreased by 3.23. And the PB ratio was 15.20, compared with 250.85 for PEG ratio.
Fig.3. Stock Chart of PepsiCo
Fig.4. Financial Indicators of PepsiCo
3. Financial Indicator Comparison
The background information of three food companies have been discussed above, and in order to
have a more comprehensive understanding of them, a comparison is made in this part from different
perspectives. And the analysis of those more details, for instance, how much did their ratios change
relatively and whether it is a positive trend in doing value investing, helps predict which corporation
is most worth investing.
3.1 Analysis of PE and PEG
In Figure 4, the difference of three P/E ratios in two years are shown in the third column. Obviously,
that absolute value of HSY is the largest one. And PEP and MDLZ are in the second and third
positions, whose absolute value for ∆P/E are 3.23 and 0.42. As mentioned above, the P/E ratio can
depict a stock’s relative valuation among its industry group or the S&P 500 Index. Thus, when
comparing three companies together, it is clear that HSY decreased the most. And this means that
HSY is doing exceptionally well when compared to its past trend, though, without been the lowest
P/E ratio. In terms of PEG, having P/E divided by growth ratio can it be figured out. Since the higher
the growth ratio is, the more valuable a stock is, it will be worth investing if PEG is low.
111

However, sometimes the company will underestimate its earnings in order to announce a better
financial operating condition next quarter. Besides, some external analysts might provide estimates
distinct from the company itself, creating confusion. Hence only considering from a synthesized
aspect can we make sense of value investing.
3.2 Analysis of PS and PSG
When it comes to PB ratio, this ratio is used to measure a company’s market valuation relative to its
book value. A high PB ratio indicates that investors would create much value from a company, in
other words, a corporation could be regarded as a good investment if the PB ratio is low before
investors step in. This is because a low PB ratio could mean high growth potential in the future.
And P/S ratio can also be useful in valuing stocks that are about to turn a profit. If the P/S ratio of
a company is lower than its profitable competitors, the stock of that company can be bought by
investors. And PSG has the same mechanism as PEG. A lower PSG is a good signal for investors.
3.3 Comparison
Despite the several perspectives this paper has already analyzed, having thoughtful eyesight on value
investing is significant. As far as I am concerned, since both P/B and P/S ratio are based on the past,
they seem to be less meaningful than the P/B ratio. Thus, the P/B ratio should be put in the first
position in making decisions, combined with the rest of the indicators. In conclusion, P/E ratio for
HSY in 2019 is not the highest, and it owns the largest sales growth ratio and lowest PSG, so HSY
should be the best choice for making value investing.
Fig.5. Indicators Comparison
4. Conclusion
As we all know, nowadays, markets for different industries are developing fast and lots of new
products have been created to meet consumers’ needs and then improved their life. As a result, some
of the previous inventions might be outdated and will disappear in the market soon. So, in order to
keep competitive in a market, a manufacturer or corporation has to keep pace with the development of
the market in case they might be unable to make profits any longer. To achieve such a goal, they
should provide consumers with satisfying goods, no matter it is service or substantial products. Being
sensitive in finding potential needs of consumers can be a great advantage among its competitors. In
addition, as we are now living in a diversified world, it could be somehow risky if a corporation’s
business is too monotonous, so expanding its service will not only inclines such risk, but also be more
appealing to consumers, and then making more profits. Hence, being able to find potential
opportunities and having various services are significant in running a business.
References
[1] Investopedia. (2019). What the Price-to-Earnings Ratio Tells Us. [online] Available at:
https://www.investopedia.com/terms/p/price-earningsratio.asp [Accessed 9 Mar. 2019].
[2] Investopedia. (2019). Why the Price/Earnings-to-Growth Ratio Matters. [online] Available at:
https://www.investopedia.com/terms/p/pegratio.asp [Accessed 9 Mar. 2019].
[3] En.wikipedia.org. (2019). P/B ratio. [online] Available at:
https://en.wikipedia.org/wiki/P/B_ratio [Accessed 9 Mar. 2019].
[4] Sec.gov. (2019). SEC.gov | Company Search Page. [online] Available at:
https://www.sec.gov/edgar/searchedgar/companysearch.html [Accessed 9 Mar. 2019].
2018 2019
MDLZ 18.45 18.03 -0.42 2.52 380.24 -1% 176.61 -HSY 22.39 18.56 -3.83 17.93 151.73 3% 37.78 106PEP 22.67 19.44 -3.23 15.20 250.85 2% 46.47 120
Sales per share PSGSales GrowthP/E
∆ P/E P/B PEG
112

[5] Estimize.com. (2019). Estimize. [online] Available at: https://www.estimize.com/ [Accessed 9
Mar. 2019].
[6] Howlingpixel.com. (2019). The Hershey Company - Howling Pixel. [online] Available at:
https://howlingpixel.com/i-en/The_Hershey_Company [Accessed 9 Mar. 2019].
[7] Sec.gov. (2019). Document. [online] Available at:
https://www.sec.gov/Archives/edgar/data/77476/000007747619000017/pepsico201810-k.htm
[Accessed 9 Mar. 2019].
[8] Epo.wikitrans.net. (2019). PepsiCo - Wikipedia's PepsiCo as translated by GramTrans. [online]
Available at: https://epo.wikitrans.net/PepsiCo [Accessed 9 Mar. 2019].
[9] “PepsiCo Annual Report 2009” (PDF). PepsiCo, Inc. p. 13. Archived from the original (PDF) on
March 31, 2010. Retrieved December 13, 2010.
113