value focus - business valuation and financial...
TRANSCRIPT

VALUE FOCUSFOOD AND BEVERAGE
Q1: Non-Alcoholic BeveragesQ2: Alcoholic BeveragesQ3: Food ProcessingQ4: Fast Food & Casual Restaurants
2013

© 2014 Mercer Capital 1 www.mercercapital.com
Segment Focus
2013 Third Quarter
Food Processing
BUSINESS VALUATION & FINANCIAL ADVISORY SERVICES
Recent performance and consolidation trends within the food processing industry further highlight the mature state of the industry. Some
segments, such as frozen food processing, are largely defined by price-based competition and little technological development, while
others continue to exhibit growth through innovation. A growing demand for healthier products is also one of the trends that continues
to shape the industry.1 Health concerns have forced bread producers to offer whole grain, low carb, and gluten free options.2 Moreover,
major companies like Tyson have responded to health demands by revamping some of their offerings within the frozen food segment. Tyson
introduced its new “Tyson Deli Market” which relies on a frozen-fresh delivery system that delivers the meals frozen and allows them to be
thawed in-store, ultimately reaching the consumer as a “fresh” product.3 Lastly, growing post-recession disposable incomes are expected
to further spur demand for premium product offerings.
On average, prices for the publicly traded
food processors shown below have
increased 83% over the last five years
(12.9% annually) as recovery from the
recession continued.
Dairy manufacturer Dean Foods strug-
gled to realize similar increases as it
fought weak sales volumes and spun
off its Wisconsin-based milk processing
business.
Public Company Performance
-‐100%
-‐50%
0%
50%
100%
150%
200%
PepsiCo Inc. Tyson Foods Inc. Dean Foods Company ConAgra Foods, Inc. Hormel Foods Corpora@on Unilever NV Grupo Bimbo SAB de CV Sanderson Farms Inc. Nestle SA
5 Year Change in Stock Prices for Publicly Traded Food Processors
Mercer Capital’s Value Focus: Food and Beverage Industry Third Quarter 2013
© 2014 Mercer Capital 2 www.mercercapital.com
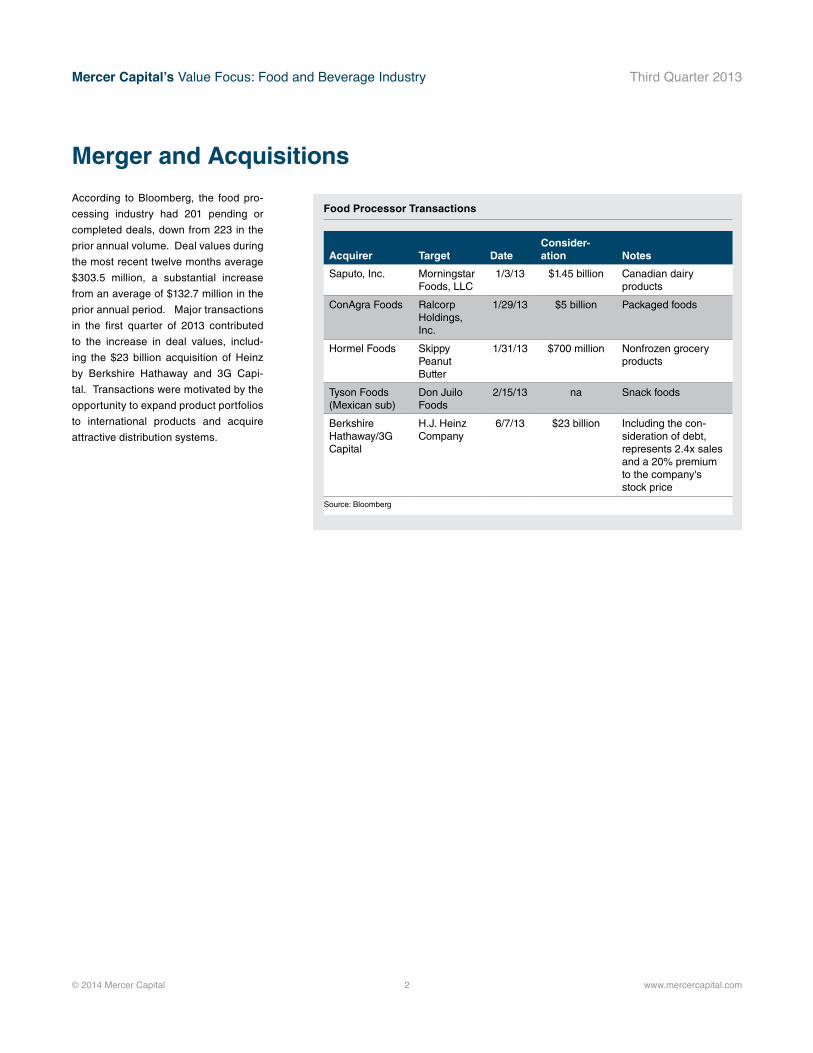
According to Bloomberg, the food pro-
cessing industry had 201 pending or
completed deals, down from 223 in the
prior annual volume. Deal values during
the most recent twelve months average
$303.5 million, a substantial increase
from an average of $132.7 million in the
prior annual period. Major transactions
in the first quarter of 2013 contributed
to the increase in deal values, includ-
ing the $23 billion acquisition of Heinz
by Berkshire Hathaway and 3G Capi-
tal. Transactions were motivated by the
opportunity to expand product portfolios
to international products and acquire
attractive distribution systems.
Merger and Acquisitions
Acquirer Target Date Consider-ation Notes
Saputo, Inc. Morningstar Foods, LLC
1/3/13 $1.45 billion Canadian dairy products
ConAgra Foods Ralcorp Holdings, Inc.
1/29/13 $5 billion Packaged foods
Hormel Foods Skippy Peanut Butter
1/31/13 $700 million Nonfrozen grocery products
Tyson Foods (Mexican sub)
Don Juilo Foods
2/15/13 na Snack foods
Berkshire Hathaway/3G Capital
H.J. Heinz Company
6/7/13 $23 billion Including the con-sideration of debt, represents 2.4x sales and a 20% premium to the company's stock price
Source: Bloomberg
Food Processor Transactions

Mercer Capital’s Value Focus: Food and Beverage Industry Third Quarter 2013
© 2014 Mercer Capital 3 www.mercercapital.com
Frozen Food
The United States frozen food sector has
annual revenues of approximately $28
billion and maintains a 5% profit margin.
The sector has endured a long period
of dwindling revenues as consumer
demand for frozen food plummeted.
A rise in disposable incomes among con-
sumers coupled with growing health con-
cerns has been detrimental for the indus-
try as more consumers continue to move
towards fresh food. Accordingly, the
sector attempted to fight falling demand
through new product innovation, ulti-
mately leading to higher marketing costs
and depressed margins.4 More market-
ing efforts from a new product standpoint
and advertising aimed at improving PR
are expected to continue for some time
within the sector.
Overall, sector revenue has been flat
since pre-recession years. If current
trends continue, revenue could fall below
pre-recession numbers during the next
five years.5 Price-based competition has
resulted in a lack of technological inno-
vation and increased layoffs, hamper-
ing the industry’s ability to evolve going
forward. In 2013, Heinz closed down a
major frozen food plant in Idaho in order
to consolidate its operations and improve
efficiency.6 Additionally, in 2012 Nestle
shut down a factory in California as its
trademarked Hot Pockets brand contin-
ued to have declining sales.
The sector as a whole continues to see
unit sales falling in the mid-single digit
range with flat or negative annual reve-
nue growth.7 Many of the same trends in
consolidation, layoffs, and price-based
competition are expected to continue to
define the industry.
0.0%
5.0%
10.0%
15.0%
20.0%
25.0%
30.0%
35.0%
40.0%
$113
$114
$115
$116
$117
$118
$119
$120
$121
2008 2009 2010 2011 2012
Mar
gins
Sale
s in
Bill
ions
USD
Source: Bloomberg
Sales Gross Margin EBITDA Margin
U.S. Frozen Food Historical Sales and Margins
14%
9.40%
7.80%
3%
2.80%
2.10%
60.90%
Source: IBISWorld
Nestle SA The Schwan Food Co. ConAgra Foods Inc. HJ Heinz Company Kellogg Company McCain Foods Limited Other
U.S. Frozen Food Market Share Data
Mercer Capital’s Value Focus: Food and Beverage Industry Third Quarter 2013
© 2014 Mercer Capital 4 www.mercercapital.com
Ice Cream and Frozen Desserts
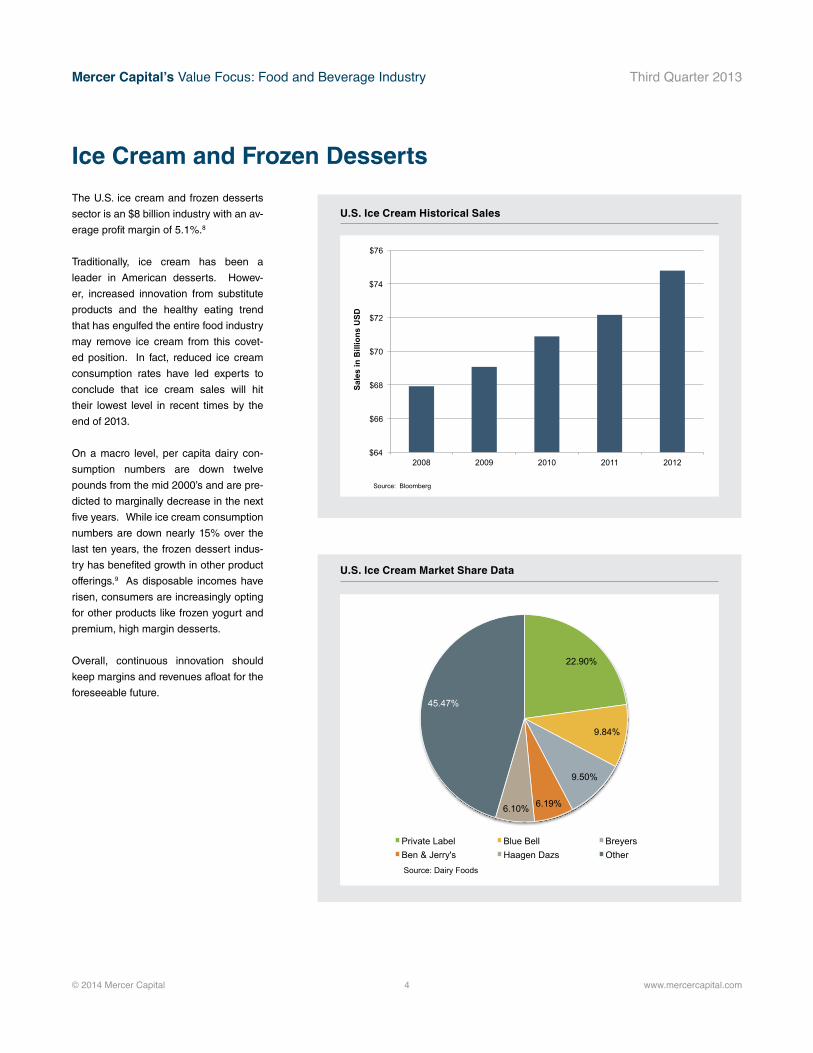
The U.S. ice cream and frozen desserts
sector is an $8 billion industry with an av-
erage profit margin of 5.1%.8
Traditionally, ice cream has been a
leader in American desserts. Howev-
er, increased innovation from substitute
products and the healthy eating trend
that has engulfed the entire food industry
may remove ice cream from this covet-
ed position. In fact, reduced ice cream
consumption rates have led experts to
conclude that ice cream sales will hit
their lowest level in recent times by the
end of 2013.
On a macro level, per capita dairy con-
sumption numbers are down twelve
pounds from the mid 2000’s and are pre-
dicted to marginally decrease in the next
five years. While ice cream consumption
numbers are down nearly 15% over the
last ten years, the frozen dessert indus-
try has benefited growth in other product
offerings.9 As disposable incomes have
risen, consumers are increasingly opting
for other products like frozen yogurt and
premium, high margin desserts.
Overall, continuous innovation should
keep margins and revenues afloat for the
foreseeable future.
22.90%
9.84%
9.50%
6.19% 6.10%
45.47%
Source: Dairy Foods
Private Label Blue Bell Breyers Ben & Jerry's Haagen Dazs Other
U.S. Ice Cream Market Share Data
$64
$66
$68
$70
$72
$74
$76
2008 2009 2010 2011 2012
Sale
s in
Bill
ions
USD
Source: Bloomberg
U.S. Ice Cream Historical Sales
Mercer Capital’s Value Focus: Food and Beverage Industry Third Quarter 2013
© 2014 Mercer Capital 5 www.mercercapital.com
Bread and Baked Goods
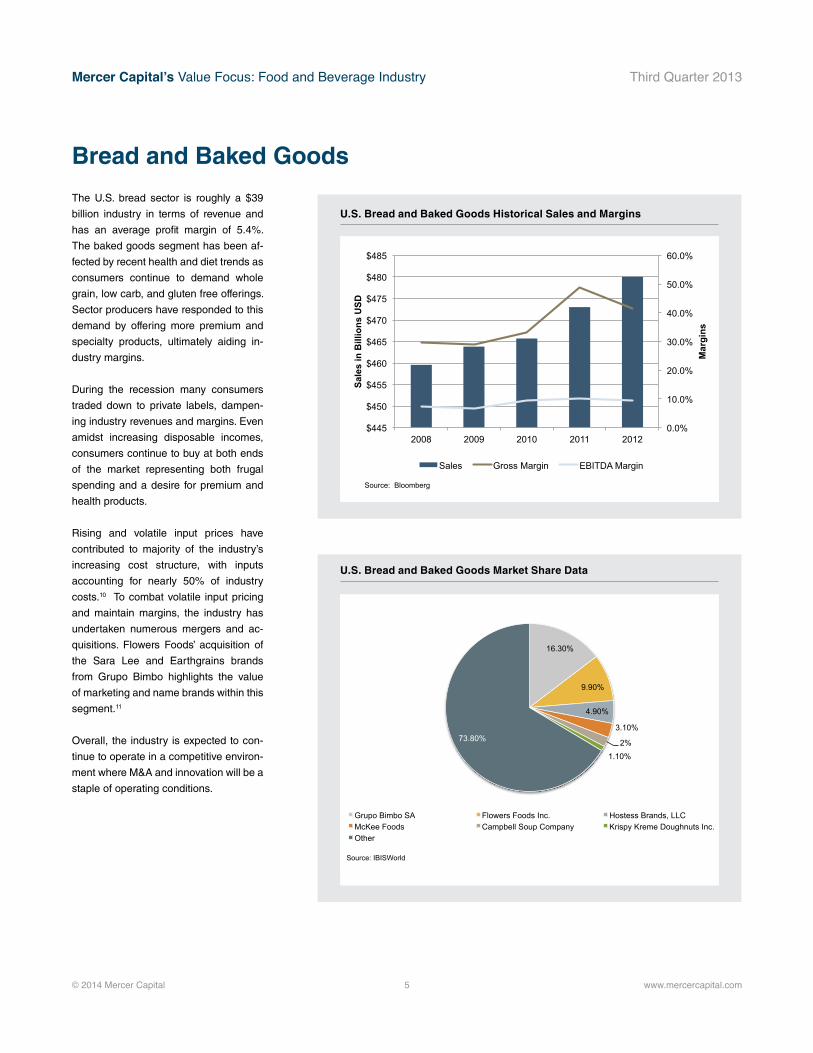
The U.S. bread sector is roughly a $39
billion industry in terms of revenue and
has an average profit margin of 5.4%.
The baked goods segment has been af-
fected by recent health and diet trends as
consumers continue to demand whole
grain, low carb, and gluten free offerings.
Sector producers have responded to this
demand by offering more premium and
specialty products, ultimately aiding in-
dustry margins.
During the recession many consumers
traded down to private labels, dampen-
ing industry revenues and margins. Even
amidst increasing disposable incomes,
consumers continue to buy at both ends
of the market representing both frugal
spending and a desire for premium and
health products.
Rising and volatile input prices have
contributed to majority of the industry’s
increasing cost structure, with inputs
accounting for nearly 50% of industry
costs.10 To combat volatile input pricing
and maintain margins, the industry has
undertaken numerous mergers and ac-
quisitions. Flowers Foods’ acquisition of
the Sara Lee and Earthgrains brands
from Grupo Bimbo highlights the value
of marketing and name brands within this
segment.11
Overall, the industry is expected to con-
tinue to operate in a competitive environ-
ment where M&A and innovation will be a
staple of operating conditions.
0.0%
10.0%
20.0%
30.0%
40.0%
50.0%
60.0%
$445
$450
$455
$460
$465
$470
$475
$480
$485
2008 2009 2010 2011 2012
Mar
gins
Sale
s in
Bill
ions
USD
Source: Bloomberg
Sales Gross Margin EBITDA Margin
U.S. Bread and Baked Goods Historical Sales and Margins
16.30%
9.90%
4.90%
3.10%
2%
1.10%
73.80%
Source: IBISWorld
Grupo Bimbo SA Flowers Foods Inc. Hostess Brands, LLC McKee Foods Campbell Soup Company Krispy Kreme Doughnuts Inc. Other
U.S. Bread and Baked Goods Market Share Data
Mercer Capital’s Value Focus: Food and Beverage Industry Third Quarter 2013
© 2014 Mercer Capital 6 www.mercercapital.com
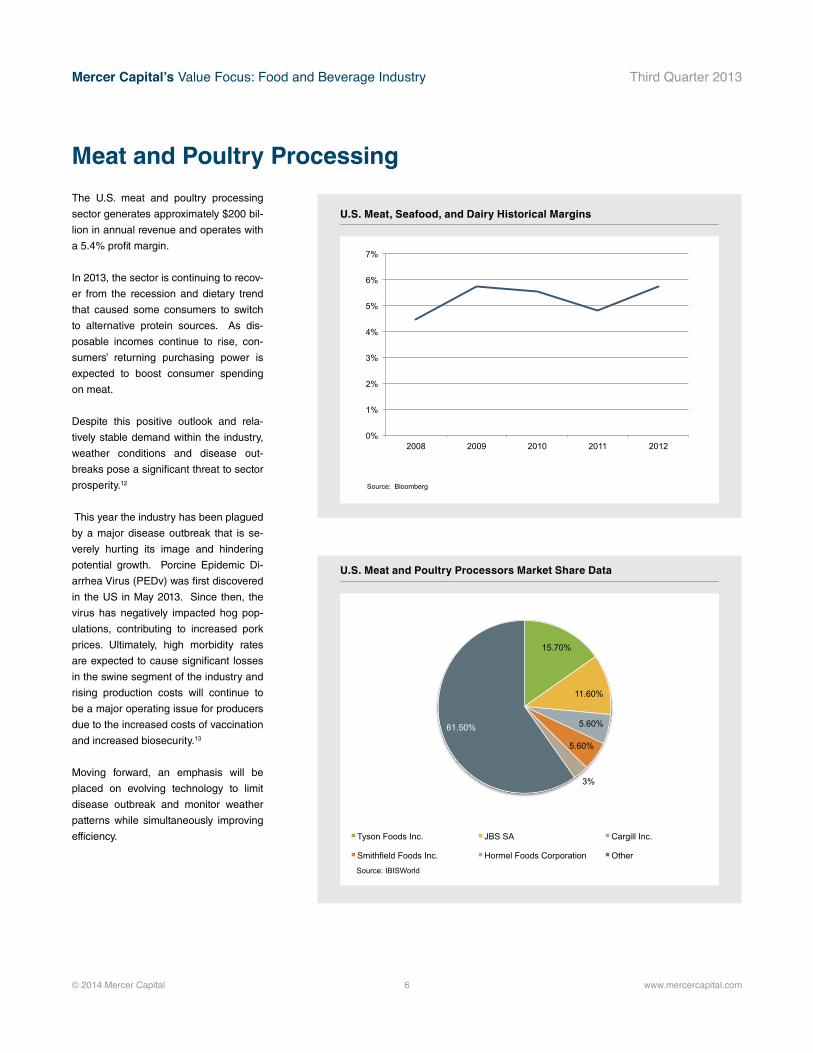
Meat and Poultry Processing
The U.S. meat and poultry processing
sector generates approximately $200 bil-
lion in annual revenue and operates with
a 5.4% profit margin.
In 2013, the sector is continuing to recov-
er from the recession and dietary trend
that caused some consumers to switch
to alternative protein sources. As dis-
posable incomes continue to rise, con-
sumers’ returning purchasing power is
expected to boost consumer spending
on meat.
Despite this positive outlook and rela-
tively stable demand within the industry,
weather conditions and disease out-
breaks pose a significant threat to sector
prosperity.12
This year the industry has been plagued
by a major disease outbreak that is se-
verely hurting its image and hindering
potential growth. Porcine Epidemic Di-
arrhea Virus (PEDv) was first discovered
in the US in May 2013. Since then, the
virus has negatively impacted hog pop-
ulations, contributing to increased pork
prices. Ultimately, high morbidity rates
are expected to cause significant losses
in the swine segment of the industry and
rising production costs will continue to
be a major operating issue for producers
due to the increased costs of vaccination
and increased biosecurity.13
Moving forward, an emphasis will be
placed on evolving technology to limit
disease outbreak and monitor weather
patterns while simultaneously improving
efficiency.
U.S. Meat, Seafood, and Dairy Historical Margins
0%
1%
2%
3%
4%
5%
6%
7%
2008 2009 2010 2011 2012
Source: Bloomberg
EBITDA Margin
15.70%
11.60%
5.60%
5.60%
3%
61.50%
Source: IBISWorld
Tyson Foods Inc. JBS SA Cargill Inc.
Smithfield Foods Inc. Hormel Foods Corporation Other
U.S. Meat and Poultry Processors Market Share Data
Mercer Capital’s Value Focus: Food and Beverage Industry Third Quarter 2013
© 2014 Mercer Capital 7 www.mercercapital.com
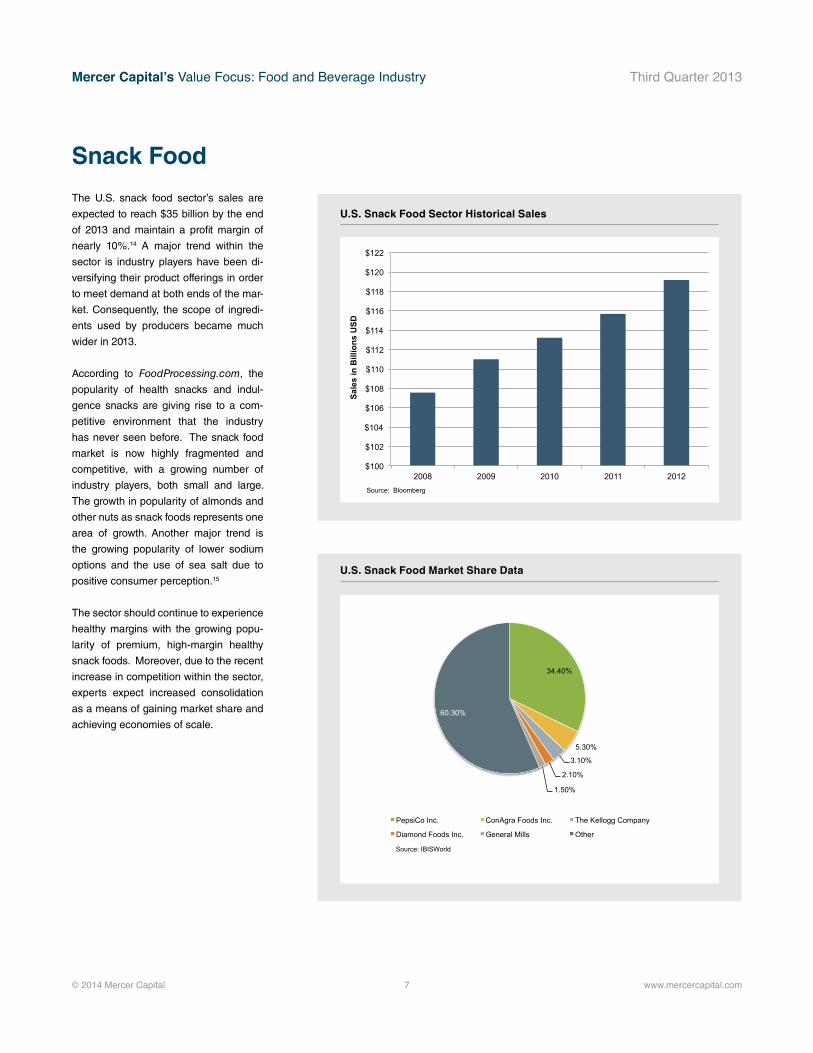
Snack Food
The U.S. snack food sector’s sales are
expected to reach $35 billion by the end
of 2013 and maintain a profit margin of
nearly 10%.14 A major trend within the
sector is industry players have been di-
versifying their product offerings in order
to meet demand at both ends of the mar-
ket. Consequently, the scope of ingredi-
ents used by producers became much
wider in 2013.
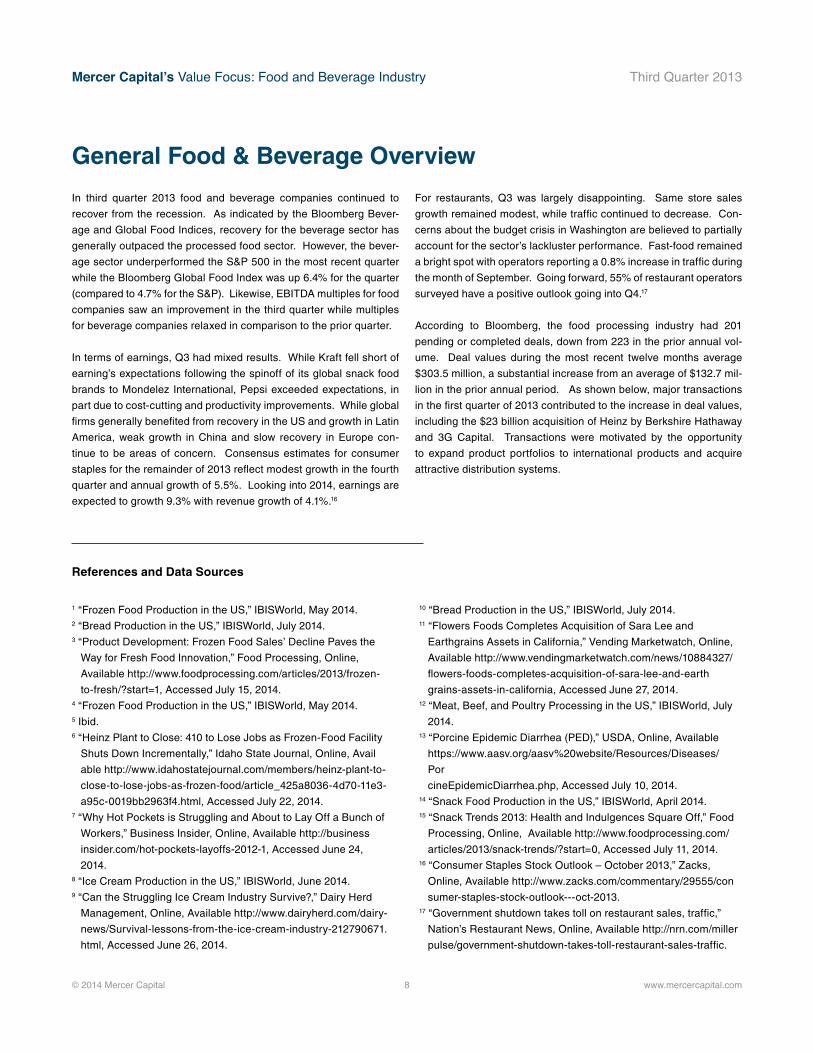
According to FoodProcessing.com, the
popularity of health snacks and indul-
gence snacks are giving rise to a com-
petitive environment that the industry
has never seen before. The snack food
market is now highly fragmented and
competitive, with a growing number of
industry players, both small and large.
The growth in popularity of almonds and
other nuts as snack foods represents one
area of growth. Another major trend is
the growing popularity of lower sodium
options and the use of sea salt due to
positive consumer perception.15
The sector should continue to experience
healthy margins with the growing popu-
larity of premium, high-margin healthy
snack foods. Moreover, due to the recent
increase in competition within the sector,
experts expect increased consolidation
as a means of gaining market share and
achieving economies of scale.
$100
$102
$104
$106
$108
$110
$112
$114
$116
$118
$120
$122
2008 2009 2010 2011 2012
Sale
s in
Bill
ions
USD
Source: Bloomberg
U.S. Snack Food Sector Historical Sales
U.S. Snack Food Market Share Data
34.40%
5.30%
3.10%
2.10%
1.50%
60.30%
Source: IBISWorld
PepsiCo Inc. ConAgra Foods Inc. The Kellogg Company
Diamond Foods Inc. General Mills Other
Mercer Capital’s Value Focus: Food and Beverage Industry Third Quarter 2013
© 2014 Mercer Capital 8 www.mercercapital.com
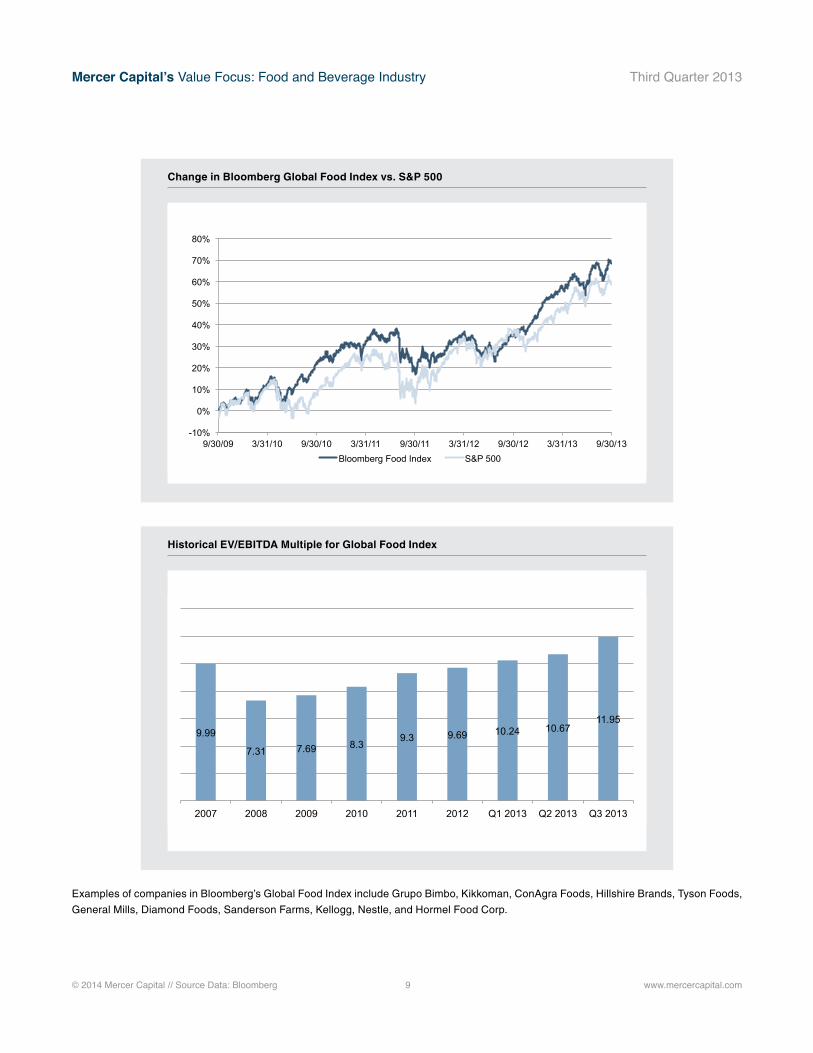
In third quarter 2013 food and beverage companies continued to
recover from the recession. As indicated by the Bloomberg Bever-
age and Global Food Indices, recovery for the beverage sector has
generally outpaced the processed food sector. However, the bever-
age sector underperformed the S&P 500 in the most recent quarter
while the Bloomberg Global Food Index was up 6.4% for the quarter
(compared to 4.7% for the S&P). Likewise, EBITDA multiples for food
companies saw an improvement in the third quarter while multiples
for beverage companies relaxed in comparison to the prior quarter.
In terms of earnings, Q3 had mixed results. While Kraft fell short of
earning’s expectations following the spinoff of its global snack food
brands to Mondelez International, Pepsi exceeded expectations, in
part due to cost-cutting and productivity improvements. While global
firms generally benefited from recovery in the US and growth in Latin
America, weak growth in China and slow recovery in Europe con-
tinue to be areas of concern. Consensus estimates for consumer
staples for the remainder of 2013 reflect modest growth in the fourth
quarter and annual growth of 5.5%. Looking into 2014, earnings are
expected to growth 9.3% with revenue growth of 4.1%.16
For restaurants, Q3 was largely disappointing. Same store sales
growth remained modest, while traffic continued to decrease. Con-
cerns about the budget crisis in Washington are believed to partially
account for the sector’s lackluster performance. Fast-food remained
a bright spot with operators reporting a 0.8% increase in traffic during
the month of September. Going forward, 55% of restaurant operators
surveyed have a positive outlook going into Q4.17
According to Bloomberg, the food processing industry had 201
pending or completed deals, down from 223 in the prior annual vol-
ume. Deal values during the most recent twelve months average
$303.5 million, a substantial increase from an average of $132.7 mil-
lion in the prior annual period. As shown below, major transactions
in the first quarter of 2013 contributed to the increase in deal values,
including the $23 billion acquisition of Heinz by Berkshire Hathaway
and 3G Capital. Transactions were motivated by the opportunity
to expand product portfolios to international products and acquire
attractive distribution systems.
General Food & Beverage Overview
1 “Frozen Food Production in the US,” IBISWorld, May 2014.2 “Bread Production in the US,” IBISWorld, July 2014.3 “Product Development: Frozen Food Sales’ Decline Paves the
Way for Fresh Food Innovation,” Food Processing, Online,
Available http://www.foodprocessing.com/articles/2013/frozen-
to-fresh/?start=1, Accessed July 15, 2014. 4 “Frozen Food Production in the US,” IBISWorld, May 2014.5 Ibid.6 “Heinz Plant to Close: 410 to Lose Jobs as Frozen-Food Facility
Shuts Down Incrementally,” Idaho State Journal, Online, Avail
able http://www.idahostatejournal.com/members/heinz-plant-to-
close-to-lose-jobs-as-frozen-food/article_425a8036-4d70-11e3-
a95c-0019bb2963f4.html, Accessed July 22, 2014.7 “Why Hot Pockets is Struggling and About to Lay Off a Bunch of
Workers,” Business Insider, Online, Available http://business
insider.com/hot-pockets-layoffs-2012-1, Accessed June 24,
2014. 8 “Ice Cream Production in the US,” IBISWorld, June 2014. 9 “Can the Struggling Ice Cream Industry Survive?,” Dairy Herd
Management, Online, Available http://www.dairyherd.com/dairy-
news/Survival-lessons-from-the-ice-cream-industry-212790671.
html, Accessed June 26, 2014.
10 “Bread Production in the US,” IBISWorld, July 2014.11 “Flowers Foods Completes Acquisition of Sara Lee and
Earthgrains Assets in California,” Vending Marketwatch, Online,
Available http://www.vendingmarketwatch.com/news/10884327/
flowers-foods-completes-acquisition-of-sara-lee-and-earth
grains-assets-in-california, Accessed June 27, 2014. 12 “Meat, Beef, and Poultry Processing in the US,” IBISWorld, July
2014. 13 “Porcine Epidemic Diarrhea (PED),” USDA, Online, Available
https://www.aasv.org/aasv%20website/Resources/Diseases/
Por
cineEpidemicDiarrhea.php, Accessed July 10, 2014.14 “Snack Food Production in the US,” IBISWorld, April 2014.15 “Snack Trends 2013: Health and Indulgences Square Off,” Food
Processing, Online, Available http://www.foodprocessing.com/
articles/2013/snack-trends/?start=0, Accessed July 11, 2014.16 “Consumer Staples Stock Outlook – October 2013,” Zacks,
Online, Available http://www.zacks.com/commentary/29555/con
sumer-staples-stock-outlook---oct-2013.17 “Government shutdown takes toll on restaurant sales, traffic,”
Nation’s Restaurant News, Online, Available http://nrn.com/miller
pulse/government-shutdown-takes-toll-restaurant-sales-traffic.
References and Data Sources
Mercer Capital’s Value Focus: Food and Beverage Industry Third Quarter 2013
© 2014 Mercer Capital // Source Data: Bloomberg 9 www.mercercapital.com
-10%
0%
10%
20%
30%
40%
50%
60%
70%
80%
9/30/09 3/31/10 9/30/10 3/31/11 9/30/11 3/31/12 9/30/12 3/31/13 9/30/13 Bloomberg Food Index S&P 500
9.99
7.31 7.69 8.3 9.3 9.69 10.24 10.67
11.95
2007 2008 2009 2010 2011 2012 Q1 2013 Q2 2013 Q3 2013
Change in Bloomberg Global Food Index vs. S&P 500
Historical EV/EBITDA Multiple for Global Food Index
Examples of companies in Bloomberg’s Global Food Index include Grupo Bimbo, Kikkoman, ConAgra Foods, Hillshire Brands, Tyson Foods,
General Mills, Diamond Foods, Sanderson Farms, Kellogg, Nestle, and Hormel Food Corp.

Mercer Capital’s Value Focus: Food and Beverage Industry Third Quarter 2013
Examples of companies in Bloomberg’s Global Food Index include Grupo Bimbo, Kikkoman, ConAgra Foods, Hillshire Brands, Tyson Foods,
General Mills, Diamond Foods, Sanderson Farms, Kellogg, Nestle, and Hormel Food Corp.
© 2014 Mercer Capital // Data Source: Bloomberg 10 www.mercercapital.com
-20%
0%
20%
40%
60%
80%
100%
120%
9/30/09 3/31/10 9/30/10 3/31/11 9/30/11 3/31/12 9/30/12 3/31/13 9/30/13
Bloomberg Beverage Index S&P 500
Historical EV / EBITDA MultipleBloomberg Beverage Index
8.51 9.57
10.96 10.29 10.81 11.89 12.42
10.94
2008 2009 2010 2011 2012 Q1 2013 Q2 2013 Q3 2013
Change in Bloomberg Beverage Index vs. S&P 500
Historical EV/EBITDA Multiple for Beverage Index
Mercer Capital’s Value Focus: Food and Beverage Industry Third Quarter 2013
© 2014 Mercer Capital 11 www.mercercapital.com
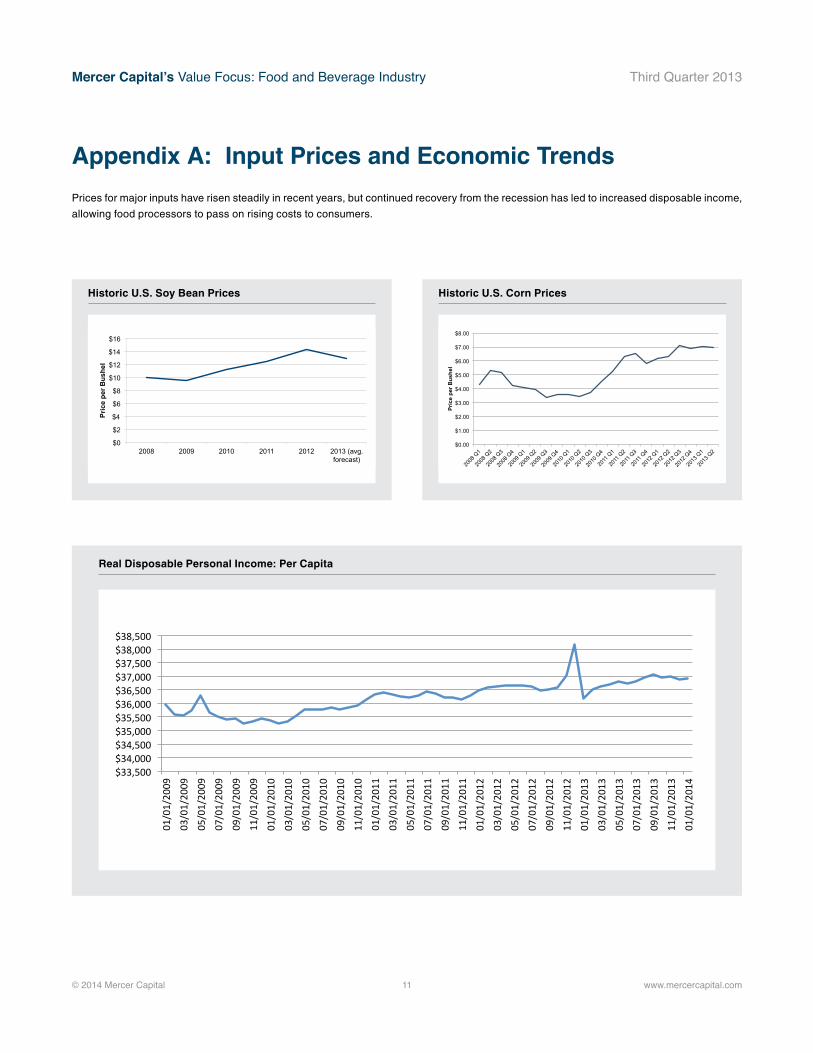
Prices for major inputs have risen steadily in recent years, but continued recovery from the recession has led to increased disposable income,
allowing food processors to pass on rising costs to consumers.
Appendix A: Input Prices and Economic Trends
$33,500 $34,000 $34,500 $35,000 $35,500 $36,000 $36,500 $37,000 $37,500 $38,000 $38,500
01/01/20
09
03/01/20
09
05/01/20
09
07/01/20
09
09/01/20
09
11/01/20
09
01/01/20
10
03/01/20
10
05/01/20
10
07/01/20
10
09/01/20
10
11/01/20
10
01/01/20
11
03/01/20
11
05/01/20
11
07/01/20
11
09/01/20
11
11/01/20
11
01/01/20
12
03/01/20
12
05/01/20
12
07/01/20
12
09/01/20
12
11/01/20
12
01/01/20
13
03/01/20
13
05/01/20
13
07/01/20
13
09/01/20
13
11/01/20
13
01/01/20
14
Real Disposable Personal Income: Per Capita
$0
$2
$4
$6
$8
$10
$12
$14
$16
2008 2009 2010 2011 2012 2013 (avg. forecast)
Pric
e pe
r Bus
hel
$0.00
$1.00
$2.00
$3.00
$4.00
$5.00
$6.00
$7.00
$8.00
Pric
e pe
r Bus
hel
Historic U.S. Soy Bean Prices Historic U.S. Corn Prices
© 2014 Mercer Capital // www.mercercapital.com 12
Mercer Capital’s Value Focus: Food and Beverage Industry Third Quarter 2013
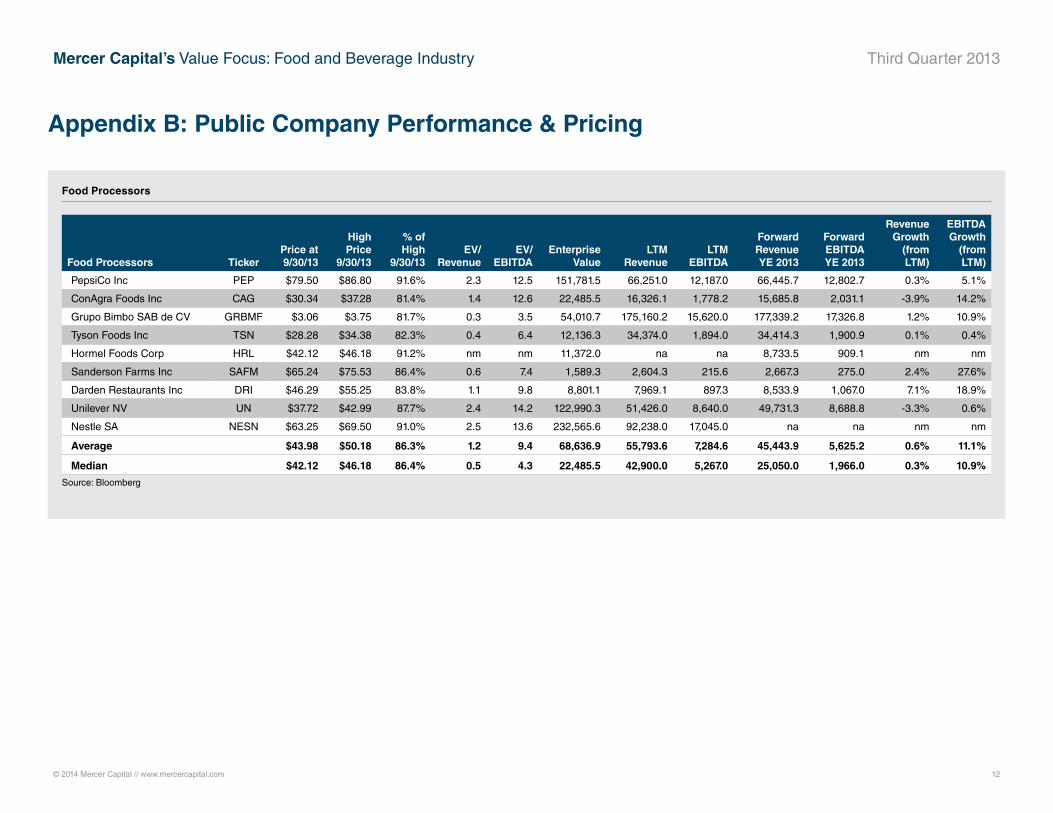
Appendix B: Public Company Performance & Pricing
Food Processors
Food Processors TickerPrice at 9/30/13
High Price
9/30/13
% of High
9/30/13EV/
RevenueEV/
EBITDA Enterprise
Value LTM
RevenueLTM
EBITDA
Forward Revenue YE 2013
Forward EBITDA YE 2013
Revenue Growth
(from LTM)
EBITDA Growth
(from LTM)
PepsiCo Inc PEP $79.50 $86.80 91.6% 2.3 12.5 151,781.5 66,251.0 12,187.0 66,445.7 12,802.7 0.3% 5.1%
ConAgra Foods Inc CAG $30.34 $37.28 81.4% 1.4 12.6 22,485.5 16,326.1 1,778.2 15,685.8 2,031.1 -3.9% 14.2%
Grupo Bimbo SAB de CV GRBMF $3.06 $3.75 81.7% 0.3 3.5 54,010.7 175,160.2 15,620.0 177,339.2 17,326.8 1.2% 10.9%
Tyson Foods Inc TSN $28.28 $34.38 82.3% 0.4 6.4 12,136.3 34,374.0 1,894.0 34,414.3 1,900.9 0.1% 0.4%
Hormel Foods Corp HRL $42.12 $46.18 91.2% nm nm 11,372.0 na na 8,733.5 909.1 nm nm
Sanderson Farms Inc SAFM $65.24 $75.53 86.4% 0.6 7.4 1,589.3 2,604.3 215.6 2,667.3 275.0 2.4% 27.6%
Darden Restaurants Inc DRI $46.29 $55.25 83.8% 1.1 9.8 8,801.1 7,969.1 897.3 8,533.9 1,067.0 7.1% 18.9%
Unilever NV UN $37.72 $42.99 87.7% 2.4 14.2 122,990.3 51,426.0 8,640.0 49,731.3 8,688.8 -3.3% 0.6%
Nestle SA NESN $63.25 $69.50 91.0% 2.5 13.6 232,565.6 92,238.0 17,045.0 na na nm nm
Average $43.98 $50.18 86.3% 1.2 9.4 68,636.9 55,793.6 7,284.6 45,443.9 5,625.2 0.6% 11.1%
Median $42.12 $46.18 86.4% 0.5 4.3 22,485.5 42,900.0 5,267.0 25,050.0 1,966.0 0.3% 10.9%
Source: Bloomberg

© 2014 Mercer Capital // www.mercercapital.com 13
Mercer Capital’s Value Focus: Food and Beverage Industry Third Quarter 2013
Appendix B: Public Company Performance & Pricing
Restaurants
Restaurants TickerPrice at 9/30/13
High Price
9/30/13
% of High
9/30/13EV/
RevenueEV/
EBITDA Enterprise
Value LTM
RevenueLTM
EBITDA
Forward Revenue YE 2013
Forward EBITDA YE 2013
Revenue Growth
(from LTM)
EBITDA Growth
(from LTM)
Frisch's Restaurants Inc FRS $24.13 $26.44 91.3% 0.7 6.1 137.5 204.3 22.4 202.0 na -1.1% nm
Ruby Tuesday Inc RT $7.50 $9.90 75.8% 0.6 18.8 735.0 1,213.2 39.1 1,266.0 95.0 4.3% 142.9%
Darden Restaurants Inc DRI $46.29 $55.25 83.8% 1.1 9.8 8,801.1 7,969.1 897.3 8,533.9 1,067.0 7.1% 18.9%
Denny's Corp DENN $6.11 $7.51 81.4% 1.6 10.0 721.4 464.3 72.3 463.9 77.3 -0.1% 6.9%
Bob Evans Farms Inc/DE BOBE $57.27 $60.22 95.1% 1.3 11.3 1,790.4 1,336.2 157.8 1,590.3 189.5 19.0% 20.1%
DineEquity Inc DIN $69.00 $85.74 80.5% 4.1 10.3 2,650.1 641.2 257.2 642.3 267.3 0.2% 3.9%
Red Robin Gourmet Burgers Inc RRGB $71.10 $86.83 81.9% 1.1 10.5 1,096.7 998.6 104.4 1,017.8 106.3 1.9% 1.8%
Cracker Barrel Old Country Store Inc CBRL $103.18 $118.63 87.0% 1.1 10.7 2,855.3 2,644.6 267.6 2,648.0 271.6 0.1% 1.5%
Average $48.07 $56.31 84.6% 1.4 10.9 2,348.4 1,934.0 227.3 2,045.5 296.3 3.9% 28.0%
Median $51.78 $57.73 82.8% 1.1 10.4 1,443.5 1,105.9 131.1 1,141.9 189.5 1.0% 6.9%
Source: Bloomberg
© 2014 Mercer Capital // www.mercercapital.com 14
Mercer Capital’s Value Focus: Food and Beverage Industry Third Quarter 2013
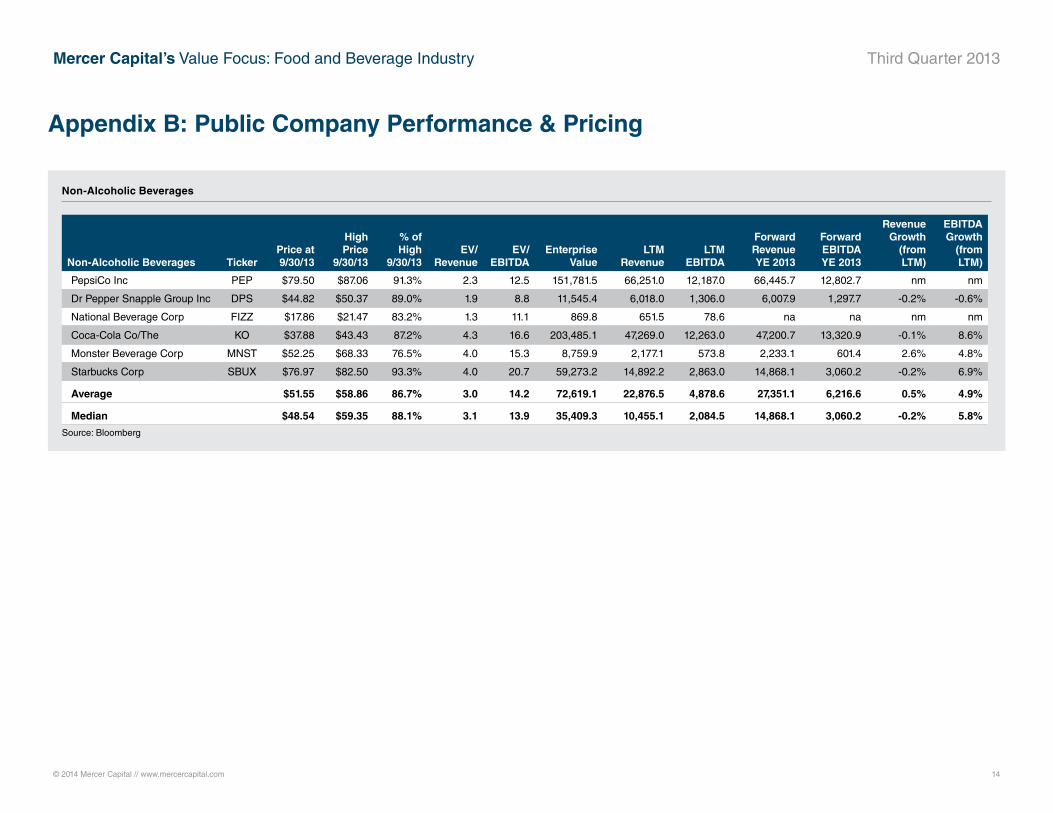
Non-Alcoholic Beverages
Non-Alcoholic Beverages TickerPrice at 9/30/13
High Price
9/30/13
% of High
9/30/13EV/
RevenueEV/
EBITDA Enterprise
Value LTM
RevenueLTM
EBITDA
Forward Revenue YE 2013
Forward EBITDA YE 2013
Revenue Growth
(from LTM)
EBITDA Growth
(from LTM)
PepsiCo Inc PEP $79.50 $87.06 91.3% 2.3 12.5 151,781.5 66,251.0 12,187.0 66,445.7 12,802.7 nm nm
Dr Pepper Snapple Group Inc DPS $44.82 $50.37 89.0% 1.9 8.8 11,545.4 6,018.0 1,306.0 6,007.9 1,297.7 -0.2% -0.6%
National Beverage Corp FIZZ $17.86 $21.47 83.2% 1.3 11.1 869.8 651.5 78.6 na na nm nm
Coca-Cola Co/The KO $37.88 $43.43 87.2% 4.3 16.6 203,485.1 47,269.0 12,263.0 47,200.7 13,320.9 -0.1% 8.6%
Monster Beverage Corp MNST $52.25 $68.33 76.5% 4.0 15.3 8,759.9 2,177.1 573.8 2,233.1 601.4 2.6% 4.8%
Starbucks Corp SBUX $76.97 $82.50 93.3% 4.0 20.7 59,273.2 14,892.2 2,863.0 14,868.1 3,060.2 -0.2% 6.9%
Average $51.55 $58.86 86.7% 3.0 14.2 72,619.1 22,876.5 4,878.6 27,351.1 6,216.6 0.5% 4.9%
Median $48.54 $59.35 88.1% 3.1 13.9 35,409.3 10,455.1 2,084.5 14,868.1 3,060.2 -0.2% 5.8%
Source: Bloomberg
Appendix B: Public Company Performance & Pricing
© 2014 Mercer Capital // www.mercercapital.com 15
Mercer Capital’s Value Focus: Food and Beverage Industry Third Quarter 2013
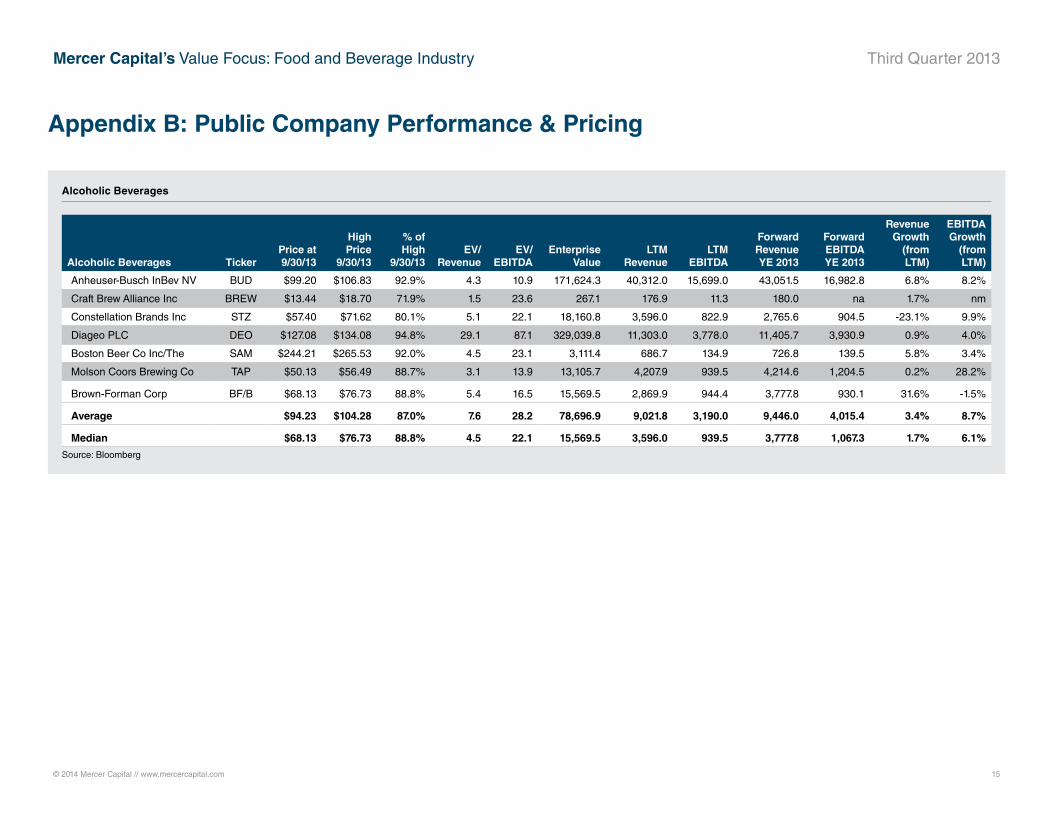
Alcoholic Beverages
Alcoholic Beverages TickerPrice at 9/30/13
High Price
9/30/13
% of High
9/30/13EV/
RevenueEV/
EBITDA Enterprise
Value LTM
RevenueLTM
EBITDA
Forward Revenue YE 2013
Forward EBITDA YE 2013
Revenue Growth
(from LTM)
EBITDA Growth
(from LTM)
Anheuser-Busch InBev NV BUD $99.20 $106.83 92.9% 4.3 10.9 171,624.3 40,312.0 15,699.0 43,051.5 16,982.8 6.8% 8.2%
Craft Brew Alliance Inc BREW $13.44 $18.70 71.9% 1.5 23.6 267.1 176.9 11.3 180.0 na 1.7% nm
Constellation Brands Inc STZ $57.40 $71.62 80.1% 5.1 22.1 18,160.8 3,596.0 822.9 2,765.6 904.5 -23.1% 9.9%
Diageo PLC DEO $127.08 $134.08 94.8% 29.1 87.1 329,039.8 11,303.0 3,778.0 11,405.7 3,930.9 0.9% 4.0%
Boston Beer Co Inc/The SAM $244.21 $265.53 92.0% 4.5 23.1 3,111.4 686.7 134.9 726.8 139.5 5.8% 3.4%
Molson Coors Brewing Co TAP $50.13 $56.49 88.7% 3.1 13.9 13,105.7 4,207.9 939.5 4,214.6 1,204.5 0.2% 28.2%
Brown-Forman Corp BF/B $68.13 $76.73 88.8% 5.4 16.5 15,569.5 2,869.9 944.4 3,777.8 930.1 31.6% -1.5%
Average $94.23 $104.28 87.0% 7.6 28.2 78,696.9 9,021.8 3,190.0 9,446.0 4,015.4 3.4% 8.7%
Median $68.13 $76.73 88.8% 4.5 22.1 15,569.5 3,596.0 939.5 3,777.8 1,067.3 1.7% 6.1%
Source: Bloomberg
Appendix B: Public Company Performance & Pricing
Mercer CapitalFood & Beverage Industry Services
Contact Us
Copyright © 2014 Mercer Capital Management, Inc. All rights reserved. It is illegal under Federal law to reproduce this publication or any portion of its contents without the publisher’s permission. Media
quotations with source attribution are encouraged. Reporters requesting additional information or editorial comment should contact Barbara Walters Price at 901.685.2120. Mercer Capital’s Industry
Focus is published quarterly and does not constitute legal or financial consulting advice. It is offered as an information service to our clients and friends. Those interested in specific guidance for legal or
accounting matters should seek competent professional advice. Inquiries to discuss specific valuation matters are welcomed. To add your name to our mailing list to receive this complimentary publication,
visit our web site at www.mercercapital.com.
Mercer Capital has expertise providing business valuation and financial advisory services to companies in the food and beverage industry.
Industry Segments
Mercer Capital serves the following industry segments:
• Food processing
• Restaurants
• Nonalcoholic Beverages
• Malt, Wine, and Spirits
Services Provided
• Valuation of food and beverage industry companies
• Transaction advisory for acquisitions and divestitures
• Valuations for purchase accounting and impairment testing
• Fairness and solvency opinions
• Litigation support for economic damages and valuation and shareholder disputes
Contact a Mercer Capital professional to discuss your needs in confidence.
Matthew R. Crow, CFA, [email protected]
Timothy R. Lee, [email protected]
Nicholas J. Heinz, [email protected]
Travis W. Harms, CFA, CPA/[email protected]
Mercer Capital5100 Poplar Avenue, Suite 2600Memphis, Tennessee 38137901.685.2120 (P)
www.mercercapital.com
BUSINESS VALUATION & FINANCIAL ADVISORY SERVICES