value creation in chemicals 2019: generating …...world’s biggest markets overshadowed the...
TRANSCRIPT

Generating Returns in a Soft Market
Value creation in chemicals 2019

Boston Consulting Group partners with leaders in business and society to tackle their most important challenges and capture their greatest opportunities. BCG was the pioneer in business strategy when it was founded in 1963. Today, we help clients with total transformation—inspiring complex change, enabling organizations to grow, building competitive advantage, and driving bottom-line impact.
To succeed, organizations must blend digital and human capabilities. Our diverse, global teams bring deep industry and functional expertise and a range of perspectives to spark change. BCG delivers solutions through leading-edge management consulting along with technology and design, corporate and digital ventures—and business purpose. We work in a uniquely collaborative model across the firm and throughout all levels of the client organization, generating results that allow our clients to thrive.

October 2019
Andreas Gocke, Adam Rothman, Hubert Schönberger, Ryan Jones, and Matthias Baeumler
Generating Returns in a Soft Market
Value creation in chemicals 2019

2 Generating Returns in a Soft Market
AT A GLANCE
The chemical industry’s shareholder returns have declined amid falling demand for many chemical products. The declines from 2014 to 2018—the latest five-year period—were worst in North America. But no region was spared.
Bucking the TrendEven in this difficult time, some chemical companies have held up well. The highest-performing companies—including four that are profiled in this report—demonstrate the value of having a deft acquisition strategy, of integrating a focused value chain, of owning an indispensable product, or of making timely geographic expansions.
The Impact of SustainabilitySustainability, something that once sat slightly outside an executive’s priority list, is now one of the first things on it. And sustainability is not just a defensive maneu-ver. From new business models to new industry segments, chemical companies and their investors are finding rewards in sustainable practices.

Boston Consulting Group 3
Chemical companies had their first decline in total shareholder returns since 2015 and their worst TSR performance since 2012.
There has been a perceptible rise in concern in the executive suites of many chemical companies over the past year. The concern was not just over falling
share prices, though that was certainly on executives’ minds as 2018 wore on. Something more fundamental happened. Demand weakened.
Chemical production in the European Union slipped 1% in the third quarter of 2018 and another 4% in the fourth quarter, the region’s biggest quarterly decline in a decade. Chemical production in China fell almost as much in last year’s fourth quarter—3%.1 For many executives, the production declines in two of the world’s biggest markets overshadowed the continuing rise in chemical output elsewhere.
The production declines for chemical companies in Europe and China coincided with the biggest selloff in global stock markets since 2008. As a result, chemical companies had their first decline in total shareholder returns (TSRs) since 2015 and their worst TSR performance since 2012, according to Boston Consulting Group. Although stock markets have since rebounded, giving shareholders some relief, it’s still useful to look at what happened to chemical company returns in 2018 and see what can be learned from companies that bucked the negative trend.
There’s no sugar-coating the situation: 2018 was a bad year for chemical sharehold-ers, with the industry losing $263 billion in market value globally. The value de-struction in 2018 wasn’t limited to chemical companies, of course; it happened in every industry. (See Exhibit 1.) In the case of chemicals, however, the decimation essentially halved companies’ five-year returns. The TSRs of large-cap chemical companies—the average compounded return an investor would have gotten in each year—fell from 16% between 2013 and 2017 to 8% between 2014 and 2018.2
BCG looks at TSRs on a rolling five-year basis to spot trends and see how compa-nies are performing over the longer term. This explains why the TSRs in this report are still in positive territory despite the wipeout in chemical-share values in 2018. (See the sidebar, “How We Calculate and Report TSR.”)
A Decline That Dragged Down Every RegionChemical TSRs declined from the previous period in all five of the regions we study. They held up best in emerging markets, including India, where chemical companies continue to excel from a TSR perspective. In general, chemical sales in emerging markets haven’t contracted the way they have in more developed markets.

4 Generating Returns in a Soft Market
That was certainly true of Greater China, despite the production declines that af-fected the region last year.3 Over the latest five-year period, chemical companies in Greater China enjoyed a 13% annual increase in revenues, as they benefitted from demand in a range of areas, including synthetic rubber and the chemicals used in pipes and fittings. Chemical companies in Greater China have also become more profitable, thanks in part to sales of textile chemicals amid a shortage of natural fiber in the apparel industry. The only factor holding back the TSRs of the Greater China chemical sector was the compression in companies’ earnings multiples, which was the largest of any region in our study. (See Exhibit 2.)
One of the interesting developments in the latest period is the reversal of fortunes between Europe and North America, the two biggest chemical regions from the standpoint of public-company market values. Not that either region avoided the 2018 downdraft. There were plenty of poor TSR performers in Europe, especially in Germany and in the multispecialty subsegment. But there were also some big win-ners in Europe’s large-cap cohort, including the pharma ingredients and additives company Lonza (five-year TSR: 28%), the food ingredients company Chr. Hansen (24%), and the flavor and fragrance producer Givaudan (16%). These companies
Annual TSR, 2014-2018 (%)
G
H
F
I
J
K
L
M
O
N
P
Q
S
T
R
U
W
X
V
Y
AA
AB
Z
AC
AD
AE
AF
AG
AH
High-low range Median industry TSRx
A B C D E F G H I J K L M N O P Q R S T U V W X Y Z AA AB AC AD AE AF AG AH
Health careservices
Financialinfrastructureproviders
Technology
Medicaltechnology
Retail
Real estate
Mid-cappharma
Aerospace& defense
Green energy& environment
Travel &tourism
Media &publishing
Consumernondurables
Large-cappharma
Large-capchemicals
Power &gas utilities
Forest products& packaging
Services
Consumerdurables
Construction
Insurance
Mid-capchemicals
Banks
Transportation& logistics
Fashion &luxury
Buildingmaterials
Machinery
Communicationservice providers
Multibusiness
AutomotiveOEMs
Asset management& brokerage
Automotivecomponents
Metals
Oil
Mining
40
100
0
–40
20
80
–20
60
17 16 15 14 11 11 10 10 10 10 10 9 9 9 8 8 8 8 8 8 7 7 7 7 7 6 5 5 5 3 3 3 2 1
A
C
D
B
E
G
H
F
I
J
K
L
M
O
N
P
Q
S
T
R
U
W
X
V
Y
AA
AB
Z
AC
AD
AE
AF
AG
AH
Sources: S&P Capital IQ; Refinitiv; BCG Value Creators Report 2019; BCG ValueScience Center.Note: 2,233 companies are in the sample.
Exhibit 1 | Chemical TSRs Fall into the Single Digits, But They’re Not Alone

Boston Consulting Group 5
Total shareholder return, which accounts for the change in share price and any other effects on shareholders’ net wealth in a given period, is the product of multiple factors. Readers of BCG’s Value Creators series are likely familiar with our methodology for quantifying the relative contributions of the various components of TSR. (See the exhibit.) The methodology uses the combination of revenue (that is, sales) growth and change in margins as an indicator of a compa-ny’s improvement in fundamental value. It then uses the change in the company’s valuation multiple to calculate the impact of investor expectations on TSR. Together, those two factors determine the change in a company’s market capitalization. Finally, the model also tracks the distribution of free cash flow to investors and debt holders—in the
form of dividends, share repurchases, and repayments of debt—in order to determine the contribution of free-cash-flow payouts to a company’s TSR.
All those factors interact—sometimes in unexpected ways. A company may increase its earnings per share through an acquisition but create no TSR if the acquisition erodes its gross margins. In addition, some forms of cash contribu-tion (like dividends) can impact a company’s valuation multiple in different ways than others (like a share buyback); the effects are complex.
In this report, the TSRs used for groups and for comparative purposes are generally medians. The TSRs associated with individual companies are straight calculations of those companies’ capital gains and cash flows, rounded to the nearest percent.
ƒ
Capital gains
Revenue growth
Profit growth
Margin change
Total shareholderreturn
Change inmultiple
Dividend yield
Cash flowcontribution Share change
Net debt change
Source: BCG analysisNote: Share change refers to the change in the number of shares outstanding, not to the change in share price.
TSR is the product of multiple factors
HOW WE CALCULATE AND REPORT TSR

6 Generating Returns in a Soft Market
helped European chemical TSRs (at 8%) surpass North American TSRs (4%, a worldwide worst) for the first time since 2008-2012. (See Exhibit 3.)
No region had anywhere close to the number—or proportion—of low chemical TSRs that North America had. There were no US chemical companies in the top TSR decile globally and only a handful in the top quartile. Many US chemical com-panies have been saddled with slow growth, in the low single digits. One exception is the specialty company Entegris, which had a TSR of 20%—five times the North American average. (See below for an analysis of the company’s performance.) Ham-pered by increases in raw material costs, North American chemical companies also struggled in other components of TSR, including profitability.
Northeast Asian chemical companies, which had the best TSRs for 2013-2017, dropped to second-worst in the latest period. TSRs held up better in Japan, which ac-counts for four-fifths of the region’s players, than in South Korea, which accounts for the other fifth. Chemical companies in both countries showed improved margins, and the region would have done better from a TSR perspective if multiples had not fallen. Japan has a disproportionate share of the chemical industry’s multispecialty companies. Though multispecialty companies have lost some favor in the West, they dominate Japan’s chemical industry, where names like Toray and Teijin are very familiar to customers who rely on the companies’ Torayca and Twaron products.
Where the Returns Are Flowing, by Chemical SubsectorIn 2014, focused specialties moved into the top TSR slot among subsectors, and by now it’s clear that their ascent has not been a fluke. The business model of focused specialty companies—developing highly targeted products, generally for a specific
For the period 2014–2018 (%)
Emerging markets Greater China Europe Northeast Asia North America
Revenue growth Margin change Change in multiple Cash flow effects Five-year TSR (median)
5
3
4
4
0 9
1513
43 2
1 0 1 4
4
–5
5 723 8
–1
7
–12
Sources: S&P Capital IQ; BCG analysis.Note: Components may not add to the total TSR because of rounding. Data is for 219 of the 224 companies in our sample. DowDuPont (North America), Sahara Petrochemicals and Boubyan (Northeast Asia), Sirius Minerals (Europe), and Tianqi Lithium (Greater China) are excluded because TSR contributions are not available.1Greater China includes companies in mainland China, Hong Kong, and Taiwan. 2Northeast Asia includes companies in Japan and South Korea.
Exhibit 2 | Components of Chemical TSRs, by Region

Boston Consulting Group 7
set of customer industries, with a highly tailored application range—has pushed them ahead of all other chemical subsectors on fundamental measures of business performance, including return on capital employed and return on net assets. This surge has helped keep them at the top of the TSR rankings.
The differential between focused specialty and multispecialty TSRs is especially pronounced in Europe. Indeed, Europe’s multispecialty subsegment is one of the two red bubbles (indicating a negative average TSR) on our performance map. (See Exhibit 4.) If not everywhere, then certainly in Europe, multispecialty companies are finding answers elusive.
Certain chemical specialties were associated with particularly strong returns in the latest five-year period. For instance, of the 20 focused-specialty companies with the highest TSRs, 13 participate in the fields of electronic chemicals, food ingredients, or paints and coatings.
On the other hand, having too much exposure in an industry with softening sales can be a drawback. This is apparent from the companies that are most dependent on the automotive industry, whose record stretch of growth appears to be nearing an end. The companies so exposed—about one-fifth of all the chemical companies in our study—had TSRs of 6%, two percentage points below the chemical industry’s overall average.
From a TSR perspective, agrochemical and fertilizer companies again came in last. The only way an investor could have made a return in this subsector would have
North AmericaNortheast AsiaEuropeGreater China
–30
90
0
60
30
–30
90
0
60
30
–30
90
0
60
30
–30
90
0
60
30
–30
90
0
60
30
Total number of companies
Total number of companies
Total number of companies
Total number of companies
Total number of companies42 40 51 57 34
TSR, 2014-2018 (%)
Median 15 9 8 7 4
TSR, 2014-2018 (%) TSR, 2014-2018 (%) TSR, 2014-2018 (%) TSR, 2014-2018 (%)
Agrochemical and fertilizer (32 companies)
Emerging markets
Focused specialties (77 companies)
Multispecialty (50 companies)
Base chemicals & basic plastics (59 companies)
Industrial gases(7 companies)
Sources: S&P Capital IQ; BCG analysis.Note: Total sample is 224 companies.1Greater China includes companies in mainland China, Hong Kong, and Taiwan. 2Northeast Asia includes companies in Japan and South Korea.
Exhibit 3 | TSRs Are Highest and Most Widely Varied in Emerging Markets

8 Generating Returns in a Soft Market
been by betting on very small-cap companies outside of the US and Western Europe (like Russia’s Acron Group and China’s Zhejiang Huge Leaf, which both produced stellar returns). The agrochemical and fertilizer subsector has been wrestling both with its usual challenges—currency issues, weather, crop prices, increasing regulatory burden—and with some new ones. One new challenge is the US-China trade war, which is weighing on the agricultural subsector and on those supplying chemicals to farms. Together, these challenges have led to consolidation in the agricultural chemi-cals, seeds, and fertilizer product categories—in turn raising hopes of a rebound in the subsector.
Lessons from Four WinnersIn every industry, it’s instructive to examine the companies that are outperforming to see if there’s anything one can learn from their examples. The companies we profile this year reflect the industry’s geographic diversity and subsector variety.
A Strategy of Bolt-On Acquisitions. The Swiss company Sika (TSR: 21%) has used a succession of mostly small acquisitions to get a bigger piece of the global market for adhesives and construction chemicals. Sika made two dozen acquisitions over the five years of our latest study period, paying less than $50 million each, on average, for the companies it acquired. (At the beginning of 2019, just months after success-
Subsector Emergingmarkets
EuropeGreaterChina
NortheastAsia
NorthAmerica
Total marketcapitalization
($B) and TSR (%)
Base chemicals and basic plastics
Median five-year (2014-2018) TSR (%)
Multispecialty
Focused specialties
Industrial gases
Agrochemicals and fertilizers
Five-year TSR
Total market cap($B) and TSR (%)
381
15%
495
8%
180
9%
244
7%
421
4%
484
462
470
188
117
7%
10%
10%
4%
1,722 8%
6%
10-20% 0-10% <0% Circle size represents market capitalization>20%
8.9% 17.6%
–0.4%
10.8%
8.1%
4.7%0.8%
16.4%
10.4%
6.7% 4.0%
8.1%
6.6%
12.9% 11.9%
1.2%
6.9%
3.4%
–2.3%
52.8%
30.8%
11.8%
Sources: S&P Capital IQ; BCG analysis.Note: Total sample is 224 companies.1Greater China includes companies in mainland China, Hong Kong, and Taiwan. 2Northeast Asia includes companies in Japan and South Korea.
Exhibit 4 | Focused Specialties Show Strong Gains in Emerging Markets but Retreat in the US

Boston Consulting Group 9
fully fending off a takeover threat of its own, Sika entered its biggest deal ever, paying $2.6 billion for the French company Parex.)
Its acquisitions—which have generally been done to give Sika access to complemen-tary technologies or new geographic markets—have contributed to the company’s above-average growth. One-third of Sika’s 6% average annual growth in the past five years has come from acquisitions; the rest has come from organic expansion.
Sika now does business in more than 100 countries. The company’s additives are in the high-performance concrete of New York’s giant Hudson Yards development proj-ect. And its concrete fibers are preventing cracks in the floors of parking garages at Suzhou Central Plaza in Beijing, which houses the world’s largest shopping mall.
The lesson from Sika: Acquiring smaller, related, “hidden jewel” targets can rapidly accelerate revenue growth and strengthen competitive advantages.
An Integrated Value Chain. Indorama Ventures Limited (IVL) has also been a skillful acquirer—doing more than 20 deals over our most recent five-year study period—and this has contributed to the company’s EBIDTA growth. Formerly known mostly as a PET producer, IVL has integrated both backward, to protect itself against the high cyclicality of the PET feedstock markets, and forward, to participate in markets offering higher margins. Today, IVL’s portfolio comprises integrated PET, integrated olefins, specialty chemicals, fibers, and packaging.
Along the way, the Bangkok-based company has established a global footprint, with production capacity and sales distributed across Asia, Europe, and the Americas. Its wide presence means IVL operates with the advantages of a local player in key geo-graphic markets.
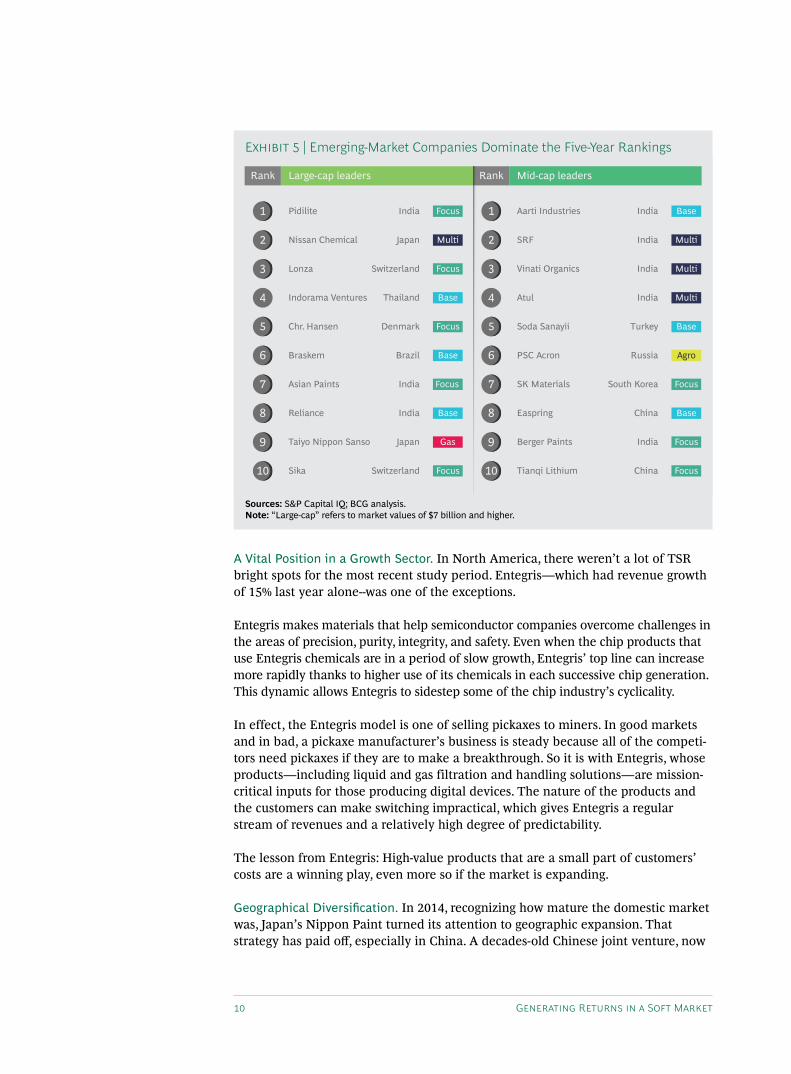
Indeed, another reason that IVL (TSR: 24%) is worth looking at is its location in an emerging market—the geographic segment in our study that has the most winners in this year’s rankings. (See Exhibit 5.)
The company’s $2.1 billion acquisition of Huntsman’s intermediates and surfac-tants manufacturing assets (its biggest transaction ever, announced in the summer of 2019) exemplifies its strategic use of M&A. With Huntsman’s assets in hand, IVL’s upcoming Louisiana steam cracker will be fully captive, eliminating a previous ex-posure to merchants of roughly 25 percent. The deal also makes IVL the second- largest producer of ethylene oxide in the US—a crucial benchmark given the com-pany’s determination to operate only in segments where it has a chance of being a leader. (IVL holds a 25% market share in PET and has more than twice the capacity of its nearest competitor.) The Huntsman acquisition also gives IVL an entrée into specialty surfactants, polyurethane materials, fuel additives, and other performance products, all of which enjoy comparatively fast-growing demand and attractive margins.
The lesson from Indorama: Integration can provide protection against the inherent cyclicality in the chemicals value chain, while also providing advantaged access to higher-value segments further downstream.
Integration can provide protection against the inherent cyclicality of the chemicals value chain, while giving access to higher-value segments.
10 Generating Returns in a Soft Market
A Vital Position in a Growth Sector. In North America, there weren’t a lot of TSR bright spots for the most recent study period. Entegris—which had revenue growth of 15% last year alone--was one of the exceptions.
Entegris makes materials that help semiconductor companies overcome challenges in the areas of precision, purity, integrity, and safety. Even when the chip products that use Entegris chemicals are in a period of slow growth, Entegris’ top line can increase more rapidly thanks to higher use of its chemicals in each successive chip generation. This dynamic allows Entegris to sidestep some of the chip industry’s cyclicality.
In effect, the Entegris model is one of selling pickaxes to miners. In good markets and in bad, a pickaxe manufacturer’s business is steady because all of the competi-tors need pickaxes if they are to make a breakthrough. So it is with Entegris, whose products—including liquid and gas filtration and handling solutions—are mission- critical inputs for those producing digital devices. The nature of the products and the customers can make switching impractical, which gives Entegris a regular stream of revenues and a relatively high degree of predictability.
The lesson from Entegris: High-value products that are a small part of customers’ costs are a winning play, even more so if the market is expanding.
Geographical Diversification. In 2014, recognizing how mature the domestic market was, Japan’s Nippon Paint turned its attention to geographic expansion. That strategy has paid off, especially in China. A decades-old Chinese joint venture, now
Large-cap leadersRank Mid-cap leadersRank
PSC Acron
SK Materials
Easpring
Tianqi Lithium
Aarti Industries
Vinati Organics
Atul
SRF
Soda Sanayii
Berger Paints
Russia
South Korea
China
China
India
India
India
India
Turkey
India
Braskem
Asian Paints
Reliance
Sika
Pidilite
Lonza
Indorama Ventures
Nissan Chemical
Chr. Hansen
Taiyo Nippon Sanso
Brazil
India
India
Switzerland
India
Switzerland
Thailand
Japan
Denmark
Japan
Focus
Multi
Base
Agro
Base
Multi
Focus
Base
Focus
Multi
Multi
Base
Focus
Base
Focus
Base
Gas
Focus
Focus
Focus
1
2
3
4
5
6
7
8
9
10
1
2
3
4
5
6
7
8
9
10
Sources: S&P Capital IQ; BCG analysis.Note: “Large-cap” refers to market values of $7 billion and higher.
Exhibit 5 | Emerging-Market Companies Dominate the Five-Year Rankings

Boston Consulting Group 11
operating as a subsidiary, provided Nippon Paint with connections, and with an understanding of the Chinese market that many non-Chinese companies haven’t managed to develop. Rising household incomes in China have prompted consum-ers to buy new apartments and repaint their homes. With the ecofriendliness of some of its product lines, Nippon Paint is well positioned to meet the health expectations of these consumers, as well as the expectations of China’s govern-ment, which is becoming stricter in its regulations and more insistent on sustain-able practices.
Nippon Paint—which enjoyed faster revenue growth than any company on our top-ten TSR list—hasn’t limited its geographic expansion to China and other parts of Asia. The company’s 2017 acquisition of Dunn-Edwards gave it a strong position in the US. And newer acquisitions, of the Australian company DuluxGroup and the Turkish company Betek in 2019, show Nippon Paint’s determination to establish it-self in other geographies where it wasn’t previously an important player. Besides its strong five-year TSR (18%; 11th-best among the large-cap companies in our study), Nippon Paint is also a top-ten performer on our 10- and 20-year large-cap chemical TSR lists. It is one of only five chemical companies with that kind of unbroken suc-cess. (The others are Asian Paints, Braskem, Nissan Chemicals, and Sika.)
The lesson from Nippon Paint: Geographic expansion can be a winning play—espe-cially in product segments with a strong local component.
Sustainability’s Growing Impact on TSRThe topic of sustainability has become integral to any TSR discussion. In the early part of this decade, there was no clear relationship between chemical companies’ TSRs and their sustainability performance. That started to change a few years ago. Now—with tightening regulations, heightened consumer pressure, and increasingly dire predictions about the consequences of climate change—the relationship is unmistakable.
In particular, an inverse correlation between carbon emissions and chemical com-pany valuations has emerged in the past two years. Carbon emissions aren’t the biggest factor in valuations—they’re well behind profit margins and other financial metrics that investors consider—and it’s not clear if emissions directly cause valua-tion changes, but they are certainly something that investors are thinking about. It seems reasonable to assume that, before long, other aspects of sustainability will also come under investor scrutiny.
The change in the valuation equation for chemical companies, early though it is, shouldn’t be downplayed. It’s clear that something has changed when a group as well-connected as the Business Roundtable issues a statement—as this US entity did in August 2019—saying that shareholder interests must be in balance with other outcomes, including environmental protection. Chemical companies are al-ready devoting more attention to sustainability, whether through new groups like the Alliance to End Plastic Waste or through increased investment in recycling tech-nologies. The question is whether some of these sustainability efforts can also work in support of companies’ TSR strategies.
An inverse correlation between carbon emissions and chemical company valuations has emerged in the past two years.

12 Generating Returns in a Soft Market
Especially for companies with large carbon footprints, there appears to be an op-portunity to obtain better valuations in capital markets if they take steps to reduce their emissions. For now, the opportunity is greatest in Europe and the US. In these regions, where awareness of sustainability issues is most deeply engrained, our re-search shows that valuations can get more than a 10% boost for every 500-ton emis-sions reduction per $1 million in revenue. The effects in Asia are nowhere near this level. (See Exhibit 6.)
Reducing carbon emissions by 500 tons for every $1 million of revenue isn’t going to be easy for every chemical company. But some subsectors—in particular, fertiliz-er companies and base chemical companies—may well have a chance to do this. The average carbon intensity of these two subsectors is roughly 1,400 tons/$1 mil-lion and 900 tons/$1 million in revenue, respectively—in other words, quite high.
It seems certain that, in the future, carbon emissions won’t be the only sustainabili-ty measure that investors look at. While our analysis showed no correlation with other environmental, social, or governance topics, some of those topics (for exam-ple, air quality, waste management, and recycling) are natural points of focus in a chemical industry context.
Some parts of the industry already recognize that the old model of maximizing vol-umes is outmoded. Agrochemical companies that once focused on selling as much fer-tilizer or pesticides to farms as possible are taking advantage of precision digital read-outs and promising that they can provide similar outcomes with substantially lower chemical volumes. Top adhesives manufacturers are developing products that have the same fixative properties but use far less material. There are many such examples.
Explanatory power (%) ofvarious factors in chemical company valuations
Expected increase in marketvaluation from emissions cuts
86 chemical companies Europeancompanies
UScompanies
Basevaluation
50
100
150
0Asian
companies
Unexplained
Carbon emissions intensityLeverage (-)
JV income (+)
Growth expectations (+)
Financialmetrics
Explanatorypower: 79%
4%increase
11%increase
14%increase
Dividend payout (+)
Margins (+)
7999
12
33
21
Sources: MSCI; S&P Capital IQ; BCG ValueScience Center.Note: Market valuations for Asia, Europe, and the US assume a 500-ton reduction in carbon emissions for every $1 million in revenue. Data is based on 86 companies’ 2016-2018 fiscal years. Agrochemicals and fertilizers, base chemicals and basic plastics, industrial gas, and multispecialty companies are all in the analysis. Focused specialty companies are not included; their various niches make comparisons difficult.
Exhibit 6 | US and European Companies Benefit Most from Emissions Cuts
Boston Consulting Group 13
As a whole, however, the industry has a long way to go. Consider that one-third of the companies in our sample don’t even report the size of their carbon footprints. And almost no chemical companies have set a quantitative ambition for carbon re-duction beyond 2030. Companies must realize that sustainability initiatives often take years to produce results. They should take steps now, both to reduce their emissions and to become leaders in other areas of sustainable chemistry.
Imperatives for Chemical Industry LeadersThe contraction in chemicals production that hit Europe and China in the second half of 2018 remains a reality in some markets. The most widely followed forecast-ers of chemical production, including the European Chemical Industry Council and the American Chemistry Council, have said that they expect volumes to fall in 2019 versus 2018. And there are other problems, too, including the China-US trade battle, which has depressed investment levels throughout the industrial economy. But even in a challenging economic environment, there are attributes that chemical companies can develop and strengthen to increase their chances of improved per-formance and increased shareholder returns. Here are five of the most important:
• Growth foundation. Commercial excellence and channel management excel-lence, including digitally enabled sales, are essential capabilities for any chemi-cal company that wants to grow. So is some degree of presence in regions, such as Greater China, that will inevitably expand in the long term. Another growth imperative is to be positioned in end-use markets that have unmistakably bright futures. This means having a portfolio of leading products in the appropriate application areas.
• Customer focus. In every business, and certainly in a mature one like chemi-cals, the innovations that matter most generally come from listening to custom-ers. This makes it imperative for chemical companies to have multiple ways of capturing end-user feedback and for everyone in the organization to have a stake in enhancing customer responsiveness.
• Differentiated business models. The succession of years in which focused specialty companies have won the TSR “sweepstakes” is a clear sign that these companies are doing something right. Not every chemical company has the profile of a focused chemical company, and no company can magically turn itself into one. But most companies can adopt some of these companies’ tac-tics—whether it’s allocating resources for each business as though it were a standalone company or allowing different business models to flourish in the same portfolio.
• A facility for digital. Every chemical company should already be using digital technologies across its business. Digital technologies can bring huge efficiency gains to operations. They also give chemical companies a way of interacting with customers that customers may prefer, and they enable new business models.
• A staked-out position in sustainability. We have already noted the impact that carbon emissions are having on chemical-company valuations. But there’s
The most widely followed forecasters of chemical production say they expect volumes to fall in 2019 versus 2018.

14 Generating Returns in a Soft Market
more to it than that. Sustainability awareness, though it has different meanings across chemical subsegments, is fast becoming a license to operate—a must-have attribute rather than a nice-to-have attribute.
The day is not far off when sustainability changes from a largely defensive con-cept to an offensive one. New industry segments, new business models, a circu-lar economy that emphasizes alternative feedstocks, reduced material input, and recyclability—these are among the opportunities that are appearing under the broad heading of sustainability. Every chemical company that’s in it for the long term will have to pivot in the direction of these opportunities. We’re not saying that products that leave the world safer and healthier are a big part of chemical industry revenues today; they’re not. But this will change. The speed at which sustainability products grow in the chemical industry might eventually re-semble the speed at which cloud products grew in software. From under 1% of all revenues today, to 5% of revenues in 2024, to 35% of revenues in 2030? That isn’t exactly a prediction, but we wouldn’t bet against it.
Notes1. European Union data comes from the European Chemical Industry Council. Data for China is from the American Chemicals Council.2. Mid-cap chemical companies experienced an even greater drop in their five-year TSRs, to 7% in 2014-2018 from 17% in 2013-2017.3. Of the 57 chemical companies in our Greater China sample, 48 are in mainland China, seven are in Taiwan, and two are in Hong Kong.

Boston Consulting Group 15
About the AuthorsAndreas Gocke is a managing director and senior partner in the Munich office of Boston Consult-ing Group. He is the global leader of BCG’s chemical sector. You may contact him by email at [email protected].
Adam Rothman, managing director and partner in the firm’s Chicago office, heads the materials and process industries sector in North America. You may contact him by email at [email protected].
Hubert Schönberger is a senior knowledge expert in BCG’s Munich office. You may contact him by email at [email protected].
Ryan Jones is a principal in the firm’s Chicago office. You may contact him by email at [email protected].
Matthias Baeumler is a managing director and partner in BCG’s Hamburg office. You may con-tact him by email at [email protected].
AcknowledgmentsThe authors acknowledge the contributions of their BCG colleagues Jooyoung Ahn, Robert Blau-deck, Ted Chan, Cristina Figaredo, Ben Fingerle, Jan Friese, Kati Fuisz-Kehrbach, Amit Gandhi, Paul Gordon, Abhrajit Guria, Gerry Hansell, Susumu Hattori, Christian Hoffmann, Alexander Hogreve, Lisa Hu, Marcin Jedrzejewski, Dinesh Khanna, Jihoon Kim, Abhijit Kodey, Martin Link, Tobias Mahnke, Julia Meisel, Marcus Morawietz, Eduard Pujol, Laura Roca, Fabrice Roghé, Diptiman Roy, Gabriela Schaefer, Dirk Schilder, Naoki Shigetake, Ryan Thaner, Aico Troeman, Yaroslav Verkh, Gary Viersen, and Daisuke Yano.
They also thank Mary Leonard for marketing support, Robert Hertzberg for writing assistance, and Katherine Andrews, Kim Friedman, Abby Garland, Frank Müller-Pierstorff, Shannon Nardi, and Ron Welter for editorial, design, and production support.
For Further ContactIf you would like to discuss this report, please contact one of the authors.

For information or permission to reprint, please contact BCG at [email protected].
To find the latest BCG content and register to receive e-alerts on this topic or others, please visit bcg.com. Follow Boston Consulting Group on Facebook and Twitter.
© Boston Consulting Group 2019. All rights reserved.10/19

bcg.com