valuation of scatec solar asa - semantic scholar · reipp program in addition to new market entries...
TRANSCRIPT

NorwegianSchoolofEconomics
Bergen,Spring2016
ValuationofScatecSolarASAAfundamentalanalysisofahigh-growthcompany
ErikHeierSødalSupervisor:XunhuaSu
MasterThesis,Economics&BusinessAdministration,Finance
This thesis is written as part of the Master of Science in Economics and Business
Administration at NHH. Neither the institution, supervisor or examiners – through the
approvalofthisthesis–areresponsiblethetheoriesandmethodsapplied,northeresults
andconclusionsdrawninthiswork.

2
Abstract
This thesis aims at obtaining the fair value of Scatec Solar ASA by applying a three-stage
weightedaverage costof capitalmodel, supportedwitha relativevaluationapproach.By
thoroughlyexaminingkeyaspectsof thesolarpower industryaswellascrucialcompany-
specificfactors,necessaryassumptionsaremadeinordertoforecastfutureperformanceof
thecompanyandcarryoutthevaluation.
On the back of substantial cost decreases recent years, the solar power industry has
experienceda rapidgrowth in capacityandglobalization.Furtherdrivenbygovernmental
supportmechanismsthese trendsareexpectedtocontinue,establishingsolarpowerasa
prominentcontributortotheglobalenergysupplyinthefuture.Withexperienceandasolid
integratedstructureandnetwork,ScatecSolariswellpositionedinthisemergingindustry.
Currentlyholdingastrongprojectfunnel,containingnewcapacitybothclosetoconstruction
andindevelopment,thecompanyissettocontinueitsrapidgrowthgoingforward.
Implemented inthefundamentalvaluationthesefactorsyieldanestimatedsharepriceof
NOK53 forScatecSolarASA.Supportedby the relativeEV/EBITDAvaluation, theanalysis
indicatesastrongupsidefromthecurrentlytradedpriceofthestock.Althoughtheresults
contain large amounts of uncertainty, revealed through analyses of sensitivity and risk
factors,IconcludethatScatecSolariscurrentlyundervaluedandthatabuyrecommendation
isappropriate.


4
TableofContents
1 Introduction...............................................................................................................6
2 ScatecSolar...............................................................................................................82.1 History...........................................................................................................................82.2 Structure........................................................................................................................92.3 ValueChain..................................................................................................................10
2.3.1 ProjectDevelopment......................................................................................................10
2.3.2 Financing.........................................................................................................................11
2.3.3 Construction...................................................................................................................11
2.3.4 Operations......................................................................................................................11
2.3.5 PowerProduction(IPP)...................................................................................................11
3 ValuationMethods..................................................................................................123.1 DiscountedCashFlow(DCF).........................................................................................12
3.1.1 TheWeightedAverageCostofCapitalMethod(WACC)................................................13
3.1.2 FreeCashFlowtoEquity(FCFE).....................................................................................14
3.1.3 AdjustedPresentValueMethod(APV)...........................................................................15
3.2 RelativeValuation–AMarketBasedApproach...........................................................163.3 ContingentClaimValuation.........................................................................................17
4 ChoiceofModelandMethod...................................................................................18
5 TheSolarEnergyIndustry........................................................................................205.1 RecentDevelopment...................................................................................................20
5.1.1 ModulePriceDecrease...................................................................................................20
5.1.2 GeographicalExpansionandCumulativeGrowth..........................................................21
5.2 PoliciesandSupportMechanisms................................................................................235.2.1 Feed-inTariffs(FiTs).......................................................................................................23
5.2.2 ReverseAuctionsandTenders.......................................................................................24
5.2.3 TaxIncentives.................................................................................................................24
5.2.4 PowerPurchaseAgreements(PPA)................................................................................25
5.3 SolarPowerMarketOutlook........................................................................................255.3.1 Costs&Technology........................................................................................................25
5.3.2 Capacity..........................................................................................................................27
5.3.3 Policies............................................................................................................................29
5.4 RenewablesvsFossilFuels...........................................................................................305.5 Summary.....................................................................................................................32
6 Strategicanalysis.....................................................................................................336.1 Porter’sfiveforces.......................................................................................................33
6.1.1 Thethreatofnewentrants.............................................................................................34
6.1.2 Thepowerofsuppliers...................................................................................................35
6.1.3 Thepowerofbuyers.......................................................................................................35
6.1.4 Thethreatofsubstitutes................................................................................................36
6.1.5 Therivalryamongexistingcompetitors.........................................................................37
6.1.6 Conclusion......................................................................................................................38
6.2 SWOT-Analysis.............................................................................................................396.2.1 Strengths........................................................................................................................39
6.2.2 Weaknesses....................................................................................................................40
6.2.3 Opportunities.................................................................................................................42
6.2.4 Threats............................................................................................................................44

5
6.2.5 Conclusion......................................................................................................................45
7 FinancialStatementAnalysis...................................................................................467.1 HistoricalPerformance.................................................................................................467.2 NormalizingFinancialStatements................................................................................50
7.2.1 IncomeStatement..........................................................................................................50
7.2.2 CapitalExpenditures-CAPEX.........................................................................................51
7.2.3 WorkingCapital..............................................................................................................52
7.2.4 ReformulatedBalanceSheet..........................................................................................55
8 DriverAssumptions..................................................................................................568.1 PowerProduction........................................................................................................56
8.1.1 2016–2020:Furthergrowth..........................................................................................57
8.1.2 2021–2025:StabilizingGrowth.....................................................................................61
8.2 PowerPrices–PurchasePowerAgreements................................................................628.2.1 RunningPPAs..................................................................................................................63
8.2.2 Backlog&PipelinePPAs.................................................................................................64
8.2.3 FuturePPAs....................................................................................................................66
8.3 CapitalExpenditure–InvestmentsinPPE....................................................................668.4 ConclusionDriverAssumptions....................................................................................69
9 TheCostofCapital...................................................................................................709.1 Costofequity...............................................................................................................70
9.1.1 Risk-freerate..................................................................................................................71
9.1.2 Beta.................................................................................................................................72
9.1.3 Marketriskpremium......................................................................................................75
9.1.4 SmallFirmPremium.......................................................................................................76
9.2 Costofdebt.................................................................................................................769.2.1 Tax..................................................................................................................................78
9.3 TargetCapitalStructure...............................................................................................799.4 Results.........................................................................................................................80
10 FreeCashFlowtoFirm–Valuation......................................................................81
11 TheMarketBasedApproach................................................................................8511.1 ValuationSummary.....................................................................................................86
12 SensitivityAnalysis&RiskFactors........................................................................8712.1 Sensitivity....................................................................................................................87
12.1.1 CostofCapital&TerminalGrowthRate....................................................................87
12.1.2 StabilizingGrowthStageAssumptions.......................................................................88
12.1.3 ConclusionSensitivity.................................................................................................89
12.2 RiskFactors..................................................................................................................9012.2.1 CountryRisk...............................................................................................................90
12.2.2 Componentavailability..............................................................................................90
12.2.3 ProjectAvailability......................................................................................................91
12.2.4 FinancialRisks.............................................................................................................91
13 Conclusion...........................................................................................................92
14 References...........................................................................................................94
15 Appendix.............................................................................................................9915.1 Appendix1...................................................................................................................9915.2 Appendix2.................................................................................................................10015.3 Appendix3.................................................................................................................101

6
1 Introduction
Climate changehasbeen among the toppriorities ofworld leaders andorganizations for
decades. In December 2015, 196 countries pledged to the Paris Agreement at the 21st
Conference of Parties (CoP). A new legally-binding framework for an internationally
coordinatedefforttotackleclimatechange(Climatefocus,2015).Theagreementstatesagoal
oflimitingtheglobalwarmingincreaseto1.5degreesCelsiusandallpartiesare,forthefirst
time, required to regularly report on their efforts and undergo international review.
Contributingtoroughlytwo-thirdsofallanthropogenicgreenhouse-gasemissions(IEA,2015),
theenergysectorisatthecentreofattentionandtheParisAgreementindicatetheendof
businessasusualfortheindustry.RespondingtotheoutcomeofCOP21,SolarPowerEurope
presidentOliverSchafertoldPVMagazine(2015)thatthis“fast-trackstheenergytransition”
andthat
“Solariskeytorevisingclimatechangeandmakinggoodeconomicsense”
OliverSchafer,PresidentofSolarPowerEurope
Atransformationoftheenergysectortowardsrenewablesisconsideredcrucialtolimitglobal
warming. The International EnergyAgencyestimates that inorder to fully implement the
pledgesoftheParisAgreement,atotalinvestmentof$13.5trillioninenergyefficiencyand
low-carbontechnologiesfrom2015-2030isrequired(IEA,2015).Ofthis,investmentsinsolar
powercapacitymakeuparound$1.2trillion.
Inadditiontoacentralroleinaddressingtheworldsenvironmentalissues,thefutureofsolar
energy is also supported by the United Nations sustainable development goal number 7
(SDG7) looking to: “Ensure access to affordable, reliable and sustainable energy for all.”
(UnitedNations, 2016). These targets are crucial to drive economic growth and reducing
extremepovertyasone in fivepeople in theworld still lacksaccess tomodernelectricity
(WorldBank,2016).
7
Inlightoftheabovementionedsituationintheglobaleconomyandthesolarpowerindustry,
thisthesiswillassesskeydriversandcharacteristicsofsolarpowerinordertoestimatethe
truevalueofScatecSolarASA.Boththegeneraldriverspresentedinearlierparagraphsand
industry-specificdevelopmentwillbeexamined.
Thethesisisstructuredinthefollowingmanner.Chapter2presentabriefintroductiontothe
company, its current structureandvaluechain. Whilechapter3and4describedifferent
available theoretical valuation methods and an argumentation of the most suitable
approacheswhen valuing Scatec Solar. Further, the solar power industry, its competitive
structuretogetherwiththecompany’sstrategicalpositioningareassessedinchapter5and
6.Chapter7,8and9analyseScatecSolar’sfinancialstatements,estimatedriverassumptions
andpresenttheappliedcompanycostofcapital.Finally,thelastchapters10,11and12reveal
the results of the fundamental and relative valuation and evaluate the results through a
sensitivityanalysisandanassessmentofriskfactors.
8
2 ScatecSolar
Scatec Solar ASA is a global integrated independent solar power producer. By offering
development,construction,ownershipaswellasoperationandmaintenance,ScatecSolaris
representedthroughouttheentirevaluechainforutility-scalesolarpowerplants.Currently
operating in the United States, Czech Republic, Rwanda, Honduras and South Africa the
companyhasacombinedproductioncapacityof383MW1.
2.1 History
ScatecSolarwasofficiallyestablishedinFebruary2007,buttheiroperationsstartedalready
in 2001 after the acquisition of Solarcompetence GmbH, a German project development
company awarded theworld’s largestmegawatt solar park in 2001. Following theofficial
establishment, the company started expanding both geographically and across the value-
chainin2008.EnteringbothItalyandCzechRepublic,ScatecSolarnowofferedbothdesign
and construction in addition to operation and maintenance. Of all new developed and
constructedprojectsbetween2008-2010,thecompanyonlyretainedfullownershipoffour
powerplantsinCzechRepublicwithatotalcapacityof20MW.
Going forward, as a now fully integrated independent power producer, Scatec Solar
continuedtheirgeographicalexpansionbyenteringtheUnitedStatesandFrance.Aspartof
the start-up of South Africa’s government-backed Renewable Energy Independent Power
ProducerProcurementProgram(REIPPP),thecompanyalsoenteredSouthAfricabeingone
ofthewinnersinthefirstbiddinground.In2011theyexpandedtheirpositioninAfricafurther
throughenteringseveralmarketsinthewest.By2013,twonewconcessionswerewoninthe
REIPPprograminadditiontonewmarketentriesintoJapan,theUnitedKingdom,Rwanda
andJordan.
InOctober2014thecompanywaslistedontheOsloStockExchangeunderthenameScatec
SolarASAandhavesincethencontinuedtheirglobalgrowthbycompletinganewplantin
Honduras.
1By31.03.2016–Q1report2016

9
2.2 Structure
Figure1:CompanyStructure,Source:ScatecSolar(2014)
ScatecSolarisdividedupinthreemainbusinesssegmentsasshowninfigure1above.Power
ProductioncoversmanagementofthefullyorpartiallyownedpowerplantswhileOperation
andMaintenance(O&M)coversallsolarplantsinadditiontosomethirdpartyplantsinItaly,
France and Germany. With commercial, technical, legal and financial competence the
DevelopmentandConstruction(D&M)segmentbringsnewprojectopportunitiestofinancial
closeandconstruction.
A simplified illustration of the complete structure of Scatec Solar and themain contracts
runningoneachsolarproject ispresented in figure2. It showshowthecoresolarpower
generationisplacedinaspecialpurposevehicles(SPVs)alsoreferredtoasprojectcompanies.
Theseprojectcompaniesareeitherfullyownedbythecompanyorpartneredwithanequity
co-investor.ScatecSolarthenprovidesD&CandO&MservicestoeachSPVexternally.Each
SPVholdsitsownoff-takeagreements,landleasecontractsandloanagreementswhichthe
groupisnotaccountableforbeyondtheirstakeintheSPV.

10
Figure2:SimplifiedStructureIllustration,Source:ScatecSolar(2014))
2.3 ValueChain
Asanintegratedindependentpowerproducer,ScatecSolaroperatesinthelastfiveofatotal
sixstepsfromrawmaterialstoanoperatingsolarpowerplantillustratedinfigure3.
Figure3:SolarPowerValueChain,Source:ScatecSolar(2014)
2.3.1 ProjectDevelopment
AfterreceivingmanufacturedPVequipmentfromexternalpartnersthefirstpart inScatec
Solar’svaluechainistheprojectdevelopment.Identifyingpotentialsites,gettingpermission,
designing plants and securing grid connection is vital parts of this step. In addition, the
companynegotiatesforpowerpurchaseagreements(PPA),attendstenderingactivitiesand
securesfeedintariffs(FiTs).Thisstepisexposedtogreatcompetitionrelatedtoacquiring
goodlandandwinningtenderingroundsamongseveralcontenders.
Scatec Solar O&M / EPC
Single Purpose Vehicle
State owned utility
Our business model and typical legal structure
Project financing
Scatec Solar Equity co-investors
13
State government
• EPC contract • O&M contract• Asset Management
contract
Loan agreements
• Sovereign guarantee• Concession agreement
PPA agreement
Land lease agreements
Land ownersShareholders agreement
Simplified illustration of company structure and main contracts in place
World Bank/others
• Political risk insurance (when relevant)
100%39%-100%

11
2.3.2 Financing
Inordertotodevelopnewprojects,financingandpreparationofcommercialoperationsare
crucial.Thisisdonethroughstructuringofdebtandequityandbyperformingduediligence.
Seniordebtisthepreferredsourceoffundingaccompaniedwithjuniordebtandequity,but
othersourcesassubsidizedloans,grantsandtaxcreditsmayalsobeused.
2.3.3 Construction
ThethirdstepofthevaluechainisthelastoftheD&Csegmentandinvolvesconstructingand
finalisingthesolarplants.TheseoperationsaredonethroughEPCcontractscoveringactivities
likeprojectmanagement,monitoring,qualitychecksandcashflowmanagementoftheplants
underconstruction.ScatecSolarpromotevaluecreationandfacilitatetransferofknow-how
byworkingwithlocalsuppliersandcontractors.(ScatecSolar,2016).
2.3.4 Operations
InordertomaximisetheperformanceandavailabilityofPVplantsthecompanyisactiveon
monitoring,maintaining and repairing theplants. The company carriesoutO&Mbothon
externalandgroup-ownedsolarpowerplants.
2.3.5 PowerProduction(IPP)
Thelaststepofthevaluechainisthefinaldeliveryofpowertocustomers.DuetothePPAs
andFiTs contracted in the first step, combinedwith lowvariationof solar irradiation, the
powerproductiondeliversratherpredictablereturns.

12
3 ValuationMethods
Whenestimatingthevalueofacompanythereareseveralapproachesavailable.Theydiffer
in assumptions and complexity but often share some general characteristics. Aswath
Damodaran(2012)atSternBusinessSchooldividedifferentvaluationtechniquesintothree
general approaches; (i) discounted cash flow valuation, (ii) relative valuation and (iii)
contingentclaimvaluation.InthefollowingtwochaptersIwillpresentabriefintroductionto
the different categories, their most applied techniques and suitability to different cases.
Finally,Iwillfinishoffwithadiscussionofthemostapplicabletechniquesforthisvaluation
thesis.
“Inanefficientmarket, themarketprice is thebestestimateofvalue.Thepurposeofany
valuationmodelisthenthejustificationofthisvalue”Damodaran.
3.1 DiscountedCashFlow(DCF)
Basedonthecompany’sfundamentalsandthepresentvalueruletheDCF-valuationstates
thatthevalueofanyassetisthepresentvalueofitsexpectedfuturecashflows.Theobjective
ofaDCF-analysisistoobtainthecompany’sintrinsicvalue;thevaluethatwouldbeattached
toanassetbyanall-knowinganalystwithaccesstoallinformationavailablerightnowanda
perfect valuationmodel (Damodaran, 2011). Focusing on fundamentals, it should be less
exposedtomarketmoodsandperceptions.Althoughitonlyrepresentsoneofthreemain
valuation approaches it is the foundation onwhich the other two are built (Damodaran,
2012). Both relative and contingent claim valuation require an understanding of the
fundamentalsoftheDCF.
Givenitsbasisonfundamentals,theDCFapproachisbestappliedforcompanieswithpositive
cashflowsthatcanbepredictedwithsomereliabilityinthefuture.Italsoneedsaproxyfor
riskinordertoestimateappropriatediscountrates.Somespecificcompanycharacteristics
challengestheseidealsettingandmakeaDCFapproachmoredifficult.Distressedfirms,with
negative cash flowsmight be valued at a negative valueof equity, although the firmwill
surviveinthelongrun.Highlycyclicalfirmsontheotherhandhavecashflowswhotendto
follow theeconomyandwill be verybiased towards theanalyst’s economicoutlook. It is
howeverimportanttoemphasizethatthesechallengesdonotmaketheapplianceoftheDCF

13
frameworkimpossible,itisratheraquestionofadaptionandflexibility.CommonforallDCF-
modelsisthattheyrequirethemostinputsandinformationofallvaluationmodels.
AlastimportantaspectwhenvaluingafirmwithaDCF-methodistoassessthelifecycleof
thefirminquestion.Acrossthelifecycleofafirmitwillexperiencedifferentgrowthlevels,
thus defining the current stage of the firm is essential when constructing the model. In
general,amodelcouldrangefromonetothreedifferentstages.Whenfirmsareconsidered
tobeinasteadystateoftheircycleonlyaone-stage,constantgrowthmodelissufficient.
Maturingfirmsyettoreachasteadystatewillrequireatwo-stageapproachwithahigher
growthrateinthefirstperiodandthenfindconstantgrowth.Lastly,youngandrapidgrowing
firmwillexperiencehighgrowthlevelsandthenatransitionperiodbeforeitfindsitssteady
state.
WithnumerousexistingDCF-modelsitisagainnecessarytocategorisedifferentapproaches.
Generally,modelsaresplitbetweenvaluingtheentirebusiness,justtheequitystakeorvalue
thefirminpieces.Differentestimationofcashflowsanddiscountratesseparatethethree
approachesdescribedinthefollowing.
3.1.1 TheWeightedAverageCostofCapitalMethod(WACC)
AsthemostappliedvaluationmethodofanentirebusinesstheWACCdiscountsthefreecash
flowavailabletoallinvestors.Thediscountrateisavalue-weightedaverageoftherequired
returnfromallinvestorcapitalandisfurtherdescribedinchapter9:
!"#$%&%'($*+,-$ = /%$$0+(ℎ/,23#2/'%45
(1 +9:00)5
5<=
5<>
Theenterprisevaluerepresentsthevalueoftheunderlyingbusinessofafirmwhilefreecash
flowtofirmrepresentsthecashgeneratedbeforeanypaymentstodebtorequityholders
areconsidered(Berk&DeMarzo,2014):
/%$$0+(ℎ/,23#2/'%4 = !?@A ∗ 1 − #D + E$&%$F'+#'2" − 0:G!H − @"F%+($'"I90
TheWACC-methodrequiresstabledebt levelsas thecapital structureof the firm isused
whenestimatingtheweightedaveragecostofcapitalinthemodel.AccordingtoDamodaran
theWACC-modelisbestusedwhenfirmshaveeitherveryhighorverylowleverage,orare
14
in the process of changing their leverage (Damodaran, 2012). It eliminates the volatility
inducedbydebtpaymentsasitisindependentoffinancing.
TherearecertainchallengeswiththeWACC-modelaswell.ComparedtoFreecashflowto
equitymodelsdiscussedlater,itmayseemlessintuitivegiventhatcashflowstoequityisa
more real measure than the hypothetical cash flow to firm, “ass if there was no debt”-
approach.Further,thefocusonignoringofdebt,themodelfailstorevealfirmsindistresson
thebrinkofbankruptcy,whichmightrequireraisingnewequitytosurvive.
3.1.2 FreeCashFlowtoEquity(FCFE)
WhiletheWACC-modelvaluesafirmindependentofcapitalstructure,thefreecashflowto
equity(FCFE)modelisbasedonthecashflowsavailabletoequityholdersaftermeetingall
financialobligations,includingdebtrepayments,inadditiontotheoutflowsfromtheWACC-
model.TheFCFEisthendiscountedattherequiredrateofreturnfromfirminvestors,the
costofcapital:
*+,-$2J!K-'#L = /%$$0+(ℎ/,23#2!K-'#L5
(1 + MN)5
5<=
5<>
The value of equity represents the present value of a smoothed-out measure of what
companiescanreturntotheirshareholdersovertimeintermsofdividendsandrepurchases.
AnapproachbasedontheoriginalDividend-Discount-modelwhichwillnotberelevantdue
toitssimplicityandlowaccuracy.
Thestrengthofthisapproachtofreecashflowsisthedirectcomputationoftheequityvalue.
Anadvantagewhenthecompanystructureiscomplexandnoadjustmentsareneededfor
other claims on free cash flow and thus it is viewed as a more transparent method for
calculatingacompany’sbenefittoshareholders(Berk&DeMarzo,2014).AlthoughtheFCFE-
modelappeartobethemostintuitivegivenitsestimationoftherealcashflowstoinvestors,
itdoeshavesomecomplicatingaspects.Inordertoestimatefutureinterestpaymentsand
repaymentsthedebtcapacitymustbedeterminedforthefuture.Atroublesomeestimation
notnecessary intheWACCapproach. Inaddition,themodel issensitivetochanges inthe
debt-to-equityratioofthefirmaschangeswillaffecttheriskoftheequityandfurtherthe
costofcapital.

15
3.1.3 AdjustedPresentValueMethod(APV)
UnlikethepreviousDCF-methodsmentioned,theAPV-modelsplitsthevalueofacompany
inseveralparts.Itstartswiththeunleveredvalueofthefirmandthenaddsthevalueeffect
ofdebt,throughestimatingpresentvaluesoftax-shieldsandcostoffinancialdistress.The
unleveredvalueofacompanyisthefreecashflowfromtheWACC-methoddiscountedby
theunleveredcostofcapital,apre-taxWACCnotconsideringtaxshieldsofborrowing:
*+,-$2JO",$P$%$Q/'%4 = /%$$0+(ℎ/,23#2/'%45
1 + %R 5
5<=
5<>
The benefit of leverage is represented by the present value of all future tax-shields and
depends on a company’s debt levels, cost of debt and tax rate. Tax-shields on interest
paymentsbearthesameriskasdebtandisthusdiscountedwiththecostofdebt:
?$"$J'#(2J,$P$%+S$ = #+T%+#$ ∗ F2(#2JQ$U# ∗ Q$U#
F2(#2JQ$U# = #+T%+#$ ∗ Q$U#5<V
5<>
LaststepoftheAPV-methodisthecalculationofthecostofborrowingintermsofincreased
riskofbankruptcyanditscosts.Thepresentvalueofexpectedbankruptcycostsisdetermined
bytheprobabilityofbankruptcyanditsdirectandindirectcosts.Estimatingsuchaprobability
bearslargeestimationerrors,though.Damodaranrecommendsanapproachbasedonthe
credit rating of the outstanding debt and its empirical estimated default probability
(Damodaran,2012).
Allthreestepscombinedestimatetheleveredvalueoftheentirecompany:
*+,-$2J,$P$%$QJ'%4 = *+,-$2J-",$P$%$QJ'%4 + G* A+TWℎ'$,Q( − G* ?+"M%-&#FL02(#(
ThebenefitsoftheAPVapproachisitssuitabilitywithfirmswhodonotmaintainaconstant
debt-equityratioasitvaluesthedebteffectsseparately.Italsooffersmoreflexibilityinits
useofdifferentdiscountratesfordifferentcomponentsofvalue.However,dependenton
futuredebtlevelstoestimatefuturetaxshieldsandprobabilityofdefault,theAPVbearsthe
sameweaknessesastheFCFE-model.Predeterminingtheselevelscontainslargeuncertainty
andcomplexity.

16
3.2 RelativeValuation–AMarketBasedApproach
Relativevaluationvalueassetsbasedonthepricingofcomparableassetsinthemarket.In
ordertocompareassets,pricesarestandardizedbyconvertingthemtomultiplesofearnings,
book value, cash flows or revenues.Most frequently usedmultiples are industry-average
price-to-earnings (P/E), price-to-book (P/B) and enterprise value-to-EBITDA (EV/EBITDA).
Comparedto theDCF-method’s intrinsicvalue themultiple-approach isassumingthat the
marketonaverageisright,butover-andundervaluesspecificcompanies.Theseerrorsare
expected to be corrected over time. By comparing peer-companieswithin an industry by
multiples,relativevaluationseekstoidentifythesedeviationsinprices.
Thebenefitsof the relativevaluationmethodare its simplicityand low levelsof required
informationcomparedtoaDCF-method.Multiplesarefairlyeasytoobtainandusefulwhen
thereexistsalargenumberofcomparablefirmstradedonacorrectlypricedmarket.Byusing
marketpricesmultiplesarealsomuchmorelikelytoreflectmarketperceptionandinvestor
sentiment. However, its benefits are also its weaknesses. By subjectively choosing
comparablefirmsanalystscanconfirmtheirbiastowardsacompany’svalue.Thefactthat
comparable firms still can differ in terms of risk and growth could also result in over- or
undervaluation.Lastly,theassumptionofcorrectmarketpricesissensitivetoerrorscausing
entire markets or industries to be incorrectly priced. An undervalued firmmight not be
undervalued,justlessovervaluedthantherestoftheindustry.
ThemostappliedstandardizedmeasurewhencomputingamultipleanalysisistheEBITDA.
Independentofcapitalstructureanddepreciationpoliciesitisthebestcomparablemeasure
ofcompanieswithdifferentdegreesofleverageandgeographicaloperations.

17
3.3 ContingentClaimValuation
Thisthirdandlastvaluationapproachapplyoptionpricingmodelsinordertovalueassets
with similar characteristics as options. The use of option pricing models in traditional
valuation has developed from the fact that DCF-methods tend to undervalue assetswith
payoffsthatarecontingentontheoccurrenceofanevent.Anexampleisundevelopednatural
resourcereserveswhoisdependentonacertainlevelofacommoditypricetobeexploited.
In order to value an asset as anoption its payoffsmust be a functionof the valueof an
underlyingasset.Itisalsodependentonthemarketsrecognizingsuchoptionsandintegrate
theminthemarketprice.
Thebenefit of applying optionmodels in valuation is how theymake it possible to value
previous non-valuable assets. Equity in deeply destressed firmsor stock in small bio-tech
companies are assets which are difficult or impossible to value with DCF-methods or
multiples.Thesemodelsprovidefresh insight intothedriversofvaluewherewheresome
assetscouldincreasetheirvaluewithmoreriskorvolatility(Damodaran,2005).
Valuinglong-termoptionsonnon-tradedassetsdohaveitslimitationsaswell.Estimatingthe
value and varianceof theunderlying assetswhen inputs arenot available in themarkets
complicates themodel and increases the estimation error. The assumptionsmade about
constantvarianceanddividendyieldsarealsomuchhardertodefendgiventhelong-term
horizon.

18
4 ChoiceofModelandMethod
The previous chapter introduced different approaches to valuation and highlighted their
strengths, weaknesses andmost suitable areas. Provided with these tools, the following
chapterpresentskeycharacteristicsofScatecSolarandtheindustrywhicharedecisiveinthe
processofchoosingthevaluationapproachforthisthesis.
Solarpowerisanindustrywithgreatpotentialconsideringrecentindustry-specifictrendsand
environmentalaspects,whichwillbeassessedlaterinthisthesis.Asanemergingindustryin
heavydevelopmentthemarketperceptionmaynotreflecttheunderlyingfundamentals.A
relativevaluationmethodassumingthemarketpricesarecorrectcouldbringlargeestimation
errors.Ingeneral,relativevaluationisviewedasa“shortcut”totheDCF-methodsofvaluation
(Berk&DeMarzo,2014).Thus,inordertoestimatethebestpossiblevalueofScatecSolaran
assessmentofitsintrinsicvaluelookstobethemostreliableapproach.Inaddition,thereare
severalcharacteristicsofthecompanywhichwillrequiretheflexibilityofaDCF-model.
ReviewingScatecSolarasavaluationcasetherearesomeimportantfactorswhichneedto
beconsidered.AsapubliclytradedcompanyontheOsloStockExchangeinformationonits
operations,accountsandfinancialsituationisfreeandavailablethroughquarterlyandannual
reports. Thus, company fundamentals needed to conduct a DCF-method are obtainable.
However,therelativelyshortperiodfromlistinginlate2014createsdifficultiesinobtaining
historical data as reportsonly goback three years. Theenergy industry though, iswidely
coveredbyseveralinstitutionsandeventhoughsolarpowerisanupandcomingpartofthis
industryitsaspectsarealreadywelldocumented.Combineditprovidesasustainablebaseof
informationneededtoforecastfutureperformance.
Asmentioned inthepreviouschapteran importantpartofaDCF-analysis isassessingthe
company’sphaseinthelifecycle.ScatecSolarisayoungfirminanemergingindustryand
experiencessubstantialgrowth,withan87%increaseinrevenuesin2015.Givenitsstated
targetofreaching1400-1600MWcapacityinstalledorunderconstructionbyyearend2018
(Scatec Solar, 2016), up from today’s capacity of 384MW, the current growth levelswill
continueforatleast3years.Asthecompanymaturesatransitionperiodistobeexpected

19
beforethegrowthlevelsreachasteadystate.Thus,athree-stepDCF-modelhastobeapplied
whenestimatingfuturecashflowsofthecompany.Thishighgrowthfurthercomplicatesthe
model as the high capital expenditures needed create negative free cash flows. How to
approachthisproblemwillbefurtherassessedwhenforecastingthefutureperformance.
Choosing a DCF-method to value the company is not sufficient.Whether a direct equity
valuation(FCFE),acompletefirmvaluation(WACC)oramoreflexiblesumofpieces’valuation
(AOC)arebestsuitedtothecompanymustbeconsidered.Giventhestablehighdebtlevels
averaging at 70% over the last three yearswithout any signs of future change in capital
structure, both the FCFE and WACC approaches are well suited. However, the complex
processofpredeterminingdebtcapacityandinterestlevelspointtowardsthesimplerWACC-
model. Although the consolidation of partially owned project companies complicate the
ownerstructure,thereisnotconsideredtobesufficientinformationavailabletoconducta
thorough FCFEE analysis.Hence theDCF-methodbest suited is a complete firm valuation
throughaWACC-model.
While the relative valuation methods were considered too simplistic to constitute the
foundationofthisvaluation,theapproachstillhasusefulaspects.SupportingtheDCF-analysis
witharelativevaluationbasedoncomparablecompaniesenablestheresultstobetestedup
againstmarketprices.Eventhoughmarketvaluesandintrinsicvalueareexpectedtodifferit
makesthevaluationmorerobusthavingevaluatedbothaspectsofacompany’svalue.
Summingupthechoiceofvaluationmethodandmodel,thisvaluationofScatecSolarwillbe
basedonafundamentalanalysisoftheentirefirm,forecastingfreecashflowtoallinvestors
thoroughathree-stagegrowthmodel.Theestimatedexpectedcashflowswillbediscounted
bytheweighted-averageofallrequiredreturnoninvestments,theWACC.Lastly,theresults
ofthemodelwillbecomparedtothemarketpricesofthecompany’speersthrougharelative
valuation. Considering the limitations and specific requirements of the contingent claim
valuationmethoditwillnotbeappliedinthisthesis.
20
5 TheSolarEnergyIndustry
Thesolarenergyindustrystandsoutasoneofthemajorparticipantsintheenergyrevolution
required in order to cope with the serious challenges of energy-related greenhouse-gas
emissions. As an emerging technology, photovoltaic (PV) energy has experienced great
development since theearly yearsof Scatec Solar’s existence. Technology improvements,
geographical expansionandextensivegovernmentpolicies and supportmechanismshave
driventheindustrytowardsacompetitivepositionintheglobalenergymarkets.Thischapter
providesanenlightenmentoftherecentdevelopments,followedbyabriefintroductionto
thecriticalpoliciesandsupportmechanisms,andfinishesoffwithananalysisoftheindustry
outlookanditsresiliencetowardsconventionalenergysources.
5.1 RecentDevelopment
5.1.1 ModulePriceDecrease
Lookingbackoverthelast5-10years,thesolarenergyindustryhasexperiencedextensive
growthanddevelopmentonseveralareas.Oneofthemostcrucialareasbeingthereduction
in costs, as the industry’sbiggestdrawbackover theyearshasbeen the lackof ability to
competewithconventionalsourcesofenergy.ThepriceofPVmoduleshasbeenreduced
with80%overthelastsixyearsandacompletePVsystemalmostbytwo-thirds(IEA,2014).
Maindriversbehindthedecreasehavebeentechnologyimprovements,economiesofscale
inmanufacturingandincreasedcompetitionamongproducers.Allthreefactorsrelatetoa
geographicalshiftinthemodulemanufacturingfromtheU.S.andEuropetoAsia,especially
China(IEA,2014). However, it isnotcountry-specificfactorsprovidingtheadvantage,but
supply-chaindevelopmentandbig investments incapacity. Inadditiontocosting less, the
moduleshavealsoincreaseditsperformanceinconvertingsuntoelectricityoverthelastten
years. The efficiency of average commercial wafer-based siliconmodules increased from
about12%to16%(Fraunhofer,2015),whichrepresentsasignificantincreaseintotaloutput.
Theresultofthisdevelopmentisalowerlevelisedcostofelectricity(LCOE)forutility-scale
PVPlants.TheLCOEofagiventechnologyistheratiooflifetimecoststolifetimeelectricity
generation,bothofwhicharediscountedbacktoacommonyearusingadiscountratethat
reflectstheaveragecostofcapital(IRENA,2015).Itprovidesacomparablemeasureonthe
cost of different power generating technologies. Figure 4 presents different generating

21
technologies’LCEOandillustratehowrecentdevelopmentinPVmodules’costandefficiency
havemadetheSolarPVtechnologyhighlycompetitive.
Figure4:LCEObyPowerGeneratingTechnology,Source:ScatecSolar(2016)
5.1.2 GeographicalExpansionandCumulativeGrowth
It is not only in manufacturing and costs that the solar industry has seen extreme
development the last ten years. The International Energy Agency (IEA) stated, in their
technologyroadmapfrom2014,thatasof2013thecumulativeinstalledcapacityhadgrown
atanastonishingaveragerateof49%peryear.Followingthesolid2013withnearly37GW
ofaddedcapacity, thesolarpowermarketeventually reached40GWfor the first time in
2014.Thegrowthexperiencedthelastcoupleofyears,presentedinfigure5issomassive
thatthenewcapacityaddedsince2010beatsthetotalofthepreviousfourdecades.Solar
powernowcoversmorethan1%oftheworldelectricitydemand.(SolarPowerEurope,2015).
Solar – a very competitive source of electricity
5
Solar PV 2015 - 2050 Gas CCGT (base load)
Gas CCGT (peak load)
Diesel
Levelized cost of energy, utility scale new build power capacity
30
40
10
20
5
2025
4 – 7 ct5 – 10 ct
20302015 2050
(EUR ct /kWh)
2 – 4 ct3 – 5 ct
6-14 ct
5 – 7 ct
15 – 20 ct / kWh
2015
19 – 26ct / kWh
Source: Fraunhofer / Agora Energiwende 2015* Source: Lazard Capital, Scatec Solar analysis
* Real values in EUR 2014, bandwidth represents different scenarios of market, technology and cost development. PV plant locations between south of Germany (1,190 kWh/kWp/year and South of Spain (1,680 kWh/kWp/y) US$/watt)
Coal

22
Figure5:RecentDevelopmentinInstalledSolarCapacity,Source:IEA(2014)
The foundation for this incredible growth in capacity is the industry’s ability to expand
globally.ForseveralyearsthesolarpowermarketwascentredaroundEurope,butafterbeing
themaindriverforadecade,Europesawtheirgrowthflattenoutin2013and2014.Mainly
duetoreducedfinancial incentivesandpoliticalsupport inthe leadingcountriesGermany
and the United Kingdom (SolarPowe Europe, 2015). The global growth did however not
declineasAsiaandAmericaexcelledandcaughtupwiththelevelsofEurope.2013marked
thefirstyearsince2004thatmoreGWwasinstalledinAsiathaninEurope.Withgoodpolitical
supportandFiTbasedpolicies,ChinaandJapaninstalledmoreindividually,thanthewhole
ofEuropecombinedin2015.Thisgeographicalshiftofleadingcountries,althoughcentral,
did not achieve these levels of new capacity alone. Behind the five largest countries
mentioned,newmarketsareemergingallovertheworldandsuppliesadditionalcapacityto
sustainthehighgrowthlevels.Acrosscontinents,numerouscountriesdeliveredpromising
levels in2014. Like the900MW installed inFrance,KoreaandAustraliaandSouthAfrica
followingclosebehindwith800MW(SolarPowerEurope,2015).Finally,theriseofCanada,
Taiwan, Thailand, The Netherlands and Chile shows that the solar powermarket is truly
becomingafullyglobalindustry.

23
ThelatestnumbersfromBloombergNewEnergyFinance(BNEF)indicateaninstalled2015
capacityof57GWsolarPV(PVMagazine,2015),representinganannualincreaseofabove30
percent.ChinahavenowreplacedGermanyasthelargestmarketwith43GWtotalcapacity.
Table1showstheUSclosinginonJapanwhileEuropeisstillsolidthankstotheUKgrowing
4 GW. Additionally, the globalisation of the industry continues with emerging countries
deliveringsignificantcontributionsofgrowth.
China Japan U.S Europe OtherAsianCountries India Americas Africa&
MiddleEast
InstalledGW2015 15.0 10.0 9.8 8.5 2.5 2.0 1.5 1.0
Table1:2015InstallationLevelsbyRegion,Source:PVMagazine(2015)
5.2 PoliciesandSupportMechanisms
Although the recent developments in the solar powermarket of lower costs and greater
efficiencyhavemadetheindustrymoreattractivetoinvestors,financialincentivesarestill
central in order to increase the investments in solar PV projects. Policies and support
mechanismsaregovernmentactionsaimedatmeeting theirnational goals for renewable
energyproduction.Belowfollowsanintroductiontothemostcommoninstrumentsusedto
closethegapbetweenconventionalpowersourcesandsolarPVpower.Thesearebothcash-
flowgeneratingmechanismsaswellasassistanceinenteringthemarket.
5.2.1 Feed-inTariffs(FiTs)
FiTs are contracts guaranteeing the power producers a fixed price, typically adjusted for
inflation,tiedtothecostofproduction(IFC,2015).Thelengthofthesecontractsareusually
long-term,rangingfrom10-25years.InadditiontothefixedpriceFiTsoftenincludegoodoff-
taketermslikebettergridaccessandprioritydispatchofoutput.Theobjectiveofthefixed
price is tocover thepremiumcostofsolarPVversusconventionalproduction,andhence
provideinvestorswithasufficientmarginmatchingtheriskleveloftheprojects.Inorderto
securethetariffproducersmustsignapurchasingpoweragreement(PPA)withanoff-taker,
typicallyautility,systemoperatoretc.PPAsarecoveredlaterinthissection.
TheFeed-inTariffisoneofthemostappliedsupportmechanismstothesolarPVproducers
andhasplayedacrucialpart intheemergeofsolarenergy,particularly inthebigregions

24
Europe, Japan and China. By eliminating price fluctuations on the electricity market and
stabilizinglong-termrevenues,FiTsattractlendersandfinancingduetothehighdegreeof
certaintyinmodellingprojects.
5.2.2 ReverseAuctionsandTenders
InthecaseofFiTsdescribedabove,developersareofferedapredeterminedtarifffortheir
solar PV projects. Anotherway to distribute FiTs is to have the developers go through a
bidding-contestwherethebesttenderingoffersettlesthefixedpricepaidbytheoff-taker
(IFC, 2015). These tenders or reverse auctions for new capacity secures a competitive
determinedpriceforthegovernmentorutilityresponsiblefortheproject.Theactualproject
sitecanbothbepre-determinedbytheoff-takerorproposedbythetenderingdeveloper.
SpecificsofthetenderinvolveanannouncednumberofMWandlimitationsregardingproject
size, site location and technologies. In addition, certain criteria must be fulfilled by the
participantsregardingfinancingandimplementationoftheproject.Theprocessofentering
a tender is laborious and failing to succeed yields high non-refundable costs. A risk all
developersmustconsidertheirexposureto.
InemergingmarketslikeSouthAfricaandIndiareverseauctionsandtenderprogramshave
been a successfulway to scale up installed capacity. TheREIPPPprogram in SouthAfrica
consistsof33large-scalesolarPVprojectsofatotal1.5GWinitiatedoverthreerounds.This
competitive bidding process provides a platformonwhich incentives to newprojects are
beingminimisedtothelowestlevelrequired.
5.2.3 TaxIncentives
One of the most common tools used by governments to increase the investments in
renewableenergy is tax incentives.Taxcredits forcapitalexpenditure, reducedcorporate
income tax, accelerateddepreciation, reducedValue-AddedTax (VAT) is just someof the
manydifferentincentivesprovidedbydifferentlocalauthorities.Oneofthemosteffective
examples in the industry is the Solar Investment Tax Credit (ITC) in the United States.
Developersaregivena30percenttaxcreditonthecapitalexpendituresoftheirprojectsto
offsetagainsttheirtaxliabilities.Manyothercountrieshavesucceededwithtaxincentivesas
well,butasititattractshightransactioncostsandrequiressubstantialtaxburdensitlimits
thenumberof investors toexploit it. Inaddition,manysolarpowercountrieshavea low

25
collectionofcorporateincometaxwhichreducestheeffects.Ingeneral,somefundamental
differencesbetweentaxsystemsrevealsthatthesuccessinthedevelopedeconomieslikethe
U.Smaynotbereplicatedinemergingmarkets.
5.2.4 PowerPurchaseAgreements(PPA)
Apower purchase agreement is a legally binding agreement between a power seller and
powerpurchaser(off-taker)(IFC,2015).Intheutility-scalePVindustrytheoff-takerisusually
a,whollyorpartiallygovernmentowned,powercompany.AlthoughPPAsarenotasupport
mechanismbydefinitionmostof thepoliciespromotingsolarpowerareusuallybasedon
them. Historically, regulators of this framework have been determining the PPAs in the
industry.InadditiontothePPAs,theelectricitycanalsobesoldthroughtheopenmarketas
a“merchant”plant,butthismethodisrareduetotheriskandpremiumcostsofsolarpower.
Bydefining the revenuestreamofeachproject, thePPA is criticalelementof theproject
financinganddefinesallcommercialtermsbetweentheparties.
5.3 SolarPowerMarketOutlook
The reviewof thedevelopments in the solarpower industryover the lastdecade reveals
incredibleprogress.Thereareawiderangeofelementsbehindthisgrowthandthissection
examinestheseelement’sfuture.Whatwillcontinuetodrivegrowthandwhatmightdiminish
andwillthereappearnewfactorseffectingfurtherdevelopment.
5.3.1 Costs&Technology
Section4.1.1abovereviewedthepricedecreaseofPVmodules.Figure6belowillustratesthe
historicaldevelopmentsince1976andrevealsthattheextensivepricedecreasefrom2008
to2013/14mentionedearlierdoesnotrepresentthelonglearningtrend.Thisextraordinary
plungeinpriceswasaresultofshortageoftherawmaterialpolysiliconin2008combined
withanovercapacityissuearound2013pushingpricesbelowfullcost(Solarcentral,2015).
Despitedeviations fromthehistorical trendrecentyears, the InternationalEnergyAgency
sees“considerablebodyofevidencethatthecostsofcellsandmoduleswilldeclinefurther
asdeploymentandtechnologyimprovesinthenexttwodecades”.(IEA,2014).Numerically
modulesareexpectedtoreachbetweenUSD0.3/WandUSD0.4/Wby2035.

26
Figure6:HistoricalandProjectedModulePrices(Source:IEA,2014)
The impactsofcontinuedcost reductions inPVmodulesare illustrated inFigure7below.
Capitalexpenditures(CAPEX)ofutility-scalePVplantsareexpectedtokeepdeclininginline
withthemodulecostreductionsandprojectionsexpectatotalreductionof68%inthe10-
yearperiodpresented.Thefigureillustrateshowmodulecostsmakeupadominatingshare
oftotalcostsandbothhaveandwillbeadrivingforcetowardscontinueddecline.
Figure7:CAPEXDevelopmentforUtility-ScaleSolar,Source:BNEF(2015)
Even though different “soft” costs, like financing and permitting, create differing CAPEX
acrossmarkets/regions,theaveragelevelisexpectedtodecreaseandtheintervalbetween
marketsreduced.
27
Finally,asaconsequenceoffallingmodulepricesand lowercapitalexpenditurestogether
with improved performance and geographical expansion to more irradiated areas, the
averagePVLCOEwillalsocontinuetodecreaseasillustratedinfigure4ofchapter5.1.1.A
25%decreaseby2025andatotal60%by2050isexpected.
5.3.2 Capacity
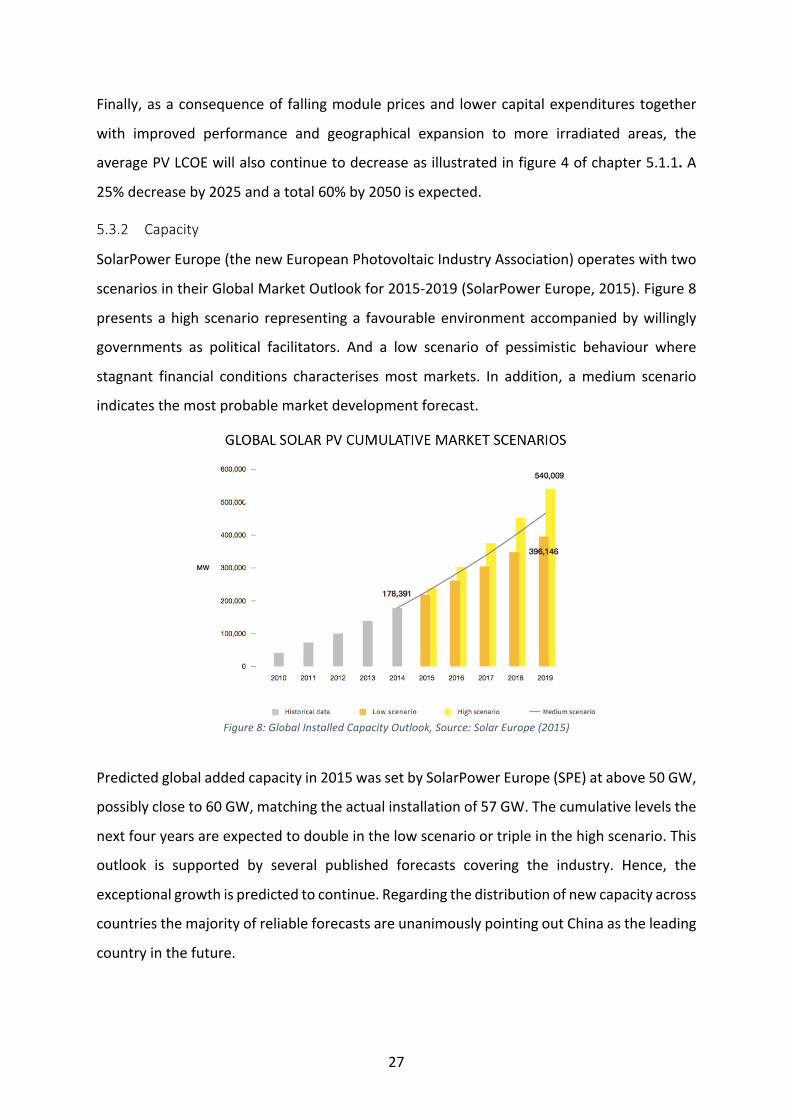
SolarPowerEurope(thenewEuropeanPhotovoltaicIndustryAssociation)operateswithtwo
scenariosintheirGlobalMarketOutlookfor2015-2019(SolarPowerEurope,2015).Figure8
presentsahigh scenario representinga favourableenvironmentaccompaniedbywillingly
governments as political facilitators. And a low scenario of pessimistic behaviour where
stagnant financial conditions characterisesmostmarkets. In addition, amedium scenario
indicatesthemostprobablemarketdevelopmentforecast.
Figure8:GlobalInstalledCapacityOutlook,Source:SolarEurope(2015)
Predictedglobaladdedcapacityin2015wassetbySolarPowerEurope(SPE)atabove50GW,
possiblycloseto60GW,matchingtheactualinstallationof57GW.Thecumulativelevelsthe
nextfouryearsareexpectedtodoubleinthelowscenarioortripleinthehighscenario.This
outlook is supported by several published forecasts covering the industry. Hence, the
exceptionalgrowthispredictedtocontinue.Regardingthedistributionofnewcapacityacross
countriesthemajorityofreliableforecastsareunanimouslypointingoutChinaastheleading
countryinthefuture.

28
Furthermore,theBerlin-basedApricumCleantechAdvisoryassesseachregionintheirfive-
yearoutlook(Apricum,2015).Withanoverallpredictionofacumulativecumulativecapacity
at604GWin2020andannualcapacityof90GW,theirmodelroughlyfollowsthemedium
scenario of SPE. In order to highlight the regions looking to drive future growth, the
consultantsfocusonthechangeinannualaddedcapacityfrom2014tothepredicted2020
levelsasshowninfigure9.Thefigurerevealswhichregionswillattractmostinterestfrom
solarPVdevelopersinthefuture.
Inaddition,theiroutlookcontainsalistoftopfivecountriesbycumulativecapacityin2020.
Unsurprisingly,ChinaranksnumberonefollowedbyUSA,Japan,GermanyandIndia.Focusing
onaddedannualcapacity,70percentoftheincreasefrom42to92GWininstallationsfrom
2014 to2020 is representedbyChina,USAand India.More regionallyAsia looks like the
leadingareafortheyearstocome.WhileChinaisprojectedtokeepongrowing,Indialooks
settoreplaceJapanasnumbertwo.Japansuffersfrominsufficientgrid-capacityasaresult
of a boom in installations driven by lucrative FiT-programs.While India aims at reducing
pollutionandincreaseaccesstoelectricitybyinstalling100GWby2023.(Apricum,2015)
EventhoughAsiarepresentsthehighestlevels,regionsworldwideshowgreatpotential.In
AmericatheboomingUSmarketisaccompaniedbyMexicowho,withitsstrongirradiation,
pursue aGW levels tomeet a growing power demand. Further south Brazil represents a
potentialhugemarketwithanincreasingshareofsolarPVinitspowerauctionssystem.Other
fastgrowingregionsaretheMiddleEastandAfrica.Thelackofenergyandprogramsaiming
atsupplyingthepeoplewithrenewableelectricitydrivesgrowthinAfricawhiletheMENA
regionisexperiencinghighdemandforPVduetotenderroundspushingpricesdown.Lastly,
Europewill still contribute sufficient levels of growth in the future, although its share of
Figure9:ExpectedChangesinInstalledCapacity,Source:Apricum(2015)
29
worldwidecapacityisfalling.Francelookstobethenewdriver,withgoalstoreplacenuclear
powerwithrenewables.
Concluding, theoutlook fornewPVcapacity lookspromising.Big regionsarepredictedto
sustaintheirgrowthlevelsandnewemergingregionsshowpromisingsignsoffuturemarkets.
5.3.3 Policies
Varioussupportmechanismshavebeenoneofthemainfundamentalsfortheexperienced
growthinsolarpowerrecentyears,makingtheindustrymorecompetitivetoconventional
sourcesofenergy.Astheindustrydevelopsandmaturesitbecomeslessdependentonthese
mechanisms,buttheindustrytodayisstillrepresentedbythefastestgrowingmarketsbeing
fuelledby financial incentives. Illustratingthe influencethesemechanismscanhave is the
latest boom in U.S solar installations, pending the expiration of ITC policy initially set to
happenattheendof2016.AsaconsequenceofdevelopersexpectingITCtoexpire,pipelines
was filled and theU.S solarmarket is now set to grow119percent in 2016 (SEIA, 2016).
Althoughanextensionofthepolicywhereprovided,thedeveloper’sbehaviourrevealhow
criticalthesesupportmechanismsarefortheiroperations.IEAclaimsintheirroadmap(IEA,
2014) that, “Strong and stable frameworks are needed, along with support to minimize
investors’risksandreducecapitalcosts.Thisfactdemandsananalysisofthesustainabilityof
today’sdominatingsupportmechanisms.
5.3.3.1 FiTs&FiPs
As one of the main drivers behind recent growth in the industry, the outlook for the
governments feed-in-tariff policies are very interesting.Although the FiTs still stimulate a
greatexpansionofsolarPVinmanyemergingmarkets,theirroleinthemorematuremarkets
ischanging.Aspricesofmodulesdecreaseandmarketsmature,governmentsarelowering
theirFiTlevels.Japanannounceda11%reductionintheirsolarFiTsduetofallingtheCAPEX
intheindustryandanobservedtrendoflowerFiTsyieldinglowerCAPEX(PVMagazine,2015).
The National Development and Reform Commission (NDRC) in China also recognize the
effectsoffallingcostsandrecentlyannouncedaslightcutofFiTsinordertoadapttothenew
marketconditions(PVMagazine,2015).

30
InadditiontothesenewestadjustmentsinAsia,Europeanmarketshasexperiencedadecline
inFiTsforyears.GermanylongledthelineinsolarPV,buthasrecentyearsreducedtheir
supportsystemdrasticallyduetohighcosts.SeveralEUcountrieshasbeenexposedtofiscal
strainfromthefinancialcrisisandhencetheyhavebeenforcedtoaltertheirFiTs,Spaingoing
asfarastemporarilysuspendingthemin2012.Someexceptionsexist,likeFrancewhoadjusts
theirFiTsevery3monthstoaccountfornewdevelopmentsandincreasesinstallations.But
generally, the European solar PV market is the first mover into a more market-based
developmentframework,lessdependentonFiTs.(SolarPowerEurope,2015)
AnoptiontothefixedcontractualpricesprovidedbytheFiTisthefeed-in-premiums(FiPs),
whichcouldbemoreappliedinthefuture.Byaddingpremiumstomarketpricesofpower
theideaistomakesolarenergymoreintegratedintheelectricsystem.Dividedintofixedand
slidingFiPs,pricesareeithersetonceoradjustedtotheaveragemarketpriceperceivedby
allgeneratingtechnologies.
5.3.3.2 TaxIncentives
Asmentioned earlier tax incentives is an effective andmuch appliedmechanism in solar
markets.However,beingdifficulttoexploit, it ismostlyjustcommonintheUnitedStates.
Initially thetaxcredit in theU.Swhereduetoexpire in2016,buttheCongressnowhave
extendedthepolicyanotherfiveyears.Theinvestmenttaxcreditstaysat30%throughout
2019, then drops to 26% in 2020 and 20% in 2022 and stabilizes at 10% for utility-scale
projects after that, but are completely removed for residential installations (MIT, 2015).
SimilartotheFiTs,thetaxcreditpolicyismovingtowardsamoremarket-baseddevelopment
frameworkinthefuture.

31
5.4 RenewablesvsFossilFuels
ThislastpartoftheIndustryOutlookprovidesanupdateonthepositionofgeneralrenewable
energy versus the conventional fossil fuelled energy sources. A relationship especially
interestingconsideringtherecentplungeinoilprices,initiallyexpectedtohurtthegrowing
renewableenergyindustry.Contradictingtheinitialexpectations,McKinsey(2015)provide
fourmainreasonswhytherenewablesectorismoreresilientthanever.
Firstly,onlyasmallshareoilproductionisusedforpowergenerationcomparedtoalmostall
renewables.Aslittleas5%oftheglobalpowerproductionoriginatefromoil,makingtheprice
ofoilmuchlessrelevantthanthepriceofelectricity.Gasishoweveroftenlinkedtotheprice
ofoilandisafarbiggerplayerintheglobalpowerproductionandrepresentsthefloorprice
ofpower.Althoughlowergaspricespossiblycouldslowdownthegrowthofrenewablesitis
morelikelytobeacleanerreplacementtheconsiderablyworsepolluter,coal,asabackup
sourceofpower.
Improving economics of renewables represent the second aspect. The fast-increasing
competitiveness of renewables, illustrated by solar CAPEX cost earlier, combined with
regulatory support, protect the industries of renewables. With economies of scale in
productionanddeclining“softcosts”thisdevelopmentitsettocontinue.Consequently,the
pricesoffossilfuelswillcontinuetofluctuate,whilethecostsofrenewablesareonlysetto
decrease.Anattractivecharacteristicforgovernmentsandcompaniesinvestingforthelong-
term.
Furthermore, the global dynamics of energy are changing. Historically, due to high costs,
investmentsinrenewableshavebeenreservedfordevelopedcountriesandoil-richnations
havepreferred toburncheapoil even though their irradiation levelswerewell-suited for
solar.Withdevelopingcountriesaccountingforalittlelessthan50%ofglobalcleanenergy
investment in2014,agrowthof36%comparedtothe3%of thedevelopedworld,anew
structureisevolving.China,IndiaandthelargestLatinAmericancountriesleadthechange
with ambitious goals for renewables. Oil-giants Saudi Arabia, Egypt and Dubai have also
shiftedtheirfocusmoretowardsrenewablesandespeciallysolar.Dubai’sstateutilityrecently
signedasolardealatarecordlowofsixcentsperkWhwithaSaudisolarcompany,while

32
Egypt aims at a 20% renewable capacity at 2020. Combined, all these aspects reveal the
globalization of renewable energy, as further mentioned in earlier sections, stating its
positionasastronglong-termsolutionintheenergysector.
Finally, improved technology and innovations enhance the competitiveness of renewable
energy.Mostimportantisthedevelopmentinenergystorageconsideringtheintermittent
aspectofrenewables.NavigantConsultingexpectsa$70billionmarketforenergystorage
overthenextdecade.Thepriceoflithiumbatteriespercapacityisalreadydecreasingandwill
be further assessed later in the strategic analysis. In general, there are large resources
allocatedtowardsstoragetechnologiesbymajorAmerican,EuropeanandAsiancompanies.
Summarized,thesefouraspectsoftherenewableenergysectorrevealshowthelong-term
transition of the energy sector is in motion. Although long-term is a key element, the
increasedresiliencerepresentsafundamentalelementinthefutureofthesector.
5.5 Summary
Reviewingtherecentdevelopmentsandmappingoutthefutureoutlookforthesolarpower
industry reveals an exciting and emerging industry. A combination of cost reductions,
efficiencyimprovementsandenvironmentallydrivencapacityexpansionsstandsoutasthe
maindriversoftheindustry.Theenhancedresiliencetowardspricesofconventionalenergy
alsorepresentsasignificantaspectsupportingtherenewableenergyindustrytoexploitits
potential.Further,asgovernmentalsupportwillbephasedouteventually,theindustrylooks
tobeheadingtowardsasustainablemarked-basedframeworkwhichwilllaythefoundation
forfuturegrowth.

33
6 Strategicanalysis
Having addressed the solar industry development and outlook relevant for Scatec Solar’s
future operations, this chapter will focus on strategic elements that are critical when
analysingfutureprospectsofthecompany.Thestrategicanalysisissplitintwoparts.First,
thestructureandlevelofcompetitionintheindustrywillbeassessedandsecondlyamore
firm-specific analysis will be conducted to address the competitiveness of the company.
Understanding the current and future structure of the industry and how Scatec Solar is
positionedtocopewithfuturecompetitionisvitalforthefundamentalvaluation.Itprovides
importantinputtoassumptionsinthefinalestimations.
6.1 Porter’sfiveforces
Thestructure-conduct-performance(SCP)frameworkstatesthatthestructureofanindustry
influences the conduct of the competitors, which in turn drives performance of the
companiesintheindustry(Koller,Goedhart&Wessels2015).Themostinfluentialworkon
SCPisMichaelPorter’sCompetitiveStrategyfrom1980,andwillbethebasisforthisanalysis
oftheintensityofcompetitionintheutility-scalesolarPVindustry.AccordingtoPorter,tobe
abletounderstandtheindustrycompetitionandprofitability,onemustanalysetheindustry’s
underlyingstructureintermsoffiveforces(Porter,2008).Competitionforprofitsexceeds
theexistingindustryrivalstoincludecustomers,suppliers,potentialentrantsandsubstitute
productsasillustratedinfigure10.Togetherthesefiveforcessettheindustrystructurewhich
drivescompetitionandprofitability.
Figure10:IllustrationofPorter's5Forces,Source:Porter(2008)

34
6.1.1 Thethreatofnewentrants
Throughadditionalcapacityandincreasedfightformarketshare,newentrantsaffectprices,
costsandtheneedforcapitalexpenditures.Entrantsfromothermarketsmightalsoleverage
itsotherbusinessareasinordertoshockthecompetition.Inthisway,thethreatofnewentry
setsaroofonpotentialprofitsofan industry.Porteremphasizethat it isnotwhetherthe
entryactuallyoccurs,butthethreatofitthatholdsdownprofitability.Howbigthethreatof
newentrants is,dependsontheheightofthe industry’sentrybarriers.Themostrelevant
entrybarriersoftheutility-scalePVindustrywillbeassessedinthefollowingparagraphs.
Atypicalacknowledgedentrybarrierintheindustryistheneedforhighcapitalrequirements.
Thetotalcosts(CAPEX)ofamulti-megawattEuropeanground-mountedsolarPVpowerplant
averagedaround1.7millionUSDperMWin2014whiletheoperatingandmaintenancecost
(OPEX)atthetimewasestimatedtoaround4,200USD/MWperyear(IFC,2015).Adjusted
for local taxes and transportations costs etc. these numbers works as a proxy for other
markets.Thedataillustratesbothsubstantialcapitalrequirementsandthatthevastmajority
of investment occur in the early phases. Thus, newentrantsmust possess great financial
resourcesandtheirlackofexperienceintheindustrymightincreasethecostofadditional
capitalwithcreditors.
Further barriers to entry are incumbency advantages like the cumulative experience in
developingsolarpowerplants.Large-scaleplantsusuallyhaveextensivepermitsandlicencing
requirements,determinedataregionalornationallevel.Thetediousprocessofacquiringkey
requirementslikelandleases,buildingpermits,gridconnectionapplicationsandoperating
licencesmightrepresentabarrierfornewentrantsgiventhelackofexperiencecomparedto
existingmarketparticipants.Inaddition,participatingintenderoffersisacostlyandtedious
processwhichrequiresbiginvestmentsfromdeveloperswhileriskingnottobeawardedthe
contract.Experiencehelpsexistingparticipantstobetterevaluatewhichtenderstakepartin
andincreasestheprobabilityofbeingawardedthetender.
35
Onthecontrarytothesebarriersofentry,thesolarindustrycontainsattractivegovernment
policieswhichmaymakeentryeasier.Bothfeed-in-tariffsandsolar investmenttaxcredits
are such incentives that both attract new entrants and facilitate their establishment.
However,theselucrativesupportmechanismsarebeingphasedoutbyseveralgovernments
asmentionedintheindustryanalysisandareclearlynotsustainableinthelongrun.
6.1.2 Thepowerofsuppliers
Powerfulsupplierscanmakean impactonthecompetitivenessof industryparticipantsby
increasingprices, limitqualityorshiftcosts to theircustomers.Allactionsaremethods in
whichsupplierscanpressuretheprofitsoutofanindustryiftheparticipantsareunableto
passonthecoststotheircustomers.
Forparticipantsintheutility-scalesolarmarketthemostcriticalsuppliersarethePVmodule
andinvertermanufacturers.Thesecomponentsmakeup55%ofthecapitalcostsofasolar
PVproject(IFC,2015),hencetheirpowerispotentiallyextensive.However,lowentrybarriers
fragmentthePVmodulemarket(MarketRealist,2015)andhindersuppliersingrowingbig
and influential. Further, the modules are not particularly differentiated products and
developersarenotheavilydependentonanyspecificmanufacturer.Inadditiontothelow
level of differentiation, the PVmodules can be based on different technologies. Thus, a
crystalline module manufacturer both competes against other crystalline modules and
against substitutes like thin-filmmodules, increasing the competition andweakening the
powertowardstheircustomersinthepowerplantindustry.
Althoughthepowerofsupplierdoesnotlookstrongtoday,historyrevealsthatthingscould
change. In theperiodof2005to2008ashortage in theessential rawmaterialpolysilicon
increasedpricesofmodulesandloweredthetotalsupply(Solarcentral,2015).Anexampleof
howmanyfactorscan influencethepowerofsuppliers. Intheirprospectus, (ScatecSolar,
2014)ScatecSolaritselfemphasizesthatequipmentmaybeinshortagefromtimetotime.
6.1.3 Thepowerofbuyers
Along with the suppliers, customers of the industry are also able to capture value from
participants.Thepowerisoftenrepresentedthroughnegotiatingleverageonparticipants,

36
settingthemupagainsteachotherinordertopushdownprices,requestingbetterqualityor
moreservice.Justlikesupplierpowerthissqueezestheprofitabilityoutoftheindustry.
The buyers or off-takers in the utility-scale solar industry are usually state-owned utility
companies. As the number of state-owned utility companies in most regions are low
comparedtothenumberofproducers,theirbargainingpowerisrelativelyhighintermsof
competitionforsolarpower.Thepressureisonthesolarpowerproducerstogetcontracts
withtheutilitycompanies.Anotheraspectofthesolarindustryisthestandardizedproduct
theydeliver.Allproducersofferthesamerenewableenergyandtheoff-takerscanalways
lookforequivalentoffers,playingtheproducersagainsteachother.Finally,theoff-takerslast
sourcetobargainingpowerinthesolarindustryisthethreattointegratebackwards.Given
itsattractivestabileandlong-termrevenuesmanyinvestor-ownedutilities(IOUs)maylook
toverticallyintegrateinordertocaptureprofits.Further,thepublicly-ownedutilities(POUs)
may consider entering the plant-development industry as a step in the pursuit of their
renewableenergygoals.
Intermsofbargainingpower,thebuyersofpowerfromutility-scalesolarplantsseemtohave
substantialpowerthroughthelowlevelsofoff-takers,standardizedproductsandthreatof
backwards integration.All threeaspectsprovidetheutilitycompanieswith leveragewhen
negotiatingPPAs,pushingpricesdownandsqueezingouttheprofits.
6.1.4 Thethreatofsubstitutes
Asubstituteperformsthesameorsimilar functionasan industry’sproductbyadifferent
means (HBR, 2008). As the number of substitutes for a product grows, the elasticity of
demandincreases.Withelasticdemandcomespricesensitivitywhichinturnpressuredown
prices.Thus,anindustrywhoisnotabletodifferentiatetheirproductsfromitssubstitutes
willexperiencebothafallinprofitabilityandoftenreducedgrowthpotential.
Thesubstitutesofsolarpowerarenumerous.Bothintermsofotherrenewablesourceslike
wind power, hydro power and bio energy and the conventional sources of energy; coal,
naturalgasandnuclearpower.Thepositionofsolarpowertwentyyearsagoillustrateshow
substitutescanputaceilingonpricesandholdbackaproduct.Duetoitshighcostsatthe
37
time,otherconventionalsourcesofenergywerechosen.However,recentyears’substantial
declineinLCOEforsolarpower,drivingtheindustrytowards16percentoftotalelectricity
generationby2050(IEA,2014),demonstrateshowsolarpowerhasmanagedtooutperform
severalofitssubstitutes.Furtheron,chapter5.4describedhowrenewableenergyingeneral
hasalsomanagedtodistanceitselffromitssubstitutesinconventionalsourcesofenergy.But
the battle of becoming the number one renewable energy source still remains, and are
pushingdeveloperstocontinuously improvebothefficiencyandprices.Thus,thepressure
frombothrenewableandconventionalpowerwillaffecttheprofitsofthesolarindustryfor
yearstocome.
6.1.5 Therivalryamongexistingcompetitors
Rivalryamongexistingcompetitorstakesplaceinthemostcommonways.Itpressuresprices,
drives innovation,advertisingandservice/product improvements.Ahighdegreeof rivalry
pushesthe industry towards“perfect”competitionwherepricesequalmarginalcostsand
profitsvanish.
Themostcommonutility-scalesolarPVprojectsaretypicallypartofenvironmentalpolicy
objectives (NordeaMarkets, 2015). Awarded through tenders, the developers bid for the
opportunitytoconstructthedifferentprojects.Throughthisprocesscompetitionamongthe
participants will push down the price, usually awarding the developer with the lowest
electricityproductioncostswiththecontract.Withattractivepre-determinedFIT-schemes
onitswayoutinmostdevelopedcountries,theintensityinfuturetenderroundswillonly
accelerate.Thus,therivalryamongdevelopersintheindustryismainlyconcentratedaround
pricecompetition.Asignificantfactoraffectingtheintensityofthecompetitionisthecost
structureoftheindustry.Autility-scalesolarpowerplantcontainsahighleveloffixedcosts
representedbymodulesandequipment,whiletheoperatingcostsarelow,resultinginalow
marginal cost. Facing tough competition in the tender roundsmay pressure prices below
developer’saveragecosts, inordertowinthecontract,whilestillcontributingtocovering
fixedcosts.Itiscleartoseehowthisprocessaffectstheprofitabilityoftheindustryandwith
themarketmaturingtowardsamoremarked-basedframework,itwillcontinuetodevelop
theindustry.

38
6.1.6 Conclusion
HavinggonethroughthefivecompetitiveforcesofPorter,definingtheindustrystructure,it
istimetodeterminethelong-runprofitpotentialofthesolarindustry.Thestrengthofthe
forcesrevealshowtheeconomicvaluecreatedbytheindustryisdivided.Strongestofthe
fiveisthethreatofsubstitutes.Competingbothagainstotherrenewablesandconventional
energy, utility-scale solar will face intense competition for future energy demand.
Furthermore,therivalryamongexistingcompetitorsisalsostrongasnumerousdevelopers
entertenderroundsandcutmarginsas lowaspossible inordertowinthecontracts.The
thirdandlaststrongcompetitiveforce inthe industry isthepowerofbuyers.Thelevelof
standardisationofpowerasaproductisadisadvantagetowardsoff-takersandthethreatof
backwardsintegrationpressuretheproducers.
Concluding,theeconomicvaluegeneratedintheutility-scalesolarindustrylookstobelimited
byitscompetingsubstitutesandbargainedawaybybuyers.Intenserivalrypreventsexisting
companiestoretaintoomuchvalue,whilethethreatofnewentrantsdoesnotrepresentany
particularconstraintonprofits.Neitherdoesthefragmentedpowerofsuppliers.Withthe
developmentofthe industrymovingtowards lesssupportmechanismsandmoremarked-
basedframeworks,prospectsforprofitabilitydoesnotseemtobeimproving.

39
6.2 SWOT-Analysis
Representing strength, weaknesses, opportunities and threats the SWOT-analysis was
introducedbyAlbertHumphrey in the1960s. It highlights internal andexternal elements
whichmayaffectthefutureperformanceofthecompany.Theobjectiveofthisanalysisisto
evaluate Scatec Solar’s positioning in the solar industry and examine potential drivers of
growthaswellassourcesofriskintheoperationsgoingforward.Startingwithstrengthsand
weaknesses,internalelementswithinthecompanywillbeassessed,whilethelatterreview
ofopportunitiesandthreatslooksattheexternalenvironmentinwhichitoperates.
6.2.1 Strengths
AsstatedintheanalysisofPorter’sfiveforces,thecompetitionamongexistingutility-scale
solardevelopersare intense,withmanycompanies looking togainprofits inanemerging
industry.Insuchmarketconditionsareviewofacompany’sstrengthsisusefulinorderto
determinewhetheritholdsanycompetitiveadvantagesenablingthemtomaintainexisting
and/orincreasefutureprofitlevels.
Withitsextensiveexperienceinthesolarpowerindustry,datingbackto2001,ScatecSolar
hasdevelopedacompetitiveadvantagethroughitsintegratedbusinessmodel.Throughboth
itsdevelopmentandconstruction(D&C)-andoperationandmaintenance(O&M)divisions,in
addition to their core power production activities, the company controls the entire
downstreamvaluechain.Thebenefitsarenumerous.Comparedtocompetitorsonlyfocusing
onownershipofprojects,whoaredependentonexternalD&CandO&M,ScatecSolargains
morecontrolacrosstheentirelifetimeofaproject.Thisislikelytoresultinlowercosts,higher
speedandimprovedexecution(NordeaMarkets,2015).Acompetitiveadvantagepotentially
yieldingpremiummargins.
In a more risk minimizing aspect Scatec also gain advantage through its geographical
diversificationofplants.WithplantsspreadacrosstheworldfromEuropetoSouthAfricaand
theU.S,thecompanyislessvulnerableforoperationalrisklikevaryingirradiationlevelsand
gridconnectionproblems,andcountryrisksintermsofpoliticalchanges.

40
TheanalysisofPorter’sFiveForceshighlightedthe largeup-front investmentsrequiredto
buildasolarpowerplantandthehighcapitalrequirementscharacterizingthe industry. In
ordertogrowinthisindustry,theaccesstofinancingiscrucial.ScatecSolariswellpositioned
tomeettheserequirementsthroughitssolidtrackrecordofraisingmorethan800mEURin
non-recoursefinancethroughitspartnershipswithglobal,regionalandDFI2financiers(Scatec
Solar, 2016). These multilateral development banks and institutions represents a robust
project finance network. In addition, partnerships agreements with the Norwegian
Investment Fund forDeveloping Countries (NORFUND) and IFC InfraVentures, part of the
World Bank Group, have been signed to fund and develop solar projects in emerging
countries. Some projects are already in operation while others are in development. The
partnershipsprovidestrengthinaccesstocheaperlong-termcapitalasthepartners’interests
gobeyondreturnonequity.Furthermore,theyrepresentasolidcombinedexperiencefrom
successfulinvestmentsindevelopingcountriesandaninvaluablestrongnetworkinemerging
markets.BackedbytheNorwegianGovernmentandtheWorldBankrisksofdishonouringof
contractsorotherproblemsarealsomitigated.Inaddition,thecompanypartnerwithlocal
suppliersandcontractors,mitigating localriskandenablesfurtherprojectdevelopment in
theregion.
6.2.2 Weaknesses
Inthesamewaythatacompany’sstrengthshelpitcapturepremiummarginsinacompetitive
industry,itsweaknessesincreasetheprobabilitylosingitscompetitiveposition.
Reviewing Scatec Solar’s activities, a potential weakness is their sizeable exposure to
emerging countries associated with high risks. The OECD operates with a country risk
classificationwheretheriskcomposesoftransferandconvertibilityriskandcasesofforce
majeure(OECD,2016).Transferandconvertibilityriskassessestheriskofthegovernment
imposing capital or exchange rate controls preventing the conversion of local to foreign
currencyor the transferof funds tocreditorsoutside thecountry.Casesof forcemajeure
coverstheeventofwars,revolutions,floodsetc.
2DevelopmentFinanceInstitution

41
Table2belowpresentseachcountryinwhichScatecSolarhasprojectsinoperation,under
constructionorinbacklog.ThecountriesareclassifiedinOECD’scategoriesfrom0-7through
a two-stepmethodology. First a quantitative assessment of country credit risk based on
payment experience, financial situation and economic situation. Then a qualitative
assessmentofthecountryrisktointegratepoliticalriskandotherfactorsnotaccountedfor
inthefirststep.
CzechRep USA Brazil South
Africa Jordan Honduras Rwanda Mali
%ofProduction 1.1% 11.3% 8.8% 57.6% 5.6% 11.5% 0.8% 3.2%
CountryRisk - - 4 4 5 6 6 7
Table2:ClassificationofCountryRisk,(Source:OECD,2016)
TheresultsrevealsthatScatecSolarisdefinitelyisoperatinginhighriskcountrieswith80%
of the considered current and future projects are classified between 4-6, representing a
potentialweaknessof thecompany’s futureoperations.Thisweakness isnotexpected to
declineeither,consideringthattwoofthemajorprojectsinthepipelinearelocatedinEgypt
andPakistanwithaclassificationof6and7respectively.Thehigh-incomeOECDcountries
CzechRepublicandtheU.Sarenotclassified.Althoughtheseclassificationsconsistofmany
riskfactorsthataremitigatedbyScatecSolar’spartnersandgoodnetwork,theriskstillexists
andcouldcreateseriousimplicationsforthecompany.
Oneparticularpartofthiscountryriskshouldbehighlighted. ItconcernsthePPAsagreed
withstate-ownedutilitiesinthesecountriesandtheriskofdefaultonpayments.Illustrated
bySouthAfricawhere60%ofthecompany’srevenuesarebeinggenerated.Here,theoff-
taker, ESKOM, currently holds a Ba1 credit rating from Moody’s (Moody’s, 2016),
representingsubstantialcreditrisk.Similarcreditriskisconnectedtotheoff-takersinRwanda
(EWSA), Honduras (ENEE) and Mali (EDM). Although the payments are guaranteed by
governmentsthisdoesnotnecessarilyeliminatetherisks,asthemajorityofgovernments
holdssimilarratings.
42
6.2.3 Opportunities
The objective of this section is to highlight areas of potential improvement or new
opportunities in Scatec Solar’s activities. Identification of completely new or possible
improvementof current revenuesandmargins,areuseful inputsneededwhenpredicting
futureperformancelaterinthisvaluation.
Asstatedinchapter5.3thesolarpowerindustryfacesgreatopportunitiesofgrowthacross
theglobeandforScatecSolarastrategictargetistheemergingmarketsofAfrica,MENAsand
Americas.Thepower situation in theseareas representsnumerousopportunities,both in
termsofrenewableenergyandgeneralelectricity-access.
Sub-Saharan Africa currently has theworld’sworst electricity accesswithmore than 600
million people lacking access to energy. Studies from McKinsey & Company reveal a
significant underdevelopment in the power sector in terms of energy access, installed
capacityandoverallconsumption(McKinsey,2015).However,theyalsoemphasizethebright
future of the region and its extraordinary opportunity. Power consumption levels are
expectedtoincreasefourtimesby2040andtomeetthisdemand,solarpowerwilldominate
with its enormouspotential of around8 terawattsof capacity. To support this extensive
development,severalprogramshavebeeninitiated.LikethePowerAfricaprogramlaunched
in2013theUNSustainableEnergyforAllprogrammakingtheSub-SharanAfricathecentre
of their energy revolution. Based on the extraordinary solar resources and the focus on
supportinginitiatives,theSub-SharanAfricaisanarearepresentinggreatopportunitiesfor
ScatecSolar.
IntheMiddleEastandNorthAfrica(MENA)theopportunitiesforsolarpowerisdrivenby
costofpowerratherthanimprovedelectricityaccess.Theregionis largelypoweredbyoil
andnaturalgas,buttherecentplunge incostsofsolarPVhascreatedanewdemandfor
renewableenergy(MESIA,2015).Inaddition,thetworesourcesoperatebasedonopposite
drivers.Increaseddemandoffossilfuelsdrivepricesup,whileincreasedconsumptionofsolar
pricesfallsduetoeconomiesofscale.Theseaspectscombinedwiththehighirradiationlevels
oftheregionhaveengagedseveralcountriestofocusonsolarpowerasameanstosatisfy
risingelectricitydemand(Stratfor,2016).SimilardevelopmentisobservedintheAmericas,

43
especially in Latin America which possess comparable high solar resources. In the large
marketsofMexico,BrazilandChileanotherfactorcreatinggreatsolaropportunitiesisthe
desire toobtain a reliable and cheap sourceof electricity for their industrial sites (Wang,
2014).
In addition to good growthopportunities in emergingmarkets there is also technological
opportunities in the industry, highlighted in chapter 5.4. One particular development
predictedasastronginfluentialelementontheindustryisthepotentialofbatterystoragein
renewableenergy.The fact that theoutput fromrenewableenergysources likewindand
solarPVareweather-dependenthasbeenhighlightedas a limitationof its potential. The
fluctuationinpowergenerationfromasolarPVplantovera24-hourperiodcreatetheneed
forotherconventionalpowersourcestostabilisethepowersupply,anexpensivesolution.
Basedon this theGerman EnergyAgency (DENA) argue that storage can compensate for
short-termfluctuationsinelectricitygenerationbyabsorbingexcesselectricityfromwindand
solarpowerplantsandfeedit intothesystemlater(Hockenos,2014).Figure11 illustrates
how storing generated solar power can improve the balance of supply and demand
throughouttheday.
Figure11:BenefitsofBatteryStorage,Source:ScatecSolar(2016)

44
Thistechnologyisalreadyappliedinsomeareasandthemostpreferredsolutionisstoring
energyinlarge-scalelithiumbatteries(Hockenos,2015).Recentyear’sdevelopmentinthe
costs of battery storage solutions, see figure 12, has increased the interest for the
combinationofasolarPVandbatterystorage.McKinsey(2015)furtherestimatethatthecost
of lithiumbatteriescouldgoas lowas$150by2020. Illustratingthegrowing interest, the
state of California has established an energy
storagestandardrequiringthestate’sIOUsto
set up 1,3 GW of battery storage by 2020
(Finnigan,2015).Thehalvingofcostsishence
buildinganewplatformforfurthergrowthin
theutility-scalesolarindustry.Nolongersetto
be limited by fluctuating power generation,
thedevelopmentinenergystoragerepresents
new opportunities pushing solar power
towards a stronger position in the worlds
energymarkets.
6.2.4 Threats
AnalysingpotentialthreatsforScatecSolar,orthesolarPVindustryingeneral,isusefulin
ordertoidentifypotentialnegativeimpactsonthecompany’sfutureperformanceandcash
flow.Further,thesethreatsmustbeassessedintermsofprobabilityanddegreeofimpact.
The support mechanisms provided by governments have, as mentioned before, been
substantial for solar power in the development towards competiveness. Illustrating the
influencethesemechanismscanhaveisthelatestboominU.Ssolarinstallations,pendingthe
expirationof ITCpolicy initially set to happen at the endof 2016described in chapter 5.
Although an extension of the policy where provided (see section 5.3.3), the developer’s
behaviourrevealhowcriticalthesesupportmechanismsarefortheiroperations.
Giventhesolarindustry’sdependencyonsupportmechanismsandpoliciesdemonstratedin
earlierchapters,thesetoolsalsorepresentapotentialthreatfordevelopers.Thethreatsare
mostinfluentialinthecaseofretroactivechanges,affectingalreadyoperatingplantsorthose
Technology is key – battery cost is dropping
Source: Pike Research
Lithium Ion Battery Price per MWh
475505545
680
805
930
700800
1,000
500
900
400300
1000
200
600
2013201220112010
USD
20152014
Figure12:DevelopmentinBatteryPrices,Source:ScatecSolar(2016)

45
underconstruction.Changesaffecting futureprojectsmayalsobeconsideredthreats,but
theirimpactisnotassubstantialasforretroactivechanges.Anexampleofhowbiganimpact
suchretroactivemeasurescancause istheSpanishsolargiantAbengoawhoarecurrently
fightingtoavoidbankruptcy(WallStreetJournal,2016).Thecompany’sproblemsevolvefrom
the Spanish government withdrawn of generous tariffs, starting in 2010 (Forbes, 2013).
Althoughtheimpactsfromthisthreataresubstantial,retroactivechangestoFiTschemesare
rare (IFC, 2015) andwould usually only become relevant in special scenarios. Changes in
futuresupportmechanismscouldstiruptheindustryandcreateimbalances.Illustratingthe
influence suchchangescanhave is the latestboom inU.S solar installations,pending the
expirationoftheITCpolicyinitiallysettohappenattheendof2016.Asaconsequenceof
developersexpectingITCtoexpire,pipelineswasfilledandtheU.Ssolarmarketisnowsetto
grow119percentin2016.Althoughanextensionofthepolicywhereprovided(seechapter
5.3.3.2),thedeveloper’sbehaviourrevealhowcriticalthesesupportmechanismsarefortheir
operationsandlargetheimpactofchangescouldbe.
6.2.5 Conclusion
This SWOT-analysis has revealed useful insight in the strategic position of Scatec Solar in
today’smarketandthepotentialthreatsandopportunitiesitfacesgoingforward.Through
beinganexperienced“one-stop-shop”withitsintegratedbusinessmodelandsolidfinancial
partnerships, the company iswell positioned to keep on participating in the tremendous
growthofsolarpower.However,thelargeproportionofoperationsinemergingmarketswith
ahighlevelofcountryriskmakesthecompanyvulnerabletonon-operationalfactors.Onthe
othersidetheserisksaretosomeextentmitigatedbysolidpartnershipagreementsanda
strong network in emerging markets. Furthermore, the economic growth and goal of
increasedaccesstoelectricityfortheworld’spopulationrepresentgreatopportunitiesfor
Scatec Solar going forward. Combined with the increased competitiveness and storage
technology,thesefactorsprovideabasisforfurthergrowth.Lastly,theanalysiscoveredthe
potentialthreatsoffutureoperations,highlightingthestrongimpactsofchangesinsupport
mechanismsingeneralandofretroactivemeasuresspecifically. It is importanttoconsider
thesethreatswhenforecastingfutureperformance.

46
7 FinancialStatementAnalysis
Previous chapters have focused on solar power development and outlook and strategic
aspectsbothonindustryandcompany-specificlevel.Bothareasarecrucialelementswhen
forecastingfutureperformanceofScatecSolarandthuseffecttheexpectedfreecashflows.
This chapter will analyse the historical financial statements of the company and discuss
importantaspectsprovidingafoundationforpredictingfuturestatements.
Inthediscussionofsuitablevaluationmethods,oneoftheweaknessesofapplyingaDCF-
method to value Scatec Solarwas its short period as a listed company, providing limited
historical data for analysis.Only three yearsof annual reportswith consistent accounting
principlesareavailable.Asaresult,thisfinancialstatementanalysiswillnotbetooextensive.
Themain objectivewill be to highlight themost important and recurrent aspects of the
financialstatementsaffectingthecompany’sfutureperformance.
7.1 HistoricalPerformance
ScatecSolar’sincomestatementsthelastthreeyearsarepresentedinTable3.Numbersfrom
2012areavailable,butduetoastrategicshiftfromsellingD&Cservicestothird-partiesto
becomingan integrated independentpowerproducer(IPP)thenon-consolidatednumbers
fromtheD&Msegmentin2012arenotusable(ScatecSolar,2014).However,basedonnotes
Ihavebeenabletoestimatetheconsolidatedrevenuefrom2012inordertoprovideagrowth
measurein2013.
Fromitsstrategicshiftin2012ScatecSolarhasbeenexperiencingrapidgrowthininstalled
capacityandpowerproduction,whichhasresultedinavolatilerevenuegrowth.2013must
beconsideredayearoftransitionweretheprimaryfocuswasonconstructingpowerplants.
With123MWunderconstructionandonlyanaverageof58MWinoperationtheyearended
withanegativeoperational result,eventhoughexternal revenues increased50%.Asnew
solarplantscommencedoperationin2014powerproductionincreasedfourtimesbyyear
end,resultinginatremendousrevenuegrowth.Stilladdingnewcapacitycombinedwithfull
yearproductionatnewplants,revenuescontinuedtogrowrapidlyin2015.

47
ConsolidatedIncomeStatement 2013 2014 2015Revenues 115928 455098 867714
Growth 50.3% 292.6% 90.7%Netgain/lossfromsaleofprojectassetsD&C 3904 17393 14112
Netincome/lossfromasscompaniesD&C -3191 -1183 -865
Totalrevenuesandotherincome 116642 471311 880962Growth 51.8% 304.1% 86.9%
Personnelexpenses 50886 69686 70543
Otheroperatingexpenses 82607 108736 112027
EBITDA -16851 292889 698392Margin -14% 62% 79%Depreciation,Amortisation&Impairment 57836 101859 175609
EBIT -74687 191030 522782Margin -64% 41% 59%
Table3:HistoricalOperationalIncomeStatement,(Source:AnnualReports)
Althoughrevenueshavebeenrapidlyincreasing,marginshavebeenrelativelymorestable,
whenignoringthetransitionyearof2013.ExaminingquarterlynumbersrevealsthattheEBIT-
margin has fluctuating around 50%over the last six quarters. A result of other operating
expensescontainingmostlyO&Mcostsandlesscostsfromdevelopmentandconstruction.
Table4listsScatecSolar’sassetsandeachlineitemspercentageoftotalassets.Theoverview
revealsthatsolarpowerplantsinoperationorunderconstructionamounttooverhalfofthe
company’sassets.Anannualgrowthof60-70%thelasttwoyearsreflectsthecompany’srapid
expansion.Cashandequivalentsarethesecondlargestline-itemasaresultoftheamountof
cash restricted to solar projects. The amount of deferred tax assets also stands out and
containsmostlytaxlosscarryforwardswhichwillbereducedasthecompanystabilizetheir
earnings.Ingeneral,allline-itemshavebeenfairlystableasapercentageoftotalassetsover
thelastthreeyears.
ASSETS 2013 2014 2015 Non-currentassets Deferredtaxassets 313644 8.9% 402011 8.0% 340670 4.3%PPL-insolarprojects 1857294 52.7% 3049193 60.8% 5196298 65.1%PPL-other 8715 0.2% 13231 0.3% 19891 0.2%Goodwill 20566 0.6% 22169 0.4% 23595 0.3%FinancialAssets 79921 2.3% 23868 0.5% 126810 1.6%Investmentsinasscompanies 6321 0.2% 25841 0.5% - 0.0%Othernon-currentassets 31397 0.9% 214401 4.3% 136543 1.7%Totalnon-currentassets 2317858 65.8% 3750714 74.8% 5843807 73.2%

48
Currentassets Tradeandotherreceivables 25472 0.7% 126122 2.5% 221382 2.8%Othercurrentassets 105237 3.0% 82897 1.7% 251892 3.2%Financialassets 50552 1.4% 2946 0.1% 1086 0.0%Cashandequivalents 1025362 29.1% 1049106 20.9% 1639029 20.5%
Incompaniesinoperation 380935 10.8% 527980 10.5% 643495 8.1%Incompaniesunderconstruction - 0.0% 1933 0.0% 169934 2.1%Otherrestrictedcash 347917 9.9% 115540 2.3% 174241 2.2%Freecash 296509 8.4% 403653 8.1% 651359 8.2%
Non-currentassetsheldforsale - 0.0% - 0.0% 26427 0.3%Totalcurrentassets 1206623 34.2% 1261071 25.2% 2139816 26.8%
TOTALASSETS 3524481 100% 5011785 100% 7983623 100%
Table4:HistoricalAssets,(Source:AnnualReports)
With PPE in solar projects being the dominant asset, table 5 shows that non-recourse
financingdominatesthecompany’sliabilities.Thehighlevelsreflectthefactthatsolarplants
are usually 75% debt financed. Although high debt levels, the characteristics of the non-
recoursedebttiedtoeachprojectcompanyexclusivelymitigatetheriskofinsolvency.Stable
percentage levelsover the last three years also illustratea controlledgrowth in linewith
company financing principles. In addition, a three-year NOK 500million green bondwas
issuedin2015inordertofinanceincreasinggeneralcorporateactivitiesasthecompanywill
continue to grow in the future (Scatec Solar, 2015). Lastly, the drop in trade and other
payablesin2014isdirectlyconnectedtothehighconstructionactivityin2013astheline-
itemisdirectlyconnectedtotheD&Mactivities.
Non-currentliabilities 2013 %TA 2014 %TA 2015 %TADeferredtaxliabilities 80894 2.3% 82640 1.6% 203436 2.5%Non-recourseproject
financing
2376968 67.4% 3337265 66.6% 4799828 60.1%
Bonds - 0.0% - 0.0% 492917 6.2%Financialliabilities - 0.0% 14886 0.3% - 0.0%Othernon-currentliabilities 3608 0.1% 4646 0.1% 346616 4.3%Totalnon-currentliabilities 2461470 69.8% 3439437 68.6% 5842797 73.2%
Currentliabilities 2013 2014 2015 Tradeandotherpayables 441811 12.5% 69947 1.4% 154154 1.9%Incometaxpayable 91881 2.6% 41543 0.8% 23508 0.3%Non-recourseproject
financing
21572 0.6% 112786 2.3% 166789 2.1%
Financialliabilities 16298 0.5% 25773 0.5% 6184 0.1%Othercurrentliabilities 92834 2.6% 145717 2.9% 364794 4.6%Totalcurrentliabilities 664396 18.9% 395766 7.9% 715429 9.0%
Totalliabilities 3125866 88.7% 3835203 76.5% 6558226 82.1%
Table5:HistoricalLiabilities,(Source:AnnualReports)

49
ReviewingthetotalequityofScatecSolar in table6,someaspectsandelementsmustbe
elaborated.Themostapparentline-itemisthepaidincapital,whichmorethandoubleddue
to the IPO inOctober2014withanetcapital increaseofNOK475millions.Secondly, the
proportionofnon-controllinginterestintotalequityisrelativelyhigh.Thecompanycreates
anownspecialpurposesvehicle(SPV)foreverysolarprojectandeachSPVisfinancedwitha
proportionofdebt,ownequityandco-investors.Non-controllinginterestsrepresentsthese
co-investorsclaimonthegroup’sconsolidatedequity.AftertheIPOin2014non-controlling
interests have been stable at approximately 45%.A final special line-item is the negative
retainedearnings.Aconsequenceofhighconstructionactivityrelativetopowerproduction
intheearlyyearsofthecompany’sexistence.Ascompletedpowerplantsnowhavereached
asustainablepowerproductiontogenerategoodprofits,accumulatedretainedearningswill
movetowardspositivenumbers.
Equity 2013 2014 2015
Sharecapital 1624 0.4% 2345 0.2% 2345 0.2%
Sharepremium 301286 75.6% 794142 67.5% 807903 56.7%
Totalpaidincapital 302910 76.0% 796487 67.7% 810248 56.8%Retainedearnings -147074 -36.9% -207227 -17.6% -164909 -11.6%
Otherreserves -51860 -13.0% 40511 3.4% 161803 11.4%
Totalotherequity -198934 -49.9% -166716 -14.2% -3106 -0.2%Non-controllinginterests 294640 73.9% 546811 46.5% 618255 43.4%
Totalequity 398616 100.0% 1176582 100.0%
1425397 100.0%Table6:HistoricalEquityLevels,(Source:AnnualReports)
Having presented the historical financial statements of the company and commented on
important factors and special aspects, the next section will focus on normalizing and
reorganizingthefinancialstatementstorepresentthecoreoperationsofthecompany.

50
7.2 NormalizingFinancialStatements
ThepreviouschapterdescribedandcommentedonthehistoricalperformanceofScatecSolar
inlightoftheircurrentsituationoftransitionandhighgrowth.Whennormalizingfinancial
statements,theobjectiveistoidentifyandremovenon-recurringitemsinordertoderivethe
coreoperationalincome/costsandbalancesheetsizes.InthefollowingIwilldiscussdifferent
figuresintheincomestatementandbalancesheetbothinahistoricalandfutureperspective.
7.2.1 IncomeStatement
Theobjectiveofexamining theoperating incomestatement is toeliminatepotentialnon-
recurrentitemsthatshouldnotbepartofthefurtheranalysisandlookforpatternsinrecent
year’sdevelopmentthatareusefulinthefollowingvaluation.
7.2.1.1 OperatingExpensesDuetolackofhistoricaldatafigure13illustratesthequarterlydevelopmentintotaloperating
expenses(OPEX)since2014.Thetransitionperiodof2013stillaffectslevelsin2014,butasa
newpowerplantsproduceat100%capacitythetotalOPEXstabilizeataround30%oftotal
salesinthe2015quarters.Consequently,theEBITDAmarginalsoincreasesthrough2014and
settlesat approximately70% in the latestquarters. Furthermore, thepersonnelexpenses
averagesat40%oftotalOPEXinthesameperiod,withminimalvariation.ThestableOPEX
ratio illustrate the predictable costs of running a solar power plant, as the majority of
expendituresarescheduledmaintenance.
Figure13:HistoricalQuarterlyOPEXandEBITDAMargin,(Source:QuarterlyReports)
0%
10%
20%
30%
40%
50%
60%
70%
80%
90%
-
10 000
20 000
30 000
40 000
50 000
60 000
70 000
Q1-14 Q2-14 Q3-14 Q4-14 Q1-15 Q2-15 Q3-15 Q4-15 Q1-16
QuarterlyOPEX
NormalizedTotalOperatingExpenses %ofsales EBITDAMargin

51
Depreciation,amortisationand impairmentcostswillbediscussed in thesectioncovering
capitalexpenditures.
7.2.1.2 OtherincomeadjustmentsAlllastthreeyearsScatecSolarhasdevelopedandconstructedsolarprojectswhichthenhave
beensoldoff,earningadditionalincometothestandardrevenues.Inaddition,therehave
beeninvestmentsinassociatedcompaniesaccountedforbytheequitymethodwhichalso
haveaffected the total revenueandother income.Asall investments in theseassociated
companiesweresoldoffin2015(ScatecSolar,2016),thissourceofotherincomewillnotbe
considered in the valuation. Regarding expected future profit or loss from sale of solar
projects, there are no such projects under construction. All expected projects from the
backlogandpipelinearealsosettobeoperatedbythecompanyandconsequentlythisline-
item will be assumed to equal zero in the forecasting of other income. Furthermore,
generatedrevenueswillbeforecastedonthebasisofpowerproductiononly,asO&Mincome
areexpectedtobeconsolidated.
7.2.2 CapitalExpenditures-CAPEX
Inordertofacilitatetherapidgrowthininstalledcapacityandsolarpowerproduction,Scatec
Solar has made substantial capital expenditures over the last three years. Capital
expenditures consists practically entirely of investments in developing, constructing and
maintaining property, plant and equipment (PPE) to solar projects. Consequently, the
historical CAPEX have also been very volatile due to several projects being initiated
simultaneously.WithlumpyhistoricalCAPEX,anormalizationoftheselevelsarenecessaryin
ordertoforecastfutureinvestments.Preferredapproachestosmoothpredictedlevelsare
averages of historical CAPEX or industry averages as a percentage of a base input
(Damodaran,2012).However,furthergrowthisaspecifiedobjectivefromthemanagement
andCAPEXarenotexpectedtoreachanystable levels intheforthcomingyears.Hence,a
smoothingofCAPEXwillnotbesuitablebeforethecompanyreachasteadystate.
AnalysinghistoricalCAPEX,therearenoobservableconnectiontothelevelsofrevenuesor
powerproductionneitheronaquarterlyandyearlybasis.Butlookingatthedevelopmentin
accumulatedquarterlyinvestmentsandtheMWinoperationoverthelast15quartersreveals
asignificant,thoughnotsurprising,connectionillustratedinfigure14.

52
Figure14:AccumulatedQuarterlyCAPEXandMWinOperation,(Source:QuarterlyReports)
Intheforecastingofstageone,thefirstfiveyearstheCAPEXlevelswillbebasedonthestated
andexpected future installation levels of the company and amix of historical and future
NOK/MWinvestmentcosts.Anumericalobjectivesetbythemanagementis1400-1600MW
inoperationandunderconstructionbyyearend2018andwillbefurtherdiscussedinthein
theforecastingoffreecashflow.Asthecompanyisexpectedtoreachmorestableinstallation
levelsafter2020,theforecastingwillmovetowardsamoresmoothedaverageCAPEXinthe
twolaststagesofthemodel.
DepreciationandimpairmentofexistingPPEhavebeenstableat5.5%ofcarryingamountat
previousyear-end.This ratio isexpected to continue in theyears to come. Lastly, for the
record,therearenocapitalexpensesreportedasoperatingexpensesintheannualreports
from 2013-15. Nor have the company completed any acquisitionswhich could affect the
levelsofCAPEX.
7.2.3 WorkingCapital
Working capital isdefinedas thedifferencebetweencurrentassetsandcurrent liabilities
(Damodaran, 2012). For valuation purposes, interest bearing debt, excess cash and
marketablesecuritiesareremovedfromcurrentassetsandliabilitiesinordertofocusonthe
assets and liabilities related to theongoingoperationsof the firm, theoperatingworking
capital.ForScatecSolar,whichkeepnoinventorythenetworkingcapitalequals:
-
1 000 000
2 000 000
3 000 000
4 000 000
5 000 000
6 000 000
0
50
100
150
200
250
300
350
400
450
Q1
13
Q2
13
Q3
13
Q4
13
Q1
14
Q2
14
Q3
14
Q4
14
Q1
15
Q2
15
Q3
15
Q4
15
Q1
16
QuarterlyCAPEX
AccumulatedInvestmentssinceQ1-13 MWinoperation

53
I90 = :FF2-"#(X$F$'P+U,$ + Y&$%+#'"S0+(ℎ − :FF2-"#(G+L+U,$
Operating cash restricted to projects in operation or under construction make out the
majorityofoperatingcurrentassetswhilecurrentliabilitiesareequallysharedbetweentrade
and other payables and other current liabilities. Trade and other payables are directly
connectedtotheactivityleveloftheD&Csegmentwhileothercurrentliabilitiesareamixof
liabilitiestorelatedpartiesanddifferentaccruedexpenses.
Changesinnetoperatingworkingcapital(NWC)effectsthefreecashflowtothefirmasa
growing NWC ties up more cash and produces reinvestment needs (Damodaran, 2012).
EstimatedhistoricalNWClevelsarefairlyeasytoobtainfromhistoricalannualreportsand
illustratedinfigure7.Predictingfuturechanges,however,aremoredifficultbecausetheyare
unstableandthusdifficulttonormalize.ToobtainthebestprojectedchangesinNWC,they
caneitherbe tied toexpectedchanges in revenues throughahistoricalNWC-to-revenues
ratioorbebrokendowninmoredetail,estimatingeachitemseparately.(Damodaran,2012).
Bothapproacheshaveprosandcons.
Consideringhowthevariousitemsinthecompany’snetoperatingworkingcapitalarerelated
todifferentactivitiesandaccounts,itmakessensetobreakdownitdowninmoredetail.This
providesabetterforecastofhowmuchfuturecashwillbetiedupinthecompany.Although
moredetailed,themajorityoftheNWCitemsarestillconnectedtothelevelofrevenues.
Bothaccountsnaturallyrelatedtothesaleofelectricity,likethetradeandotherreceivables,
butalsothosemorerelatedtothegeneraloperationsofthecompany.Eachitem’srelated
ratioispresentedintable7.
NOKThousand 2013 2014 2015 Norm.RatioOperatingcash 380935 529913 813429 %ofnetPPE 20% 17% 16% 17%Receivables 25472 126122 221382 %ofrevenues 22% 27% 25% 25%Othercurrentassets 91172 74366 187949 %ofrevenues 79% 16% 21% 20%Operatingcurrentassets 497579 730401 1222760

54
Payables 441811 69947 154154 %ofinvestmentsinPPE 34% 8% 6% 7%Incomtaxpayable 91881 41543 23508 %ofrevenues 79% 9% 3% 6%Othercurrentliabilities 92834 145717 168113 %ofrevenues 80% 31% 19% 26%Operatingcurrentliabilities 626526 257207 345775 NetOperatingWC -128947 473194 876985
Table7:HistoricalNetOperatingWorkingCapital
Two accounts need a more specific ratio than the general consolidated revenues. The
operatingcash,whichdominatesthecurrentassets,arecashtiedupinallthedifferentsolar
projectcompanies,theSPVs. It isrestrictedtocoverdebtservices, insurancereservesetc.
Consequently, the levelsofoperating casharemore likely to follow the levelsofnetPPE
ratherthantheconsolidatedrevenues.Similarly,thetradeandotherpayablesaredirectly
connected to the development and construction segment. As the companymatures and
lowers their investments in new projects, the trade and other payables will be reduced
accordingly.As ratioof revenues, thisdevelopmentwouldnotbe taken intoaccountand
providesthusamoreaccurateforecastofreinvestmentsneedinthefuture.
Table7alsoprovidesthehistoricalratiosforthepreviousthreeyearsandanormalisedratio
representingtheexpectedlevelsgoingforward.Thenormalisedratioismainlybasedonthe
twolastyearsgiventhetransitionperiodof2013mentionedearlier.
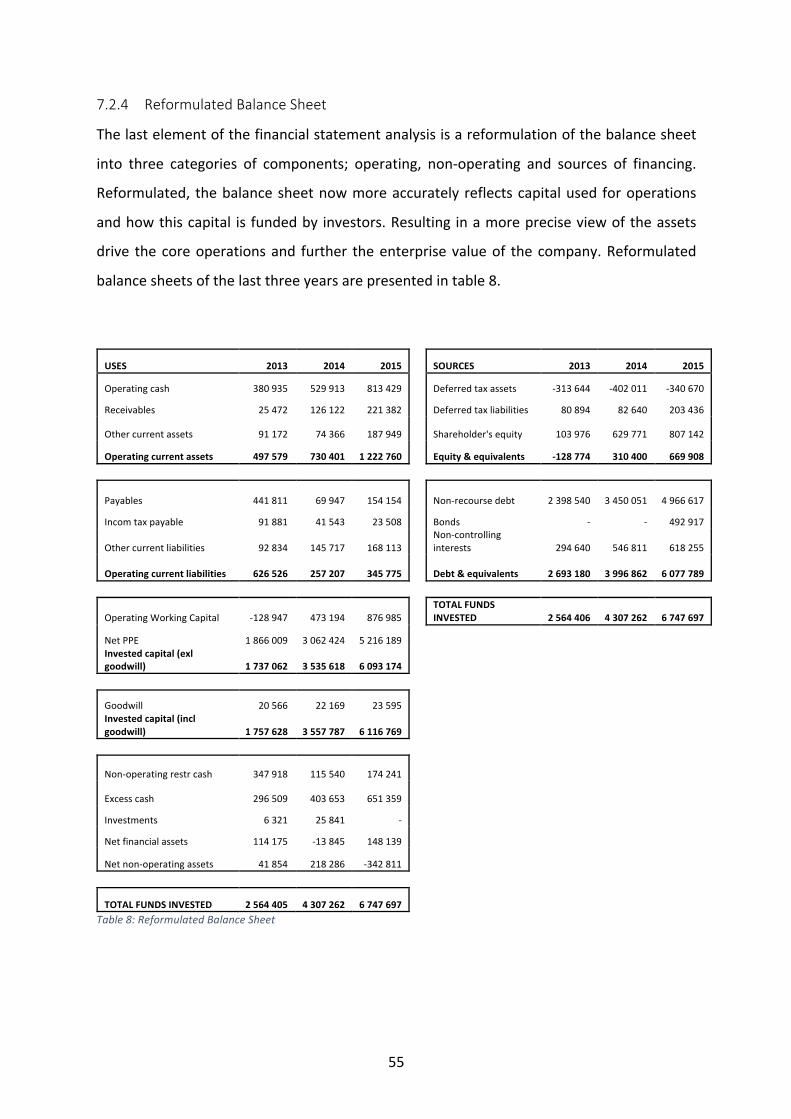
55
7.2.4 ReformulatedBalanceSheet
Thelastelementofthefinancialstatementanalysisisareformulationofthebalancesheet
into three categories of components; operating, non-operating and sources of financing.
Reformulated, thebalancesheetnowmoreaccurately reflectscapitalused foroperations
andhowthiscapital is fundedby investors.Resulting inamorepreciseviewoftheassets
drive thecoreoperationsand further theenterprisevalueof thecompany.Reformulated
balancesheetsofthelastthreeyearsarepresentedintable8.
USES 2013 2014 2015 SOURCES 2013 2014 2015
Operatingcash 380935 529913 813429 Deferredtaxassets -313644 -402011 -340670
Receivables 25472 126122 221382 Deferredtaxliabilities 80894 82640 203436
Othercurrentassets 91172 74366 187949 Shareholder'sequity 103976 629771 807142
Operatingcurrentassets 497579 730401 1222760 Equity&equivalents -128774 310400 669908
Payables 441811 69947 154154 Non-recoursedebt
2398540
3450051
4966617
Incomtaxpayable 91881 41543 23508 Bonds - - 492917
Othercurrentliabilities 92834 145717 168113
Non-controlling
interests 294640 546811 618255
Operatingcurrentliabilities 626526 257207 345775 Debt&equivalents
2693180
3996862
6077789
OperatingWorkingCapital -128947 473194 876985
TOTALFUNDSINVESTED
2564406
4307262
6747697
NetPPE 1866009 3062424 5216189 Investedcapital(exlgoodwill)
1737062
3535618
6093174
Goodwill 20566 22169 23595 Investedcapital(inclgoodwill)
1757628
3557787
6116769
Non-operatingrestrcash 347918 115540 174241
Excesscash 296509 403653 651359 Investments 6321 25841 - Netfinancialassets 114175 -13845 148139
Netnon-operatingassets 41854 218286 -342811
TOTALFUNDSINVESTED 2564405 4307262 6747697 Table8:ReformulatedBalanceSheet

56
8 DriverAssumptions
After analysing the last three years of annual and quarterly financial statements and
normalizingrelevantaccounts,thissectionwillfocusonanalysingthemaindriversofvalue
forScatecSolar.Anassessmentoffuturepowerproductionandpricescombinedwiththe
componentsofthefinancialstatementanalysiswillprovidethefoundationoftheforecasted
operatingincome.Alongwithanexaminationoftheexpectedneedforcapitalexpenditures
thesethreeitemsmakeoutthemostinfluentialcomponentsofthefreecashflowtofirmand
hencetheenterprisevalue.Historicaldata,thesolarpowerindustryanalysisandthestrategic
analysiswillbethemaininputstothisanalysis.
8.1 PowerProduction
AlthoughScatecSolarconsistsofthreedifferentoperatingsegments,powerproductionisthe
dominating segment both in terms of external revenues and EBIT-margins due to
consolidatednumbers.Figure15 illustrateshowthequarterlydevelopment inoperational
incomehasfollowedtheincreaseinpowerproduction.Consideringthecompany’sphasein
thelifecycle,nosteadygrowthinproductionareexpected.Instead,basedonamulti-stage
DCF-model,thepredictedpowerproductionlevelswillbedividedintothreesteps.Thefirst
fiveyearswillfocusonthecompany’sprojectsunderconstructionandinthebacklog,while
thenextfiveyearswillassessthecompany’spipelineanddevelopmenttowardsmorestable
powerproduction.
Figure15:HistoricalQuarterlyPowerProductionandEBIT,(Source,QuarterlyReports)
(40 000)
(20 000)
-
20 000
40 000
60 000
80 000
100 000
120 000
140 000
160 000
180 000
(40 000)
(20 000)
-
20 000
40 000
60 000
80 000
100 000
120 000
140 000
160 000
180 000
200 000
Q4-13 Q1-14 Q2-14 Q3-14 Q4-14 Q1-15 Q2-15 Q3-15 Q4-15 Q1-16
1000NOK
MWhProduced
PowerProduction
PowerProductionMWh EBIT

57
Theanalysisofthesolarenergyindustryinchapter5presentedbothhistoricalandexpected
futuredevelopmentoftheinstalledcapacityofsolarPV.ConsideringScatecSolar’sgrowthin
power production presented in figure 15 it is reasonable to say that the company has
participatedand contributed to this extraordinaryexpansion in the industry recent years.
Basedon theoutlook fornewaddedcapacity in the industry, thereno signsof this rapid
growthmaturinganytimethenext5-10yearsandtheopportunitiesavailableforScatecSolar
arenumerous.
8.1.1 2016–2020:Furthergrowth
Giventhenatureoftheutility-scalesolarpowersector,wereoperatingplantsareexpected
toproducepoweratastable level foraround20years, themost interestingaspect is the
capacityofexistingplantsandthatoftheexpectednewprojects.Expectednewprojectsare
basedon thebacklogandpipelinedistributedby the company. Thebacklog isdefinedas
projectswithasecuredoff-takeagreementestimatedtohavea90%probabilityofrealisation
(ScatecSolar,2016).Projects in thepipelinehavea likelihoodofmore than50%to reach
financial close and realisation. By analysing existing plant’s recent performance and the
potentialofprojectsinthebacklogandpipeline,areasonablepredictionofproductionthe
nextfiveyearscanbemade.
Attheendofthefirstquarter2016,ScatecSolarhadsevenoperationalpowerplantswitha
combinedcapacityof383MWlistedintable9,withtheircorrespondinghistoricalandstated
performancebythecompany.
Plants Country MW 2014 2015 StatedProductionCzech Czech 20 20686 22364 20500
Kalkbult SouthAfrica 75 150528 143788 150000
Dreunberg SouthAfrica 75 - 157708 178000
Linde SouthAfrica 40 - 87554 94000
ASYV Rwanda 9 - 13817 15500
AguaFria Honduras 60 - - 103000
UthaRedHills UnitedStates 104 - - 210000
Table9:HistoricalandStatedProductionbyPlant,(Source:AnnualandQuarterlyReports)
Thetablepresentsonlyacompletefullyearperformance.Althoughquarterlyperformance
exists, theyarenot representable for awhole yeardue tomanyplantsbeingaffectedby
varyingirradiationlevelsthroughouttheyear.Thestatedproductionlevelsareobtainedfrom
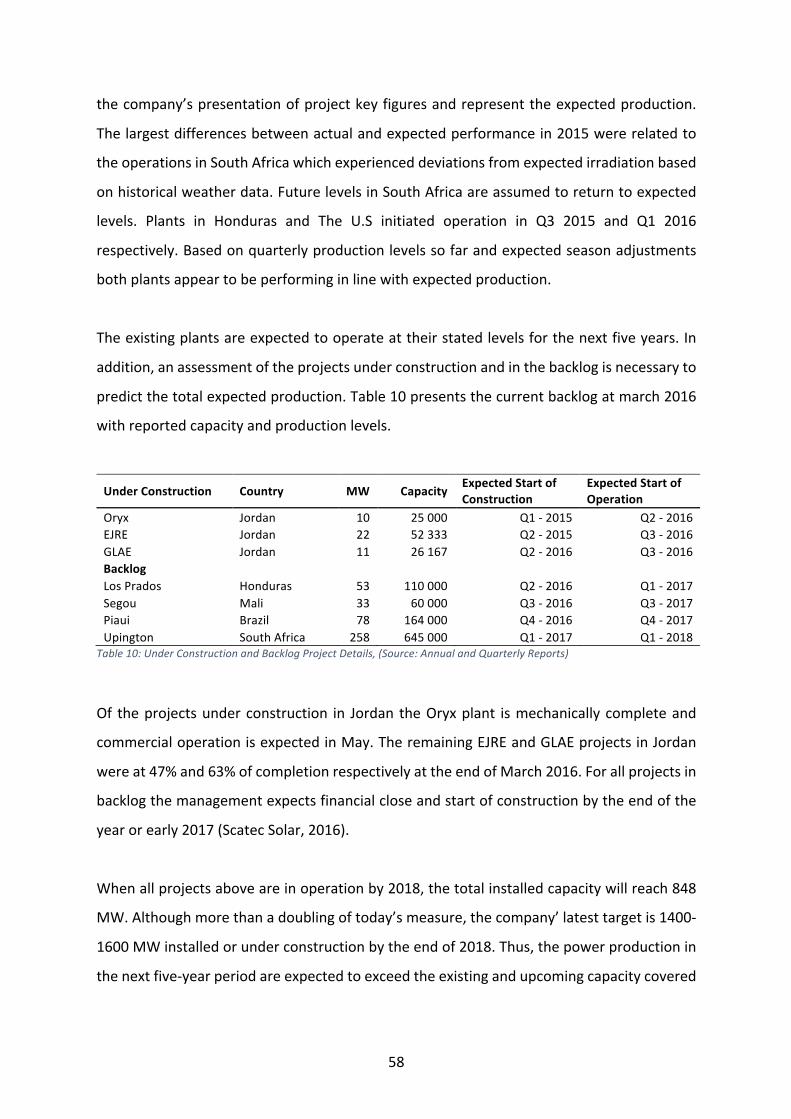
58
thecompany’spresentationofprojectkeyfiguresandrepresenttheexpectedproduction.
Thelargestdifferencesbetweenactualandexpectedperformancein2015wererelatedto
theoperationsinSouthAfricawhichexperienceddeviationsfromexpectedirradiationbased
onhistoricalweatherdata.FuturelevelsinSouthAfricaareassumedtoreturntoexpected
levels. Plants in Honduras and The U.S initiated operation in Q3 2015 and Q1 2016
respectively.Basedonquarterlyproductionlevelssofarandexpectedseasonadjustments
bothplantsappeartobeperforminginlinewithexpectedproduction.
Theexistingplantsareexpectedtooperateattheirstatedlevelsforthenextfiveyears.In
addition,anassessmentoftheprojectsunderconstructionandinthebacklogisnecessaryto
predictthetotalexpectedproduction.Table10presentsthecurrentbacklogatmarch2016
withreportedcapacityandproductionlevels.
UnderConstruction Country MW Capacity ExpectedStartofConstruction
ExpectedStartofOperation
Oryx Jordan 10 25000 Q1-2015 Q2-2016
EJRE Jordan 22 52333 Q2-2015 Q3-2016
GLAE Jordan 11 26167 Q2-2016 Q3-2016
Backlog
LosPrados Honduras 53 110000 Q2-2016 Q1-2017
Segou Mali 33 60000 Q3-2016 Q3-2017
Piaui Brazil 78 164000 Q4-2016 Q4-2017
Upington SouthAfrica 258 645000 Q1-2017 Q1-2018
Table10:UnderConstructionandBacklogProjectDetails,(Source:AnnualandQuarterlyReports)
Of theprojectsunderconstruction in Jordan theOryxplant ismechanicallycompleteand
commercialoperationisexpectedinMay.TheremainingEJREandGLAEprojectsinJordan
wereat47%and63%ofcompletionrespectivelyattheendofMarch2016.Forallprojectsin
backlogthemanagementexpectsfinancialcloseandstartofconstructionbytheendofthe
yearorearly2017(ScatecSolar,2016).
Whenallprojectsaboveareinoperationby2018,thetotalinstalledcapacitywillreach848
MW.Althoughmorethanadoublingoftoday’smeasure,thecompany’latesttargetis1400-
1600MWinstalledorunderconstructionbytheendof2018.Thus,thepowerproductionin
thenextfive-yearperiodareexpectedtoexceedtheexistingandupcomingcapacitycovered

59
sofar.Forfurtherinputonfutureproductionlevelstheprojectpipelinepresentedintable11
isassessed.
Pipeline MW TargetConstructionStartMozambique 40 2016
Kenya 44 2017
WestAfrica 17 2017
Egypt 341 2016
Pakistan 150 2017
Americas(Mexico) 30 2017
SouthAfrica 430 2018
TotalPipeline 1056
Table11:PipelineProjects'Details
Thereislessinformationavailableforthecompany’sprojectpipeline,andconsequentlymuch
more uncertainty when predicting future production. Projects are yet to secure power
purchaseagreementsandsupportagreementsatthisstage,whicharecriticalelementsof
reachingrealisation.Basedonthetheoreticalexpectedrealisation,50%ofthepipelineMWs
willbeinstalled,atotalof528MW.Toprovideamoreaccurateexpectedoutcomeofthe
pipeline,anassessmentofeachpipelineprojectisneeded.
Thepipelineprojectsclosesttosecuringoff-takeagreementsandfinancialcloseare,based
on company information, the EastAfricanprojects, Egypt andPakistan.Mozambique and
KenyahavefinancingprocessesontrackandareclosetocompletingnegotiationofPPAs.In
Egypt and Pakistan, participation in large projects are secured and agreements on
development are already signed. Thus, PPAs and tariffs are expected to be secured as
processesproceed.
Summingupthecurrentoperations,expectedadditionsfromprojectsunderconstructionand
from backlog, combined with the most qualified pipeline projects table 12 presents the
predictedMWcapacityofScatecSolar,thenextfiveyears.Thetableonlyfocusonhowthe
abovementioned projects gradually will enter into operation through the backlog and
construction phase. Additional projects will not be assessed in this section. By 2020 the
companyisexpectedtohave1423MWinstalled,inlinewiththeirstatedgoalof1400-1600
MW inoperationorunderconstructionby2018.The rapidgrowth isalso justifiedby the
expectedoverallinstalledcapacitygrowthintheindustrycoveredinchapter5.

60
MWCapacity 2016 2017 2018 2019 2020Inoperation 426 512 848 932 1423
Underconstruction 164 420 425 491
Inbacklog 683 491 150
Table12:Stage1ExpectedCapacityLevels
HavingpredictedthetotalinstalledMWcapacityinoperationeachofthenextfiveyears,one
more step remain inorder to reach the completepowerproduction levelsneeded in the
valuation.Forprojectsinoperation,underconstructionandinthebackloganexpectedlevel
of power production is obtainable. The pipeline projects however, only register theMW
capacity.Intheory,foreveryMWinstalled,aplantwillproduce24MWheachdaygiven24-
hourproduction.Inpractice,thesolarpowerplantsonlyproducewhenthesunisshining.
Thus,toestimatetheMWhpowerproductionfromthestatedMW,acapacityfactorisused.
Thecapacityfactormeasurestheratioofactualpoweroutputoverpotentialoutputatfull
operation(IFC,2015):
0+&+F'#L/+F#2%(0/) =!"$%SLZ$"$%+#$Q&$%:""-4([9ℎ)24 ∗ 365 ∗ @"(#+,,$Q0+&+F'#L([9)
RewritingthisexpressionyieldstheexpectedgeneratedpowerperannumgiventheCFand
installedMW:
!"$%SLZ$"$%+#$Q&$%:""-4 [9ℎ = 0/ ∗ 8760 ∗ @"(#+,,$Q0+&+F'#L([9)
Thecapacityfactorismainlyaffectedbytwofactors,thegeographicallocationoftheplant
and the tracking system of the PV modules. Geographical location affects the seasonal
changesinirradiationandweatherconditions,whiledifferenttrackingsystemsmaximisethe
annualirradiationasmodulesfollowthesunasitmovesacrossthesky.Inlackofsufficient
informationaboutthepipelineprojectstheconversionratioswillbebasedontheratiosof
existingplants.Table13presentsallCFsof thecoveredpowerplantsand reveals thatall
plants,excepttheEuropeanones,havearatiobetween20-30%.Consequently,thepipeline
projects areexpected toperformat ratiosequal toexistingplants in similar geographical
areas.Withtheratiosset,theexpectedlevelofgeneratedpowerperyearisalsopresented
intable13.

61
Czech Kalkbult Dreun-
berg Linde ASYV AguaFria
UtahRedHills Oryx EJRE
MW 20 75 75 40 9 60 104 10 22
CF 12% 23% 27% 27% 21% 20% 23% 29% 27%
GWhp.a 20.5 150 178 94 15.5 103 210 25 52.33
GLAE Los
Prados Segou Piaui Upington Mozam-bique Kenya Egypt Pakistan
MW 11 53 33 78 258 40 44 341 150
CF 27% 24% 21% 24% 29% 27% 25% 27% 25%
GWhp.a 26.167 110 60 164 645 94.61 96.36 806.53 328.5
Table13:CapacityFactorbyPlant
Allneededinputsarenowestimatedandthepredictedtotalpowerproductionofallsolar
powerplantsforthecomingfive-yearperiodarelistedintable14below.Amoredetailed
tableispresentedinAppendix2.Thetablerevealsasubstantialincreaseinproductionlevels
inlinewiththelargegrowthambitionsofthecompany.
MWh 2015 2016E 2017E 2018E 2019E 2020E
Total 466278 829000 1004500 1853500 2044468 3179501
MWoperation 279 426 512 848 932 1423
Table14:Stage1PredictedPowerProduction
8.1.2 2021–2025:StabilizingGrowth
Expectinganincreaseoftotalannualpowerproducedfrom466GWhin2015to3180GWh
in 2020, Scatec Solar will most likely enter a more mature phase, with more focus on
optimizingandmaintainingtheirexistingplants.Therewillstillbenewcapacityinstalled,but
relatively to theMW in operation additions will be small. The objective of the following
sectionistoforecasttheperformanceofthesecond-stageintheDCF-model.
Thefirststageofthepowerproductionforecastingfocusedspeciallyontheexpectedsolar
projects presented by the company. For the second stage a more general approach is
required,as the informationon futureprojectsareonly referred toaspossibilities.These
possibilities are projects yet to reach 50% likelihood and enter the pipeline, butwere a
feasibilitystudyandbusinesscasehavebeenmade(ScatecSolarQ1,2016).Allopportunities
ofnewcapacityareconnectedtheemergingmarketsofAmericas,AfricaandMENA3.Oneof
3MiddleEast&NorthAfrica

62
thepromisingareasmentionedinthemarketanalysis,butalsoanareaassociatedwithhigh
country risks in terms of political stability and grid capacity. Processes in these areas are
complexandtime-consuming.Inthefirstquarterof2016,thecompanyclaimed2426MWof
projectopportunitiesavailable.
Basedontheassessmentoftheprojectsopportunities’characteristics,theexpectedfraction
ofaddedMWfromthecompany’sstatedpossiblecapacityby2025areassumedtobeinthe
areaof25%.Forsimplicity,asmoothedincreaseyear-on-yearfrom2021isfurtherassumed.
TheaddedMWarepresentedintable15.
Totalopportunities
Expectedby2025 2021E 2022E 2023E 2024E 2025E
Africa,Americas,MENA
2426 600 120 240 360 480 600
TotalMWh 3442301 3705101 3967901 4230701 4493501
Table15:Stage2PredictedInstalledCapacity
ThetablealsopresentsthetotalMWhproducedbytheentirecompanyafteraddingthenew
capacity.WhenconvertingtheaddedMWtoMWhofextraproductionageneralconversion
ratioof25%hasbeenused,afairestimatecoveringallthethreeregions.
8.1.2.1 2026-:SteadyState
ThethirdandfinalstageoftheDCF-modeliswherethecompanyhasreachedasteadystate
ofproduction.Newinstalledcapacityatthisstagewillbeaimedatmaintainingcurrentlevels
ofMW.
8.2 PowerPrices–PurchasePowerAgreements
Asmentioned above, thepower production segment dominates the consolidated income
statement,contributingtoroughly98%oftotalconsolidatedrevenuesthelasttwoyears.In
additiontothepowerproductionanalysedabove,thepriceofpowerobtainedthrough20-
25-year PPAsmake up the two driving components of total consolidated revenues. Each
powerplantoperateswithindependentPPAswhoallareadjustedforinflation.Hence,this
sectionwillassesstheexistingrunningPPAsandtheexpectedlevelsofPPAsforfuturesolar

63
powerprojects.Theanalysiswillbebasedonhistoricalrevenues,companyinformationon
futureprojectsandmarketoutlookforfuturePPAlevels.
8.2.1 RunningPPAs
Eachofthecompany’ssevenoperatingsolarplantshave20-25-yearlongrunningPPAs.Table
16 presents a general price per MWh for for each PPA based on company-distributed
information on expected revenues and production. In addition, 2015 revenues and
NOK/MWharepresentedforplantsinfull-yearoperation.Withsomeexceptions,theprice
perMWhmatchestheexpectedlevels.ThedifferencesattheAguaFriaplantsareduetoan
expectedadditionalincentivetariff,notyetrunning,whilethehigherpricesinRwandaare
relatedtothestrengtheningoftheUSD/NOKFXrate.Inaddition,theUtahRedHillsplantwill
selltheirpowertomerchantmarketin2016asthePPAdoesnotstartrunningbefore2017
whichmeanssubstantiallylowerrevenuesthefirstyear.Thepricepresentedintable16is
thefixedPPAprice.AveragemerchantpriceforQ12016was16.4USD/MWh(ScatecSolar
Q1,2016)andwillbeusedforallrevenuesof2016.
PPApricesarepresentedinNOKthousand,butareoriginallyrunningindifferentcurrencies
listedinthetable.Asaconsequence,thecompanyisexposedtocurrencyriskwhenincome
fromsubsidiariesaretranslatedbacktotheconsolidatedfinancialstatements.Thegeneral
policyofthecompanyisnottohedgethiscurrencyexposure(ScatecSolar,2016),thusthe
reportedincomefrominternationalsubsidiarieswillfluctuatewiththeexchangerates.
1000NOK FX Revenues2015
1000NOK/MWh
ExpectedRevenues*
ExpectedPowerProduction*
1000NOK/MWh*
Czech CZK 87200 3.90 78000 20500 3.80
Kalkbult ZAR 283900 1.97 280000 150000 1.87
Dreunberg ZAR 268900 1.71 304000 178000 1.71
Linde ZAR 145400 1.66 155000 94000 1.65
ASYV USD 28600 2.07 23000 15500 1.48
AguaFria USD 135000 103000 1.31
RedHills USD 110000 210000 0.52
Table16:HistoricalandExpectedRevenuesandPPA-levels,(Source:AnnualandQuarterlyReports)
Whenforecastingthefuturerevenuesofexistingplants,theexpectedrevenuespresentedby
thecompanywillbeusedastheyareassumedtobetheexpectedrevenueroughlyadjusted
forcurrencyfluctuations.Furthermore,thespreadofexposureacrossseveralcurrenciesare
expected to even out the gains and losses from currency translations. Where no NOK

64
measuresareavailable,anestimateofNOK/USDat8.2willbeused.Theonlyadjustments
neededarerelatedtoinflation.Eachrunningproject-PPAhasindividualinflationadjustments.
Somearefixedyearlyadjustmentsandothersfollowtheoperatingcountry’sCPI.Alistofthe
differentadjustmentsispresentedintable17.
Plant YearlyInflationAdjustmentCzech 2.0%
Kalkbult SouthAfricanCPI
Dreunberg 19%ofS.ACPI%
Linde 18%ofS.ACPI%
ASYV 1.5%
AguaFria 1.5%
UtahRedHills Noadjustments
Table17:InflationAdjustmentAgreements,(Source:AnnualandQuarterlyReports)
8.2.2 Backlog&PipelinePPAs
Inadditiontothedistributedinformationonexpectedrevenuesforplantsinoperation,the
company has also revealed their expectations for the projects under construction and in
backlog. The available information is presented in table 18. Regarding the inflation
adjustments, there are no information regarding the Los Prados or Piaui plants, but
denominatedinUSDandoperatinginthesameareaastheAguaFriaplant,theyareassumed
tobeadjustedequally.
1000NOK FX ExpectedRevenues*Inflation
Adjustment 1000NOK/MWhOryx USD 33000 No 1.32
EJRE USD 66667 No 1.27
GLAE USD 33333 No 1.27
LosPrados USD 128000 1.5% 1.16
Piaui* USD/BRL 115000 1.5% 0.70
Segou EUR 76000 1.5% 1.27
Upington ZAR 387000 20%ofCPI 0.60
Table18:ExpectedRevenuesProjectsUnderConstructionandBacklog,(Source:AnnualandQuarterlyReports)
AlldistributedrevenuesaredenominatedinNOK,excepttheprojectinPiaui,Brazil,which
onlyhasUSD-denominatedrevenuesavailable.
Theremainingprojects,inthecompany’spipelinediscussedinthepowerproductionsection,
donothaveanyinformationonpricesorrevenuesavailable.Inordertoobtainrealisticprices

65
for theseprojects,existingprojects, recently issuedPPAsanddifferentFiT-schemes inthe
marketswillbeassessed.
Twoofthefourdifferentprojectsinthepipeline,PakistanandEgypt,arepartoflargestate-
drivenrenewableenergyinitiatives.InEgypttheofficialtotaltargetofinstalledsolarPVover
the next years is 2300MWand the associated FiT-scheme is set at 14.34$.cent/kWh for
capacity exceeding 50MW (EgyptERA, 2014). As a participant in this initiative, the PPAof
ScatecSolar’sEgyptianprojectswillgeneraterevenuesofaroundUSD143/MWh.InPakistan
theAlternativeEnergyDevelopmentBoard(AEDB)haveintroducedaframeworkandFiTsfor
solar PV as one of many initiatives to cope with the country’s severe energy crisis. The
levelisedtariffforthe25-yearPPAgrantedbytheNEPRA4,whichScatecseektosecure,is
10.725$.cent/kWh(IFC,2016).
InKenyatherehasexistedFiTsforsolar-generatedelectricityforseveralyearsandthelast
regulationwasmadewith theEnergySolarPhotovoltaicSystemsRegulations in2012.For
utility-scale,gridconnectedsolarplantswithacapacitybetween10-40MWastandardized
FiTof$0.12/kWhapplies(PVMagazine,2015).Althoughthislevelhasbeenundercriticismof
beingtoolowtoattractinvestors(PV-Tech,2014),itwillbethebaseoftherevenue-forecast
oftheKenyaproject.
ThelastprojectMozambiqueiscarriedoutinalessdevelopedsolarPVmarket.Itisoneof
the first PV initiatives in the Electricidade deMoçambique’s (EDM) new energy strategy,
aimingatmorediversifiedenergysupplymixandenvironmentalawarenessandsustainability
(ERM,2016).WithsuchayoungmarketforsolarPV,thereexistsnoestablishedFiT-schemes
yet.However,theministryofenergydidlaunchaFiTforforbiomass,smallhydro,solarand
windin2014.Theratesvariedbetween$0.13-$0.41/kWhdependingontechnology,buthave
notbeenimplementedandarestillpending(Climatescope,2015).Basedontheseinputs,the
USD/MWhissetatUSD130fortheexpectedMozambiqueproject.Asummaryofallexpected
PPA-levelsandassumedinflationadjustmentsforthepipeline-projectsarepresentedintable
19.
4NationalElectricPowerRegulatoryAuthority.

66
FXExpectedRevenues
InflationAdjustment FiTScheme 1000NOK/MWh
Mozambique USD 130559 1.5% USD130 1.07
Kenya USD 94818 1.5% USD120 0.98
Egypt USD 945741 1.5% USD143 1.17
Pakistan USD 288226 1.5% USD107 0.88
Table19:ExpectedRevenuesPipelineProjects,(Source:AnnualandQuarterlyReports)
8.2.3 FuturePPAs
Thereexistslittleobtainableandspecificinformationregardingtheprojectopportunitiesin
Africa, Americas and MENAs considered in the second-step of the power production
forecasting. As a consequence, a general price perMWhwill be used to estimate future
revenues.Severalaspectsmustbeconsideredwhensettingthisrate.Thesolarpowermarket
outlookinchapter5indicatedthattheattractiveFiT-schemeswillbemoderatedordisappear
astheindustryarematuring,indicatingthatthepricelevelperMWhissettobelowerinthe
future. This is supported by the strategic analysis in chapter 6, ascertaining strong
competitivenessintheindustrywhichinturnwillpushdownprices.Ontheotherhand,the
strategyofScatecSolarisclearlyaimedattheemergingmarketsweresolarPVwillbegrowing
for many years before maturing. Furthermore, the company operates with strict
requirementsintermsofreturnoninvestmentsandwillnotpushdowntheirpricestowin
newprojectsatanycost.Thesumofallaspectsisapricelowerthantoday’saverage,butnot
necessarilylowerthantheminimumrunningrate.FuturePPAswillbeexpectedtoaverageat
arateof1000NOK/MWh.Thisrateisexpectedtobeadjustedforinflationyearlyatthesame
rateaspreviousprojectsintheemergingmarketsofAfrica,AmericasandMENAs.
8.3 CapitalExpenditure–InvestmentsinPPE
In the financial statement analysis, the high levels of investments in property plant and
equipment(PPE)overthelastthreeyearsweredescribed.Thestrongcorrelationbetween
installed capacity and accumulated investments were also illustrated. In light of this
observationstheinvestmentsinPPEisexpectedtofollowthesamethree-stagemodelasin
the power production section. The next five years of continuing high growth will be
accompaniedbylargeinvestmentsinPPEwhilethefollowingfiveyearsofstabilizinggrowth
willbereflectedinmoremoderateinvestmentsandfinallyathird-stagesteadystatewhere
investmentswillequaldepreciation.
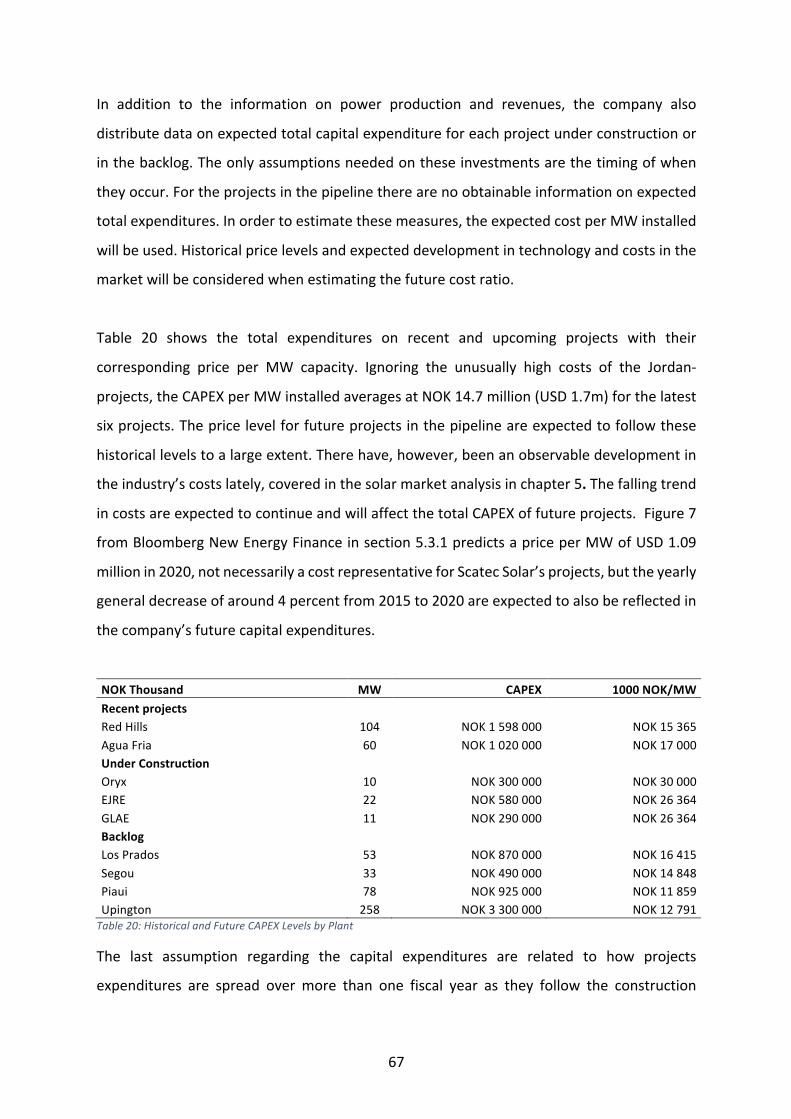
67
In addition to the information on power production and revenues, the company also
distributedataonexpectedtotalcapitalexpenditureforeachprojectunderconstructionor
inthebacklog.Theonlyassumptionsneededontheseinvestmentsarethetimingofwhen
theyoccur.Fortheprojectsinthepipelinetherearenoobtainableinformationonexpected
totalexpenditures.Inordertoestimatethesemeasures,theexpectedcostperMWinstalled
willbeused.Historicalpricelevelsandexpecteddevelopmentintechnologyandcostsinthe
marketwillbeconsideredwhenestimatingthefuturecostratio.
Table 20 shows the total expenditures on recent and upcoming projects with their
corresponding price per MW capacity. Ignoring the unusually high costs of the Jordan-
projects,theCAPEXperMWinstalledaveragesatNOK14.7million(USD1.7m)forthelatest
sixprojects.Thepricelevelforfutureprojectsinthepipelineareexpectedtofollowthese
historicallevelstoalargeextent.Therehave,however,beenanobservabledevelopmentin
theindustry’scostslately,coveredinthesolarmarketanalysisinchapter5.Thefallingtrend
incostsareexpectedtocontinueandwillaffectthetotalCAPEXoffutureprojects.Figure7
fromBloombergNewEnergyFinanceinsection5.3.1predictsapriceperMWofUSD1.09
millionin2020,notnecessarilyacostrepresentativeforScatecSolar’sprojects,buttheyearly
generaldecreaseofaround4percentfrom2015to2020areexpectedtoalsobereflectedin
thecompany’sfuturecapitalexpenditures.
NOKThousand MW CAPEX 1000NOK/MWRecentprojects
RedHills 104 NOK1598000 NOK15365
AguaFria 60 NOK1020000 NOK17000
UnderConstruction
Oryx 10 NOK300000 NOK30000
EJRE 22 NOK580000 NOK26364
GLAE 11 NOK290000 NOK26364
Backlog
LosPrados 53 NOK870000 NOK16415
Segou 33 NOK490000 NOK14848
Piaui 78 NOK925000 NOK11859
Upington 258 NOK3300000 NOK12791
Table20:HistoricalandFutureCAPEXLevelsbyPlant
The last assumption regarding the capital expenditures are related to how projects
expenditures are spread over more than one fiscal year as they follow the construction

68
process. All investments are seldom made within the same year that the plants start
operation, thus an assessment on when different project investments will occur are
necessary.
InvestmentsinallthreeprojectsinJordanhavealready,toalargeextent,beenmade.Atyear-
end2015theOryxplanthadreach66%percentage-of-completion(PoC),whiletheEJREand
GLAEprojectPoCwere24%and33%respectively.Forsimplicity,theremaininginvestments
intheseprojectsareassumedtofollowthePoC.Theprojectsinthebacklogaredividedby
quarters,splittingtheLosPradosinvestmentin¾occurringin2016and¼in2017etc.Timing
of the construction process for the pipeline-process are less specific, so the general
assumptionisthattheseinvestmentswillbesplitequallybetweentwoyearstosmooththe
investmentsslightly.Theresultispresentedintable21whichliststhetotalexpectedCAPEX
foreachofthenextfiveyears.Inyear2020additionalinvestmentswillbemadeconnected
tothenextfive-yearperioddiscussedinthenextparagraph.
NOKThousand 2016 2017 2018 2019 2020MWinoperation 426 512 848 932 1423
ExpectedNOK/MW
forpipeline14713 13927 13253 12691 12242
CAPEX 1865850 4184924 3504997 3075420 2302726
Table21:Stage1ExpectedCAPEXLevels
AfterfiveyearsofhighgrowthandlargeinvestmentsinPPE,theactivityisexpectedtomature
over thenext five-yearperiod,asmentionedabove.Newprojectsopportunities inAfrica,
AmericasandMENAwillstillcontributetoadditionalinvestmentsbutatasmallerandmore
stablescaleof120MWperyear.Forecastingthecapexlevelsinthisperiodcontainsmore
uncertainty,butarestillexpectedtofollowthetechnologyandcostsdevelopmentinthePV
module industry. Figure 4 in the solar industry analysis indicate that module prices are
expectedtokeepdecreasingfrom2020towards2025.Further,therearenosignsfromthe
strategicanalysisofthebargainingpowertowardsthesuppliersgettinganystrongereither.
Thus,basedonthis,thecostperMWinstalledisexpectedbefurtherreducedinthesecond-
stage.Nottothesameextentasinthehighgrowthphase,butata2%yearlydecline.The
resultofthisdevelopmentispresentedintable22alongwiththetotalyearlycapexandMW

69
inoperation.In2025andonwards,thecapexisexpectedtoequalthetotaldepreciationon
existingprojects,asthecompanyseektomaintaintheircurrentoperations.
NOKThousand 2021 2022 2023 2024 2025MWinoperation 1543 1663 1783 1903 2023
ExpectedNOK/MW 11997 11757 11522 11292 11292
CAPEX 1410889 1382672 1355018 1338984 834336
Table22:Stage2ExpectedCAPEXLevels
8.4 ConclusionDriverAssumptions
Combiningthenormalisedfinancialstatementsfromchapter7andtheassumptionsonvalue
drivers analysedabove,provides a forecastof Scatec Solar’s future revenues, operational
expenses, investments levelsandnetoperatingcapital forthefirsttwostagesoftheDCF-
model,whicharepresentedintable23.
NOKThousand 2016E 2017E 2018E 2019E 2020ETotalRevenues 841514 1108550 1432933 2020288 2260587
TotalOPEX 324697 419710 591747 662131 1038074
CAPEX 1865850 4184924 3504997 3075420 2302726
Depreciation 286890 373733 504614 609627 695930
NWC 1168677 1696414 2468268 3039642 3679772
NOKThousand 2021E 2022E 2023E 2024E 2025ETotalRevenues 3877097 4212653 4550909 4892018 5236145
TotalOPEX 1135611 1233896 1332972 1432884 1533679
CAPEX 1410889 1382672 1355018 1338984 834336
Depreciation 752168 775223 796484 816032 834336
NWC 4058646 4216226 4365401 4505819 4674783
Table23:SummarizedAssumptionsStage1and2

70
9 TheCostofCapital
Theforecastedfuturecashflowstofirmdescribedinchapter3arefreecashflowavailableto
all investors, independentof funding. Inorder tovalue thecompany, theenterpriseDCF-
modeldiscountsthesecashflowsatthecostofcapital,representingtheinvestorsrequired
return.AsScatecSolarisfundedwithbothequityanddebt,thereareinvestorsandlenders
whorequireadifferentreturnontheirinvestments,eitherthroughanequityriskpremium
ordefaultriskpremiumrespectively.Inordertoadjustsforthedifferentrequiredreturns,
theEDCF-modeldiscountsfreecashflowataweightedaverageofthecostofequityandthe
costofdebt,theWACC:
deff = gh ij k − lm +
nhio
ConsideringthatScatecSolardoesnothaveanyothersecurities,suchaspreferredstock,we
canapplytheWACCinitssimplestform.Intheproceedingsofthischapterestimationofeach
component will be presented: cost of equity, cost of debt and target capital structure
respectively.
9.1 Costofequity
Therequiredreturnonequity isbasedontherisk-levelof the investment,definedbythe
differencebetweenexpectedandactualreturns.Thedifferenceinreturnaregroupedintwo
categories, diversifiable and non-diversifiable risk (Damodaran, 2012). Diversifiable risk is
definedasfirm-specificandcanbeeliminatedbyholdingasufficientnumberofsecurities
(Brealey,Myers&Allan, 2014)whilenon-diversifiable risk affects all investments andare
referredtoasmarketrisk.
Themajorityofallriskandreturnmodelscomputeriskfromthedistributionofactualreturns
around the expected return and measure it from a well-diversified marginal investor’s
perspective.However,theydifferintheirmeasureofnon-diversifiableandmarketriskand
themostappliedmodelbypractitionersistheCapitalAssetPricingModel(CAPM).
AssumptionsoftheCAPMarethatallinvestorsareriskaverse,canlendandborrowatthe
samerateandhaveaccesstothesameinformation.Furthertherearenotransactioncosts,
enabling costless diversification, and exists a risk-free asset. By holding different

71
combinations of thewell-diversifiedmarket portfolio and the risk-free asset all investors
adjusts for theirpreferenceof risk.Resulting in the followingestimationof costofequity
(Brealey,Myers&Allan,2014):
fepq =rs + t rm − rs
Theestimation isbasedontherisk-freeassetrs, themarketpremium rm − rs andthe
betarepresentingthecompany’snon-diversifiablerisk.
9.1.1 Risk-freerate
Anasset isdeterminedtoberiskfreeiftheexpectedreturncanbeknownwithcertainty,
withotherwordsactualreturnequalsexpectedreturns(Damodaran,2012).Forthistohold
twoconditionsmusthold;(i)thereisnodefaultriskand(ii)thereisnoreinvestmentrisk.In
order toachievenodefault risk, government securitiesare theonlyoption,asnoprivate
securityaretoobigtofail,lastseenduringthefinancialcrisisin2008.Althoughtheaftermath
ofthiscrisishasrevealedthatnotallgovernmentsaredefault-freeeither,(e.g.Greece)they
representtheclosestmatchtoadefaultfreesecurity.Thesecondconditionhighlightsthe
importance ofmatching thematurity of the investment and thematurity of the risk-free
asset.Giventheimplicationsofthesecondcondition,duetothelongtimehorizonofaDCF-
valuation,apracticalcompromiseistomatchthedurationofthecashflowsfromtheriskfree
assetandthecashflowsfromtheDCF-analysis(Damodaran,2012).
Thecurrencyinwhichthefreecashflowsfromtheanalysisareestimatedshoulddetermine
thechoiceofwhichgovernmentratetouse.Thus,the10-yearNorwegianGovernmentzero-
coupon rate is selected to represent the risk-free rate.Thesecuritymatches the required
conditionsandisalsothemostappliedrisk-freerateintheNorwegianmarket(PWC,2015).
Inordertomatchthedatausedinallcostofcapitalestimations,the10-yearrateatthe19th
ofMay2016isused.
Figure16illustratethedevelopmentinthe10yearNorwegianGovernmentBondsince2007
andrevealsthattheNorwegianriskfreeratehasfollowedthegeneraldevelopmentacross
worldmarkets since the financial crisis. The 10-year rate is also closely connected to the
Norwegian key interest rate, who has been lowered several times recent years, and are
predictedtostayatlowlevelsforseveralyearstocome(NorgesBank,2015).Consequently,
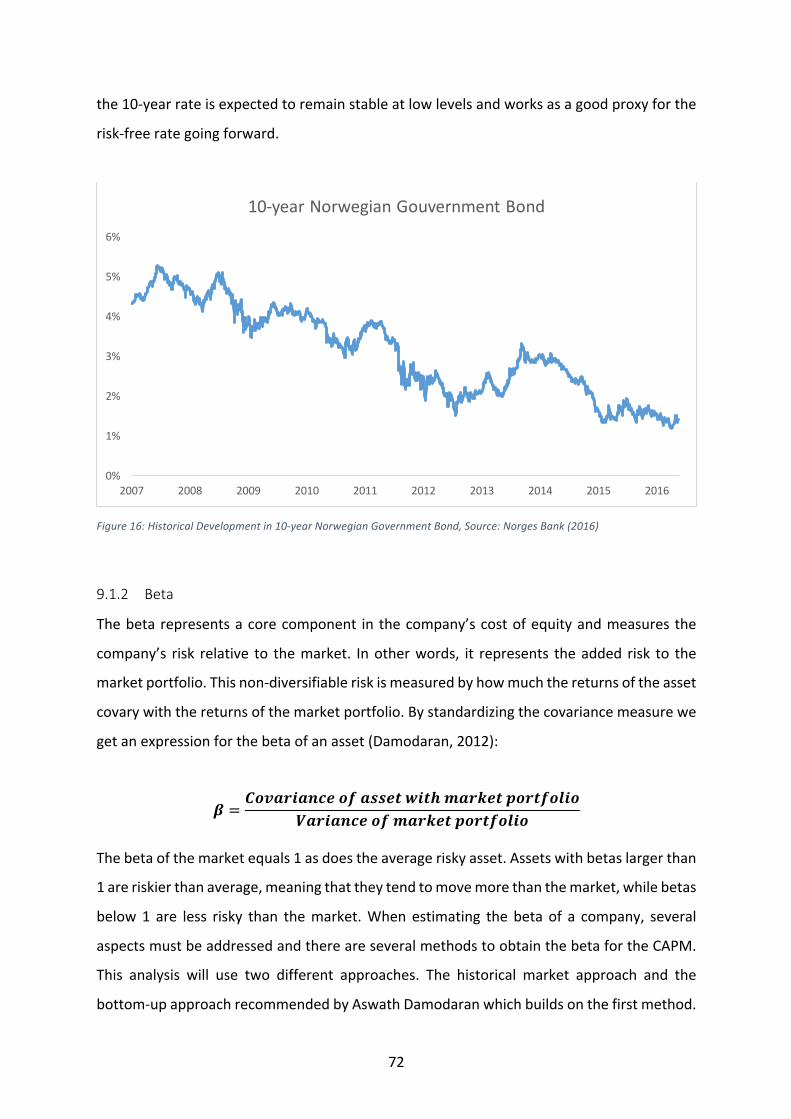
72
the10-yearrateisexpectedtoremainstableatlowlevelsandworksasagoodproxyforthe
risk-freerategoingforward.
Figure16:HistoricalDevelopmentin10-yearNorwegianGovernmentBond,Source:NorgesBank(2016)
9.1.2 Beta
Thebetarepresentsacorecomponent in thecompany’scostofequityandmeasuresthe
company’s risk relative to themarket. Inotherwords, it represents theadded risk to the
marketportfolio.Thisnon-diversifiableriskismeasuredbyhowmuchthereturnsoftheasset
covarywiththereturnsofthemarketportfolio.Bystandardizingthecovariancemeasurewe
getanexpressionforthebetaofanasset(Damodaran,2012):
t =fuvwrxwyzousw{{o|}x|~mwrio|�ur|suÄxu
hwrxwyzousmwrio|�ur|suÄxu
Thebetaofthemarketequals1asdoestheaverageriskyasset.Assetswithbetaslargerthan
1areriskierthanaverage,meaningthattheytendtomovemorethanthemarket,whilebetas
below1 are less risky than themarket.When estimating the beta of a company, several
aspectsmustbeaddressedandthereareseveralmethodstoobtainthebetafortheCAPM.
This analysis will use two different approaches. The historical market approach and the
bottom-upapproachrecommendedbyAswathDamodaranwhichbuildsonthefirstmethod.
0%
1%
2%
3%
4%
5%
6%
2007 2008 2009 2010 2011 2012 2013 2014 2015 2016
10-yearNorwegianGouvernmentBond

73
9.1.2.1 HistoricalMarketBetaThehistoricalmarketbeta is foundthrougharegressionof returnsonthecompanystock
againstreturnsonamarketindex.Threedecisionsareimportantwhenobtainingaregression
beta.The lengthofestimationperiod, thereturn intervalandthechoiceofmarket index.
GiventhatScatecSolaronlyhavebeenlistedsinceOctober2014,theestimationperiodis
limitedtooneyearandsevenmonthsroughly.Consequently,weeklyreturnsarethechosen
interval,inordertoexceedtheminimumrecommended60observations(Koller,Goedhart&
Wessels2015).Usingweeklyreturnscouldleadtosystematicbiases,especiallyifthestockis
rarelytradedandmanyobservationsequalzero.ThisisnotthecaseforScatecSolarsoweekly
returnsshouldyieldbiasedresults.
InCAPMtheory,themarketportfolioconsistsofalltradedanduntradedassets.Inrealitythis
marketportfolioisunobservableandaproxyisnecessary(Koller,Goedhart&Wessels2015).
When selecting a proxy, the characteristics of the company’s shareholders must be
considered.Theobjectiveistofindaproxyrepresentingthemajorityoftheequityinvestors.
Astandardpracticeistousethemarketindexonwhichthestocktrades,yieldingareasonable
measure of risk for domestic investors. If a company has several international investors
however,aninternationalindexwouldbemoreappropriate.Anadditionalissuewithlocal
marketindicesistheirtendencytobeheavilydependentonacertainindustryorcompany,
resulting inbetasunlikely to reflect the truemarket risk.Allmentionedcomplicationsare
relevantwhenestimatingthebetaofScatecSolar.
ListedontheOsloStockExchange(OSE),thestandardmarketportfolioproxyforScatecSolar
investors would be the OSEBX. Considering that all the top five largest investors are
Norwegian companies and that they combined represent 43 % of the total outstanding
shares,usingadomesticindexarejustifiable.Althoughagoodfitforthemajorityofinvestors,
theOSEBXsufferfromthedominationoftheoilindustry.Asaconsequence,estimatingthe
betaof ScatecSolar relative to theOSEBXcould result in simplyobtaining thecompany’s
sensitivitytotheoilindustry.Toexaminethiseffect,thebetawillbeestimatedbothrelative
totheOSEBXandtheS&P500toobtainamoreinternationalriskmeasure.

74
Theresultsoftheregressionbetasarepresentedintable24.Bothbetasarelowerthanone,
aresult inlinewiththegeneralperceptionofthepowerindustrybeinglessriskythanthe
market.TherelativelylowbetatowardstheOSEBXcouldrepresenttheeffectoftheindex
beingverydependenton theoil industryand that theS&P500beta, that is closer to the
averagebeta,wouldbeabettermeasureofrisk.Bothbetasalsohavea lowR-squaredof
around0.10,meaningthatonlyaround10%oftheriskinScatecSolarcomesfrommarket
sources,while90%arefirm-specific.Lastly,thestandarderrorsprovideconfidenceintervals
forthetruevalueofthebetas.Thewiderangeoftheseintervalsindicateanoisyestimation
ofthebetasrelativetobothindices,awell-knownweaknessofregressionbetas(Damodaran,
2012).Koller,Goedhart&Wessels(2015)emphasizethattheobjectivenotnecessarilyisthe
historicalbeta,butratheranestimateofthefuturebeta,foundthroughuseofjudgement
notpurelymechanicalapproaches.Thus,inordertoobtainamorerobustestimationofbeta,
thehistoricalmarketapproachisimprovedwiththebottom-upmethod.
S&P500 OSEBXBeta 0.90 0.63
StandardError 0.28 0.21
R2 0.11 0.10
95%-interval 0.34 1.46 0.21 1.05
Table24:RegressionResults
9.1.2.2 Bottom-upBetasThe bottom-upmethod of obtaining betas are built on regression betas, but lowers the
standard errors by averaging regressionbetas for several comparable firms. This because
stockstendtomovetowardsindustryaverages.Regressionbetasofthepeersareunlevered
toremovethefinancialleverageeffectofthecompanies.Anunleveredbetaisestimatedby:
ÅyÄovorojÇo|w =ÉoÑro{{xuyÇo|w
k + k − |wÖrw|o ∗ g n
Inthenextstep,theaverageunleveredbetaisestimatedandrepresentstheindustryaverage
or business beta. Lastly, the levered beta of Scatec Solar by the bottom-up method is
estimatedbyusingtheleverageratioandthebusinessbeta.Allrequireddataareobtained
fromYahooFinance5andtheresultsarepresentedintable25.
5Weeklydata02/10/14–16/05/16
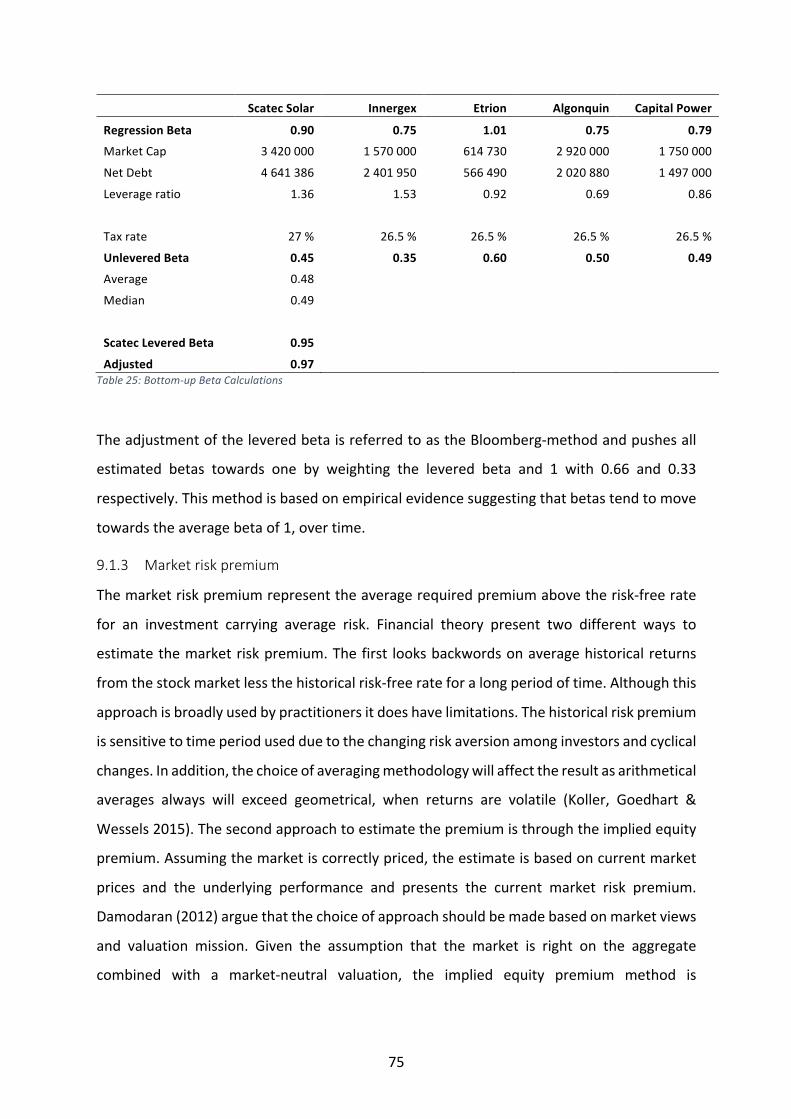
75
ScatecSolar Innergex Etrion Algonquin CapitalPower
RegressionBeta 0.90 0.75 1.01 0.75 0.79MarketCap 3420000 1570000 614730 2920000 1750000
NetDebt 4641386 2401950 566490 2020880 1497000
Leverageratio 1.36 1.53 0.92 0.69 0.86
Taxrate 27% 26.5% 26.5% 26.5% 26.5%
UnleveredBeta 0.45 0.35 0.60 0.50 0.49Average 0.48
Median 0.49
ScatecLeveredBeta 0.95
Adjusted 0.97
Table25:Bottom-upBetaCalculations
TheadjustmentoftheleveredbetaisreferredtoastheBloomberg-methodandpushesall
estimated betas towards one by weighting the levered beta and 1 with 0.66 and 0.33
respectively.Thismethodisbasedonempiricalevidencesuggestingthatbetastendtomove
towardstheaveragebetaof1,overtime.
9.1.3 Marketriskpremium
Themarketriskpremiumrepresenttheaveragerequiredpremiumabovetherisk-freerate
for an investment carrying average risk. Financial theory present two different ways to
estimatethemarketriskpremium.Thefirst looksbackwordsonaveragehistoricalreturns
fromthestockmarketlessthehistoricalrisk-freerateforalongperiodoftime.Althoughthis
approachisbroadlyusedbypractitionersitdoeshavelimitations.Thehistoricalriskpremium
issensitivetotimeperiodusedduetothechangingriskaversionamonginvestorsandcyclical
changes.Inaddition,thechoiceofaveragingmethodologywillaffecttheresultasarithmetical
averages always will exceed geometrical, when returns are volatile (Koller, Goedhart &
Wessels2015).Thesecondapproachtoestimatethepremiumisthroughtheimpliedequity
premium.Assumingthemarketiscorrectlypriced,theestimateisbasedoncurrentmarket
prices and the underlying performance and presents the current market risk premium.
Damodaran(2012)arguethatthechoiceofapproachshouldbemadebasedonmarketviews
and valuation mission. Given the assumption that the market is right on the aggregate
combined with a market-neutral valuation, the implied equity premium method is
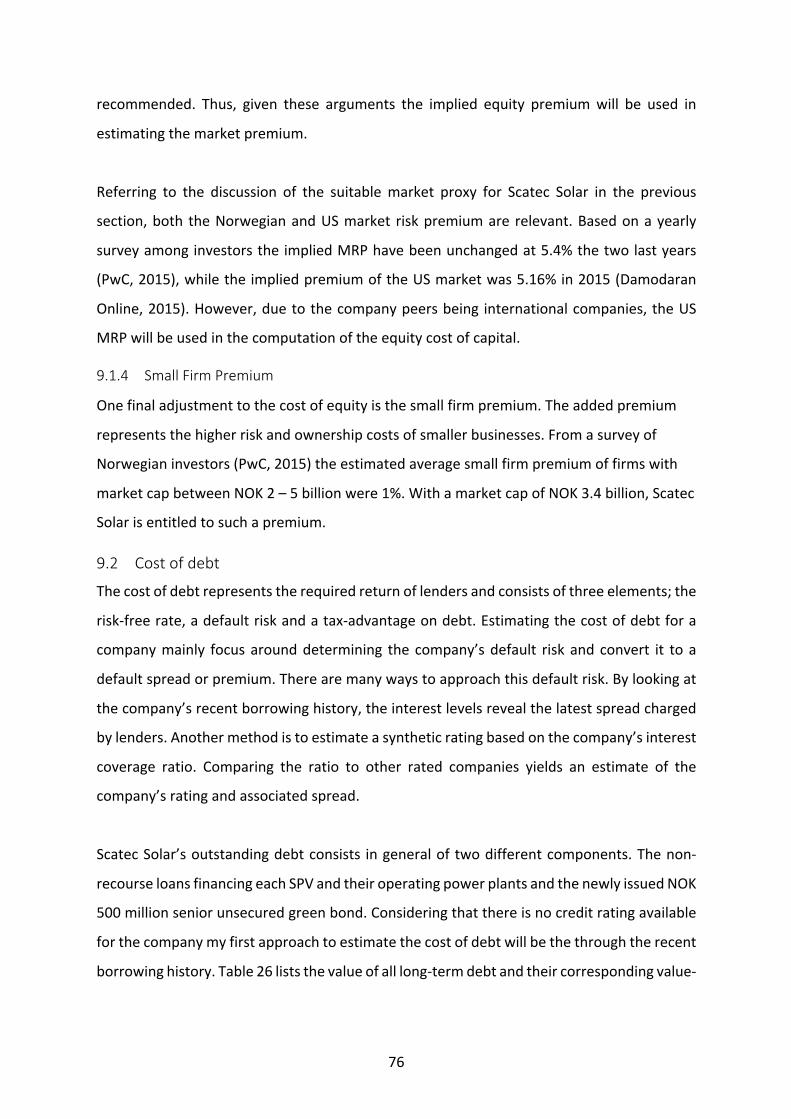
76
recommended. Thus, given these arguments the implied equity premiumwill be used in
estimatingthemarketpremium.
Referring to the discussion of the suitablemarket proxy for Scatec Solar in the previous
section,both theNorwegianandUSmarket riskpremiumare relevant.Basedonayearly
surveyamonginvestorstheimpliedMRPhavebeenunchangedat5.4%thetwolastyears
(PwC,2015),whiletheimpliedpremiumoftheUSmarketwas5.16%in2015(Damodaran
Online,2015).However,duetothecompanypeersbeing internationalcompanies,theUS
MRPwillbeusedinthecomputationoftheequitycostofcapital.
9.1.4 SmallFirmPremium
Onefinaladjustmenttothecostofequityisthesmallfirmpremium.Theaddedpremium
representsthehigherriskandownershipcostsofsmallerbusinesses.Fromasurveyof
Norwegianinvestors(PwC,2015)theestimatedaveragesmallfirmpremiumoffirmswith
marketcapbetweenNOK2–5billionwere1%.WithamarketcapofNOK3.4billion,Scatec
Solarisentitledtosuchapremium.
9.2 Costofdebt
Thecostofdebtrepresentstherequiredreturnoflendersandconsistsofthreeelements;the
risk-freerate,adefaultriskandatax-advantageondebt.Estimatingthecostofdebtfora
companymainly focusarounddetermining the company’sdefault riskandconvert it toa
defaultspreadorpremium.Therearemanywaystoapproachthisdefaultrisk.Bylookingat
thecompany’srecentborrowinghistory,theinterestlevelsrevealthelatestspreadcharged
bylenders.Anothermethodistoestimateasyntheticratingbasedonthecompany’sinterest
coverage ratio. Comparing the ratio to other rated companies yields an estimate of the
company’sratingandassociatedspread.
ScatecSolar’soutstandingdebtconsists ingeneraloftwodifferentcomponents.Thenon-
recourseloansfinancingeachSPVandtheiroperatingpowerplantsandthenewlyissuedNOK
500millionseniorunsecuredgreenbond.Consideringthatthereisnocreditratingavailable
forthecompanymyfirstapproachtoestimatethecostofdebtwillbethethroughtherecent
borrowinghistory.Table26liststhevalueofalllong-termdebtandtheircorrespondingvalue-

77
weightedhistoricalcosts.Basedontherecentborrowinghistory,ScatecSolar’scostofdebt
is8.7%.
Typeofdebt Maturity Interestrate Value2015 Weight Average
Non-recoursefinancialliabilities
Kalkbult 31/12/28 12.30% 916024 16.8% 2.1%
Dreunberg 31/12/29 11.50% 1021370 18.7% 2.1%
Linde 30/06/29 11.52% 511792 9.4% 1.1%
Czech 27/10/28 5.53% 68293 1.2% 0.1%
Czech 23/03/29 5.69% 201336 3.7% 0.2%
Czech 23/02/29 5.53% 60641 1.1% 0.1%
Czech 11/05/29 5.28% 84595 1.5% 0.1%
Rwanda 11/01/30 8.08% 173326 3.2% 0.3%
Utah 31/12/36 5.15% 603117 11.0% 0.6%
Oryx 31/12/36 5.80% 156086 2.9% 0.2%
Anwaralardh 31/12/35 6.03% 341815 6.3% 0.4%
AnwaralAmal 31/12/36 5.79% 176708 3.2% 0.2%
AquaFria 31/12/35 6.31% 651614 11.9% 0.8%
SeniorUnsecuredGreenBond 01/11/18 7.59% 500000 9.1% 0.7%
Totallong-termdebt 5466717 100.0% 8.7%
Table26:RecentBorrowingHistoryCalculation
InlackofacreditratingIhavechosentocomparemyresultsfromthecompany’sborrowing
historywithasyntheticrating.Duetoanegativeinterestcoverageratioin2013asaresultof
atransitionperiod,havechosentobasemysyntheticratingonthetwo-yearaverageratio.
TheratioiscomparedtoDamodaran’slistingofratiosandratingsavailableintheAppendix3
and is given a B- rating. Considering the longmaturity of themajority debt the 10-year
Norwegiantreasuryisusedastherisk-freerateandaddingthedefaultspreadyieldsacostof
debtof8.97%asshowninTable27.

78
SyntheticRating
Two-yearAverageInterestCoverage 1.7
SyntheticratingbyDamodaran B-
SpreadaddedforB- 7.50%
10-yearNorwegianTreasuryBond 1.47%
CostofDebt 8.97%
Table27:SyntheticCostofDebtCalculation
With90%ofthetotallong-termdebtbeingnon-recoursefinancingwithmaturitiesexceeding
10yearstherecentborrowingrateslookstobethebestestimateforthecompany’scostof
debt,ameasuresupportedbythesyntheticratingapproach.However,itisworthtomention
thatthelatestfinancingofnewsolarplantshasbeenlowerthantheweightedaverage,which
isbeingdominatedbylargeloansontheoldestplants.Giventhedevelopmentoftheindustry
towardsasubstantialroleintheworldpowermarket,thecostoffinancingissettodecrease,
atrendpossiblyalreadyobservedinthecompany’sborrowinghistory.Ontheotherhand,the
recently issuedgreenbondhasacalculatedYTMof8.3%which indicates that thedefault
spreadofthecompanyiscurrentlywellillustratedthroughtheirrecentborrowinghistory.
9.2.1 Tax
Athirdandessentialelementofthecostofdebtistheadvantagefromtax-deductibleinterest
payments.Theestimatedfreecashflowsareindependentofsourceoffinancingandleaves
outthe interestpaymentsandtax-shieldswhichthenhavetobe incorporatedthroughan
after-taxcostofdebt.Animportantconditionofbenefitingfromtax-shieldsistohavetaxable
profits.
Whichtaxrateusedtoestimatethetax-shieldisnotcompletelyclear.Thereareseveralrates
available.Consideringthatinterestexpensessavesthecompanytaxesonthelastdollarof
income,themostapplicablerateisthemarginaltaxrate(Damodaran,2012).Thefactthat
ScatecSolaroperatesincountriesacrosstheworlddoesfurthercomplicatethings,aseach
country has its own tax rate. With revenues generated globally there are two different
approachesavailable.Eitherassumethatall incomegeneratedeventuallywillbegatherin
thehomecountryofthecompanyandtaxedatitsmarginalrateorcalculatetherevenue-
weightedaverageofallrelevanttaxrates.Basedonthefirstapproachthemarginaltaxrate
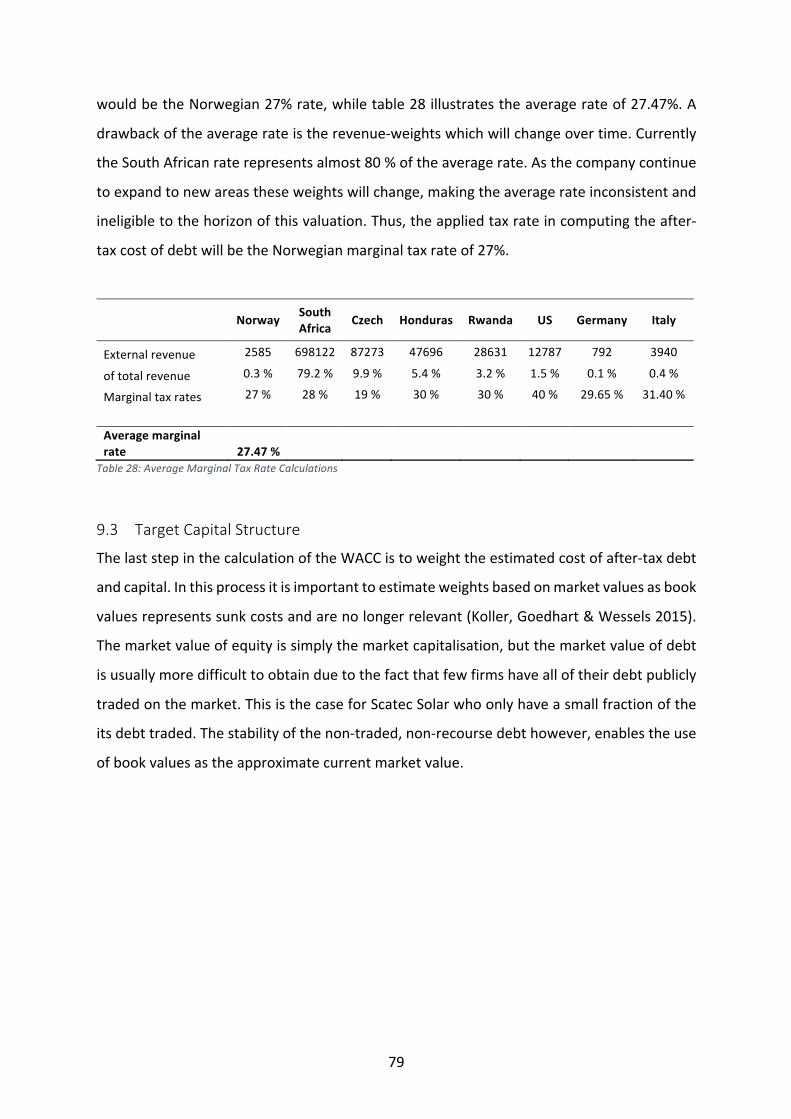
79
wouldbetheNorwegian27%rate,whiletable28 illustratestheaveragerateof27.47%.A
drawbackoftheaveragerateistherevenue-weightswhichwillchangeovertime.Currently
theSouthAfricanraterepresentsalmost80%oftheaveragerate.Asthecompanycontinue
toexpandtonewareastheseweightswillchange,makingtheaveragerateinconsistentand
ineligibletothehorizonofthisvaluation.Thus,theappliedtaxrateincomputingtheafter-
taxcostofdebtwillbetheNorwegianmarginaltaxrateof27%.
Norway South
Africa Czech Honduras Rwanda US Germany Italy
Externalrevenue 2585 698122 87273 47696 28631 12787 792 3940
oftotalrevenue 0.3% 79.2% 9.9% 5.4% 3.2% 1.5% 0.1% 0.4%
Marginaltaxrates 27% 28% 19% 30% 30% 40% 29.65% 31.40%
Averagemarginalrate 27.47%
Table28:AverageMarginalTaxRateCalculations
9.3 TargetCapitalStructure
ThelaststepinthecalculationoftheWACCistoweighttheestimatedcostofafter-taxdebt
andcapital.Inthisprocessitisimportanttoestimateweightsbasedonmarketvaluesasbook
valuesrepresentssunkcostsandarenolongerrelevant(Koller,Goedhart&Wessels2015).
Themarketvalueofequityissimplythemarketcapitalisation,butthemarketvalueofdebt
isusuallymoredifficulttoobtainduetothefactthatfewfirmshavealloftheirdebtpublicly
tradedonthemarket.ThisisthecaseforScatecSolarwhoonlyhaveasmallfractionofthe
itsdebttraded.Thestabilityofthenon-traded,non-recoursedebthowever,enablestheuse
ofbookvaluesastheapproximatecurrentmarketvalue.

80
Ratherthancurrentweights,thecostofcapitalshouldrelyontargetweightsrepresenting
theexpectedlevelthroughoutthelifeofthecompany.Iteliminatestheriskthatthecurrent
structure could be reflecting a short-term deviation in the stock price. No such signs are
noticed for Scatec Solar and todays levels, presented in table 29, represent the expected
futurestructureofnewsolarprojects.
TotalInterest-bearingdebt 5466717 Shareprice 37
Excesscash -651359 Outstandingshares 93816
NetDebt 4815358 Equity 3471201
Weight 58.11% Weight 41.89%Table29:TargetCapitalStructure,(Source:AnnualReport2015)
9.4 Results
CostofEquity WACC Risk-freerate 1.41% CostofDebt 8.70%
MarketPremium 5.14% CostofEquity 7.39%
Beta 0.97 TaxRate 27%
SmallFirmPremium 1% DebtRatio 58.11%
EquityRatio 41.89%
CAPM 7.39% WACC 6.79%
Table30:CostofCapitalCalculation

81
10 FreeCashFlowtoFirm–Valuation
ThroughtheprocessofthisfundamentalvaluationofScatecSolar,bothastrategicanalysis
anda thoroughassessmentof the industrydevelopmenthaveprovidedkey inputs to the
assumptions of key value drivers of the company. Further, an analysis of recent years’
financialstatementsandfuturestrategictargetshavemadethebasisforthenormalisation
requiredinordertoestimatetheexpectedcashflowsofScatecSolar’soperations.Lastly,the
company’sweightedaveragecostofcapitalhasbeencalculatedtoprovidethediscountrate
oftheDCF-model.Thissectionwillpresenttheforecastingoperationalincomeandfreecash
flowtofirmandcarryoutthefinalvaluationoftheScatecSolarstockpriceusingafreecash
flowtofirmDCF-modelintroducedinchapter4.
Table31and32revealsthefinalfreecashflowtofirm(FCFF)forthetwofirststagesofthe
DCF-model,computedasdescribedinchapter4.Forfulloperationalincomestatementsee
appendix1.Thefreecashflowspresentedemphasizestheneedforamulti-stageDCF-model.
ScatecSolar isstillexpandingtheirpositioninanemergingindustrycharacterisedbylarge
upfrontinvestments.Theresultisnegativecashflowstothefirminthefirstfiveyearsofhigh
growth,asinvestmentneedsinCAPEXandoperatingworkingcapitalexceedsthegrosscash
flow from operations. As the company establishes and the growth matures, previous
investmentswillgeneratesolidgrosscashflowsexceedingnewinvestments.
NOKThousand 2016 2017 2018 2019 2020
EBIT 496963 639490 923927 988828 1810093
Tax 134180 172662 249460 266984 488725
Depreciation 286890 373733 504614 609627 695930
GrossCashFlow 649673 840561 1179081 1331472 2017298
ChangeinOperatingWC -291692 -527737 -1299591 -571374 -1211504
InvestmentsinPPE -1865850 -4184924 -3504997 -3075420 -2302726
FreeCashFlowtoFirm -1507869 -3872100 -3625507 -2315323 -1496932Table31:Stage1FreeCashFlowtoFirm

82
NOKThousand 2021 2022 2023 2024 2025
EBIT 1989319 2203534 2421453 2643102 2868130
Tax 537116 594954 653792 713638 774395
Depreciation 752168 775223 796484 816032 834336
GrossCashFlow 2204370 2383803 2564145 2745497 2928070
ChangeinOperatingWC -378874 -536454 -149175 -289593 -168964
InvestmentsinPPE -1410889 -1382672 -1355018 -1338984 -834336
FreeCashFlowtoFirm 414607 464677 1059951 1116920 1924771
Table32:Stage2FreeCashFlowtoFirm
ProvidedwiththeforecastedFCFFFthenextstepinthevaluationprocess istoestimatea
terminalvalue for the final thirdstageof themodelandestimatethepresentvalueofall
forecasted cash flowsusing theWACC. Theassumed third-stage long-termgrowth rate is
2.02%andrepresentsthevalue-weightedyearlyinflationadjustmentsbasedoneachsolar
plantspartoftotalrevenues.Table33presentstheestimatedterminalvalueandenterprise
value,thesumofalldiscountedFCFFs.Movingtowardsthefinalestimatedsharepricethe
netdebtobligationsandvalueofnon-controllinginterestsaredeductedtoreachthetotal
shareholderequity.
Thehighvalueofnon-controllinginterestsstemsfromthedividedownershipofthedifferent
projectcompanies(SPVs)owningeachsolarplant.Intheconsolidatedfinancialstatements
all SPVs are registered ass fully owned subsidiaries,while the co-investors shareof these
subsidiaries arepresented asnon-controlling interests in theequity statement. There are
different ways of adjusting for these claims on the total equity. Considering the lack of
sufficientinformationtovalueeachprivatesubsidiaryseparately,anaveragenon-controlling
share is estimated and deducted from total equity. Scatec Solar has different shares of
ownershipacrossalloperatingplants.Somearefullyownedwhileotherownershipsareas
low as 40%. The average co-investor ownership across all projects in operation, under
construction and in backlog are 43%. Considering that thismeasureboth covers existing
plantsandfutureprojectsitisassumedtoreflecttheratiorepresentativefortheentiretime-
periodof theDCF-model. Inaddition, it isnearly identical to thebook-value ratioofnon-
controllinginterestsovertotalequity.Thevalueofnon-controllinginterestsisestimated:
Üuy − zuy|ruÄÄxyÑáy|oro{|{ = nh − Üo|goà| ∗ evorwÑoyuy − zuy|ruÄÄxyÑu}yor{~x�

83
NOKThousand 2016 2017 2018 … 2025FreeCashFlowto
Firm -1507869 -3872100 -3625507 … 1924771
TerminalValue … 41144077
Total -1507869 -3872100 -3625507 … 43068848
DiscountFactor 0.937 0.877 0.822 … 0.520
EnterpriseValue 13561245 NetDebt -4815358 MinorityInterests -3735743 ShareholderEquity 5010144 OutstandingShares 93816 SharePrice 53
Table33:CalculationofFinalPriceperShare
Adjustedfornetdebtandnon-controllingintereststheremainingvaluerepresentthetotal
shareholderequity.Dividingthismeasurebythenumberofoutstandingsharerevealsthe
resultofthevaluation.ConductingafundamentalanalysisofScatecSolarthroughathree-
stageFCFFDCF-analysisyieldsapricepershareofNOK53.Aresultinlinewiththemedian
analystestimateofNOK56pershare(DagensNæringsliv,2016)statingthatthecompanyis
undervaluedatthecurrentsharepriceofNOK40(June9,2016).
Analysingthefinalresultsofthevaluation,someaspectsareimportanttohighlight.Firstly,
duetothehighinvestmentstofacilitategrowth,alloftheenterprisevalueiscreatedinthe
twolaststagesofthemodel.Thefurtherforwardpositivecashflowsappearinthemodel;
themoreuncertaintyareattachedtothefinalmeasure.Consequently,smalladjustmentsto
theinputsofthemodelwillhavesubstantialimpactontheresult.Toassessthisuncertainty
intheresultasensitivityanalysiswillbeperformedinchapter12.
Thesecond importantaspectof thisvaluationcase isalsoconnectedtothenegativecash
flowsofthefirststage.Negativecashflowsfromoperationssymbolisethatthecompanyare
dependentonnewcashtofinancefurtheroperationsascurrentcashfromoperationsnotare
sufficient.Consideringthescaleoftheinvestments,ScatecSolar’scurrentfreecashholding
are not enough to cover these either. In other words, the company is dependent on
84
considerablefinancinginordertocarryouttheircurrentgrowthprospects.Thisisonceagain
relatedtotheprojectfinancingofthesolarprojects.ThecurrentstructureoftheseSPVsand
future SPVs connected to the projects under construction and in backlog consists
approximatelyof75%debtand25%equitysplitbetweenScatecSolarandco-investors.Inthe
strategicanalysisahighlightedstrengthofScatecSolarwastheirsolidtrackrecordofraising
non-recoursefinancingfornewprojectsthroughmultilateraldevelopmentbanksandstrong
partnershipsagreementswithNORFUNDand IFC,providing long-termcapital.Considering
thesestrengths,thecompanyisassumedtobecapableofraisingtherequiredfundstocarry
outtheirgrowthstrategy.

85
11 TheMarketBasedApproach
HavingcarriedoutafundamentalvaluationanalysingtheintrinsicvalueofScatecSolar,the
followingsectionseeksto increasetherobustnessof theresultbycomparingthe intrinsic
value tomarket values, as discussed in chapter 4.Themarket pricemeasured through a
relativevaluationaremorelikelytoreflectthecurrentmarketperceptionofinvestorsand
wouldthusprovideusefulinputtoevaluatetheresultsfromthefundamentalvaluation.In
ordertocomputearelativevaluationtwocomponentsmustbedetermined.Firstly,market
priceshavetobestandardizedintomultiplesandsecondlycomparablecompanypeersmust
befound.
There are several multiples available in relative valuation but the most commonly used
measuresareearningsmultiples(Damodaran,2012).Further,consideringthefreecashflow
tofirmDCF-approach,thefirmvalueearningsmultipleenterprisevaluetoEBITDAischosen.
This measure both eliminates differences in depreciation methods and level of financial
leverage across the peers. In addition, as multiples cannot have a negative value the
EV/EBITDAmultiplealsosuitsawidernumberofpeersthanotherearningsmultiples,likethe
price-earnings ratio, given that fever firms have negative EBITDA than negative earnings.
Basedonthisthemultipleismostwidelyusedincapitalintensivefirms(Damodaran,2012)
andisthusagoodfitfortheutility-scalesolarindustry.
Obtainingcomparablecompanies toScatecSolar isnot straight forward.Asan integrated
independentsolarpowerproducer(IPP)thecompanyoperatesacrossseveralsegmentsand
therearenotmanyothercompaniesofferingasimilarrangeofservices.Nevertheless,the
mostcomparablecompaniesavailableisassumedtobeAlgonquinPower&Utilities,Innergex
RenewableEnergy,EtrionCorporationandCapitalPowerCorporation.EtrionCorporationis
theonlypuresolarPVcompany,while InnergexandCapitalpoweralsooperates inother
renewableenergy-industries.Allthreecompaniesdevelop,ownandoperatethesolarplants
likeScatecSolar.Thefourthandlastcompany,Algonquin,doesnotdevelopplantsbutisa
purerenewablepowerproducer.

86
The relative valuation analysis is based on current trading multiples of the companies
obtainedfromYahooFinance(2016)andpresentedintable34.ComparedtoitspeersScatec
Solar is trading at low levels both below the average andmedian EV/EBITDA. This result
supportsthefundamentalvaluationstatingthatthecompanyisundervalued.Estimatingthe
impliedsharepricefromtheaveragetradingEV/EBITDAofpeersyieldsasharepriceofNOK
48forScatecSolar,inlinewiththeresultsoftheDCF-valuation.
ScatecMarket Innergex EtrionSEK Algonquin CapitalPowerEV NOK7970000 CAD3970000 SEK1170000 CAD4970000 CAD3260000
EBITDA NOK672430 CAD188790 SEK29320 CAD366560 CAD421000
EV/EBITDA 11.85 21.03 39.90 13.56 7.74
Average 18.82
Median 13.56
EV 12653472
NetDebt -4815358
MinorityInterests -3347994
Shareholder
Equity 4490119
Outstanding
Shares 93816
SharePrice 48
Table34:ValuationbyEV/EBITDAMultiples
11.1 ValuationSummary
Summingup,thetwovaluationapproachesyieldssimilarresults.Both intrinsicvaluesand
marketpricesindicatethattheScatecSolarstockiscurrentlyundervalued.However,both
estimatescontainconsiderableamountsofuncertainty.Especiallyintheresultsofthemarket
basedapproachconsideringtheweaknessoffewdirectlycomparablefirms.Withonlyoneof
fourpeersoperatingasapureindependentsolarpowerproducer,themarketpricesused
mustbeanalysedwithsomecautionastheyarenotlikelytocompletelyreflectthemarket
perception of utility-scale solar power. Hence, in the final conclusion of the results, the
fundamentalanalysisofthecompanywillbegivenmoreweightthantherelativevaluation.

87
12 SensitivityAnalysis&RiskFactorsAsdescribedinchapter3andcommentedintheresultsofthefundamentalvaluation,the
estimationofacompany’sintrinsicvaluerequiresseveralassumptionsofboththeindustry
andcompanyfutureperformanceanddevelopment. Inordertoassessthelevelof impact
theseassumptionshaveontheestimatedsharpepriceofScatecSolar,asensitivityanalysis
willbeconducted.Theimpactwillbemeasuredbythechangesintheestimatedstockprice
givendifferentlevelsoftwokeyvariablesinthevaluationmodel.Furthermore,thischapter
willhighlightkeyriskfactorsthatcouldaffectthefuturedevelopmentofScatecSolarand
consequentlyitsvalue.
12.1 SensitivityThetwofirstkeyvariablesaddressedaretheweightedaveragecostofcapital(WACC)and
thelong-termgrowthlevelexpectedinthethirdandfinalstage.Secondly,theeffectonshare
priceofchangingtheassumptionsregardingtheexpectedinstalledcapacityandpowerprices
ofthesecondstageinthemodelwillbeassessed.
12.1.1 CostofCapital&TerminalGrowthRate
The evaluation of the estimated enterprise value in the valuation section highlighted the
domination of the terminal value in this final figure. Given the estimated stock price’
dependenceonthisdominatingmeasureitssensitivitytochangesintheWACCandgrowth
rateareassessedintable35.
Thetableillustratehowimportanttheassumptionsofthelong-termgrowthratearetothe
finalstockprice,rangingfrombelowNOK40toaboveNOK60pershare.Representingonly
theweightedaverage inflationadjustmentstorunningPPAsthechosen long-termgrowth
rate must be considered a fairly conservative measure. However, a reduction of 0.4
WACC
6.40% 6.60% 6.76% 7% 7.20%
Long-termGrowth
1.60% 56.0 48.3 42.7 34.9 28.9
1.80% 62.1 53.8 47.8 39.4 33.1
2.02% 69.4 60.4 53.8 44.8 38.0
2.20% 76.0 66.3 59.3 49.6 42.4
2.40% 83.9 73.5 65.8 55.4 47.6
Table35:StockPriceSensitivitytoWACCandLong-termGrowthRate

88
percentagepointsonthismeasurewouldstillyieldastockpricematchingthecurrentmarket
price.Consequently,thisanalysishighlightsthelargeupsidepotentialofthecompanywith
justsmalladjustmentstofuturegrowth.
Analysingtheimpactofthecostofcapitalisalsointerestingconsideringthatthereareaspects
inboththemarketandthecompanywhichcouldaffectthefuturecostofcapital.Historically
lowinterest levelshavecharacterisedtheworldmarketseversincethefinancialcrisisand
affects both the interest levels and the CAPM estimates. In addition, a young and rapid
growingindustrylikesolarPVmightattracthigherpremiumsondebtandcapitalastherestill
arealotofuncertainty,especiallyleadingtohighercostofdebt.Boththeseabnormalities
areexpectedtostaystableforalongtime,though,buttheresultsofthesensitivityanalysis
reveals howa lowerWACCwouldbump theestimated shareprice significantly. Likewise,
higherrisk-freeratescouldmakelargenegativeimpactsaswell.Noticeably,a0.4percentage
pointsincreaseintheWACCwouldstilljustbringtheexpectedsharepricedowntocurrent
marketpricelevels.Thus,therewouldstillbeupsidepotentialtothestockdespiteanincrease
intheWACC.Matchingtheresultsofthelong-termgrowthsensitivity.
12.1.2 StabilizingGrowthStageAssumptions
Thenecessityofasensitivityanalysisincreasebythelevelofuncertaintyconnectedtothe
assumptions. Following behind the third-stage terminal value assessed in the previous
section,isthegrowthstabilizingsecondstageoftheDCF-model.Comparedtotherelatively
certain,companydistributedinputsinthefirstgrowthstage,thesecondstageismorebuild
on crucial assumptions regarding new capacity and power prices. As a consequence, this
sectionwillanalysethechangesinestimatedsharepricegivenotherinputsofaddedcapacity
inthe2021-2025periodanditsassociatedpowerprices.
MWadded2021-2020
53.8 400 500 600 700 800
1000NOK/MWh
0.8 30.4 37.1 43.8 50.5 57.2
0.9 33.8 41.3 48.8 56.4 63.9
1.0 37.1 45.5 53.8 62.2 70.6
1.2 43.8 53.8 63.9 73.9 84.0
1.4 50.5 62.2 73.9 85.6 97.4
Table36:StockPriceSensitivitytoChangesinStage2Inputs

89
Table36presentstheresultsofchangingtheinstalledcapacityandpowerprices.Assessing
thesensitivitytothelevelofaddedcapacity,thecompanyisnotdependentonreaching600
MWintheperiodinordertostillexceedcurrentmarketprices.Areductionofa100MW
wouldstillprovideupsidewhileaninstalmentofonly400MWwouldmatchcurrentprices.
Notsurprisingly,morecapacityinstalledthanassumedwouldprovideasubstantialincrease
inestimatedsharepricetowardsNOK70pershare.Inlightoftheveryoptimisticoutlookfor
solarpowerpresentedintheindustryanalysis,andthestrongindependentpowerproducer
structureofScatecSolar,theexpectedaddedcapacityof600MWisalsoafairlyconservative
assumptionlikethelong-termgrowthlevelsofthethirdstage.Asensitivityanalysisprovides
insightinthepotentialvalueincreaseofmoreaddedcapacity.
FuturepricelevelsofPPAsandFiTsfornewprojectshavebeendiscussedbothintheindustry
analysisandinthedriverassumptions.Indicatorspointtowardspricesbelowtodayslevels,
butitisveryuncertainhowlowtheywillgo.Withintherangeof600NOK/MWhtheestimated
stock price moves from NOK 40 to 70 per share and illustrate the large impact of this
assumption.Althoughuncertain, thefutureprice level isvery likely intherangeof800to
1200NOK/MWhforthisnewcapacity.Consequently,theestimatedstockpricewouldbein
the interval of NOK 45 to NOK 60 per share, representing a very likely upside potential
consideringthepriceassumption.
12.1.3 ConclusionSensitivity
Summingup,thereareinterestingfindingsfrombothsensitivityanalyses.Theresultsreveal
how sensitive the final estimated stock price is to changes in the key variables and
consequentlythelevelofuncertaintyinthefinalresults.However,acommonfeatureofboth
analysesisthestrongprobabilityofupside.Evenwithlowerlevelsofthecriticalassumptions
usedintheoriginalvaluation,thefinalstockpricestillexceedsthecurrentmarketpriceinthe
majorityof thedifferent assumption levels. In addition, the current assumptionsmustbe
regardedas fairlyconservativemeasures.Concluding, the final resultsof the fundamental
valuationdoescontainlargeuncertainty,butthereisconsiderablylessuncertaintyconnected
tothestatedupsidepotentialofthecompanystockprice.

90
12.2 RiskFactorsThesensitivityanalysisrevealedthesubstantialimpactofchangesinassumptionsandinputs
oftheDCF-model.Inordertofurtherevaluatetheresults,thissectionfocusonanassessment
ofcriticaloperationalandfinancialriskfactorsfacingScatecSolarbothtodayandinthefuture
developmentofthebusiness.
12.2.1 CountryRisk
TheSWOT-analysisofchapter6.2highlightedtheweaknessofScatecSolar’slargeshareof
operations inhigh-risk countries.Of total expected revenues in year2025, around96% is
generatedfromcountriesclassifiedas4orhigherintheOECDcountryriskcategories.There
areseveralwaystoaccountforcountryrisk.BekaertandHodrick(2013)distinguishbetween
twoapproaches,adiscount rateadjustmentoradjustingexpectedcash flows.Due to the
geographical spreadofoperations, estimatingadjusted cash flows forevery country is an
extensive task and increases the estimation error considerably. Similar issues arisewhen
incorporating numerous different country premiums into the cost of capital. Thus, the
countryriskexposurehasnotbeenconsideredneitherwhencomputingexpectedcashflows
or in the calculation of cost of capital. The risk is still relevant nevertheless andmust be
emphasizedwhenevaluatingtheresults.Althoughthegeneraloperationofasolarplantis
predictable for long timeperiods, the impact of violatedPPAs, transfer and convertibility
issuesorforcemajeurecouldcausedetrimentaleffectsonthecompanyvalue.
12.2.2 Componentavailability
FurtherriskswhichmayaffectfutureoperationsandvalueofScatecSolar isthesupplyof
solarequipment.ThecompanyvaluechaindoesnotincludeitsownPV-moduleproduction
orotherrequiredequipment.Asdocumentedinthestrategicanalysis,historyhaveillustrated
howshortageamongsupplierscanaffectpriceandthustheprofitabilityofthecompany.With
severalcomponentsmakinguptherequiredequipmentforautility-scalesolarplantthere
aremanyfactorsthatcouldaffecttheavailabilityofcomponentsandtotalCAPEXoffuture
projects.Thescenarioofshortageincomponentavailabilitywouldaffecttheprofitabilityof
newprojectsandhalter thetargetedgrowthof thecompanyandconsequentlyaffect the
estimatedvalue.

91
12.2.3 ProjectAvailability
WiththeestimatedvalueofScatecSolarbeinghighlydependentonfuturegrowthininstalled
capacityasdescribedinchapter8,theexpectedavailabilityofnewprojectsisacrucialfactor.
The company provide an informative presentation of future projects, divided in backlog,
pipeline and opportunities. With 90% chance of realization the backlog projects are
consideredapproximatelyrisk-free.Thepipelineandopportunityprojectsontheotherhand,
containmuchmoreuncertainty,from50%chanceofrealisationandlower.Ofallexpected
installed capacity in 2025, these two categoriesmake up 58%. Failing to carry out these
investmentswillhavesevereeffectsonthecompanyvalueandrepresentasignificantrisk
factorinfutureoperationsofthefirm.Theprojectavailabilityistoalargeextentdependent
on governmental initiatives and the competitiveness of solar power. As covered in the
industryanalysisbothaspectsaresettocontinueitsrecentdevelopmentandScatecSolaris
positionedtoholdtheirpositionasarapidlygrowingfirminthisenvironment.Consequently,
theriskoffallingprojectavailabilityisnotconsideredtoostrong.
12.2.4 FinancialRisks
Lastly,thefinalestimatedvalueandfutureoperationsofScatecSolarareexposedtofinancial
riskscoveringinterestraterisk,currencyriskandcreditrisk.Thecurrencyriskrepresentsthe
most exposed area financial risks. Due to large non-controlling interests in the project
companies,thesedonothedgeNOK-positionsversustheiroperatingcashflowcurrencyas
mentionedinchapter8.2.Consequently,alargedepreciationoftheNOKagainstallexposed
currencieswouldhaveaseriousimpactonthecashflowstoequityholders.Thenumberof
differentcurrenciesarehoweverexpectedtomitigatethisriskexposure,hencethefocuson
NOKrevenuesinthevaluation.Further,thecompany’sinterestrateriskisconnectedtoafew
non-recourseloansnotrunningonfixedinterestpaymentsinSouthAfrica.Thisriskishedged
throughderivativesswappingfloutingtofixedrates.Inaddition,theNOK500milliongroup
financingbondrunsatanunhedgedfloatingNIBOR+6.5%rate.Finally,thecreditriskmainly
arisesfromthethird-partyriskcoveredinthecountryrisksection.Summingupthefinancial
riskswithpotentialimpactonthefutureperformanceandvalueofScatecSolar,thecurrency
riskstandsoutasthemostinfluentialriskasthetwolatterrisksaremorehedged.Intheworst
casescenario,asignificantweakeningoftheNOKcombinedwithraisinginterestratesand
defaultingthird-partiescouldbringseverefinancialissuesforScatecSolar.

92
13 ConclusionThroughthisthesismyobjectivehasbeentostudyandestimatethefairvaluepershareof
ScatecSolarASA.Thebasisforthecalculationsofequityvaluehasbeentheweightedaverage
costofcapitalmethod.TosupporttheestimatedfundamentalvalueoftheWACC,arelative
valuation, based on multiples, have further been applied. However only limited to a
EV/EBITDAapproachduetoalownumberofdirectlycomparablefirms.Additionally,inorder
tomakethebestpossibleassumptionscarryingoutthevaluation,Ihaveassessedrecentand
futuredevelopmentinthesolarpowerindustryanditscompetitivestructure.Followedbyan
analysisofScatecSolar’scurrentstrategicpositionandfutureprospects,andareviewofthe
company’s historical and expected performance. Combined, these analyses provide the
foundationofthecompany’sforecastedfutureperformanceandfundamentalvalue.
Analysingrecentyears’developmentandfutureoutlookforthesolarpowerindustryreveals
Scatec Solar is operating in a rapidly growing industrywith several attractive aspects and
opportunities.Firstandforemost,decreasinglevelsofcapitalexpendituresperMWinstalled
arecontinuingtoincreasethecompetitivenessofsolaragainstother,bothrenewableand
conventional,energysources.Increasedcompetitivenesshasfurtherglobalizedtheindustry
and opened up new possibilities for independent solar power producers, especially in
emerging markets. The result is in an incredible growth in total installed MW capacity,
expectedtocontinueforyearstocome.Additionally,governmentpoliciesprovidenecessary
support mechanisms in terms of feed-in-tariffs and tax incentives to developers and
producers, improving the bankability of their projects. Lastly, a review of the general
renewableenergyindustry’sresiliencetowardspricesonfossilfuelledconventionalenergy
supportthesolarenergyindustryasathelong-termsustainableandpromisingsector.
ThecompetitivestructureinwhichScatecSolaroperatesischaracterizedbyastrongrivalry
amongexistingcompetitorsastheyallseektotakepartinthedevelopmentoftheindustry.
Anumerousamountofbothrenewableandconventionalsubstitutesforsolarpowerfurther
increasethisrivalry.Additionally,thelargenumberofdevelopers,increasethepowerofthe
off-takers,usuallystate-ownedutilities.Consequently,theypressureproducersonpriceand

93
lowers themargins.On theotherhand,a fragmentedsuppliersmarketand relatively low
threatsofnewentrantsdonotputanyconsiderableconstraintsonprofits.
A longexperience inthesolar industryand its integrated“one-stop-shop”businessmodel
giveScatecSolarastrongstrategicpositionintheindustry.Combinedwithafocusonthe
growingemergingmarketsitprovidesasolidfoundationfortheirtargetedcontinuedgrowth.
Furthermore, economic growth and increased global access to electricity initiatives
representsapromisingoutlook for cleanenergyandalongwith improvedenergy storage
technologies they represent great opportunities for Scatec Solar. However, a highlighted
weakness of their operations is the extensive exposure to high-risk countries. This
vulnerability tonon-operational factorscouldpotentiallybecrucial to thecompany’scash
flows. Lastly, history also reveals the large impact of retroactive or failing support
mechanisms.
Summedup,ScatecSolarisagrowingcompanywellpositionedtocontinueitsdevelopment
inanemergingandprosperousindustry.Theresultsofthefundamentalvaluation,yieldinga
∼30%upsidefromthecurrentshareprice,dohoweverindicatethatthefinancialmarketdoes
not share the optimism to the same extent. A relative valuation approach supports the
intrinsicvalue,butisfurtherlessemphasizedduetothelimitationsmentioned.Withsucha
significantestimatedupside,itisimportanttohighlightthenumerousassumptionsonwhich
theresultsdepend.Especiallyregardingtheassumedfinancingoftheextensivegrowthofthe
nextfiveyears.Thesensitivityanalysisillustratesthesubstantialimpactsofsmallchangesin
keyvariablesincostofcapital,PPAlevelsandgrowth.Ontheotherhand,italsorevealsthat
withevenlowercriticalassumptionsthemodelwouldstillyieldapremiumoverthecurrent
shareprice.Inanadditionalefforttoevaluatemyresults,differentoperationalandfinancial
risk factorshavebeendetermined.Asahighgrowth company several risksmaybemore
emphasizedbyinvestorsthanintheappliedmodel.Comparedtothemediantargetpriceof
analysts, my results do however look to be on point. Further considering the relatively
conservative assumptions of the analysis, a target price of NOK 53 per share ismy final
conclusion,statingthattheScatecSolarsharecurrentlyholdsalargeupsidepotential.

94
14 References
Apricum(2015)Apricum’sglobalPV’s5yearoutlook-strongcontinuedgrowth.Availableat:http://www.apricum-group.com/global-pvs-five-year-outlook-going-from-strength-to-
strength/
Bekaert,G.J.andHodrick,R.J.(2013)InternationalFinancialManagement.2ndedn.Edingburgh:PearsonEducationLimited.
Berk,J.andDeMarzo,P.(2014)Corporatefinance.3rdedn.Harlow:Pearson/Education.
BNEF(2015)BloombergNewEnergyFinance2015PVMarketOutlook.BloombergNew
EnergyFinance.
Brealey,R.A.,Myers,S.C.andAllen,F.(2014)Principlesofcorporatefinance.11thedn.NewYork,NY:McGrawHillHigherEducation.
Climatescope(2015)Mozambique—Climatescope2015.Availableat:http://global-climatescope.org/en/country/mozambique/#/details
Climatefocus(2015)TheParisAgreementSummary.Availableat:http://www.climatefocus.com/sites/default/files/20151228%20COP%2021%20briefing%20F
IN.pdf
DagensNæringsliv(2016)DNinvestor:ScatecSolarASA.Availableat:http://investor.dn.no/?_ga=1.72406299.9#/Aksje/S59/SSO/ScatecSolar
Damodaran,A.(2012)Investmentvaluation:Toolsandtechniquesfordeterminingthevalueofanyasset,universityedition.3rdedn.UnitedStates:Wiley,John&Sons.
Damodaran,A.(2011)Thelittlebookofvaluation:Howtovalueacompany,pickastockandprofit.UnitedStates:Wiley,John&Sons.
Damodaran,A.(2005)DamodaranOnline.RetrievedMay3rd,2016fromAnIntroductionTo
Valuation:http://people.stern.nyu.edu/adamodar/pdfiles/eqnotes/approach.pdf
DamodaranOnline(2015)Historicalimpliedequityriskpremiums.Availableat:http://pages.stern.nyu.edu/~adamodar/New_Home_Page/datafile/implpr.html
EgyptERA(2014)RenewableEnergy–Feed-inTariffProjects’Regulations.Availableat:http://egyptera.org/Downloads/taka%20gdida/Download%20Renewable%20Energy%20Fee
d-in%20Tariff%20Regulations.pdf.
ERM(2015)MocubaSolarProject-SimplifiedEnvironmentalStudy.Availableat:http://www.erm.com/contentassets/51e0422d002849ff8709be373b0b35b2/final-sea-
master-report.pdf.

95
Finnigan,J.(2015)ASunnyFutureforutility-scalesolar.Availableat:http://blogs.edf.org/energyexchange/2015/12/28/a-sunny-future-for-utility-scale-solar/
Forbes(2013)NoendinsightforSpain’sescalatingsolarcrisis.Availableat:http://www.forbes.com/sites/williampentland/2013/08/16/no-end-in-sight-for-spains-
escalating-solar-crisis/#1eb631b627c6
Fraunhofer(2015)FraunhoferInstituteforSolarEnergySystems,ISE-PHOTOVOLTAICSREPORT.
Hockenos,P.(2015)Energystoragemarketoutlook2015.Availableat:http://www.renewableenergyworld.com/articles/2015/02/energy-storage-market-outlook-
2015.html
Hockenos,P.(2014)Germanexpertslockhornsoverstorage.Availableat:http://www.renewableenergyworld.com/articles/2014/10/german-experts-lock-horns-
over-storage.html
IEA(2014)TechnologyRoadmapSolarPhotovoltaicEnergy.Paris:InternationalEnergyAgency
IEA(2015), June2015.EnergyandClimateChange-WorldEnergyOutlookSpecialReport.Paris:InternationalEnergyAgency.
IEA(2015),October2015.EnergyandClimateChange-WorldEnergyOutlookSpecialBriefingforCOP21.Paris:InternationalEnergyAgency.
IFC(2015)Utility-ScaleSolarPhotovoltaicPowerPlants-APROJECTDEVELOPER’SGUIDE.WashingtonDC:InternationalFinanceCorporation.
IFC(2016)ASolarDeveloper’sGuidetoPakistan.Availableat:http://www.ifc.org/wps/wcm/connect/b46619004b5e398cb8b5fd08bc54e20b/IFC+-
+Solar+Developer’s+Guide+-+Web.pdf?MOD=AJPERES.WashingtonDC:International
FinanceCorporation.
IRENA(2015)RenewablePowerGenerationCosts2014.Bonn,Germany:International
RenewableEnergyAgency.
McKinsey(2015)Loweroilpricesbutmorerenewables:What’sgoingon?Availableat:http://www.mckinsey.com/industries/oil-and-gas/our-insights/lower-oil-prices-but-more-
renewables-whats-going-on
McKinsey(2015)PoweringAfrica.Availableat:http://www.mckinsey.com/industries/electric-power-and-natural-gas/our-
insights/powering-africa

96
MIT(2016)Taxcreditextensiongivessolarindustryanewboom.Availableat:
https://www.technologyreview.com/s/544981/tax-credit-extension-gives-solar-industry-a-
new-boom/
Moody’s(2016)ESKOMHoldingLimitedCreditRating.Availableat:https://www.moodys.com/page/search.aspx?cy=global&kw=ESKOM&searchfrom=GS&spk=
qs&tb=1
MESIA(2015)MENASolarOutlook2015.Availableat:http://www.mesia.com/wp-
content/uploads/Mesia-Rev3-5.pdf.
NordeaMarkets(2015)InitialCreditProfile-ScatecSolarASA.Oslo:NordeaMarkets.
NorgesBank(2015)Hvordansentralbankerpåvirkerrenter.Availableat:http://www.norges-bank.no/Publisert/Foredrag-og-taler/2015/2015-10-01-Olsen-CME/.
OECD(2016)Countryriskclassification.Availableat:http://www.oecd.org/tad/xcred/crc.htm
Porter,M.(2008)‘TheFiveCompetitiveForcesThatShapeStrategy’,HarvardBusinessReview
PVMagazine(2015)2015:57GWofsolarPVinstalled,cleanenergyinvestmenthitshighesteverlevels.Availableat:http://www.pv-magazine.com/news/details/beitrag/2015--57-gw-
of-solar-pv-installed--clean-energy-investment-hits-highest-ever-
levels_100022781/#axzz434PKDGeJ
PVMagazine(2015)Japanproposes11%FITcutasdomesticsolardemandfalls.Availableat:http://www.pv-magazine.com/news/details/beitrag/japan-proposes-11-fit-cut-as-
domestic-solar-demand-falls_100023330/#axzz44SgHlZW5
PVMagazine(2015)ChinaissuesslightFITcutforsolarin2016.Availableat:http://www.pv-magazine.com/news/details/beitrag/china-issues-slight-fit-cut-for-solar-in-
2016_100022574/#axzz44SgHlZW5
PVMagazine(2015)Kenya’sPVregulatoryframework.Availableat:http://www.roedl.de:10006/de-DE/de/medien/publikationen/fachaufsaetze/erneuerbare-
energie/Documents/Kenya-article.pdf
PVMagazine(2015)COP21:Parisclimateagreementawatershedmoment,saysIrena.Availableat:http://www.pv-magazine.com/features/forum-
solarpraxis/details/beitrag/cop21--paris-climate-agreement-a-watershed-moment--says-
irena_100022430/#axzz3wHb2n36E
PV-Tech(2014)CallsforKenyatoincreasesolarfiTorrisklosinginvestment.Availableat:http://www.pvtech.org/news/calls_for_kenya_to_increase_solar_fit_or_risk_losing_invest
ment

97
PwC(2015)Risikopremienidetnorskemarkedet2015,Oslo:PwC.
ScatecSolarASA(2014)ScatecSolarASAProspectus.Oslo:ABGSundalCollierASA,CarnegieAS.
ScatecSolar(2015)ScatecsolarASA:Successfullycompletednewseniorunsecuredgreenbondissue.Availableat:http://www.scatecsolar.com/Investor/Stock-exchange-
notices/Scatec-Solar-ASA-Successfully-completed-new-senior-unsecured-green-bond-issue.
ScatecSolarASA(2013)AnnualReport2012.Oslo:ScatecSolarASA.
ScatecSolarASA(2014)AnnualReport2013.Oslo:ScatecSolarASA.
ScatecSolarASA(2015)AnnualReport2014.Oslo:ScatecSolarASA.
ScatecSolarASA(2016)AnnualReport2015.Oslo:ScatecSolarASA.
ScatecSolarASA(2014-2016)Q12014–Q12016Reports.Oslo:ScatecSolarASA.
ScatecSolarASA(2016)ScatecSolarPartnerOpportunities.Availableat:http://www.scatecsolar.com/Partners
ScatecSolarASA(2016)ScatecSolarInvestorPresentation,March2016Oslo:ScatecSolarASA
SEIA(2016)USsolarmarketsettogrow119%in2016,installationstoreach16GW.
Availableat:http://www.seia.org/news/us-solar-market-set-grow-119-2016-installations-
reach-16-gw
Solarcentral(2015)Solarelectricitycostvs.Regularelectricitycost.Availableat:http://solarcellcentral.com/cost_page.html
SolarPowerEurope(2015)GlobalMarketOutlookforSolarPower2015-2019.Brussels:SolarPowerEurope.
Stratfor(2016)ABrightFutureforSolarPowerintheMiddleEast.Availableat:https://www.stratfor.com/analysis/bright-future-solar-power-middle-east
UnitedNations(2016)Energy-UnitedNationssustainabledevelopment.Availableat:http://www.un.org/sustainabledevelopment/energy/
WallStreetJournal(2016)Spain’sAbengoafilesforchapter15bankruptcyinU.S.Availableat:http://www.wsj.com/articles/spains-abengoa-files-for-chapter-15-bankruptcy-in-u-s-
1459256432

98
Wang,U.(2014)WhyLatinAmericawillbeAtoughsolarmarkettocrack.Availableat:http://www.forbes.com/sites/uciliawang/2014/01/23/why-latinamerica-will-be-a-tough-
solar-market-crack/#5f95946d3fed
Wessels,D.,Koller,T.andGoedhart,M.(2015)Valuation:Measuringandmanagingthevalueofcompanies.EditedbyMcKinsey.UnitedStates:JohnWiley&Sons.
WorldBank(2016)EnergyOverview-TheWorldBankGroup.Availableat:http://www.worldbank.org/en/topic/energy/overview
WorldBank(2016)Sustainabledevelopmentgoalonenergy(SDG7)andtheworldbankgroup.Availableat:http://www.worldbank.org/en/topic/energy/brief/sustainable-development-goal-on-energy-sdg7-and-the-world-bank-group
YahooFinance(2016)HistoricalPrices:SSO.OL,INE.TO,ETX.SE,AQN.TO,CPX.TO.Weekly
data02/10/14–16/05/16.
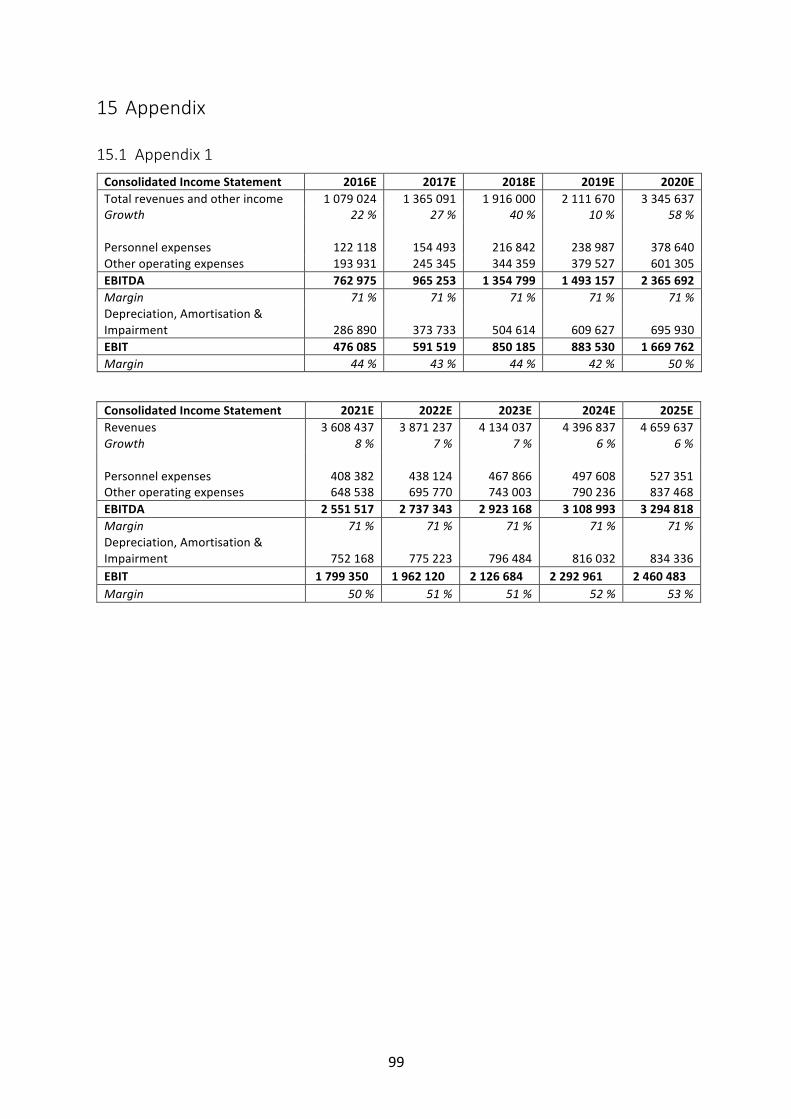
99
15 Appendix
15.1 Appendix1ConsolidatedIncomeStatement 2016E 2017E 2018E 2019E 2020ETotalrevenuesandotherincome 1079024 1365091 1916000 2111670 3345637
Growth 22% 27% 40% 10% 58%
Personnelexpenses 122118 154493 216842 238987 378640
Otheroperatingexpenses 193931 245345 344359 379527 601305
EBITDA 762975 965253 1354799 1493157 2365692Margin 71% 71% 71% 71% 71%Depreciation,Amortisation&
Impairment 286890 373733 504614 609627 695930
EBIT 476085 591519 850185 883530 1669762Margin 44% 43% 44% 42% 50%
ConsolidatedIncomeStatement 2021E 2022E 2023E 2024E 2025ERevenues 3608437 3871237 4134037 4396837 4659637
Growth 8% 7% 7% 6% 6%
Personnelexpenses 408382 438124 467866 497608 527351
Otheroperatingexpenses 648538 695770 743003 790236 837468
EBITDA 2551517 2737343 2923168 3108993 3294818Margin 71% 71% 71% 71% 71%Depreciation,Amortisation&
Impairment 752168 775223 796484 816032 834336
EBIT 1799350 1962120 2126684 2292961 2460483Margin 50% 51% 51% 52% 53%
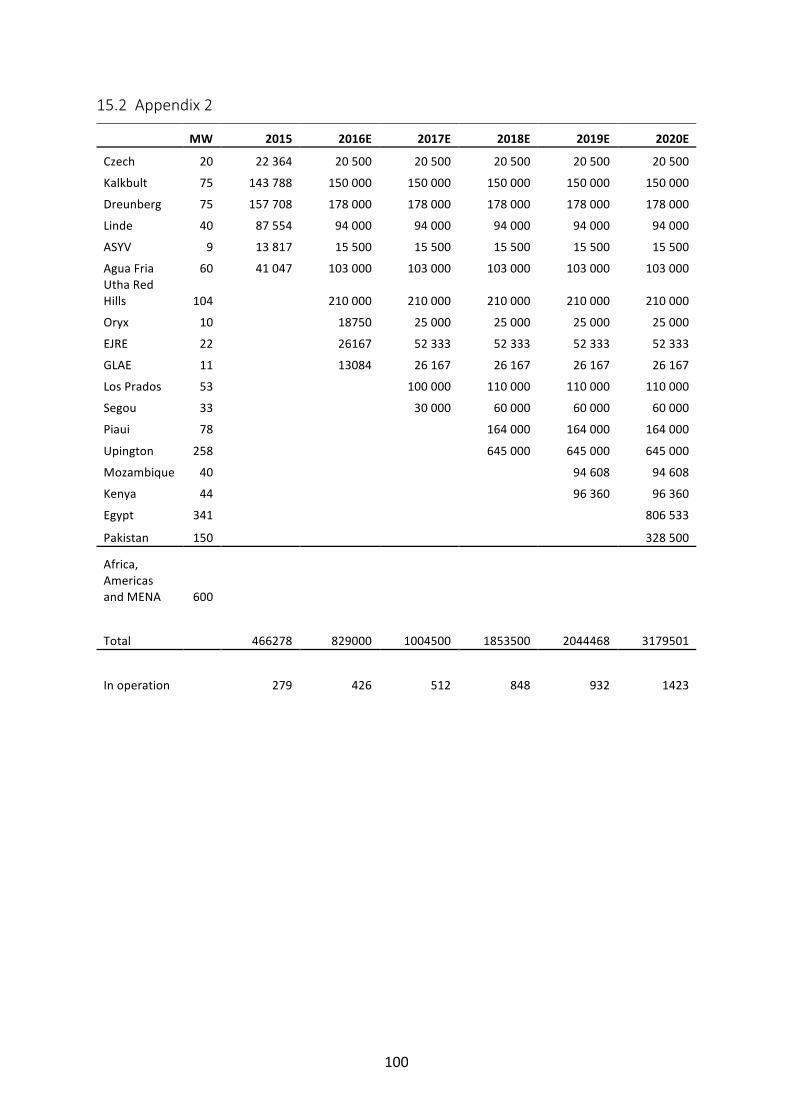
100
15.2 Appendix2
MW 2015 2016E 2017E 2018E 2019E 2020E
Czech 20 22364 20500 20500 20500 20500 20500
Kalkbult 75 143788 150000 150000 150000 150000 150000
Dreunberg 75 157708 178000 178000 178000 178000 178000
Linde 40 87554 94000 94000 94000 94000 94000
ASYV 9 13817 15500 15500 15500 15500 15500
AguaFria 60 41047 103000 103000 103000 103000 103000
UthaRed
Hills 104 210000 210000 210000 210000 210000
Oryx 10 18750 25000 25000 25000 25000
EJRE 22 26167 52333 52333 52333 52333
GLAE 11 13084 26167 26167 26167 26167
LosPrados 53 100000 110000 110000 110000
Segou 33 30000 60000 60000 60000
Piaui 78 164000 164000 164000
Upington 258 645000 645000 645000
Mozambique 40 94608 94608
Kenya 44 96360 96360
Egypt 341 806533
Pakistan 150 328500
Africa,
Americas
andMENA 600
Total 466278 829000 1004500 1853500 2044468 3179501
Inoperation 279 426 512 848 932 1423

101
15.3 Appendix3