valuation of internet stocks an ipo perspective · valuing technology stocks is a formidable task...
TRANSCRIPT

Journal of Accounting ResearchVol. 40 No. 2 May 2002
Printed in U.S.A.
Valuation of Internet Stocks—AnIPO Perspective
E L I B A R T O V ,∗ P A R T H A M O H A N R A M ,∗ A N DC H A N D R A K A N T H S E E T H A M R A J U†
Received 12 January 2001; accepted 14 December 2001
ABSTRACT
We empirically investigate valuations of Internet firms at various stages ofthe initial public offering (IPO) from two perspectives. First, we examine theassociation between the valuation of Internet IPOs and a set of financial andnonfinancial variables, which prior anecdotal or empirical evidence suggestsmay serve as value drivers. Second, we document differences in IPO valuationsbetween Internet and non-Internet firms as well as across different stages inthe IPO process—i.e., initial prospectus price, final offer price, and first trad-ing day price—within each set of firms. Our primary two conclusions are asfollows. First, there are noticeable differences between valuations of Internetand non-Internet firms, especially at the prospectus and final IPO stage. Specif-ically, the valuation of non-Internet firms generally follows the conventionalwisdom regarding valuation: positive earnings and cash flows are priced, whilenegative earnings and negative cash flows are not. The valuation of Internetfirms, however, departs from conventional wisdom, with earnings not beingpriced, and negative cash flows being priced perhaps because they are viewedas investments. This difference between the two classes of firms may be ex-pected, given the age and unique nature of the Internet industry. Second,there are significant differences between the initial valuation of firms at theprospectus and IPO stage and their valuation by the stock market at the end ofthe first trading day. For non-Internet firms, the difference is largely ascribedto the relative offering size. For Internet firms, however, the differences arewith respect to positive cash flows, sales growth, R&D, and high-risk warnings,in addition to the relative offering size.
∗New York University; †Washington University. We would like to acknowledge helpfulcomments from the editor, Ray Ball, the discussant, Phil Berger, an anonymous referee, andparticipants in the 2001 JAR Conference.
321
Copyright C©, University of Chicago on behalf of the Institute of Professional Accounting, 2002

322 E. BARTOV, P. MOHANRAM, AND C. SEETHAMRAJU
1. Introduction
Since its onset in 1994, the New Economy Internet industry has exhibitedunprecedented growth in the number of firms and market capitalization.In 1994, two Internet companies went public, raising less than 65 milliondollars; in 1999, 192 Internet firms went public, raising over 14 billion dol-lars. While the rich valuations observed in late 1999 (e.g., unusually highmarket to book and market to sales ratios) imply that the market expectedInternet companies to grow rapidly, the vast majority has yet to show a profit.This makes traditional valuation methods based on metrics such as earningsand book values less applicable to Internet firms and has lead researchersto search for alternative value drivers for Internet firms (Hand [2000a],Demers and Lev [2001], Trueman et al. [2000]).
In this paper, we focus on the valuation of Internet firms at the initialpublic offering (IPO) stage. We examine this issue from two viewpoints.First, we examine the association between the valuation of Internet IPOsand a set of financial and nonfinancial variables, which prior anecdotal orempirical evidence suggests may serve as value drivers. Second, we documentdifferences in IPO valuations between Internet and non-Internet firms aswell as across different stages in the IPO process (i.e., final offer price andfirst trading day price) within each set of firms.
The analyses are performed at three distinct points in time—when anIPO is initially priced, when the IPO is actually carried out, and finally atthe end of the IPO’s first day of trading. The first two points in time pertainto how IPOs are priced, while the last pertains to how they are received bythe stock market in their debut.
Our analyses involve three types of explanatory variables. The first, a setof financial variables, includes earnings, cash flows, sales, and book values.The second, a set of nonfinancial variables, includes relative offering size(FLOAT) and a measure capturing the relative position of the final offerprice relative to its initial price range (PARTIAL).1 The third type of ex-planatory variables is primarily a set of control variables shown by priorresearch to be important in explaining IPO valuations.
We find significant differences between the valuation of Internet firms andnon-Internet firms especially at the initial IPO pricing stage and at the timeof the IPO. Earnings are significant only for the IPOs of non-Internet firms,and not for Internet firms. While positive cash flows are significant for bothsamples, negative cash flows are significant only for Internet firms, perhapsbecause for these firms they are viewed as investments. IPOs of Internetfirms also receive higher multiples of positive cash flows and sales than non-Internet firms. Finally, sales growth and relative offering size (FLOAT) areimportant only for Internet firms.
1 As explained later in detail, the measure capturing the relative position of the final offerprice with respect to its initial price range is used only when the price at the end of the firstday of trading is the dependent variable.

VALUATION OF INTERNET STOCKS 323
There are also differences in valuations between Internet and non-Internet firms at the end of the first trading day. However, the differenceshere are primarily in the relative importance of the variables, not in whichof the variables are significant. Specifically, the stock price is insignificantlyrelated to any of the financial variables for either sample. The non-financialvariables, FLOAT and PARTIAL, are significant in both samples. However,they play a much greater role in the valuation of Internet firms.
The next section reviews prior research, provides brief background onthe Internet industry, and outlines the IPO process. Section 3 develops thehypotheses. Section 4 describes the sample selection procedure and reportssummary statistics for and pair-wise correlation among all variables used inthe analysis. Section 5 outlines the tests and discusses the results. Section 6concludes the study with a summary of our findings.
2. Prior Research, Background on the Internet Industry,and the IPO Process
2.1 PRIOR RESEARCH
In this section we review two types of literature. The first concerns In-ternet industry-related valuation relevance studies, and the second pertainsto the valuation of non-Internet IPOs. With respect to the former, Hand[2000a] demonstrates that financial statement data of Internet firms—corenet income (defined as net income less special items) and pre-income bookvalues—are value-relevant during the period 1997 to mid-1999. Specifically,he finds that the market values of Internet firms are linear and increas-ing in their book equity and concave and increasing in positive core netincome, but concave and decreasing in negative core net income. UnlikeHand [2000a], Trueman et al. [2000], who used different samples, timeperiods and functional forms, find a significant negative, not positive, asso-ciation between earnings and Internet firms’ market prices. After decom-posing earnings into its components, however, they find gross profits to besignificantly positively associated with prices.
Demers and Lev [2001], Hand [2000b], and Rajagopal et al. [2000] in-vestigate the value relevance of Web traffic for Internet companies. Theyfind that measures of web traffic, particularly those indicating “reach” (per-centage of a web site’s visitors relative to the total web-surfing population),are value-relevant, but the book value of equity and current and expectedfuture earnings dominate web traffic measures in explaining Internet com-panies’ market values. Schwartz and Moon [2000] use real-options theoryand capital-budgeting techniques to demonstrate that the valuations of In-ternet companies may be rational if growth rates in revenues are sufficientlyhigh and volatile.
IPO valuation has been investigated by prior research using samples ofnon-Internet firms. Klein [1996] empirically investigates the usefulness ofprospectus information in valuation of IPOs in the period 1980–1991 (i.e.,
324 E. BARTOV, P. MOHANRAM, AND C. SEETHAMRAJU
before the inception on the Internet industry). She finds that offering priceand after-market price (price one week after the IPO) are related positivelyto earnings per share, book value of equity per share, the amount of equityretained by insiders, the prestige of the underwriter and whether the offer-ing is a bundled offering (i.e., an inseparable package of common stock andwarrants) or not. She also finds that price is negatively related to whetherthe prospectus cover displays an explicit reference to the risk of the offer-ing. Kim and Ritter [1999] use comparable firm multiple techniques andapply them to the prospectus’s earnings, book value and sales numbers tocalculate value estimates for non-Internet IPOs. They predict and find thatvaluation errors increase at three different stages of IPOs—the preliminaryoffer price, the final offer price and the first market price. Their explana-tion is that additional information that gets revealed during the IPO processleads to the price changes.
2.2 THE INTERNET INDUSTRY
By March 2000, six years since its inception (and just before its meltdown),the Internet industry had become the second leading technology industry interms of wealth creation with a total market value exceeding the $1 trillionmark, only slightly trailing the more mature software industry. It consists ofover 400 publicly traded companies in the U.S. Internet firms operate in awide variety of sectors; Wall Street Research Net partitions the industry into13 sectors.2
Valuing technology stocks is a formidable task due to their massive in-vestments in intangible assets (e.g., R&D) whose values are typically hard toascertain. Valuing Internet stocks is even more difficult because not only dothey invest heavily in intangible assets (e.g., developing new technologiesand a critical mass of clientele), but they actually attempt to transform theway in which business is transacted. In addition, the vast majority of Inter-net companies have been generating significant, and often growing, losses.This lack of profitability further contributes to the substantial uncertaintythat has surrounded the valuation of Internet stocks virtually since the in-ception of the industry. A case in point: Business Week, in its December 14,1998 issue, provides excerpts of an e-mail message from an apparently con-fused investor posted at Internet.com, “I have some Internet stocks . . . I’dsure like to buy more. But I’ll think to myself, these stocks are ridiculouslyhigh, they CAN’T go higher. BUT THEY DO. . . I can’t bear missing out onthe excitement. But I also can’t connect reality to what I see in the stockvaluations.”
2.3 THE IPO PROCESS
For a company, going public typically marks the transformation fromstartup adolescence to corporate adulthood. Once a public company goes
2 Go to http://www.wsrn.com/apps/internetstocks/ for more details.

VALUATION OF INTERNET STOCKS 325
T A B L E 1IPOs in the Ten-Year Period 1990–1999
All firms1 Internet firms2
Number Dollar value Number Dollar valueYear of offerings (millions) of offerings (millions)
1990 158 4,627.20 1 50.401991 380 16,350.29 0 0.001992 528 29,359.18 2 64.601993 628 38,524.67 0 0.001994 539 31,619.41 2 46.401995 557 31,769.75 2 86.441996 786 36,955.88 19 484.721997 603 38,449.88 29 853.691998 362 49,992.37 42 2,132.321999 545 104,982.06 192 14,247.42Total 5,086 382,630.69 289 17,965.99
1 Data source: www.marketdata.nasdaq.com.2 Data source: www.Internet.com (1996–1998) and www.Internetnews.com (rest of the years).
public it commands, among other things, a publicly traded stock that can beused as a currency to finance acquisitions. This benefit may explain why, inthe ten-year period 1990–1999, more than 5,000 firms went public, raisingnearly 400 billion dollars (see table 1).
Once a company’s board of directors has decided to go public, the com-pany hires an investment banker to underwrite the offering. The companythen drafts the prospectus, the only document a company can use to com-municate with potential investors during an IPO. The prospectus contains,among other things, financial information about the company and the termsof the offer. In a firm commitment offer, the terms of the offer includethe offer price, which is stated in the form of a range whose midpoint isthe expected offer price. Upon completion, the prospectus is filed with theSecurities and Exchange Commission (SEC).3
The time from the filing of the prospectus to the final offer date is the“waiting period.” The underwriter uses the waiting period to gather infor-mation about the demand for the issue from investors through nonbindingindications of interest. If demand for the issue is greater (lower) than ex-pected, the final offer price will be set higher (lower) than the expected offerprice disclosed in the prospectus. To induce truth-telling by investors withgood information in the waiting period, the expected profit of truth tellersmust be higher than that of the liars. If shares of the issue are rationed, thismust be obtained by underpricing.4
3 Section 5(b) of the Security Act of 1933 requires issuing firms to file an S-1 registrationform with the SEC prior to the sale of securities to the public. The first part of the S-1 form isthe prospectus.
4 Changes in the offer price are often accompanied by parallel revisions in the number ofshares being offered.

326 E. BARTOV, P. MOHANRAM, AND C. SEETHAMRAJU
It is a well documented fact that IPOs tend to be underpriced, i.e.they tend to trade significantly above their offer price in their debut (see,Ibbotson and Ritter [1995] for a review of the literature on underpricing).Benveniste and Spindt [1989], who develop a model of pricing and alloca-tion rules used by underwriters of IPOs to induce truth-telling by investors,predict that IPOs priced toward the upper bound of their offer range arelikely to be more underpriced than other IPOs. The intuition underlyingthis prediction follows because if the potential underpricing at the expectedoffer price is relatively large, a firm is able to increase its final offer price andstill have more underpricing than other firms with less initial underpricing.Consistent with this prediction, Hanley [1993] documents a positive associ-ation between the stock price change of IPOs on their first trading day andthe ratio of the final offer price to the expected offer price disclosed in theprospectus.
Leland and Pyle [1977] show that the percentage of shares offered to thepublic, which potentially may serve as a signal of the unobservable infor-mation of the entrepreneurs about the future prospects of their company,is an important value driver. On a related note, Shleifer [1986] finds thatstocks with lesser supply are likely to be priced higher. Schultz and Zaman[2001] find evidence that suggests Internet firms do not go public simply asa vehicle for founders to bail out. They find strong evidence that managersof Internet firms go public in order to grab market share.
3. Dependent and Independent Variables
This study examines value drivers underlying the initial price in theprospectus, i.e., the midpoint of the range of the offer price disclosed inthe prospectus (PROSPPRICE), the final offer price (IPOPRICE), and theprice at the end of the first trading day (ENDPRICE) using a sample ofInternet IPOs and a control sample of non-Internet IPOs. It also tests fordifferences in the importance of the value drivers across the two samples.
Our tests evaluate the ability of five major financial variables—earningsper share (EPS), operating cash flow per share (CFOPS), sales per share(SALESPS), book value per share (BVPS), and the annual sales growth(SGR)—to explain the cross-sectional variation in PROSPPRICE, IPOPRICEand ENDPRICE. We select these five explanatory variables because prior re-search has shown that these variables are important for equity valuation. Wealso consider the level of R&D per share (RDPS) as an additional explanatoryvariable because our sample firms are likely to be R&D intensive.
Our tests also consider one non-financial variable, FLOAT, for PROSP-PRICE and IPOPRICE, and two non-financial variables, FLOAT and PARTIAL,for ENDPRICE, because prior literature has demonstrated their importancefor IPO pricing. In addition, we control for a variety of variables shown byprior IPO literature to be important for IPO pricing. Below we develop pre-dictions regarding the relation between each of the explanatory variablesand our three dependent variables.

VALUATION OF INTERNET STOCKS 327
3.1. FINANCIAL VARIABLES
3.1.1. Earnings and Cash Flows. In equity valuation, the most commonlyused financial variables are earnings and cash flows. For example, earningsare used in the ubiquitous P/E ratios (and more recently P/E to growthratios, i.e., PEG), and cash flows are used in methods of valuation such as thediscounted cash flow (DCF) model. Prior research has shown asymmetries inthe relations between market values of equity and positive and negative ear-nings (see, e.g., Hayn [1995], and Hand [2000]). These asymmetries followbecause positive earnings are likely to persist, while negative earnings arelikely to be transitory and thus less informative about future earnings andcash flows (Basu [1997]). We hence break up our measures for earnings andcash flows into positive and negative components by interacting them witha dummy variable. We also use these two dummy variables as fixed effectsto allow the intercept to vary across positive and negative earnings and cashflows.
3.1.2. Sales and Sales Growth. In the absence of a history of profits andmeaningful book values, conventional wisdom suggests that investors relyon revenue as an important financial value driver. The following excerptperhaps best highlights this: “. . . revenues are the lifeblood of these compa-nies and their stocks because earnings often are nonexistent. Investors wantgrowth at Internet firms. When they can’t look at earnings, they look forgo-go revenue growth” (see, The Wall Street Journal [2000a]). This conven-tional wisdom is supported by empirical findings in Davis [2001], whichindicate that revenues are value relevant for Internet firms.
The importance revenue plays in the valuation of Internet firms andthe problems associated with revenue reporting practices in this industryhave not gone unnoticed by regulators. According to The Wall Street Journal[2000b], “A top rule-making panel at the Financial Accounting StandardsBoard is considering whether the rules should be changed to restrict Inter-net businesses from including in revenue figures the entire value of productsales or services they arrange between suppliers and buyers online. To theSecurities and Exchange Commission and the FASB, it is called ‘grossingup’ revenue. To many dot-com companies, it is a vital part of their financialhealth, at a time when they have no profits to show.”
We use two revenue-based variables: sales per share for the year just priorto the IPO (SALESPS) and annualized sales growth in the years prior to theIPO (SGR).
3.1.3. Book Values. In addition to the “flow” variables discussed above, wealso include one stock variable, book value of equity. Research in Internetvaluation (see, e.g., Hand [2000a]) has indicated that negative book valuesmay have very different valuation implications than positive book values forInternet firms. Negative book values may indicate investments in R&D andother intangibles over the years leading to the IPO and thus may be valuedby the stock market. To consider this possibility, we break up book value into
328 E. BARTOV, P. MOHANRAM, AND C. SEETHAMRAJU
positive and negative components using a dummy variable. We also use thisdummy variable as a fixed effect to allow the intercept to vary across positiveand negative book values.
3.2 NON-FINANCIAL VARIABLES
3.2.1. FLOAT. FLOAT represents the amount of shares sold in the IPO asa percentage of total shares outstanding. Results in prior research imply thatFLOAT and our dependent variables will be negatively related. For example,the supply and demand hypothesis implies that stocks with lesser supply arelikely to be priced higher (see Shleifer [1986]). Leland and Pyle [1977]and Schultz and Zaman [2001] have shown that greater relative insiderownership (i.e., low FLOAT) should be a positive signal to investors becauseit indicates that the IPO is not simply a vehicle for the founders to bail out.Greater insider ownership (low FLOAT) may indicate a higher stock pricefor yet another reason. It may point to lower agency costs, as the interests ofmanagers and shareholders are better aligned.
3.2.2. PARTIAL. For the regressions for ENDPRICE, we include an addi-tional non-financial variable, PARTIAL. This variable measures the positionof the final offer price relative to the expected price at the time the prospec-tus was filed. We add this variable because prior research has shown theo-retically (see Benveniste and Spindt [1989]) and empirically (see Hanley[1993]) that this variable is an important predictor for IPOs’ first-day stockprice performance. Specifically, this prior research has demonstrated thatIPOs priced toward the upper bound of their offer range are likely to bemore underpriced than other IPOs.
3.3 CONTROL VARIABLES
3.3.1. Research and Development. Statement of Financial Accounting Stan-dard (SFAS) No. 2 requires immediately expensing research and develop-ment costs. However, prior studies (see, e.g., Lev and Sougiannis [1996])have found that R&D has long lived benefits and is value-relevant for val-uation purposes. Given this finding and the fact that our sample firms arelikely to be R&D intensive, we include R&D as an explanatory variable.
3.3.2. Major Underwriter. Titman and Trueman [1986] posit that firmsexpecting relatively high growth or low risk in earnings and/or revenueswill signal this favorable information to outside investors by selecting a more“prestigious” underwriter, who would present more accurate prospectusesthan a less prestigious underwriter. This implies that, other things beingequal, hiring a large underwriter will result in a higher valuation of theIPO. Empirical support for this hypothesis is provided by Klein [1996]. Wethus control for the type of the underwriter by using MAJ UND as a dummyexplanatory variable, which is equal to 1 if the lead underwriter is a largeunderwriter, and 0 otherwise.
3.3.3. High Risk Warning. Klein [1996] finds that firms that issued a bold-face warning on their cover page to the effect that the IPO is a high risk

VALUATION OF INTERNET STOCKS 329
investment commanded lower IPO prices and lower prices after the IPO aswell. We define HIRISK as a dummy variable equal to 1 if the prospectus’scover page has a boldface risk warning, and 0 otherwise.
3.3.4. Nature of Offering. Often, bundled offerings to public investors areinseparable packages of common stock and warrants. Prior literature (see,e.g., Schultz [1993] and Klein [1996]) has found that firms with bundledofferings appear to be more risky and receive lower valuations. WARRANTis set equal to 0 if the offering is an equity offering only and 1 if the offeringis a bundled offer.
3.3.5. Level of NASDAQ. The inflation-adjusted level of the NASDAQ in-dex (NASD ADJ ) is included as an explanatory variable to control for themarket and economy-wide sentiment prevailing at the time of the IPO. Ifthe market-wide sentiment is trending higher, the IPO price should also behigher. We define NASD ADJ as the inflation-adjusted level of the NASDAQindex.
4. Data
4.1 SAMPLE SELECTION
Our sample covers the 42-month period from January 1996 to June 1999.Our sample period begins in January 1996 because there were hardly anyInternet firms in the public domain before that time (see table 1). The list ofInternet firms was obtained from www.Internet.com, a well-established website for information on all aspects of Internet firms as well as IPO informationfor both Internet and non-Internet firms. This web site classifies a firm as anInternet firm primarily on the basis of the 51-percent test (i.e., if 51 percentor more of its revenues come from the Internet).
Table 2 summarizes the effects of the sample-selection criteria on thesample size. The initial sample taken from www.Internet.com consists of233 Internet companies that filed an IPO prospectus with the SEC duringour sample period. We dropped 22 firms as they cancelled their plan togo public, reducing our sample size to 211 firms that went public duringour sample period. We dropped 21 firms due to our inability to find theirprospectus on www.edgar-online.com, the source from which we obtained fi-nancial information, decreasing the sample size to 190 firms. We lost 23 firmsbecause we were unable to obtain their CUSIPs needed for retrieving theirday 1 end stock price, and we lost an additional 17 firms due to missinginformation in the prospectus required for the calculation of sales growth,reducing the sample size to 150.
Prior studies of IPO pricing usually exclude certain types of IPOs andcertain sectors in order to obtain a more homogeneous sample. We thusverified that these 150 IPOs are not equity carve-outs, best-efforts IPOs,financial companies, reverse LBOs, or issues raising less than $5 million.
We attempted to match the 150 firms to non-Internet non-financial butotherwise similar firms using the following two criteria: (1) the IPO date, and

330 E. BARTOV, P. MOHANRAM, AND C. SEETHAMRAJU
T A B L E 2Sample Selection
NumberCriterion of firms
Internet IPOs between 1/96 and 6/99, listed on www.Internet.com 233Withdrawn 22Internet IPOs that went public 211IPO prospectus unavailable 21Internet IPOs that went public with prospectus available 190CUSIP unavailable 23IPO data required for the analysis are unavailable from the prospectus 17Internet IPOs that went public with available data for offer price regressions 150An IPO match unavailable∗ 41Internet IPOs with valid matches and offer price 109Valid day-one-end price unavailable 11FINAL SAMPLE 98
∗Firms were matched on IPO date and IPO size in dollars.
(2) the IPO size (defined as the product of the number of shares offered andthe final offer price). Criterion (1), requiring that the date of the InternetIPO and that of its match be within three days of each other, is meant tocontrol for possible time-period and stock-market-wide effects. Criterion (2)is meant to control for a possible size effect. We were unable to find matchesfor 41 of the 150 firms, leaving us with 109 Internet firms. For 11 of these109 firms, we were unable to find a valid day 1 end price, either because itwas not available or because more than one day elapsed between the day ofthe IPO and the first trading day. This left us with 98 Internet firms and 98non-Internet control firms for our tests.5
4.2 DESCRIPTIVE STATISTICS
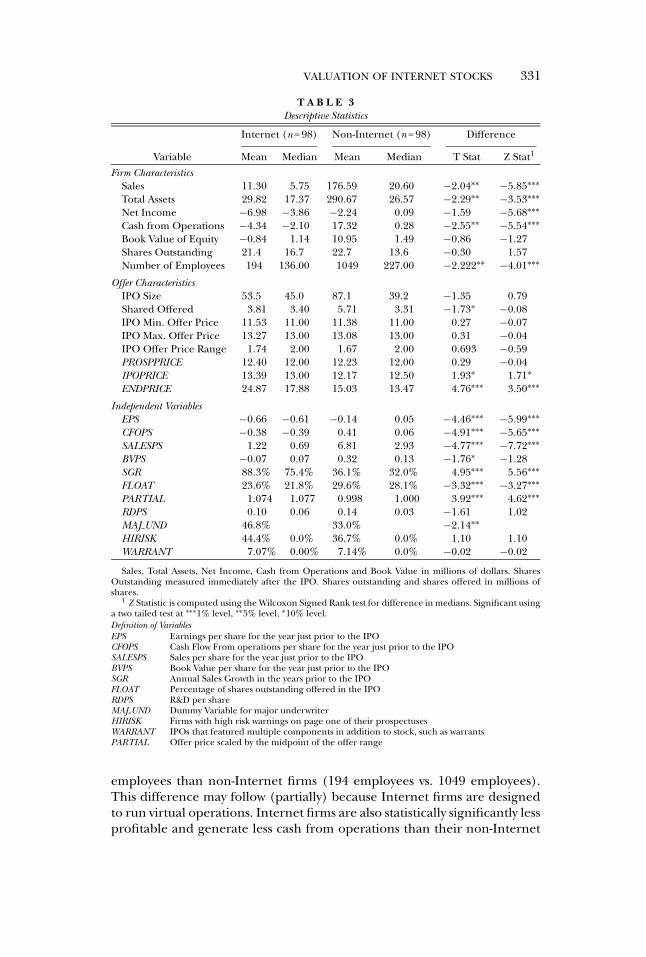
Table 3 provides descriptive statistics for our sample firms for Internetfirms and non-Internet firms separately. Consider first the descriptive statis-tics for firm characteristics. Notwithstanding our efforts to minimize differ-ences through the matching procedure, there remain marked differencesbetween the test and control samples with respect to firm size and pro-fitability. Specifically, while, as expected, all sample IPO firms are relativelysmall, Internet IPO firms are statistically significantly smaller than their non-Internet counterparts. For example, the means of Sales and Total Assets are,respectively, $11.30 and $29.82 for the Internet sample, vis-a-vis $176.59 and$290.67, respectively, for the non-Internet sample (all figures in millions).In addition, Internet firms have, on average, statistically significantly fewer
5 Our Internet sample and control sample have very similar industry distribution. The domi-nant SIC code is 73 (business services including computer software). Prior to 1999, 42 out of53 Internet firms and 36 out of 53 non-Internet firms belonged to SIC 73. Post 1999, 38 out of45 Internet firms and 31 out of 45 non-Internet firms belonged to SIC 73.
VALUATION OF INTERNET STOCKS 331
T A B L E 3Descriptive Statistics
Internet (n = 98) Non-Internet (n = 98) Difference
Variable Mean Median Mean Median T Stat Z Stat1
Firm CharacteristicsSales 11.30 5.75 176.59 20.60 −2.04∗∗ −5.85∗∗∗Total Assets 29.82 17.37 290.67 26.57 −2.29∗∗ −3.53∗∗∗Net Income −6.98 −3.86 −2.24 0.09 −1.59 −5.68∗∗∗Cash from Operations −4.34 −2.10 17.32 0.28 −2.55∗∗ −5.54∗∗∗Book Value of Equity −0.84 1.14 10.95 1.49 −0.86 −1.27Shares Outstanding 21.4 16.7 22.7 13.6 −0.30 1.57Number of Employees 194 136.00 1049 227.00 −2.222∗∗ −4.01∗∗∗
Offer CharacteristicsIPO Size 53.5 45.0 87.1 39.2 −1.35 0.79Shared Offered 3.81 3.40 5.71 3.31 −1.73∗ −0.08IPO Min. Offer Price 11.53 11.00 11.38 11.00 0.27 −0.07IPO Max. Offer Price 13.27 13.00 13.08 13.00 0.31 −0.04IPO Offer Price Range 1.74 2.00 1.67 2.00 0.693 −0.59PROSPPRICE 12.40 12.00 12.23 12.00 0.29 −0.04IPOPRICE 13.39 13.00 12.17 12.50 1.93∗ 1.71∗ENDPRICE 24.87 17.88 15.03 13.47 4.76∗∗∗ 3.50∗∗∗
Independent VariablesEPS −0.66 −0.61 −0.14 0.05 −4.46∗∗∗ −5.99∗∗∗CFOPS −0.38 −0.39 0.41 0.06 −4.91∗∗∗ −5.65∗∗∗SALESPS 1.22 0.69 6.81 2.93 −4.77∗∗∗ −7.72∗∗∗BVPS −0.07 0.07 0.32 0.13 −1.76∗ −1.28SGR 88.3% 75.4% 36.1% 32.0% 4.95∗∗∗ 5.56∗∗∗FLOAT 23.6% 21.8% 29.6% 28.1% −3.32∗∗∗ −3.27∗∗∗PARTIAL 1.074 1.077 0.998 1.000 3.92∗∗∗ 4.62∗∗∗RDPS 0.10 0.06 0.14 0.03 −1.61 1.02MAJ UND 46.8% 33.0% −2.14∗∗HIRISK 44.4% 0.0% 36.7% 0.0% 1.10 1.10WARRANT 7.07% 0.00% 7.14% 0.0% −0.02 −0.02
Sales, Total Assets, Net Income, Cash from Operations and Book Value in millions of dollars. SharesOutstanding measured immediately after the IPO. Shares outstanding and shares offered in millions ofshares.
1 Z Statistic is computed using the Wilcoxon Signed Rank test for difference in medians. Significant usinga two tailed test at ∗∗∗1% level, ∗∗5% level, ∗10% level.Definition of VariablesEPS Earnings per share for the year just prior to the IPOCFOPS Cash Flow From operations per share for the year just prior to the IPOSALESPS Sales per share for the year just prior to the IPOBVPS Book Value per share for the year just prior to the IPOSGR Annual Sales Growth in the years prior to the IPOFLOAT Percentage of shares outstanding offered in the IPORDPS R&D per shareMAJ UND Dummy Variable for major underwriterHIRISK Firms with high risk warnings on page one of their prospectusesWARRANT IPOs that featured multiple components in addition to stock, such as warrantsPARTIAL Offer price scaled by the midpoint of the offer range
employees than non-Internet firms (194 employees vs. 1049 employees).This difference may follow (partially) because Internet firms are designedto run virtual operations. Internet firms are also statistically significantly lessprofitable and generate less cash from operations than their non-Internet
332 E. BARTOV, P. MOHANRAM, AND C. SEETHAMRAJU
matches: the means of Net Income and Cash from Operations for the for-mer are, respectively, $–6.98 and $–4.34, and $–2.24 and $17.32 for the latter(all figures in millions).
Still, our matching procedure is successful in generating test and controlsamples that are similar in certain offer characteristics. Both sets of firmshad, on average, around 22 million shares outstanding before the IPO, andInternet IPOs are only slightly smaller than non-Internet IPOs in termsof number of shares offered (3.81 million vs. 5.71 million). The IPO pricerange (i.e., the difference between the minimum and maximum anticipatedoffer prices disclosed in the prospectus) and the minimum and maximumoffer prices themselves are also very similar. The mean IPO offer price is$13.39 for Internet firms and $12.17 for non-Internet firms. The averageday 1 end price, however, is higher for Internet firms ($24.87 vs. $15.03).Thus, while the market reacts positively, on average, to all IPOs in theirdebut (the well-known underpricing phenomenon), this positive reactionis more pronounced for Internet IPOs than for non-Internet IPOs.
Table 3 also provides descriptive statistics for the dependent and explana-tory variables used in our regressions. The differences between Internetfirms and non-Internet firms with respect to the per-share values of sales,book values, earnings, and cash from operations are in the same directionas those observed in the “Firm Characteristics” section of table 3, which re-ported the nonscaled values of these variables. Briefly, on a per share basisInternet companies are smaller and less profitable than their non-Internetcounterparts. The data further indicate that Internet IPO firms exhibitstatistically significantly greater annual sales growth than non-Internet firms(88.3% vs. 36.1%).
The two samples also differ significantly with respect to FLOAT (the meanpercentage of shares offered in the IPO). FLOAT is statistically significantlylower for Internet firms (23.6% vs. 29.6%). In addition, Internet (non-Internet) firms have mean PARTIAL of 1.074 (0.998). This implies thatunderwriters initially have an unbiased or perhaps even somewhat opti-mistic estimate of the final offer price of non-Internet IPOs.6 Conversely,for Internet IPOs, whose final offer prices are likely to be above the mid-points of their price ranges, underwriters initially underestimate investors’demand for these stocks, an indication of the optimism and momentumsurrounding Internet IPOs for the time period being analyzed.
The two samples are statistically significantly different with respect to theprestigious underwriter variable, MAJ UND. For the Internet firms, 46.8% ofthe firms chose a prestigious/large underwriter, while only 33% of the non-Internet sample did the same. This could be because Internet firms weresmaller and less profitable and needed to be associated with a large under-writer in order to successfully complete an IPO. An alternate explanation
6 Recall that PARTIAL is computed as the IPO offer price divided by the midpoint of theIPO range. A value of one thus means that the final offer price equals the midpoint of the IPOprice range.

VALUATION OF INTERNET STOCKS 333
is that during the height of the Internet craze, the big underwriters weremore interested in Internet firms and non-Internet firms found it difficultto hire prestigious underwriters.
Finally, the two samples are quite similar with respect to R&D and the twocontrol variables for risk—HIRISK and WARRANT. For the Internet firms,44.4% had the high-risk warnings on page 1 of the prospectus, while 36.7%of the non-Internet sample had the high-risk warnings. The difference is,however, not statistically significant. Both samples have a little over 7% ofthe IPOs being bundled offerings, i.e., combining an equity issue with anissue of inseparable warrants.
4.3 CORRELATIONS AMONG THE EXPLANATORY VARIABLES
Table 4 reports pair-wise correlations between all variables used in theregressions. panels A and B present the correlations for Internet and non-Internet firms respectively. Figures above (below) the diagonal are Pearson(Spearman-rank-order) correlations.
For Internet firms, earnings per share (EPS) and cash flow per share(CFOPS) are highly correlated (Spearman correlation, 0.63). These vari-ables are our alternative performance measures and are never used in thesame regression. The correlations among the other explanatory variablesare generally rather low; the highest correlation is between FLOAT andWARRANT (Pearson correlation, 0.364). For non-Internet firms, the high-est correlation is between CFOPS and SALESPS (Pearson correlation, 0.422).Overall, the relatively low correlations among the explanatory variables usedsimultaneously in the regressions increase confidence that multicollinear-ity is not a serious problem for our data. For both samples, as may be ex-pected, PROSPRICE and IPOPRICE are highly positively correlated and bothvariables are correlated with ENDPRICE, albeit to a lesser extent. Addition-ally, the dependent variables are correlated with many of the explanatoryvariables in the predicted direction. Obviously, these correlations must beinterpreted with caution, as they may be biased due to a correlated-omitted-variables problem.
5. Tests and Results
5.1 REGRESSIONS FOR PROSPPRICE
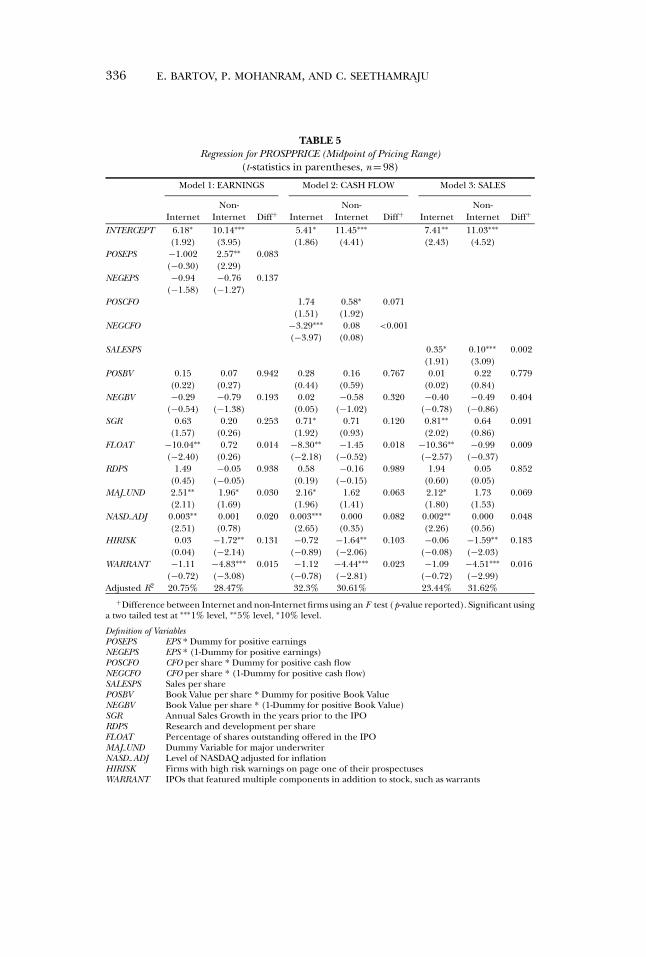
Table 5 presents the regression results for PROSPPRICE, which is themidpoint of the pricing range from the prospectus. We estimate threealternative specifications with earnings, cash flows, and sales as ourperformance measures. The dependent variables and all financial explana-tory variables are expressed on a per share basis.7 The regressions are carried
7 In an effort to alleviate heteroskedasticity, we use shares outstanding as the deflator. Testsfor heteroskedasticity fail to reject the null of homoskedasticity for all models. Note that oursample firms have large unrecorded intangible assets, which make total assets an inappropriatedeflator. Indeed, when total assets are used as a deflator, homoskedasticity is rejected.

334E.
BA
RT
OV,
P.M
OH
AN
RA
M,
AN
DC.
SEE
TH
AM
RA
JU
T A B L E 4Correlation Matrix
Pearson Correlations above Diagonal and Spearman-Rank Correlations below Diagonal
PROSPPRICE IPOPRICE ENDPRICE SALESPS EPS CFOPS BVPS SGR FLOAT RDPS MAJ UND HIRISK WARRANT PARTIAL
Panel A: Internet Firms (n = 98)
PROSPPRICE 0.938∗∗∗ 0.630∗∗∗ 0.115 −0.116 −0.151 0.003 0.230∗∗ −0.428∗∗∗ 0.116 0.153 −0.194∗ −0.251∗∗ 0.135IPOPRICE 0.930∗∗∗ 0.756∗∗∗ 0.063 −0.030 −0.088 0.010 0.283∗∗∗ −0.455∗∗∗ 0.161 0.074 −0.272∗∗∗ −0.258∗∗ 0.463ENDPRICE 0.731∗∗∗ 0.843∗∗∗ −0.077 −0.005 0.065 0.099 0.316∗∗∗ −0.464∗∗∗ 0.213∗∗ −0.014 −0.352∗∗∗ −0.215∗∗ 0.506∗∗∗
SALESPS 0.114 0.063 −0.056 0.085 −0.090 0.112 −0.180∗ 0.059 −0.057 0.180∗ 0.177∗ −0.061 −0.078EPS −0.206∗∗ −0.137 −0.122 0.204∗∗ 0.547∗∗∗ 0.123 −0.049 0.037 −0.134 −0.099 −0.107 −0.019 0.234∗∗
CFOPS −0.255∗∗∗ −0.157 −0.033 0.078 0.631∗∗∗ 0.205∗∗ −0.029 −0.014 −0.044 −0.064 −0.067 −0.039 0.136BVPS −0.012 −0.024 0.080 0.041 0.122 0.168 0.001 −0.196∗∗ −0.134 0.174∗ 0.154 −0.101 0.005SGR 0.139 0.188∗ 0.270∗∗∗ −0.284∗∗∗ −0.075 −0.014 0.097 −0.181∗ −0.064 −0.056 −0.112 0.062 0.244∗∗
FLOAT −0.399∗∗∗ −0.455∗∗∗ −0.562∗∗ 0.052 0.049 −0.009 −0.128 −0.318∗∗∗ −0.163 −0.234∗∗ 0.303∗∗ 0.364∗∗ −0.203∗∗
RDPS 0.013 0.084 0.223∗∗ 0.142 −0.145 −0.003 −0.060 −0.018 −0.254∗∗ 0.044 0.019 −0.097 0.157MAJ UND 0.151 0.054 0.061 0.148 −0.148 −0.061 0.228∗∗ −0.044 −0.184∗ 0.086 0.055 −0.063 −0.155HIRISK −0.192∗ −0.277∗∗∗ −0.350∗∗∗ 0.136 −0.013 −0.089 0.164 −0.134 0.356∗∗∗ −0.099 0.113 0.070 −0.260∗∗∗
WARRANT −0.259∗∗ −0.266∗∗ −0.303∗∗∗ −0.055 −0.040 0.011 −0.175 0.050 0.261∗∗ −0.065 −0.082 0.070 −0.120PARTIAL 0.201∗ 0.472∗∗∗ 0.515∗∗∗ −0.030 0.109 0.071 −0.065 0.090 −0.238∗∗ 0.223∗∗ −0.184∗ −0.225∗∗ −0.177

VA
LU
AT
ION
OF
INT
ER
NE
TST
OC
KS
335
Panel B: Non-Internet Firms (n = 98)
PROSPPRICE IPOPRICE ENDPRICE SALESPS EPS CFOPS BVPS SGR FLOAT RDPS MAJ UND HIRISK WARRANT PARTIAL
PROSPPRICE 0.931∗∗∗ 0.563∗∗∗ 0.392∗∗∗ 0.013 0.348∗∗∗ −0.028 0.147 −0.024 −0.044 0.161 −0.371∗∗∗ −0.449∗∗∗ −0.083IPOPRICE 0.898∗∗∗ 0.742 0.298∗∗∗ 0.053 0.297∗∗∗ −0.041 0.163 −0.123 −0.007 0.188∗ −0.372∗∗∗ −0.429∗∗∗ 0.275∗∗
ENDPRICE 0.611∗∗∗ 0.810∗∗∗ 0.043 0.072 0.091 −0.088 0.216∗∗ −0.312 −0.054 0.145 −0.316∗∗∗ −0.282∗∗∗ 0.510∗∗∗
SALESPS 0.419∗∗∗ 0.340∗∗∗ 0.148 0.022 0.422∗∗∗ −0.111 −0.108 0.153 −0.136 −0.029 −0.199∗∗ −0.149 −0.179∗
EPS 0.112 0.092 0.078 0.350∗∗∗ 0.253∗∗ 0.247∗∗ −0.108 0.010 −0.248∗∗ −0.065 −0.056 −0.041 0.074CFOPS 0.380∗∗∗ 0.383∗∗∗ 0.221∗∗ 0.416∗∗∗ 0.396∗∗∗ 0.059 −0.046 0.116 −0.095 −0.026 −0.195 −0.114 −0.068BVPS −0.020 −0.056 −0.067 0.015 0.303∗∗∗ 0.215∗∗ −0.040 0.273 −0.093 −0.088 −0.117 −0.078 −0.046SGR 0.058 0.119 0.185∗ −0.161 −0.181 −0.140 0.010 −0.153 0.092 0.124 −0.069 −0.254∗∗ 0.058FLOAT −0.064 −0.191∗ −0.422∗∗∗ 0.182∗ 0.083 0.073 0.012 −0.234∗∗ −0.100 −0.202∗∗ −0.039 0.064 −0.248∗∗
RDPS −0.113 −0.025 0.027 −0.362∗∗∗ −0.304∗∗∗ −0.246∗∗ −0.167 0.221∗∗ −0.304∗∗∗ 0.029 0.174∗ −0.081 0.095MAJ UND 0.134 0.164 0.222∗∗ −0.022 −0.084 −0.003 −0.071 0.169 −0.201∗∗ 0.184∗ 0.009 −0.162 0.112HIRISK −0.386∗∗∗ −0.402∗∗∗ −0.344∗∗∗ −0.198∗ −0.036 −0.140 −0.111 0.006 0.058 0.198∗ 0.078 0.282 −0.026WARRANT −0.424∗∗∗ −0.410∗∗∗ −0.382∗∗∗ −0.365∗∗∗ −0.158 −0.187∗ −0.139 −0.282∗∗ 0.120 −0.070 −0.173 0.282∗∗∗ 0.019PARTIAL −0.094 0.312∗∗∗ 0.539∗∗∗ −0.240∗∗ −0.043 −0.040 −0.080 0.204∗∗ −0.267∗∗ 0.217∗∗ 0.128 0.025 0.041
Significant using a two tailed test at ∗∗∗1% level, ∗∗5% level, ∗10% level.Definition of VariablesPROSPPRICE Midpoint of the range of the offer price disclosed in the prospectusIPOPRICE Final offer priceENDPRICE Price at the end of the first trading dayEPS Earnings per share for the year just prior to the IPOCFOPS Cash Flow From operations per share for the year just prior to the IPOSALESPS Sales per share for the year just prior to the IPOBVPS Book Value per share for the year just prior to the IPOSGR Annual Sales Growth in the years prior to the IPOFLOAT Percentage of shares outstanding offered in the IPORDPS R&D per shareMAJ UND Dummy Variable for major underwriterHIRISK Firms with high risk warnings on page one of their prospectusesWARRANT IPOs that featured multiple components in addition to stock, such as warrantsPARTIAL Offer price scaled by the midpoint of the offer range
336 E. BARTOV, P. MOHANRAM, AND C. SEETHAMRAJU
TABLE 5Regression for PROSPPRICE (Midpoint of Pricing Range)
(t -statistics in parentheses, n = 98)
Model 1: EARNINGS Model 2: CASH FLOW Model 3: SALES
Non- Non- Non-Internet Internet Diff+ Internet Internet Diff+ Internet Internet Diff+
INTERCEPT 6.18∗ 10.14∗∗∗ 5.41∗ 11.45∗∗∗ 7.41∗∗ 11.03∗∗∗
(1.92) (3.95) (1.86) (4.41) (2.43) (4.52)POSEPS −1.002 2.57∗∗ 0.083
(−0.30) (2.29)NEGEPS −0.94 −0.76 0.137
(−1.58) (−1.27)POSCFO 1.74 0.58∗ 0.071
(1.51) (1.92)NEGCFO −3.29∗∗∗ 0.08 <0.001
(−3.97) (0.08)SALESPS 0.35∗ 0.10∗∗∗ 0.002
(1.91) (3.09)POSBV 0.15 0.07 0.942 0.28 0.16 0.767 0.01 0.22 0.779
(0.22) (0.27) (0.44) (0.59) (0.02) (0.84)NEGBV −0.29 −0.79 0.193 0.02 −0.58 0.320 −0.40 −0.49 0.404
(−0.54) (−1.38) (0.05) (−1.02) (−0.78) (−0.86)SGR 0.63 0.20 0.253 0.71∗ 0.71 0.120 0.81∗∗ 0.64 0.091
(1.57) (0.26) (1.92) (0.93) (2.02) (0.86)FLOAT −10.04∗∗ 0.72 0.014 −8.30∗∗ −1.45 0.018 −10.36∗∗ −0.99 0.009
(−2.40) (0.26) (−2.18) (−0.52) (−2.57) (−0.37)RDPS 1.49 −0.05 0.938 0.58 −0.16 0.989 1.94 0.05 0.852
(0.45) (−0.05) (0.19) (−0.15) (0.60) (0.05)MAJ UND 2.51∗∗ 1.96∗ 0.030 2.16∗ 1.62 0.063 2.12∗ 1.73 0.069
(2.11) (1.69) (1.96) (1.41) (1.80) (1.53)NASD ADJ 0.003∗∗ 0.001 0.020 0.003∗∗∗ 0.000 0.082 0.002∗∗ 0.000 0.048
(2.51) (0.78) (2.65) (0.35) (2.26) (0.56)HIRISK 0.03 −1.72∗∗ 0.131 −0.72 −1.64∗∗ 0.103 −0.06 −1.59∗∗ 0.183
(0.04) (−2.14) (−0.89) (−2.06) (−0.08) (−2.03)WARRANT −1.11 −4.83∗∗∗ 0.015 −1.12 −4.44∗∗∗ 0.023 −1.09 −4.51∗∗∗ 0.016
(−0.72) (−3.08) (−0.78) (−2.81) (−0.72) (−2.99)Adjusted R2 20.75% 28.47% 32.3% 30.61% 23.44% 31.62%
+Difference between Internet and non-Internet firms using an F test (p-value reported). Significant usinga two tailed test at ∗∗∗1% level, ∗∗5% level, ∗10% level.
Definition of VariablesPOSEPS EPS * Dummy for positive earningsNEGEPS EPS * (1-Dummy for positive earnings)POSCFO CFO per share * Dummy for positive cash flowNEGCFO CFO per share * (1-Dummy for positive cash flow)SALESPS Sales per sharePOSBV Book Value per share * Dummy for positive Book ValueNEGBV Book Value per share * (1-Dummy for positive Book Value)SGR Annual Sales Growth in the years prior to the IPORDPS Research and development per shareFLOAT Percentage of shares outstanding offered in the IPOMAJ UND Dummy Variable for major underwriterNASD ADJ Level of NASDAQ adjusted for inflationHIRISK Firms with high risk warnings on page one of their prospectusesWARRANT IPOs that featured multiple components in addition to stock, such as warrants

VALUATION OF INTERNET STOCKS 337
out separately for the two subsamples of Internet and non-Internet firms. FTests are performed to compute the significance of the differences in thecoefficient estimates between Internet firms and non-Internet firms.8
Results for the first specification, with earnings as the performance vari-able, indicate that earnings are insignificant for Internet firms, while positiveearnings (POSEPS) are strongly significant for non-Internet firms. All theother accounting variables—positive book values (POSBV ), negative bookvalues (NEGBV ), and sales growth (SGR) are insignificant for both sets offirms. FLOAT, however, is significantly negative for Internet firms and in-significant for non-Internet firms.
Among the control variables, the inflation-adjusted level of the NAS-DAQ (NASD ADJ ) has a significantly positive coefficient for Internet firmsonly. The coefficient estimate on MAJ UND is significantly positive for bothsamples but is higher for the Internet sample, indicating that firms withprestigious underwriters get higher IPO valuations at the prospectus stagethan firms with small underwriters, and that this difference in pricing ismore pronounced for Internet firms. HIRISK has a significant negativecoefficient for non-Internet firms only, indicating that the offering pricesof only non-Internet firms are discounted for issuing high-risk warnings.WARRANT too has a significant negative coefficient only for non-Internetfirms. R&D (RDPS) is insignificant for both sets of firms.
The second regression uses cash flows as the performance measure.The coefficient on positive cash flow (POSCFO) is significant only for non-Internet firms. Thus, at the early stage of an IPO both earnings and cashflows matter only for pricing of non-Internet IPOs. In addition, for Inter-net firms the coefficient on negative cash flow (NEGCFO) is significantlynegative, while for non-Internet firms this coefficient is insignificant. Oneway to interpret this finding is that negative cash flows for Internet firmsare viewed as investments, perhaps because they are driven largely by cashoutlays on customer development and other intangible assets that are ex-pected to yield high returns in the future. Positive book values and negativebook values continue to have insignificant coefficients for both samples.Sales growth (SGR) is now marginally significant for Internet firms, thoughthe difference in coefficients between Internet and non-Internet firms isinsignificant.
As before, FLOAT has a significantly negative coefficient for Inter-net firms and insignificant coefficient for non-Internet firms and thedifference between the two coefficients is highly statistically significant.
8 To test the differences between coefficients, we re-estimate the regression using the entiresample and interacting each explanatory variable with a dummy variable for Internet and non-Internet firms. For each explanatory variable we thus obtain two coefficient estimates, onefor the Internet firms and the other for non-Internet firms. We then use an F test to test forequality between these two estimates. Note that in general tests for differences in R2 betweentwo models are legitimate only when the dependent variable is the same. In our case, notonly are the dependent variables not the same, they differ substantially in their variation. Forexample, the standard deviations for non-Internet firms and Internet firms are, respectively,4.14 and 4.70 for IPOPRICE and 8.11 and 18.89 for ENDPRICE.

338 E. BARTOV, P. MOHANRAM, AND C. SEETHAMRAJU
The results for the five control variables: MAJ UND, NASD ADJ, RDPS,HIRISK, and WARRANT, are similar to those for the specification withearnings.
The third specification uses sales per share (SALESPS) as the perfor-mance measure. Unlike the other two performance measures, SALESPS isnot partitioned because it is always nonnegative. The coefficient estimateon SALESPS is positive and significant for both Internet and non-Internetfirms. However, the coefficient on SALESPS is significantly greater for In-ternet firms than for non-Internet firms. This implies that Internet IPOsreceive higher sales multiples than other non-Internet IPOs. Sales growth(SGR) continues to be significantly positive only for Internet firms, and thecoefficient is now significantly different from that for non-Internet firms.Positive and negative book values are insignificant for both classes of firms.As before, FLOAT is significantly negative only for Internet firms, and signi-ficantly greater than that for non-Internet firms. The results for the controlvariables are similar to those of prior specifications.
To summarize, at the prospectus stage, positive cash flows, sales, and salesgrowth are the important financial variables for Internet firms, but earningsare not. In addition, Internet firms’ negative cash flows are viewed as invest-ments. For non-internet firms, all three performance measures—positiveearnings, positive cash flows, and sales—are important. Book values appearto be unimportant for both sets of firms. FLOAT is a critical non-financialvariable only for Internet firms. High-risk warnings issued by Internet firmsare not priced at the prospectus stage but are priced for non-Internet IPOs.This last finding may be a reflection of the Internet euphoria the market wasgoing through during our sample period. Finally, market sentiment (levelof NASDAQ) plays a role in the pricing of Internet IPOs alone.9
5.2 REGRESSIONS FOR IPOPRICE
Table 6 presents the regression results for the final offer price, IPOPRICE.As before, we estimate three alternative specifications with earnings, cashflows, and sales as our performance measures.
The results for both Internet firms and non-Internet firms are quite similarto those reported above for PROSPPRICE. The only noticeable difference
9 It is arguable that FLOAT and PROSPPRICE are simultaneously determined, which calls forusing the two-stage least-squares method (2SLS) rather than ordinary least squares (OLS). Totest the sensitivity of our results, we replicate the tests reported in table 6 using 2SLS. In thefirst stage we regress FLOAT on PROSPPRICE and current ratio, a proxy for a firm’s cash needs,and in the second stage we re-estimate the three models after replacing FLOAT with its fittedvalues obtained from the first stage. The results from the first stage indicate that FLOAT isrelated positively to PROSPPRICE and negatively to the current ratio. Still, the results from thesecond stage (not tabulated for parsimony) were generally similar to those reported in table 6.One exception was that FLOAT, while retaining its sign, becomes marginally insignificant. Inaddition, we replicate this 2SLS procedure on a model without the five control variables. Forthis model, the results of the second stage were similar to those reported in table 6 with noexceptions.

VALUATION OF INTERNET STOCKS 339
TABLE 6Regression for IPOPRICE
(t -statistics in parentheses, n = 98)
Model 1: EARNINGS Model 2: CASH FLOW Model 3: SALES
Non- Non- Non-Internet Internet Diff+ Internet Internet Diff+ Internet Internet Diff+
INTERCEPT 4.89 11.59∗∗∗ 3.60 12.28∗∗∗ 5.71∗ 11.72∗∗∗
(1.36) (4.25) (1.10) (4.50) (1.69) (4.52)POSEPS −1.66 2.08∗ 0.303
(−0.44) (1.74)NEGEPS −0.65 0.07 0.865
(−0.98) (0.12)POSCFO 2.25∗ 0.402 0.136
(1.74) (1.26)NEGCFO −3.32∗∗∗ 0.85 0.001
(−3.58) (0.78)SALESPS 0.38∗ 0.07∗∗ 0.017
(1.87) (2.19)POSBV 0.54 0.11 0.775 0.69 0.16 0.531 0.40 0.23 0.669
(0.71) (0.37) (0.95) (0.59) (0.54) (0.80)NEGBV 0.009 −0.63 0.460 0.38 −0.39 0.589 −0.04 −0.34 0.788
(0.02) (−1.03) (0.67) (−0.65) (−0.07) (−0.56)SGR 0.96∗∗ 0.29 0.074 1.05∗∗ 0.67 0.038 1.14∗∗ 0.62 0.028
(2.14) (0.36) (2.51) (0.83) (2.57) (0.77)FLOAT −11.94∗∗ −1.87 0.008 −9.63∗∗ −3.91 0.006 −11.81∗∗∗ −3.62 0.003
(−2.55) (0.64) (−2.25) (−1.34) (−2.64) (−1.28)RDPS 4.25 0.34 0.532 2.94 0.21 0.684 4.43 0.37 0.456
(1.14) (0.29) (0.86) (0.18) (1.23) (0.32)MAJ UND 2.47∗ 2.10∗ 0.048 2.15∗ 1.88 0.053 2.06 1.96 0.076
(1.86) (1.70) (1.74) (1.56) (1.57) (1.63)NASD ADJ 0.004∗∗∗ 0.001 0.003 0.004∗∗∗ 0.000 0.008 0.004∗∗∗ 0.001 0.005
(3.29) (0.82) (3.60) (0.60) (3.19) (0.74)HIRISK −0.38 −1.98∗∗ 0.093 −1.24 −2.04∗∗ 0.030 −0.55 −1.91∗∗ 0.097
(−0.40) (−2.32) (−1.37) (−2.44) (−0.60) (−2.30)WARRANT −1.11 −4.75∗∗∗ 0.042 −1.11 −4.21∗∗ 0.071 −1.11 −4.28∗∗∗ 0.048
(−0.64) (−2.85) (−0.69) (−2.54) (−0.65) (−2.67)Adjusted R2 29.41% 24.09% 39.32% 27.98% 32.56% 27.17%
+ Difference between Internet and non-Internet firms using an F test (p-value reported). Significant usinga two tailed test at ∗∗∗1% level, ∗∗5% level, ∗10% level.
Definition of VariablesPOSEPS EPS ∗ Dummy for positive earningsNEGEPS EPS ∗ (1-Dummy for positive earnings)POSCFO CFO per share ∗ Dummy for positive cash flowNEGCFO CFO per share ∗ (1-Dummy for positive cash flow)SALESPS Sales per sharePOSBV Book Value per share ∗ Dummy for positive Book ValueNEGBV Book Value per share ∗ (1-Dummy for positive Book Value)SGR Annual Sales Growth in the years prior to the IPORDPS Research and development per shareFLOAT Percentage of shares outstanding offered in the IPOMAJ UND Dummy Variable for major underwriterNASD ADJ Level of NASDAQ adjusted for inflationHIRISK Firms with high risk warnings on page one of their prospectusesWARRANT IPOs that featured multiple components in addition to stock, such as warrants
between the determinants underlying PROSPRICE and IPOPRICE is thatpositive cash flows lose their significance for non-Internet firms and be-come marginally significant for Internet firms. Thus, as may be expected,the value drivers underlying the initial prospectus price and the final

340 E. BARTOV, P. MOHANRAM, AND C. SEETHAMRAJU
offer price are similar, although the weight ascribed to each variablemay change in response to new information gathered during the waitingperiod.
5.3 REGRESSIONS FOR ENDPRICE
ENDPRICE is the closing stock price at the end of the first trading day asdefined by CRSP, which is typically the average of the closing bid and askprices. As before, we run three alternative specifications with earnings, cashflows, and sales as our alternative performance measures. We add an addi-tional explanatory variable, PARTIAL, to control for the IPO underpricingresulting from the partial adjustment of the offer price to new informationgathered by the underwriter in the waiting period.
Table 7 presents the regression results for ENDPRICE. For both Internetfirms and non-Internet firms, earnings are insignificant as are the other twoperformance measures, cash flows and sales. Positive book value (POSBV )is positive and generally marginally insignificant for the Internet firms andinsignificant for non-Internet firms. Comparing POSBV across the two sam-ples, however, shows a significantly greater coefficient for positive book val-ues for Internet firms across all specifications.
Sales growth (SGR) has a significant positive coefficient in all specifica-tions for Internet firms, while it is insignificant for non-Internet firms. Asexpected, the coefficient on SGR for Internet firms is significantly greater,indicating that the stock market attaches a higher multiple for sales growthfor Internet firms.
For both samples, FLOAT has significantly negative coefficients in all spe-cifications. For Internet firms, the relative offering size, which was stronglyassociated with IPO pricing at the initial prospectus stage and the finalIPO stage, continues to be important. As hypothesized, and similar to theresults for PROSPPRICE and IPOPRICE, this effect is statistically significantlystronger for Internet firms than for non-Internet firms.
In addition, consistent with findings of prior research, PARTIAL is positiveand highly significant in all three specifications for both samples. Further-more, as expected, PARTIAL has a significantly higher coefficient for Inter-net firms, indicating the strong momentum surrounding Internet stocks inthe time period analyzed.
R&D per share (RDPS) has generally a (marginally) significant positivecoefficient for Internet firms and insignificant coefficient for non-Internetfirms. WARRANT has a significantly negative (insignificant) coefficient fornon-Internet (Internet) firms, indicating the market’s preference for non-bundled issues for non-Internet firms. Unlike the earlier regressions forPROSPPRICE and IPOPRICE, HIRISK is significantly negative for both Inter-net and non-Internet firms. Hence, while high-risk warnings were ignoredin the initial and subsequent pricing of Internet IPOs, the stock market doesfactor these warnings in during the first trading day for non-Internet as wellas for Internet IPOs. The dummy for major underwriters (MAJ UND) and

VALUATION OF INTERNET STOCKS 341
TABLE 7Regression for ENDPRICE
(t -statistics in parentheses, n = 98)
Model 1: EARNINGS Model 2: CASH FLOW Model 3: SALES
Non- Non- Non-Internet Internet Diff+ Internet Internet Diff+ Internet Internet Diff+
INTERCEPT −34.92∗∗ −13.29∗ −30.47∗ −11.73 −27.10∗ −14.01∗
(−2.09) (−1.76) (−1.91) (−1.58) (−1.70) (−1.99)POSEPS −10.32 2.11 0.935
(−0.76) (1.02)NEGEPS −3.93 0.31 0.277
(−1.61) (0.27)POSCFO 1.28 0.20 0.634
(0.25) (0.36)NEGCFO −5.01 1.68 0.393
(−1.39) (0.85)SALESPS 0.28 0.04 0.769
(0.37) (0.76)POSBV 5.32∗ −0.07 0.028 4.21 0.01 0.035 4.50 0.04 0.039
(1.88) (−0.13) (1.47) (0.04) (1.61) (0.09)NEGBV −0.31 0.281 0.949 −0.29 0.38 0.987 −0.59 0.46 0.981
(−0.14) (0.26) (−0.13) (0.36) (−0.27) (0.43)SGR 3.27∗ 1.57 0.022 3.89∗∗ 1.74 0.008 3.75∗∗ 1.86 0.011
(1.95) (1.09) (2.34) (1.22) (2.22) (1.34)FLOAT −43.94∗∗ −10.05∗ 0.020 −40.83∗∗ −11.15∗∗ 0.002 −42.00∗∗ −11.57∗∗ 0.002
(−2.59) (−1.95) (−2.46) (−2.13) (−2.52) (−2.29)PARTIAL 39.51∗∗∗ 29.21∗∗∗ <0.001 36.43∗∗∗ 28.76∗∗∗ <0.001 37.20∗∗∗ 29.87∗∗∗ <0.001
(3.25) (5.25) (3.06) (5.29) (3.12) (5.60)RDPS 24.23∗ −2.31 0.096 21.84 −2.44 0.089 24.62∗ −2.32 0.061
(1.76) (−1.10) (1.61) (−1.20) (1.80) (−1.14)MAJ UND 2.53 1.54 0.753 1.65 1.38 0.777 2.03 1.43 0.808
(0.53) (0.72) (0.34) (0.64) (0.42) (0.67)NASD ADJ 0.009∗ 0.002 0.099 0.008 0.002 0.095 0.007 0.002 0.132
(1.78) (1.51) (1.60) (1.34) (1.49) (1.46)HIRISK −5.68∗ −3.37∗∗ 0.030 −6.36∗ −3.65∗∗ 0.022 −5.62 −3.42∗∗ 0.038
(−1.66) (−2.27) (−1.80) (−2.44) (−1.63) (−2.34)WARRANT −0.30 −6.29∗∗ 0.662 −0.90 −6.17∗∗ 0.740 −1.12 −5.83∗∗ 0.577
(−0.05) (−2.18) (−0.14) (−2.09) (−0.18) (−2.07)Adjusted R2 43.07% 40.48% 43.45% 40.59% 42.24% 41.49%
+ Difference between Internet and non-Internet firms using an F test (p-value reported). Significantusing a two tailed test at ∗∗∗1% level, ∗∗5% level, ∗10% level.
Definition of VariablesPOSEPS EPS ∗ Dummy for positive earningsNEGEPS EPS ∗ (1-Dummy for positive earnings)POSCFO CFO per share ∗ Dummy for positive cash flowNEGCFO CFO per share ∗ (1-Dummy for positive cash flow)SALESPS Sales per sharePOSBV Book Value per share ∗ Dummy for positive Book ValueNEGBV Book Value per share ∗ (1-Dummy for positive Book Value)SGR Annual Sales Growth in the years prior to the IPORDPS Research and development per shareFLOAT Percentage of shares outstanding offered in the IPOPARTIAL Offer Price scaled by midpoint of offer rangeMAJ UND Dummy Variable for major underwriterNASD ADJ Level of NASDAQ adjusted for inflationHIRISK Firms with high risk warnings on page one of their prospectusesWARRANT IPOs that featured multiple components in addition to stock, such as warrants

342 E. BARTOV, P. MOHANRAM, AND C. SEETHAMRAJU
the control for the level of the NASDAQ are generally insignificant for bothInternet and non-Internet firms.10
It is interesting to note that our results for non-Internet firms are byand large consistent with those in Klein [1996], who used a sample of non-Internet IPOs in the period 1980–1991. Like us, Klein documents, amongother things, that the final offer price and the initial market price are posi-tively related to the proportion of equity retained by the entrepreneurs (1-FLOAT), negatively related to whether an offering has other bundled ele-ments (WARRANT), negatively related to high risk warnings (HIRISK) andpositively related to the presence of a prestigious underwriter (MAJ UND).The robustness of the results enhances confidence in the validity of ourfindings and makes it less likely that our findings are obtained by chance.
5.4 �PRICE REGRESSIONS
So far we formally tested for differences in valuations between Internetand non-Internet firms at the IPO stage and at the first trading day. In thissection, we test for valuation differences between the IPO price, IPOPRICE,and the stock price set by investors at the end of the first trading day, END-PRICE, within each set of firms. To this end, we estimate the regressionswith the stock-price change in day 1 (i.e., �PRICE defined as the differ-ence between ENDPRICE and IPOPRICE) as the dependent variable. Asbefore, for both Internet and non-Internet firms we run three specifica-tions with earnings, cash flows, and sales as our alternative performancemeasures.
Table 8 presents the results. Other than PARTIAL, all explanatory vari-ables in the current regression appeared in both the IPOPRICE and END-PRICE regressions, and thus the coefficient on each of these variablesin the current regression (approximately) measures the difference betweenthe corresponding coefficients in the two price regressions.11 For exam-ple, the difference between the coefficients on POSBV for Internet firmsreported in tables 6 and 7 is 4.78 (i.e., 5.32–0.54), which is close to the valueof this coefficient (4.99) reported in table 8.
None of our performance measures are significant for either sample.POSBV is highly significant and positive in all specifications for Internetfirms. Thus, while book values of all sample firms are insignificant at theprospectus and IPO pricing stages, investors of Internet firms do perceive
10 To assess the possibility that our results were obtained by chance, we replicate the testsreported in Table 7 using the closing price at the end of day 7 as the dependent variable.Notwithstanding active trading in our sample firms’ stocks during this seven-day period asevidenced by a substantial share turnover and variation in cumulative stock returns, the resultswere nearly identical. Specifically, the signs of all parameter estimates remain unchanged andthe changes in the magnitudes of the estimates as well as in the R2s were small. The onlynoticeable difference is that the variables SGR and HIRISK become marginally insignificantfor the Internet sample primarily due to increased standard errors.
11 The relation holds only approximately for most but not all variables due to the inclusionof PARTIAL.

VALUATION OF INTERNET STOCKS 343
TABLE 8Regression for Day 1 Price Difference (�PRICE)
(t -statistics in parentheses, n = 98)
Model 1: EARNINGS Model 2: CASH FLOW Model 3: SALES
Non- Non- Non-Internet Internet Internet Internet Internet Internet
INTERCEPT −28.71∗∗ −17.61∗∗∗ −23.70∗ −18.31∗∗∗ −24.00∗ −17.95∗∗∗(−2.06) (−3.26) (−1.77) (−3.53) (−1.82) (−3.49)
POSEPS 0.37 −0.80(0.04) (−0.58)
NEGEPS −2.02 0.348(−1.01) (0.46)
POSCFO 2.46 −0.45(0.62) (−1.11)
NEGCFO 0.31 0.313(0.11) (0.26)
SALESPS −0.04 −0.04(−0.07) (−0.95)
POSBV 4.99∗∗ −0.29 4.91∗∗ −0.32 4.86∗∗ −0.34(2.33) (−0.78) (2.27) (−0.89) (2.28) (−0.93)
NEGBV 0.35 0.31 −0.02 0.29 0.08 0.19(0.21) (0.49) (−0.02) (0.46) (0.05) (0.29)
SGR 2.78∗ 1.32 3.015∗∗ 1.15 2.94∗∗ 1.12(1.91) (1.24) (2.08) (1.09) (2.01) (1.07)
FLOAT −29.48∗∗ −9.24∗∗ −30.75∗∗ −8.59∗∗ −30.97∗∗ −8.55∗∗(−2.04) (−2.46) (−2.11) (−2.3) (−2.15) (−2.29)
PARTIAL 30.05∗∗∗ 20.35∗∗∗ 26.78∗∗∗ 20.38∗∗∗ 27.76∗∗∗ 20.43∗∗∗(2.89) (4.91) (2.61) (5.00) (2.73) (5.07)
RDPS 20.20∗ −1.91 21.76∗ −1.92 21.74∗ −2.03(1.69) (−1.22) (1.84) (−1.27) (1.84) (−1.35)
MAJ UND −0.10 0.07 0.03 0.26 −0.10 0.14(−0.03) (0.04) (0.01) (0.16) (−0.03) (0.09)
NASD ADJ 0.005 0.002 0.005 0.002∗ 0.005 0.002(1.12) (1.45) (1.08) (1.67) (1.03) (1.53)
HIRISK −5.74∗ −1.48 −5.68∗ −1.63 −5.503∗ −1.54(−1.93) (−1.34) (−1.84) (−1.46) (−1.85) (−1.4)
WARRANT −0.18 −0.44 −0.04 −0.44 −0.28 −0.63(−0.03) (−0.21) (−0.01) (−0.22) (−0.05) (−0.31)
Adjusted R2 36.71% 32.3% 36.29% 32.94% 36.67% 33.45%
+ Significant using a two tailed test at ∗∗∗1% level, ∗∗5% level, ∗10% level.
Definition of VariablesPOSEPS EPS ∗ Dummy for positive earningsNEGEPS EPS ∗ (1-Dummy for positive earnings)POSCFO CFO per share ∗ Dummy for positive cash flowNEGCFO CFO per share ∗ (1-Dummy for positive cash flow)SALESPS Sales per sharePOSBV Book Value per share ∗ Dummy for positive Book ValueNEGBV Book Value per share ∗ (1-Dummy for positive Book Value)SGR Annual Sales Growth in the years prior to the IPORDPS Research and development per shareFLOAT Percentage of shares outstanding offered in the IPOPARTIAL Offer Price scaled by midpoint of offer rangeMAJ UND Dummy Variable for major underwriterNASD ADJ Level of NASDAQ adjusted for inflationHIRISK Firms with high risk warnings on page one of their prospectusesWARRANT IPOs that featured multiple components in addition to stock, such as warrants

344 E. BARTOV, P. MOHANRAM, AND C. SEETHAMRAJU
them important. In addition, FLOAT has a significantly negative coefficientfor both samples. This indicates that FLOAT gains added significance aboveand beyond the role it plays in the initial IPO pricing stages. PARTIAL,our proxy for the IPO underpricing, is significantly positive for both sam-ples, confirming our earlier results. SGR has a positive coefficient for In-ternet firms, indicating that growing firms receive a more positive reactionfrom the stock market at their debut. Among the control variables, R&Dand HIRISK are significant only for Internet firms. This indicates that thestock market does give credence to R&D and high-risk warnings for Inter-net firms. Overall, the results show that for non-Internet firms, the first dayprice reaction is related only to FLOAT, while for Internet firms, the first dayprice reaction is related to five variables: POSBV, SGR, FLOAT, RDPS, andHIRISK.
5.5 SENSITIVITY TESTS
In addition to the tests described above, we perform a battery of sensitivitytests to verify the robustness of our results. The main sensitivity tests, whoseresults are not tabulated for the shake of brevity, are outlined below.
In addition to OLS regressions, we also run generalized least squares(GLS) specifications for our regressions to account for any possible cluster-ing in time in our IPO sample. Our GLS results are nearly identical to theOLS results.
Prior studies (e.g., Demers and Lev [2001], Hand [2000b], Rajagopalet al. [2000, and Kozberg [2001]) have examined the relevance of webtraffic measures for valuation of Internet firms and obtained mixed results.If web-traffic measures are correlated with our independent variables, ourresults can be biased. We use Nielsen net ratings to come up with measures ofweb traffic. Factor analysis yields two factors—REACH, which measures thesize of the market that accesses a web site, and STICKINESS, which measureshow long users stay on a given site. We add these two web-traffic measuresto our regressions, setting them to zero for firms for which web traffic is nota meaningful metric (38 out of our 98 firms). REACH is insignificant in allour regressions, while STICKINESS is significant only in the regression forENDPRICE, and only when SALESPS is used as the performance measure.None of the other results are affected in any manner.
Finally, in our original tests, we base our specification for PARTIAL onthe Benveniste and Spindt [1989] model, which assumes that the partialadjustment of the final offer price to information gathered in the waitingperiod is based on private information only and is uncorrelated with anypublic information, such as prospectus data. Loughran and Ritter [2001],however, use prospect theory to show that PARTIAL may also be related topublic information. To assess the possible effect of the correlations betweenPARTIAL and public signals on our findings, we interact PARTIAL withour financial statement variables. The results were essentially unaltered andnone of the interactions were significant.

VALUATION OF INTERNET STOCKS 345
6. Conclusion
We examine the association between financial and non-financial variablesand IPOs’ initial prospectus price, final offer price, and initial stock marketprice, using a sample of Internet firms (the test sample) and a matched-pairsample of non-Internet firms (the control sample). Our focus is on whetherthe value drivers underlying these prices differ between Internet firms andnon-Internet firms, and whether the valuation changes across differentstages in the IPO process.
Our primary two conclusions are as follows. First, there are noticeable dif-ferences between valuations of Internet and non-Internet firms, especially atthe prospectus (PROSPPRICE) and IPO (IPOPRICE) stage. Earnings matteronly for IPOs of non-Internet firms. While positive cash flows are importantfor both samples, negative cash flows are significant only for Internet firms.Internet firms also get much higher multiples of positive cash flows and salesin their IPO valuation. Among the non-financial variables, the relative offer-ing size (FLOAT) is important only for Internet firms, while risk warningsand offer characteristics matter only for non-Internet firms.
Analyzing the day one end price (ENDPRICE) indicates that conventionalfinancial variables such as earnings, cash flows, sales, and book values areinsignificant, whereas non-financial variables such as PARTIAL, FLOAT, andHIRISK are important for both samples, albeit more so for Internet firms.Taken together, these findings suggest that financial variables play a greaterrole in valuation of non-Internet firms, while nonfinancial variables play agreater role in valuation of Internet firms.
Second, there are significant differences between the initial valuation offirms at the prospectus and IPO stage and their valuation by the stock marketat the end of the first trading day. For non-Internet firms, the difference islargely ascribed to FLOAT. For Internet firms, however, positive cash flows,sales growth, R&D, and high-risk warnings are all important in addition toFLOAT.
Our results indicate that the valuation of non-Internet firms generallyfollows the conventional wisdom regarding valuation: positive earnings andcash flows are priced while negative earnings and negative cash flows arenot. The valuation of Internet firms, however, departs from conventionalwisdom, with earnings not being priced and negative cash flows being pricedperhaps because they are viewed as investments. This difference between thetwo classes of firms may be expected, given the age and unique nature ofthe Internet industry.
REFERENCES
BASU, S. “The Conservatism Principle and the Asymmetric Timeliness of Earnings.” Journal ofAccounting and Economics 24(1997): 3–37.
BENVENISTE, L. M., AND P. A. SPINDT. “How Investment Bankers Determine the Offer Price andAllocation of New Issues.” Journal of Financial Economics 24(1989): 33–361.
BUSINESS WEEK. “Internet Stocks: What’s Their Real Worth?” December 14, 1998.

346 E. BARTOV, P. MOHANRAM, AND C. SEETHAMRAJU
DAVIS, A. “The Value Relevance of Revenues for Internet Firms: Does Reporting Grossed-upor Barter Revenue Make a Difference.” Forthcoming, Journal of Accounting Research.
DEMERS, E., AND B. LEV. “A Rude Awakening: Internet Shakeout in 2000.” Forthcoming, Reviewof Accounting Studies.
HAND, J. R. M. “Profits, Losses and the Non-linear Pricing of Internet Stocks.” Working paper,University of North Carolina, Chapel Hill, 2000a.
———.“The Role of Accounting Fundamentals, Web Traffic, and Supply and Demand in thePricing of U.S. Internet Stocks.” Working paper, University of North Carolina, Chapel Hill,2000b.
HANLEY, K. W. “The Underpricing of Initial Public Offerings and the Partial Adjustment Phe-nomenon.” Journal of Financial Economics 34(1993): 231–50.
HAYN, C. “The Information Content of Losses.” Journal of Accounting and Economics 20(1995):125–53.
IBBOTSON, R. G., AND J. RITTER. “Initial Public Offerings,” in R. Jarrow et al., editors. Handbookin Operations Research and Management Science 9, Elsevier B.V.,1995.
KIM, M., AND J. R. RITTER. “Valuing IPOs.” Journal of Financial Economics 53(1999): 409–37.KLEIN, A. “Can Investors Use the Prospectus to Price Initial Public Offerings?” The Journal of
Financial Statement Analysis 2(1996): 23–39.KOZBERG, A. “The Value Drivers of Internet Stocks: A Business Models Approach.” Working
paper, New York University, 2001.LELAND, H. E., AND D. H. PYLE. “Informational Asymmetries, Financial Structure, and Financial
Intermediation.” The Journal of Finance 32(1977): 371–87.LEV, B., AND T. SOUGIANNIS. “The Capitalization, Amortization and Value-Relevance of R&D.”
Journal of Accounting and Economics. 21(1996): 107–38.LOUGHRAN, T., AND J. R. RITTER. “Why Don’t Issuers Get Upset About Leaving Money on the
Table in IPOs?” The Review of Financial Studies (forthcoming).RAJGOPAL, S.; M. VENKATACHALAM; AND S. KOTHA. “The Relevance of Traffic for the Stock
Prices of Internet Firms.” Working paper, University of Washington and Stanford University,2000a.
SCHULTZ, P. “Unit Initial Public Offerings: A Form of Staged Financing.” Journal of FinancialEconomics 34(1993): 199–230.
——— AND M. ZAMAN. “Do Individuals Closest to Internet Firms Believe They Are Overvalued?”Journal of Financial Economics 59(2000): 347–81.
SCHWARTZ, E. S., AND M. MOON. “Rational Pricing of Internet Companies.” Financial AnalystJournal 56(2000): 62–75.
SHLEIFER, A. “Do Demand Curves for Stocks Slope Down?” The Journal of Finance 41(1986):579–90.
TITMAN, S., AND B. TRUEMAN. “Information Quality and the Valuation of New Issues.” Journalof Accounting and Economics 8(1986): 159–72.
TRUEMAN, B.; M. H. F. WONG; AND X. J. ZHANG. “The Eyeballs Have it: Searching for the Valuein Internet Stocks.” Journal of Accounting Research 38(2000): 137–62.
THE WALL STREET JOURNAL. “Is Healtheon Pushing Limits on Revenue?” February 7, 200a, C1.THE WALL STREET JOURNAL. “Plump from Web Sales, Some Dot-Coms Face Crash Diet of Re-
striction on Booking Revenue.” February 28, 2000b, C4.