valuation of companies in financial troubles: the case … 1... · valuation of companies in...
TRANSCRIPT

1
Valuation of Companies in Financial Troubles: The Case of
Eurotunnel
Professor Dr. Andreas Schueler
Universitaet der Bundeswehr Munich
Fakultaet WOW
Department of Finance
85577 Neubiberg
Germany
Phone: 00498960044213
Fax: 00498960044235
Email:[email protected]
www.unibw.de/finance
Key Words : Project Finance, Valuation, Eurotunnel
2
Valuation of Companies in Financial Troubles: The Case of
Eurotunnel
Abstract
The standard approach to DCF valuation assumes that the company to be valued is profitable and
solvent. That usually implies positive taxable income, no major obstacles to obtain external financing
and no financial distress. This paper discusses DCF valuation for firms in need for financial
restructuring by using Eurotunnel as an example. The Eurotunnel is the rail tunnel system which links
the European Continent with the United Kingdom. It was built during 1987 to 1994 for over £10
billion, of which roughly 80% were financed by debt and 20% by equity. No public funds were used.
For both shareholders and lenders the project has been depressing so far: No dividends were paid, the
share price is low, the scheduled interest payments and debt repayments could not be met and had to
be restructured and postponed several times. The company acts at the edge of bankruptcy as forecasted
revenues and the expected operational efficiency were not achieved. Recently, shareholders and
management are asking lenders to write off about 60% of their claims. Lenders could demand early
repayment, sell their claims to other investors, use their collaterals or use their right to substitute the
existing Eurotunnel group by a new operator. They could also send the company into a formal
insolvency proceeding. This case illustrates the issues raised when valuing distressed firms as to
choose between different DCF approaches, to determine the present value of uncertain tax shields, to
measure overindebtedness and to provide a basis for identifying the consequences of different
restruturing packages.
I. Introduction
The British Prime Minister Margaret Thatcher and the French President François Mitterand announced
in January 1986 that a fixed link between the United Kingdom and France will be built following the
proposal submitted by France Manche S.A. and the Channel Tunnel Group Limited, together the later
Eurotunnel Group. The system comprises of two single-track rail tunnels for train and shuttle services
and one service tunnel. The Treaty between both governments stressed the point that the project was to
be financed by private funds only (see Exhibit 1a). Nobody foresaw that it would become one of the
most challenging project finance deals ever. The initial public offering of Eurotunnel in November
1987 was followed by unplanned seasoned equity offers in November 1990, May 1994 and October
1999. The initial debt financing had to be increased in 1990, completely restructured in 1997, when
the project faced insolvency the first time, and revised again in 2002.
Since 2005, Eurotunnel’s management has to negotiate with its lenders again: Operating cash flows
are not even covering interest payable according to the last published accounts for fiscal year 2004
(see Exhibit 5). The company faces insolvency again. Its shareholders are holding shares worth around
3
40 cents a piece, which were priced at £3.5 at the IPO and were quoted at about £11 in 1989.1 They
have never received any dividends. Although the Eurotunnel is a highly frequented way to cross the
Channel and also led to positive infrastructure effects especially in Northern France, which is now
even attracting commuters from London, the project has been a nightmare for lenders and shareholders
(see for example Exhibit 6). What options do investors have? For answering that question, firstly, one
needs to know how much operating cash flow (after taxes and capital expenditures) could be generated
in the future. This requires a cash flow forecast and a DCF valuation of Eurotunnel. Secondly, one has
to think about how to distribute those cash flows. Will lenders approve the proposal made by
shareholders and management to write off around 60% of loans outstanding, which currently amount
to £6,354 million? Will lenders accept a debt-equity-swap as they did in 1997? A DCF valuation is
necessary also in order to answer these questions. As the Eurotunnel project can be described – at least
under the assumptions made later in the paper – as financially distressed, the analyst is required to
develop a consistent valuation scheme. We will start off with the APV(Adjusted Present Value)
approach, since it enables us to differentiate between the present value of operating cash flows after
capital expenditures and taxes, the value of tax shields caused by debt financing and the expected loss
of creditors’ claims. It will be shown also how the WACC (weighted average cost of capital), FTE
(Flow to Equity) and CCF (Capital Cash Flow) approach can be used for the case.
Section II will introduce the project’s history, technical description and operating performance thus
far. Section III will then discuss DCF valuation for financially troubled firms based upon the related
literature,2 before those techniques are applied to the case in Section IV.
The case has been chosen for illustrating the use of DCF valuation for financially troubled firms. That
implies that we are not discussing other interesting aspects of the case like conflicts of interest in the
founding group of investors and constructions companies, hold-up problems during the negotiations,
the reliability of the cash flow forecasts published.
It is important to note the following disclaimer: The conclusions drawn depend heavily upon the
assumptions chosen. We do not claim to value Eurotunnel properly; our valuation is based upon
estimates.
1 Currently, the share has been suspended from trading at the stock exchanges in Paris and London. 2 See Section III.

4
II. Case Background3
1. Technical Description
The construction of the Eurotunnel began in December 1987. On May 6th 1994 most of the
construction was completed and the tunnel was officially inaugurated by Queen Elizabeth II and
François Mitterand.
The tunnel links the terminals in Folkstone/Britain and Coquelles/France. Its approximate length is 31
miles. The two rail tunnels are single-track rails and are used for trains running in one direction only.
The maintenance tunnel is connected to each of the rail-tunnels and serves as a safe haven in case of
accidents. In addition, there are four crossover points where trains can switch between the two rail
tunnels while maintenance work is being carried out. On both sides of the channel, the terminals have
direct access to motorways in order to ensure a fast travel experience.
The capacity of the tunnel is measured in standard paths per hour in each direction. The signalling
system currently allows for 20 standard paths per hour in each direction. Eurotunnel uses 50% of the
capacity, the remainder is used by other train operators (Eurostar and railfreight services by railway
operators). Management believes that it can increase capacity to 24 paths per hour in each direction,
although utilization of all 24 paths will require improving traction power supply.
The operations of the Eurotunnel Group include shuttle business, railway business and ancillary
business. The latter does not account for more than 5% of total revenues.
Firstly, Eurotunnel is a transportation service provider for freight and passengers. It can provide that
service all year long, i.e. 24 hours on 365 days a year.
• Currently 9 passenger shuttles carry cars, caravans, trailers and coaches from one side of the
Channel to the other. They can carry either 180 cars or 120 cars and 12 coaches. Passengers
remain within their vehicles throughout the journey, which takes approximately 35 minutes. In
peak times the system can ensure 4 departures per hour in each direction. Prices range from £39
per one way trip during off peak times for frequent travellers to £279 one way from Calais to
Folkestone with a flexible ticket. The number of departures per year is 39,342 for 2001.4 • 16 freight shuttles carry on average 20 trucks (heavy goods vehicles, HGV). The drivers travel
separately from their vehicles in ‘Club cars’ in order to enhance their safety. In peak times the
system can handle 7 departures per hour in each direction. Tariffs are negotiated annually with
freight customers on an individual basis. The number of departures is just over 60,000 per year.5
3 The information presented in this section is taken from the prospectus published for the IPO 1987, the SEO
1990 and 1994, the financial restructuring 1997 and the annual reports of the company from 1987 to 2004;
see the references for details. 4 See Eurotunnel, Redemption of Equity Notes Prospectus, 2002, p. 14. 5 See Eurotunnel, Summary Annual Report 2004, p. 5.

5
Secondly, the group manages the capacity not used for shuttle services and the infrastructure of the
tunnel.
• It provides capacity for the Eurostar train and the Through Railfreight Services. Eurostar offers
transportation for passengers between London and Paris as well as between London and Brussels.
Some other connections, e.g. London to Avignon in Southern France, are served as well. Railway
companies use three different types of trains for freight services through the tunnel. There are
intermodal trains, consisting of wagons carrying containers, conventional trains carrying palletised
wrapped goods and automotive trains for the transport of cars. The annual fees consist of a fixed
annual charge and a variable charge. The latter depends on the number of passengers respectively
tons of freight passing the tunnel. A toll formula is used which also refers to inflation and volume
thresholds. In addition, until November 2006 the railways are obliged to make payments to
Eurotunnel, if usage is below a minimum level.
• Eurotunnel leases space to retailers in the terminals on either side of the channel. The tenants have
to pay a fixed amount and/or a variable fee as a percentage of revenues.
• It provides infrastructure for commercial telecommunications business. This activity consists of
laying and maintaining fibre optic cables in the tunnel.
2. Competitors
Generally speaking, Eurotunnel operates in the market for Channel crossings. Its core focus lies on the
market for the so called Short Straits. This market segment includes routes between Dover, Folkestone
or Ramsgate in the United Kingdom and Calais, Zeebrugge or Dunkerque on the European continent.
Truck traffic concentrates on these Short Straits because of a fast Channel crossing and the variety of
alternative carriers. Eurotunnel’s main competitors are ferry operators like P&O Ferries, SeaFrance,
Hoverspeed, Norfolkline and SpeedFerries. Competition in the passenger shuttle business between
Britain and France arises also from low cost airlines offering another fast means of transportation and
serving a variety of destinations.
Nevertheless, Eurotunnel is convinced to have three competitive advantages (at least compared to the
ferries):
• Speed: Travelling time between autoroutes in France and motorways in Britain is shorter than for
competing services.
• Frequency of departures: None of its rivals can match its frequency of departures.
• Dependability: The operating of the tunnel is not affected by adverse weather conditions.
Customer research has shown that passenger shuttle services are considered to be very good and
customer loyalty has proven to be very high.

6
3. History
The following time line gives on overview of the history of Eurotunnel from the project proposal to
the present.
a) Project Launch
1985 March Initiation of the project by the British and French governments 1986 January Proposal of a rail tunnel system is chosen by the governments February Franco-British Channel Tunnel Treaty is signed March Signing of the Concession Agreement by the French and British
governments, Channel Tunnel Group Ltd. and France Manche S.A.: BOOT-Project,6 concession period until July 2042
August Eurotunnel group is founded Construction Contract is signed (commissioning date scheduled for May 1993)
Sep./Oct. First tranche of equity: £46 million provided by the founding consortium Second tranche of equity: £206 million provided by institutional investors
1987 July Ratification of the Treaty; Railway Usage Contract signed with British Rail and SNCF7
November Credit Agreement: £5 billion; over 200 participating banks IPO: £770 million
b) Construction 1987 December Start of tunnelling 1989 July First violation of covenants of the Credit Agreement 1990 October Additional £1.8 billion bank loan, £300 million European Investment
Bank (EIB) facility November Seasoned equity offering (SEO): £568 million December Breakthrough in the service tunnel
In exchange for waiving Eurotunnel’s claims against the governments the concession period is extended to July 2052
1991 November Additional loan facility of £200 million by European Coal and Steel Community (ECSC)
1992 March Violation of covenants 1993 / 1994 Dec. - May Completion of the tunnel, fitting out, testing c) Operation 1994 May Official inauguration
Additional credit facility £647 million SEO £858 million
July First rail freight trains, truck shuttles November First Eurostar service December First passenger shuttle 1995 June First coach shuttle September Standstill: Eurotunnel stops interest payments on junior debt 1996 October Eurotunnel and banks outline financial restructuring November Fire in the tunnel caused by a truck on a freight shuttle 1997 July Shareholders agree with financial restructuring in extraordinary general
meeting Governments grant extension of the concession period until 2086 against 59% (incl. taxes) of pre-tax income starting 2052
November Lenders agree with financial restructuring plan 6 BOOT: Build, Own, Operate and Transfer. 7 SNCF: Société Nationale des Chemins de Fer

7
1999 November SEO for funding debt repurchases 2002 May Restructuring claims of creditors: Buy back of subordinated debt below
face value in exchange for new bonds 2003 September Opening of the first part of the high speed line between
Folkestone and London (UK terminal to Fawkham Junction, North Kent)2004 February Eurotunnel subsidiary is granted a rail operator’s licence in France Spring Revolt of shareholders leading to a change in management and
demanding (in vain) financial support by the governments 2005 until present
April Eurotunnel obtains the waiver to the Credit Agreement required and starts the renegotiation of its capital structure
4. Construction
Due to the delays and technical difficulties during construction and also due to the unexpectedly high
costs for the so called procurement items, mainly the specially designed shuttles, the financial capacity
provided by the initial equity contributions (Equity 1 financed by the founding consortium, Equity 2
provided by institutional investors), by the IPO and the initial debt contracts was already strechted
beyond budget in 1989. Before granting more loans, the banks required Eurotunnel to raise additional
equity. This was achieved by the successful equity offering in November 1990, which resulted in an
increase in equity of £568 million. Total loan facilities were increased from about £5,000 million to
£7,300 million after that. Exhibit 3b summarizes those financial transactions and the next seasoned
equity offer in 1994 as well as the additional senior debt financing of £647 million in 1994. Exhibit 3a
shows how the construction costs estimated initially more than doubled till 1994 when the system was
expected to operate fully. The cost overruns led to intense discussions between the Eurotunnel group
and the construction consortium Trans Manche Link (TML) and also between the Eurotunnel group
and the governments represented by the Intergovernmental Commission. One might note that during
the start up phase the construction companies arguably faced a considerable conflict of interests: they
were sitting on both sides of the table while negotiating the construction contract, since they were both
founding shareholders (see Exhibit 2), i.e. principals, as well as agents, who had to design and build
the tunnel and order shuttles etc. It also became clear that not all of the system’s design had been
specified clearly enough in advance. Safety prescriptions imposed by the IGC led to changes in the
design of the tunnel and the shuttles leading to compensatory claims on behalf of Eurotunnel for the
increased costs. Eurotunnel and the IGC settled their disputes on those issues in December 1993 as
Eurotunnel waived its claims in exchange for a prolongation of the concession period from July 2042
to July 2052.
The total cost until opening increased also because of the delayed opening. Instead of an opening in
May 1993, the system was fully operational only by the end of 1994. The cash inflows were therefore
postponed by one and a half years.
Besides that, mangement’s cash flow forecast became less optimistic over time. Exhibit 4a
summarizes the forecasts published for the various seasoned equity offerings. Based upon the cash
8
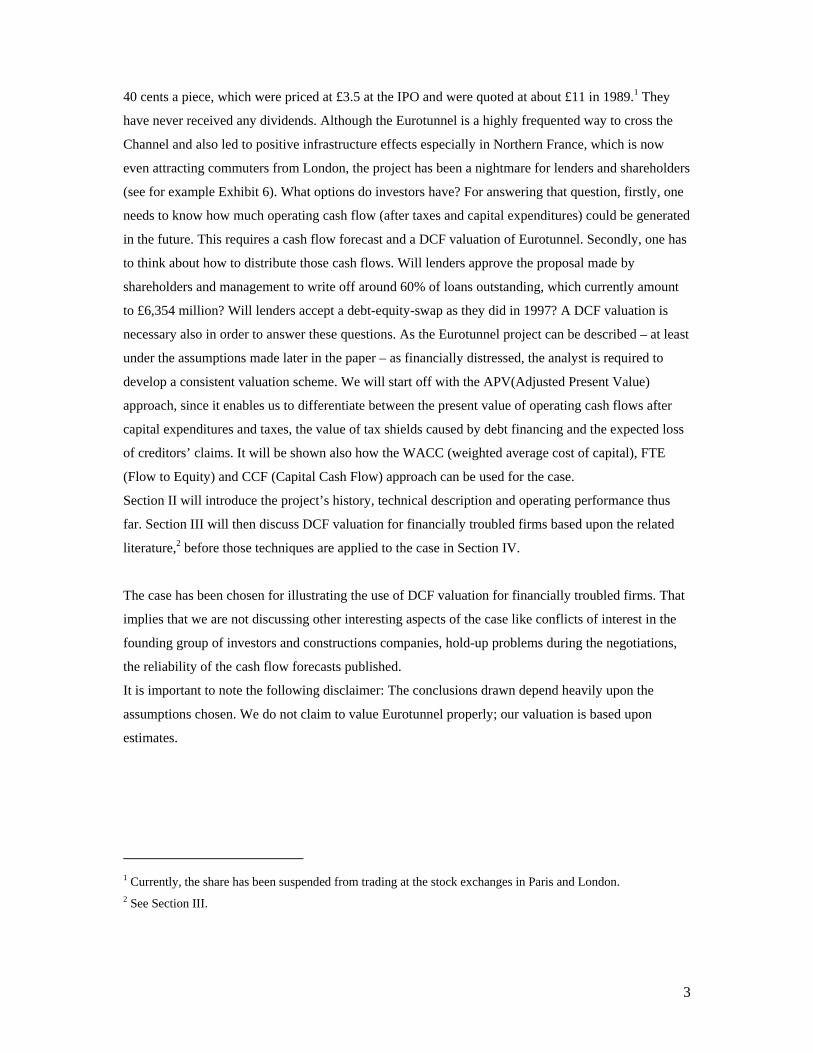
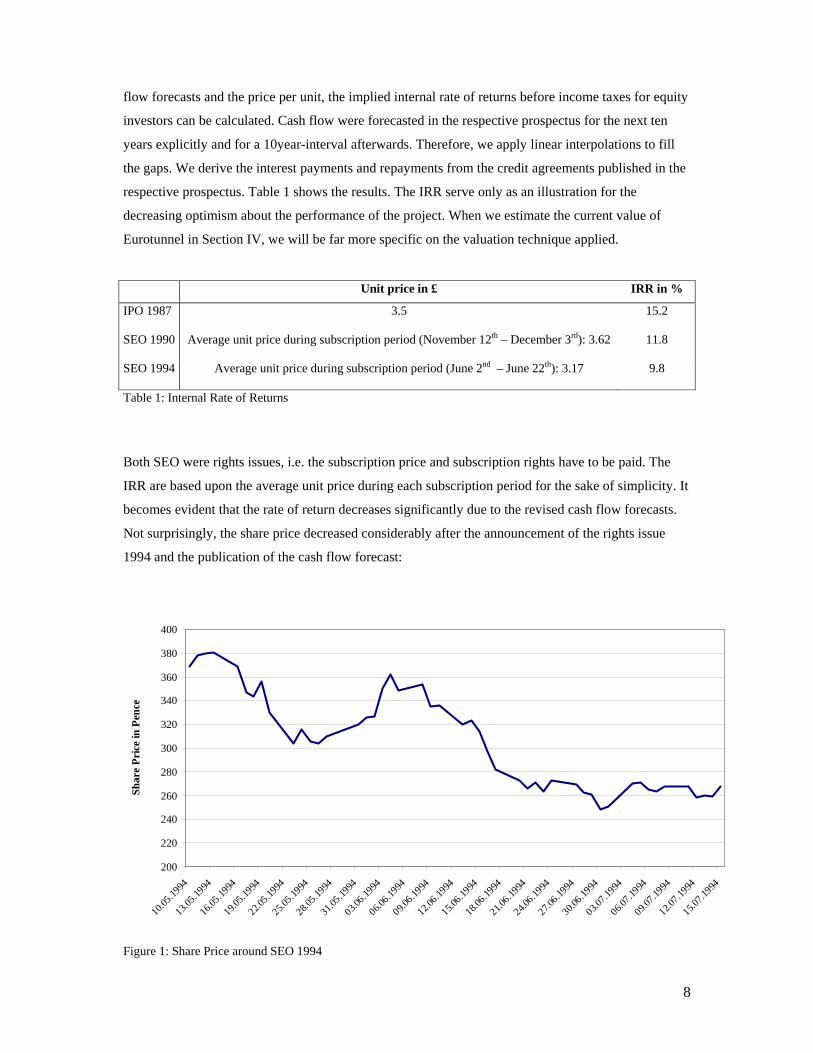
flow forecasts and the price per unit, the implied internal rate of returns before income taxes for equity
investors can be calculated. Cash flow were forecasted in the respective prospectus for the next ten
years explicitly and for a 10year-interval afterwards. Therefore, we apply linear interpolations to fill
the gaps. We derive the interest payments and repayments from the credit agreements published in the
respective prospectus. Table 1 shows the results. The IRR serve only as an illustration for the
decreasing optimism about the performance of the project. When we estimate the current value of
Eurotunnel in Section IV, we will be far more specific on the valuation technique applied.
Unit price in £ IRR in %
IPO 1987 3.5
15.2
SEO 1990 Average unit price during subscription period (November 12th – December 3rd): 3.62
11.8
SEO 1994 Average unit price during subscription period (June 2nd – June 22th): 3.17
9.8
Table 1: Internal Rate of Returns
Both SEO were rights issues, i.e. the subscription price and subscription rights have to be paid. The
IRR are based upon the average unit price during each subscription period for the sake of simplicity. It
becomes evident that the rate of return decreases significantly due to the revised cash flow forecasts.
Not surprisingly, the share price decreased considerably after the announcement of the rights issue
1994 and the publication of the cash flow forecast:
200
220
240
260
280
300
320
340
360
380
400
10.05
.1994
13.05.19
94
16.05
.1994
19.05.19
94
22.05
.1994
25.05.19
94
28.05.1
994
31.05
.1994
03.06.19
94
06.06
.1994
09.06.19
94
12.06
.1994
15.06.19
94
18.06.1
994
21.06.19
94
24.06.19
94
27.06
.1994
30.06.19
94
03.07.1
994
06.07.19
94
09.07.1
994
12.07.19
94
15.07.1
994
Shar
e Pr
ice
in P
ence
Figure 1: Share Price around SEO 1994

9
5. Operations from Opening to Present
After Eurotunnel became fully operational at the end of 1994, it seized a large market share fairly
quickly. However, it did not meet the forecasted cash flows also because of lower than expected
revenues. Those were due to price wars with its direct competitors, the ferry companies. Eurotunnel
competes also with discount airlines like RyanAir which are serving flights between London and other
European cities. Unfortunately, not only prices but volumes also failed to meet expectations. Table 2
shows how many vehicles, passengers and tons of freight have been transported over the last 10 years
by shuttle and train.
1994 1995 1996 1997 1998 1999 2000 2001 2002 2003 2004Truck Vehicles (000) 65 391 519 267 705 839 1,133 1,198 1,231 1,285 1,281Car Vehicles (000) 82 1,224 2,097 2,340 3,351 3,260 2,784 2,530 2,336 2,279 2,101Coach Vehicles (000) 0 24 58 65 96 82 79 75 72 72 63Eurostar Passengers (million) 0.16 2.92 4.87 6 6.3 6.6 7.1 6.9 6.6 6.32 7.28Freight (million metric tons) 1.1 1.9 2.4 2.8 3.1 2.9 2.9 2.4 1.5 1.7 1.9Market Shares (Short-Straits) (%) Truck 8 36 41 14 33 35 43 42 41 43 n.a. Car 3 30 41 37 49 51 51 50 47 47 n.a. Coach 0 13 27 28 39 34 35 35 33 36 n.a. Table 2: Eurotunnel Traffic Volumes8
1995 was the first year of full operations. The fire at the end of 1996 had a negative effect on tunnel
traffic in 1997 because of repairment works. The system was shut down for almost 6 months. Table 3
compares the forecasts for 2003 with the actual figures. The number of passengers per car and coaches
and the tons per HGV (heavy goods vehicle) are estimated in analogy to the IPO prospectus of
Eurotunnel. It becomes evident that especially the number of passengers transported was heavily
overestimated.
Passengers (millions) Freight (million tons) Actual Cars · 2.55 5.81 Coaches · 25 1.80 Eurostar 6.32 Sum 13.93 Actual HGV · 11.7 15.03 Rail Freight 1.70 Sum 16.73 Forecast ET 1987 39.5 21.1 ET 1990 44.6 26.8 ET 1994 35.8 25.3 Table 3: Traffic Volumes 2003: Forecast vs. Actual Figures
8 Source: Eurotunnel; Fitch Rating.

10
The increase in the number of passengers travelling with Eurostar increased form 2003 to 2004,
because of the opening of the first part of the high speed line between the UK terminal and London.
Thanks to the completion of the second half by 2007, the time for a train journey from London to Paris
will be further reduced by 15 minutes to 2 hours and 25 minutes. Nevertheless, this high speed link
comes late compared to the French side where the high speed link has already been provided for.
However, not only the expectations concerning prices and traffic volumes but also concerning
operational efficiency were not met. Operating costs in percent of revenues were expected to be 19%
(IPO 1987), 25% (SEO 1990) and 27% (SEO 1994) respectively. In fact, they were 53% from 1995 to
2004 on average. Exhibit 4b summarizes additional key figures for that period.
In accordance with Clause 34 of the Concession Agreement (see Exhibit 1b), Eurotunnel submitted a
feasibility study on a drive through tunnel to the British and French governments at the end of 1999. In
doing so, Eurotunnel preserves an exclusive option to construct a second fixed link without any need
to take a decision until 2010.9 If no agreement is reached between the governments and Eurotunnel,
the governments are entitled to grant a concession to another company. In that case, the second link is
not allowed to be opened before 2020.
As is also shown in Exhibit 4b, ancillary revenues decreased considerably from 1999 to 2000 due to
the abolition of duty free sales in July 1999. The ancillary business nowadays comprises of minor
activities in retail outlets at the terminals, development activities at both ends of the tunnel and
telecommunications as Eurotunnel continues the development of its fibre optic cable activity. It ceased
its telecommunications operator business in 2000.
In 2001, major disturbances to the train schedules were caused by asylum seekers. In order to reach the
United Kingdom, they were trying to gain illegal access to the tunnel system and freight trains. That
year alone, 50,000 interceptions were made by the officials. The problem has now been solved by
better surveillance. In addition, a nearby camp for asylum seekers in France, which served as a starting
point, has been closed down.
Rail business has been subsidized by the rail usage contract for years, since revenues were protected
by the minimum usage charge. That charge has been paid by the railways, as rail traffic has been far
below expectations. In 2004, this protection amounted to £67 million out of total rail revenues of £234
million. By the end of November 2006 this provision expires, endangering even the current level of
rail revenues. A crucial issue for improving rail capacity utilization is the pricing policy. According to
Eurotunnel, due to its heavy debt burden it cannot risk to offer lower usage charges to railway
operators.
Europorte 2, an Eurotunnel’s railway operating subsidiary, has obtained a Rail Operators Licence from
the French authorities. That licence is valid for the international transportation of goods on the tracks
belonging to the Trans-European Rail freight network. 9 Considering the troubles Eurotunnel is facing already, the value of that option is questionable. We do not try to
price it, when we value the company in Section IV.

11
Eurotunnel currently tries to improve its cash flow by the project DARE (Deliver Actions to Revitalise
Eurotunnel). Steps to be taken within that project are for example reshaping the agreements with HGV
hauliers, adjusting the capacity for freight shuttles accordingly, reducing the capacity for car shuttles
and reviewing sub-contractor and supplier contracts.
6. Financing from Opening to Present
Failure to deliver forecasted results imposed financial constraints on Eurotunnel, for it was not able to
meet the contractual interest and repayment schedule. Eurotunnel’s Board decided to suspend interest
payments on junior (subordinated) debt in September 1995 in order to renegotiate the capital structure
under a standstill provision. The standstill, due to expire in May 1997, was extended by the lenders till
December 1997. A restructuring plan was developed with the lenders leading for example to a major
debt-equity-swap, reduction in interest rate risk exposure, postponement of interest payments and
repayments. The extraordinary shareholder meeting in July 1997 approved the restructuring plan. The
restructuring agreement was signed by the banks and Eurotunnel in January 1998. The main features
of the debt-equity-swap were:
• Decrease of the amount of junior debt by exchanging part of it for new shares (£908 million).
• Exchange of junior debt partially for equity notes (£906 million), participating loan notes (£1,092
million) and a resettable facility (£1,366 million). Meanwhile, the equity notes have been
exchanged into new units until the end of 2003. That – together with the debt-equity-swap – led to
a dilution of the equity held by prior unitholders to 39.4%. The participating loan notes and the
resettable facility postponed the repayment to 2040 and 2050 respectively (see Exhibit 9 for
details).
Not as a part of the restructuring agreement, however linked to the critical financial condition of the
project, the French and British government approved an extension of the concession period to 2086 in
July 1997. That prolongation is to be paid for by a total annual sum, including corporate taxes, equal
to 59% of the Group’s pre-tax profits from 2052 on.10
After the completion of the financial restructuring Eurotunnel’s debt has been trading in the secondary
debt market at considerable discounts to its face value. As Eurotunnel’s management puts it:
‘Purchasing debt at such discounts continues to present an attractive opportunity to reduce the Group’s
indebtedeness and interest obligations and to accelerate its financial recovery’.11 Thus, Eurotunnel
bought back debt with a face value of around £360 million in 1999. In order to finance further
repurchases of about £150 million, the group issued new shares in October 1999. The repurchases
were made at prices ranging from 26% to 52% of face value.
10 See Eurotunnel, Annual Report 1997, p. 60. 11 See Eurotunnel, Rights Issue Prospectus 1999, p. 1.

12
In 2000 and 2001 minor amounts of debt were repurchased at the market and so called stabilisation
advances and deferred interest accounts were built up for interest which was not covered by cash
generated. Postponement of interest payments amounted to £83 million in 2001.
A large portion of the equity notes mentioned above were converted into shares (units) in 2002. With
the proceeds from an issue of £740 million of bonds (called Tier 1A), Eurotunnel bought back £840
million of debt at an average price of 43% of face value and refinanced £343 million of its junior debt.
The last equity notes were converted into units in 2003. Additionally, £155 million of debt were
settled at a discount of about 58% of face value.
The company experienced a shareholder revolt which led to a change in management during spring
2004. The mainly french shareholders (see Exhibit 6) urged the governments to provide financial
support for Eurotunnel. The governments declined that request referring to Article 1 of the Treaty
between France and the UK and Clause 2 of the Concession Agreement (see Exhibit 1a and 1b). And
finally, it became obvious during 2004 that the beginning of repayments in 2006/2007 will become a
major problem for Eurotunnel as its operating cash flows are still not covering its interest obligations.
This problem will become even more severe from 2006 onwards, when the stabilisation period ends
and interest which cannot be paid in cash cannot be settled by using stabilisation advances anymore.
Exhibit 7 and 8 summarize the development of the capital structure. At the end of 2004 total loans
outstanding amounted to £6.354 billion. Total financial charges of £331 million exceeded the net
operating cash flow of £283 million (see Exhibit 5). A major restructuring effort is necessary again.
7. Current Financial Status
On 5 April 2005, Eurotunnel requested an exemption of the covenants in the Credit Agreement from
its creditors. Two weeks later, senior debt holders and co-financiers gave Eurotunnel the waiver to the
Credit Agreement enabling it to start renegotiations. This waiver has been extended recently till 12th
July 2006.12 During the presentation of the preliminary results for 2004 Eurotunnel estimated that the
maximum amount the group could bear was somewhere between £2.3 billion to £2.7 billion.13 They
expect the lenders to write off the remainder. A representative of the Ad hoc Credit Committee (see
below), responded that ‘Eurotunnel’s suggestion will not be acceptable to the majority of debtholders,
whose support is necessary for any capital restructuring. We look forward to starting negotiations
within the framework of Eurotunnel’s existing obligations and in the spirit of economic realism’. The annual general meetings in France and the UK once again confirmed that shareholders and
management, represented by the chairman of the joint board, Jacques Gournon, favour a write-off. In
February 2006 Eurotunnel announced the validation of a Memorandum of Agreement with the
12 See Eurotunnel, Press Release 26th April 2006. 13 See Fitch Ratings, Eurotunnel and Related FLF1 & FLF2 Debt Vehicles – How Far Underwater Are They?,
May 2005.

13
Committee concerning the (strictly confidential) outline of the restructuring of its debt.14 Currently, the
company is trying to get a restructuring package approved by all lenders.
The Ad hoc Credit Committee consists of MBIA (an US credit insurer), the European Investment
Bank, Franklin Mutual Advisers LLC. and Oaktree Capital Management. It represents 21% of senior
debt and 73% of Junior debt, the 4th Tranche Debt and the Tier 1A Debt.15 Looking back to the
restructuring in 1997, one possible option from the lenders’ point of view is a debt-equity-swap, which
will lead to further dilution for the existing shareholders and would have to be approved by an
extraordinary general meeting. The Concession Agreement also grants the right of substitution to the
lenders (see Exhibit 1b). That right allows the lenders to substitute the current concessionaires, the
Eurotunnel group, with new concessionaires, if Eurotunnel fails to make the payments required by the
financing agreements for example. Assets owned by the Eurotunnel group are used as collaterals for
different tiers of its debt. The Credit Agreement defines events of default which allow the lenders to
demand early repayment (see Exhibit 9). Thus, lenders could send Eurotunnel into bankruptcy, sell
their claims to other other investors,16 use their right of substitution or use their collaterals.
One could argue that either the outcome of a legal bankruptcy procedure or using the right of
substitution would not alter much of the core business of a fixed link operator. Crucial questions
remain to be answered: Can Eurotunnel be seen as a going concern company?17 How much cash flow
can be generated by Eurotunnel in the future?
III. Valuation of Financially Troubled Companies
1. APV Approach
The APV approach is used to start the valuation of Eurotunnel since its main idea is to evaluate a
company step by step. That is particularly useful for companies with several business units, heavy debt
burden and financial distress. We start with describing its standard procedure: Firstly, the unlevered
value of the company (VU) is derived by discounting unlevered cash flows (CU; operating cash flows
after capital expenditures and taxes) with the unlevered cost of equity (rU):18
14 See Eurotunnel, Press Release 2nd February 2006. 15 See Eurotunnel, Press Release 2nd February 2006. 16 Goldman Sachs and Macaquire have been mentioned in that context recently; see Fincancial Times
Deutschland, 16th May 2006, p. 7; Eurotunnel, Press Release 15th May 2006. 17 That question is also being asked by the auditors in the preliminary annual report for 2004. Their answer is:
yes, if financial restructuring is successful. Currently, the continuation of the project depends upon the
approval of a financial restructuring package; see Eurotunnel, Share Price Review: April 2006. 18 See e.g. Modigliani/Miller (1958, 1963); Myers (1974); Inselbag/Kaufold (1997); Luehrmann (1997). rU is
assumed to be constant.
14
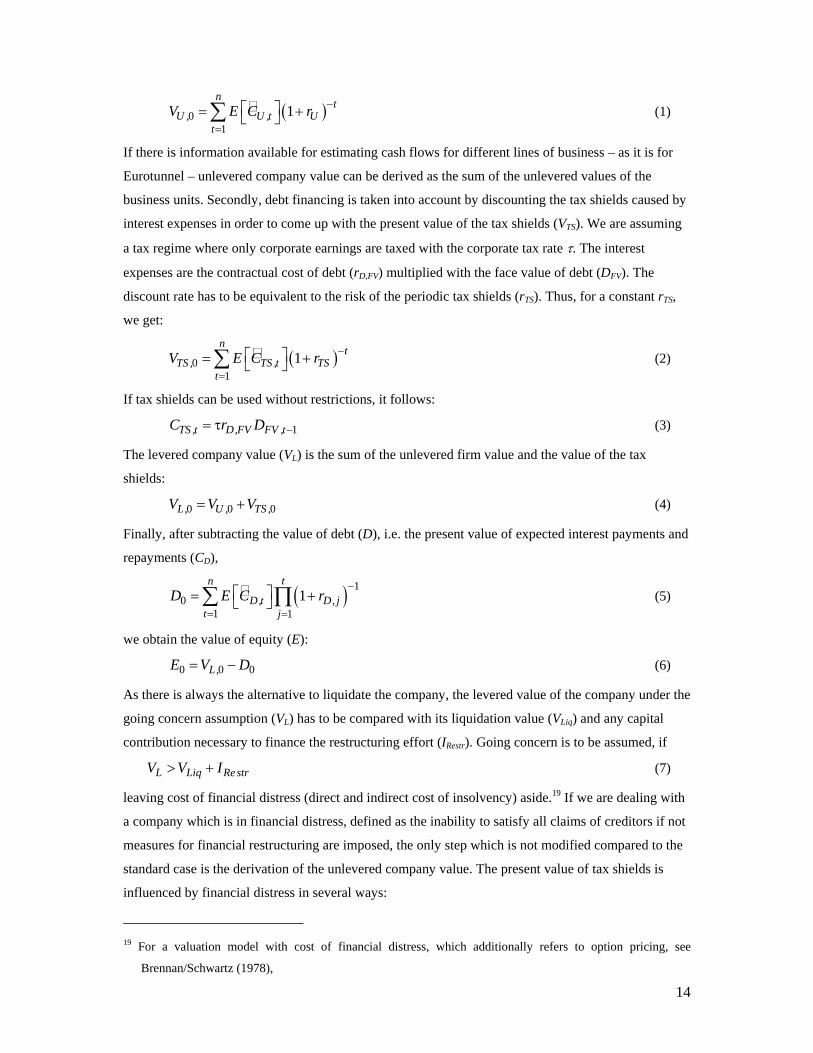
( )01
1n
tU , U ,t U
tV E C r −
=
⎡ ⎤= +⎣ ⎦∑ (1)
If there is information available for estimating cash flows for different lines of business – as it is for
Eurotunnel – unlevered company value can be derived as the sum of the unlevered values of the
business units. Secondly, debt financing is taken into account by discounting the tax shields caused by
interest expenses in order to come up with the present value of the tax shields (VTS). We are assuming
a tax regime where only corporate earnings are taxed with the corporate tax rate τ. The interest
expenses are the contractual cost of debt (rD,FV) multiplied with the face value of debt (DFV). The
discount rate has to be equivalent to the risk of the periodic tax shields (rTS). Thus, for a constant rTS,
we get:
( )01
1n
tTS , TS ,t TS
tV E C r −
=
⎡ ⎤= +⎣ ⎦∑ (2)
If tax shields can be used without restrictions, it follows:
1TS ,t D,FV FV ,tC r D −= τ (3)
The levered company value (VL) is the sum of the unlevered firm value and the value of the tax
shields:
0 0 0L, U , TS ,V V V= + (4)
Finally, after subtracting the value of debt (D), i.e. the present value of expected interest payments and
repayments (CD),
( ) 10
1 11
tn
D,t D, jt j
D E C r−
= =
⎡ ⎤= +⎣ ⎦∑ ∏ (5)
we obtain the value of equity (E):
0 0 0L,E V D= − (6)
As there is always the alternative to liquidate the company, the levered value of the company under the
going concern assumption (VL) has to be compared with its liquidation value (VLiq) and any capital
contribution necessary to finance the restructuring effort (IRestr). Going concern is to be assumed, if
L Liq Re strV V I> + (7)
leaving cost of financial distress (direct and indirect cost of insolvency) aside.19 If we are dealing with
a company which is in financial distress, defined as the inability to satisfy all claims of creditors if not
measures for financial restructuring are imposed, the only step which is not modified compared to the
standard case is the derivation of the unlevered company value. The present value of tax shields is
influenced by financial distress in several ways:
19 For a valuation model with cost of financial distress, which additionally refers to option pricing, see
Brennan/Schwartz (1978),
15
• Taxable income might not suffice for generating a tax shield on interest expenses in the period
they occur. Depending upon future prospects it might also be impossible to use the tax shields in
later periods.
• The interest rate might be affected by the financial troubles, if e.g. it increases with deteriorating
profitability and liquidity ratios.
• If one or both of these conditions are fulfilled the rate for discounting the periodic tax shields is
not equal to the risk free rate anymore. Other authors, as Laitenberger/Lodowicks (2005),
Kruschwitz/Lodowicks/Loeffler (2005) and Drukarczyk/Schueler (2006) are using the risk free
rate also for financially distressed firms, assuming that tax shields can be used with certainty. The
question arises which discount rate has to be applied instead of the risk free rate. Looking through
the literature one has to conclude currently that this issue is adressed in a few contributions based
upon examples but has not been resolved analytically yet. Ruback (2002) suggests to use the
unlevered cost of equity.20 There might be cases for which rU is the risk equivalent rTS. However, it
is not compelling, that periodic tax shields, which are limited to the tax rate multiplied with
interest expenses in scenarios without default and which might be zero although unlevered cash
flow is still positive in scenarios with default, are as risky as unlevered cash flows.
Finally, it has to be considered that for computing the value of equity one has to subtract the present
value of expected payments to the lenders (D) from levered firm value and not the face value of debt
(DFV). If the risk of default is not compensated ex ante by imposing a sufficiently high contractual cost
of debt for example, we will observe D < DFV.21
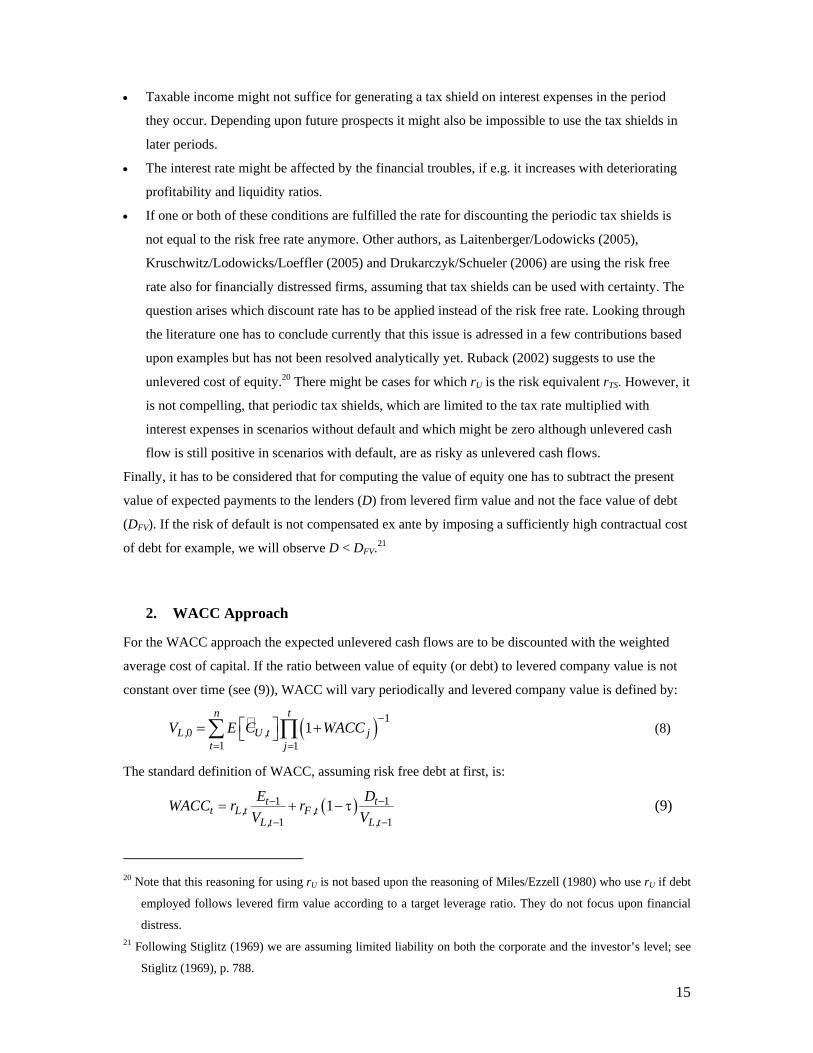
2. WACC Approach
For the WACC approach the expected unlevered cash flows are to be discounted with the weighted
average cost of capital. If the ratio between value of equity (or debt) to levered company value is not
constant over time (see (9)), WACC will vary periodically and levered company value is defined by:
( ) 10
1 11
tn
L, U ,t jt j
V E C WACC−
= =
⎡ ⎤= +⎣ ⎦∑ ∏ (8)
The standard definition of WACC, assuming risk free debt at first, is:
( )1 1
1 11t t
t L,t F ,tL,t L,t
E DWACC r rV V
− −
− −= + − τ (9)
20 Note that this reasoning for using rU is not based upon the reasoning of Miles/Ezzell (1980) who use rU if debt
employed follows levered firm value according to a target leverage ratio. They do not focus upon financial
distress. 21 Following Stiglitz (1969) we are assuming limited liability on both the corporate and the investor’s level; see
Stiglitz (1969), p. 788.
16
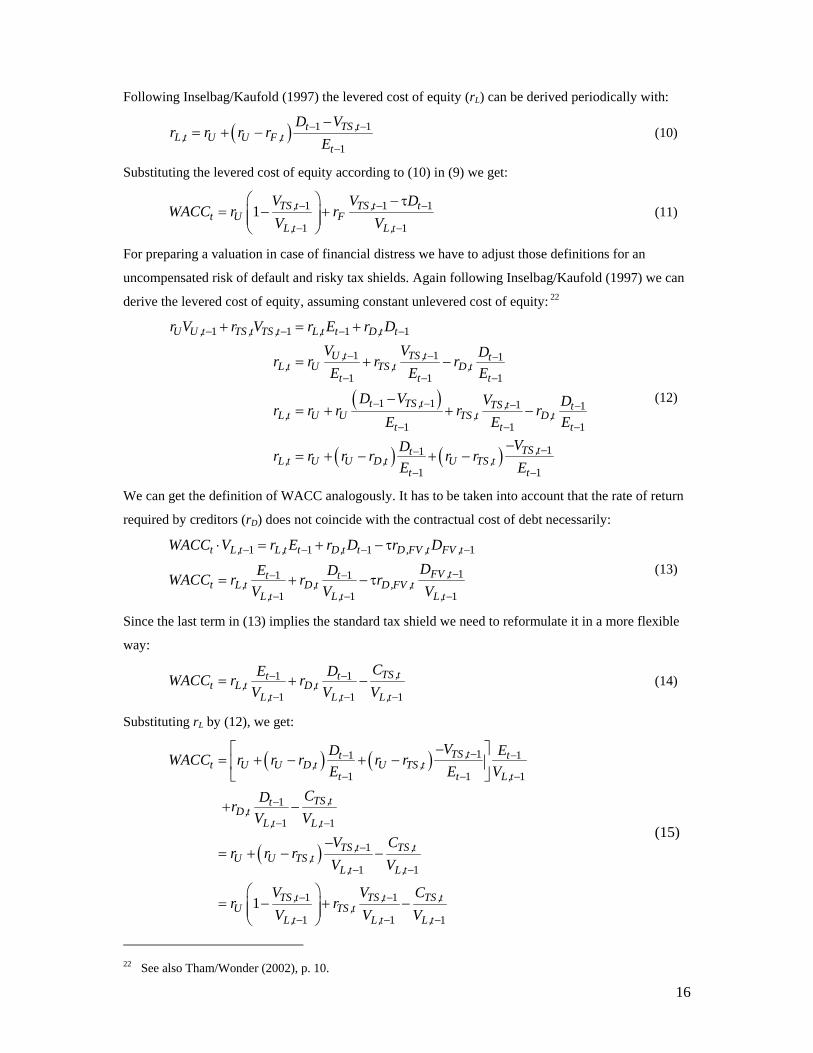
Following Inselbag/Kaufold (1997) the levered cost of equity (rL) can be derived periodically with:
( ) 1 1
1
t TS ,tL,t U U F ,t
t
D Vr r r r
E− −
−
−= + − (10)
Substituting the levered cost of equity according to (10) in (9) we get:
1 1 1
1 11 TS ,t TS ,t t
t U FL,t L,t
V V DWACC r r
V V− − −
− −
⎛ ⎞ − τ= − +⎜ ⎟⎜ ⎟
⎝ ⎠ (11)
For preparing a valuation in case of financial distress we have to adjust those definitions for an
uncompensated risk of default and risky tax shields. Again following Inselbag/Kaufold (1997) we can
derive the levered cost of equity, assuming constant unlevered cost of equity: 22
( )
( ) ( )
1 1 1 1
1 1 1
1 1 1
1 1 1 1
1 1 1
11
1 1
U U ,t TS ,t TS ,t L,t t D,t t
U ,t TS ,t tL,t U TS ,t D,t
t t t
t TS ,t TS ,t tL,t U U TS ,t D,t
t t t
TS ,ttL,t U U D,t U TS ,t
t t
r V r V r E r DV V Dr r r rE E E
D V V Dr r r r rE E E
VDr r r r r rE E
− − − −
− − −
− − −
− − − −
− − −
−−
− −
+ = +
= + −
−= + + −
−= + − + −
(12)
We can get the definition of WACC analogously. It has to be taken into account that the rate of return
required by creditors (rD) does not coincide with the contractual cost of debt necessarily:
1 1 1 1
11 1
1 1 1
t L,t L,t t D,t t D,FV ,t FV ,t
FV ,tt tt L,t D,t D,FV ,t
L,t L,t L,t
WACC V r E r D r DDE DWACC r r r
V V V
− − − −
−− −
− − −
⋅ = + − τ
= + − τ (13)
Since the last term in (13) implies the standard tax shield we need to reformulate it in a more flexible
way:
1 1
1 1 1
TS ,tt tt L,t D,t
L,t L,t L,t
CE DWACC r rV V V
− −
− − −= + − (14)
Substituting rL by (12), we get:
( ) ( )
( )
11 1
1 1 1
1
1 1
1
1 1
1 1
1 1 11
TS ,tt tt U U D,t U TS ,t
t t L,t
TS ,ttD,t
L,t L,t
TS ,t TS ,tU U TS ,t
L,t L,t
TS ,t TS ,t TS ,tU TS ,t
L,t L,t L,t
VD EWACC r r r r rE E V
CDrV V
V Cr r r
V V
V V Cr r
V V V
−− −
− − −
−
− −
−
− −
− −
− − −
−⎡ ⎤= + − + −⎢ ⎥
⎣ ⎦
+ −
−= + − −
⎛ ⎞= − + −⎜ ⎟⎜ ⎟
⎝ ⎠
(15)
22 See also Tham/Wonder (2002), p. 10.
17
After subtracting D from VL we end up again with E.
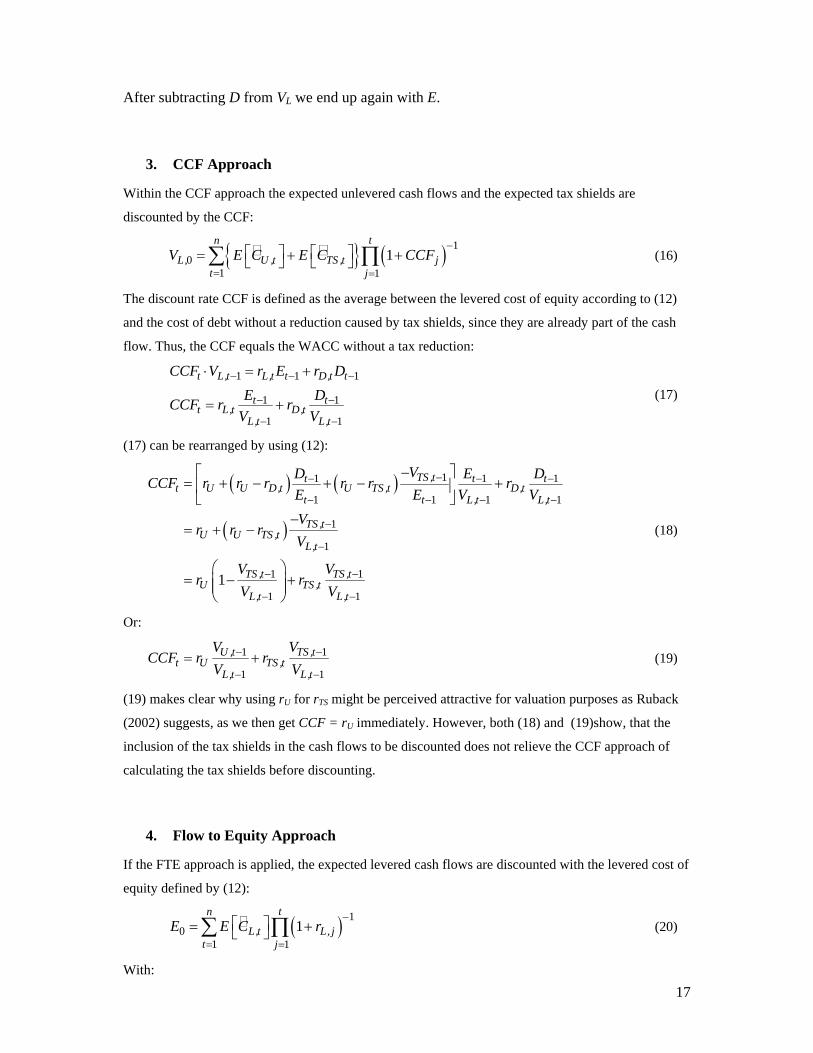
3. CCF Approach
Within the CCF approach the expected unlevered cash flows and the expected tax shields are
discounted by the CCF:
{ } ( ) 10
1 11
tn
L, U ,t TS ,t jt j
V E C E C CCF−
= =
⎡ ⎤ ⎡ ⎤= + +⎣ ⎦ ⎣ ⎦∑ ∏ (16)
The discount rate CCF is defined as the average between the levered cost of equity according to (12)
and the cost of debt without a reduction caused by tax shields, since they are already part of the cash
flow. Thus, the CCF equals the WACC without a tax reduction:
1 1 1
1 1
1 1
t L,t L,t t D,t t
t tt L,t D,t
L,t L,t
CCF V r E r DE DCCF r r
V V
− − −
− −
− −
⋅ = +
= + (17)
(17) can be rearranged by using (12):
( ) ( )
( )
11 1 1
1 1 1 1
1
1
1 1
1 11
TS ,tt t tt U U D,t U TS ,t D,t
t t L,t L,t
TS ,tU U TS ,t
L,t
TS ,t TS ,tU TS ,t
L,t L,t
VD E DCCF r r r r r rE E V VV
r r rV
V Vr r
V V
−− − −
− − − −
−
−
− −
− −
−⎡ ⎤= + − + − +⎢ ⎥
⎣ ⎦−
= + −
⎛ ⎞= − +⎜ ⎟⎜ ⎟
⎝ ⎠
(18)
Or:
1 1
1 1
U ,t TS ,tt U TS ,t
L,t L,t
V VCCF r r
V V− −
− −= + (19)
(19) makes clear why using rU for rTS might be perceived attractive for valuation purposes as Ruback
(2002) suggests, as we then get CCF = rU immediately. However, both (18) and (19)show, that the
inclusion of the tax shields in the cash flows to be discounted does not relieve the CCF approach of
calculating the tax shields before discounting.
4. Flow to Equity Approach
If the FTE approach is applied, the expected levered cash flows are discounted with the levered cost of
equity defined by (12):
( ) 10
1 11
tn
L,t L, jt j
E E C r−
= =
⎡ ⎤= +⎣ ⎦∑ ∏ (20)
With:

18
( )1 1
1
L,t U ,t D,FV ,t FV ,t FV ,t D,FV ,t FV ,t
U ,t D,t D,FV ,t FV ,t
C C r D D r D
C C r D− −
−
= − − Δ + τ⋅ ⋅
= − + τ⋅ (21)
Again, the levered cost of equity cannot be calculated ex ante, because they are based upon the
valuation results. As with the WACC approach we are facing a circular argument.
If WACC, CCF or FTE approach are to be used and the respective discount rates vary periodically, the
valuation has to be done in a roll back procedure, starting in the last period t=T.
5. Preliminary Conclusions
We conclude to use the APV approach since it allows us to derive the unlevered firm value without
any capital structure influences. We can then deal with tax shields and the difference between debt at
present value and at face value. Unlevered firm value is a proxy for the debt capacity of the firm. It is
not identical with debt capacity as the tax shields on interest expenses, which increase the debt
capacity, are not included. We will adress that problem of interdependency later on and we will solve
it by using iterations. WACC and FTE approach are not appropriate here because the argument in
favour of those methods, i.e. constant discount rates when the target leverage ratio is followed by
management, does not fit into the context of valuing firms in financial distress: Those companies are
not able to repay debt, when their company value deteriorates.23 They are not able to maintain their
target capital structure.
If the assumption is set that the discount rate CCF equals the unlevered cost of equity, CCF approach
and APV approach work almost identically:
( ) ( ) { }( )01 1 1
0 0
1 1 1n n nt t t
L, U ,t U TS ,t U U ,t TS ,t Ut t t
U , TS , CCF approach
APV approach
V E C r E C r E C E C r
V V
− − −
= = =
⎡ ⎤ ⎡ ⎤ ⎡ ⎤ ⎡ ⎤= + + + = + +⎣ ⎦ ⎣ ⎦ ⎣ ⎦ ⎣ ⎦∑ ∑ ∑144424443 14444244443
(22)
However, in all other cases – as Equations (17) through (19) make clear – we need to know the value
of tax shields or the levered cost of equity before applying the CCF.
Thus, we will apply the APV approach first and then use the results to illustrate the WACC, CCF and
FTE approach.24
23 The model developed by Homburg/Stephan/Weiß (2004) combines target leverage ratios and risk of default by
referring to Miles/Ezzell (1980); see Homburg/Stephan/Weiß (2004), e.g. pp. 280-283. This combination can
be criticised, see Kruschwitz/Lodowicks/Loeffler (2005), p. 228, 234. 24 For the use of the APV approach for financial restructurings see also Gilson (2001), pp. 491-495.

19
IV. Application to Eurotunnel
1. APV Approach
a) Unlevered Value of Eurotunnel (VU)
A valuation of Eurotunnel is necessary in order to estimate how much of its debt can be repaid by the
company ceteris paribus. The estimated debt capacity is crucial for developing a financial restructring
package. The valuation is currently done confidentially within the company and the Ad hoc Credit
Committee, but we will try to do it from an external perpective. For an external DCF valuation key
value drivers have to be estimated, as cash flow forecasts have not been published by the company for
years.25 The main drivers for Eurotunnels cash flows are the growth rates for its existing shuttle, rail
and ancillary revenues and operational efficiency. For doing a valuation one might use past growth
rates of Eurotunnel, the ratio of operating costs to revenues and the relation of capital expenditures to
revenues. One could use other growth assumptions related to the growth of the GDP of Europe or its
inflation rates or traffic projections. Due to its currently minor relevance, it is doubtful that ancillary
revenues will cover much of the debt employed.
Following the APV approach we start with estimating future operating cash flows after taxes and
capital expenditures as their present value (VU) is a crucial ingredient for valuing the position of
owners and lenders.
As there has not been published a cash flow forecast recently one has to make some simplifying
assumptions. We start with historic growth rates of revenues for the three lines of business: shuttles,
rail and ancillary. Exhibit 4b provides the data for calculating the most recent growth rate, average
growth rates or cumulative average growth rates. The estimation presented in Exhibit 10 is based upon
the CAGR for shuttle (0.011) and rail (0.0167) for the years 1999 to 2004. Since 1995 has been the
first year of full operations and revenues in 1996 and 1997 have been adversely affected by the fire,
the growth rate from 1998 to 1999 is used as the first data point. For ancillary business we assume a
growth rate of zero. Since the annual reports for 2005 have not been published yet, we value
Eurotunnel as of the end of 2004.
Other growth rates could be assumed like the average inflation rates or the average growth rates of
GDP. Exhibit 13 shows the results of those szenarios. One could also come up with explicit forecasts
for volumes and prices for the different services. However, Eurotunnel’s pricing policy is highly
differentiated for passenger shuttles (from £39 to £279 per one way trip). As far as the rail or freight
shuttle businesses are concerned, there is not much public information available: a toll formula is used
for rail services and the tariffs for freight shuttle services are negotiated individually.
25 Due to the unique character of the Eurotunnel project, it is probably impossible to find peer companies for
using comparable financial figures (multiples) to evaluate Eurotunnel.

20
A restriction to be considered is capacity available. Since the rates of growth in revenues are going to
be applied for a time span of about 80 years (2005 to 2086), volumes increase considerably and it is
questionable whether existing capacity can cope with them. The current maximum capacity follows
from data presented in Section II.1:
Passenger shuttles: 4 departures per hour, in both directions, 24 hours a day, 365 days per year equals
70,080 departures a year. Comparing that to the actual number of departures of around 40,000 a year,
it becomes evident that capacity is used up to 57% only (in reference to the entire year).
Freight shuttles: 7 departures per hour, in both directions, 24 hours a day, 365 days per year equals a
maximum capacity of 122,640 departures a year. Since the number of actual departures is 60,000, 49%
of capacity is used currently.
Thus, there is unused capacity. This is also true for the rail business. By investing into shuttles, which
can carry more vehicles or by increasing the speed of the shuttles, capacity might be increased as well.
As it might be hard to predict, at what point of time major capital expenditures are necessary, it can be
assumed that capital expenditures occur permanently as a percentage of revenues. The data in Exhibit
4b reveals that capital expenditures have been 8.7% of revenues between 1998 and 2004. This number
is used for the DCF valuations. Capital expenditures lead to tax deductible depreciations. Total
tangible fixed assets are £6,934 million at the end of 2004. That amount and capital expenditures
occurring during the concession period are to be depreciated. We apply a straight line depreciation
which leads to fixed assets at the end of the concession period equal to zero.26 Changes in net working
capital are not considered for the sake of simplification.27
As we have mentioned earlier, on average 53% of revenues are needed for operating costs. This is far
from the ratios the company forecasted by Eurotunnel at several occasions. Sensitivity analysis might
illustrate the impact of other assumptions.
The corporate tax rate was set at 33%, which is the average of the French and British corporate tax
rate. Only corporate taxes are considered here, since it is quite complicated to build in the French and
the British income tax code. In addition it would be necessary to consider double taxation agreements.
According to the latest annual report, tax loss carry forwards (LCF) are £3,081 million.28 That number
is based upon the given capital structure. Therefore, it is not the loss carry forward, which would result
if the company was financed by equity only. That number would be needed for a APV valuation. In
order to avoid going back to 1987 for elimination of all contributions to LCF caused by interest
expenses, the LCF of £3,081 million is used for deriving unlevered company value. It has to be
considered that 59% of profits before taxes have to be paid to the governments after 2052 which
includes corporate taxes.
26 One could argue that there might be some impairment losses like in 2003 and 2004 also for later years. 27 Besides of creditors other components of net working capital like inventories or debtors are not of high
relevance for Eurotunnel. 28 See Eurotunnel, Annual Accounts 2004, p. 46.

21
The company has used 7.2% as a (unlevered) cost of equity for accounting impairment tests fairly
recently.29 One might tend to argue at first sight, that using a rU at 7.2% is low for a company in need
for a major financial restructuring. However, it should be become clear in the following that the
underlying business produces operating cash flows which are easily covering future capital
expenditures. The risk of default is not to be considered at this point, since it is assumed first that the
company is financed by equity solely, and the volatility of operating cash flows has not been high
during the last years (see Exhibit 4b). Insolvency risk enters the scene, when we consider debt
employed later on.
After setting all assumptions the unlevered free cash flows can be derived. They are shown in Exhibit
10 for several periods.
Discounting them to the beginning of 2005 gives an unlevered firm value (VU) of £3,253 million.
b) Repayment Schedule
For developing the repayment schedule all different debt instruments have to be included with their
individual schedule (Exhibit 8 and 9). We are assuming here that the Stabilisation Notes are not
converted into units at the end of 2005. Since no information is available about the yearly repayments,
a linear repayment schedule is chosen for each instrument. EDL, Senior and 4th Tranche Debt are
assumed to be repaid in equal instalments from 2006 to 2019. Exhibit 12 contains the aggregated
repayment stream and the corresponding interest expenses.
c) Present Value of the Tax Shields (VTS)
Based upon the repayment schedule, interest expenses and taxable income, it is possible to quantify
the present value of the tax shields caused by debt financing. Unlike the usual treatment of the APV
approach in textbooks on Corporate Finance, it is not enough to simply multiply the corporate tax rate
with interest expenses, since Eurotunnel will not have any positive taxable income for years. One
might also argue that the company is not even able to fully pay its interest obligations. However, as the
financial statements (Exhibit 5) show, interest payable are expensed in the P&L account totally and do
not depend upon whether they are really paid in that year. The average interest rate on debt employed
has been 4.8% in 2004 (debt employed at the end of 2003: £6,364 million; interest expenses without
leasing 2004: £304 million; see Exhibits 8 and 5). As one can see, this is a moderate interest rate
compared to the risk of Eurotunnel. The risk of borrowings to Eurotunnel becomes evident, if one
considers their market prices trading at large discounts to face value.
29 See Eurotunnel, Annual Accounts 2004, p. 31. The company and its auditors also applied the APV approach;
see Eurotunnel, Annual Accounts 2004, p. 35.

22
Working with loss carry forwards within an APV valuation requires to differentiate between tax losses
for the unlevered and the levered case. The easiest way to overcome those problems is to compare
taxes paid in the unlevered and the levered case explicitly. The difference between those streams of
taxes is caused by debt financing, i.e. it equals the tax shields (see Exhibit 11). The first tax shield
occurs in 2029. The loss carry forwards, which are assumed to be used without restrictions, have to
defined for the levered and the unlevered case.
The resulting tax differences are discounted to the beginning of 2005. Due to the risky nature of the
project and its debt financing, the risk free rate might not be the best choice. We will apply the cost of
unlevered equity (rU) following Ruback (2002). In order to be more specific about the riskiness of the
tax shield, it would be necessary to model future scenarios and their intertemporal development
explicitly. As that overstretches the information available for our external analysis, we use rU for
simplification purposes. This leads to a present value of £157 million (VTS) using 4.8% as the cost of
debt for the entire period. It is informative to compare that value with a back of the envelope
calculation of a tax shield like corporate tax rate times debt employed: assuming an infinite and
constant use of the entire debt employed, one would expect τ · DFV = 0.33· £6,354 million = £2,093.
Due to the fragile financial constitution of Eurotunnel the value of tax shields is only £157 according
to our estimation. If income taxes would have been considered, the tax shield would even be lower,
since the French and the British tax regime are to a large extent an imputation system giving
shareholders credit for (part) of corporate taxes paid.30
d) Levered Value of Eurotunnel (VL)
Adding the value of the tax shields (VTS = £157 million) to the unlevered value of Eurotunnel plus cash
(£3,253 million + £181 million in cash = £3,434 million) leads to its levered value (VL = £3,591
million). Subtracting debt at face value (DFV = £6,354 million) gives the ‘value’ of equity (E = -
£2,763 million). That implies that VL = D = £3,591 million. Obviously, this is a case of
overindebtedness. The cash flows are too low for the amount of debt employed. The negative value of
equity could also be interpreted as the difference between market value and face value of debt. It
shows a discount of 44% of face value.
The estimated cash flows are not covering repayments or even interest expenses. If we assume that Eurotunnel would have been financed by equity only, the analogous conclusion is that the opportunity cost of capital on invested equity and the invested equity itself are not covered by cash flows.
The gap between total company value and debt employed can also be discussed by comparing the
unlevered cash flows with the interest obligations and repayments according to the Credit Agreement.
30 It should be mentioned that the 59% to be paid from 2052 onwards substitute the tax rate of 33% for
calculating taxes and tax shields from that point of time.
23
The resulting levered free cash flows are negative for years implying equity contributions for a long
period of time. As those contributions are not compensated by later payouts, they are driving the value
of equity below zero.
One could use the cash flow forecasts for identifying critical rates of growth in revenues. This can be
done by iterative calculations. Leaving all other assumptions unchanged, the critical growth rate for D
= DFV is 4.6%, exceeding the growth in GDP considerably. The growth rate, which ensures that the
project is economically feasible, has to consider all capital invested and all cost of capital since the
project’s start. Thus, the point of reference is NPV = 0 and as such is much higher than D = DFV (or E
= 0). One needs to consider a compensation for debt formerly repurchased below face value, too. In
that case, the critical growth rate increases to around 10%; the exact number depends upon the cost of
equity and debt assumed for previous years. That growth rate exceeds the historic growth rates of
revenues reported above considerably. This result signals that the project is not economically feasible
by itself. Positive infrastructure effects like lower prices for Channel crossings and decreasing travel
times could have justified the use of public funds instead of financing the project by private funds
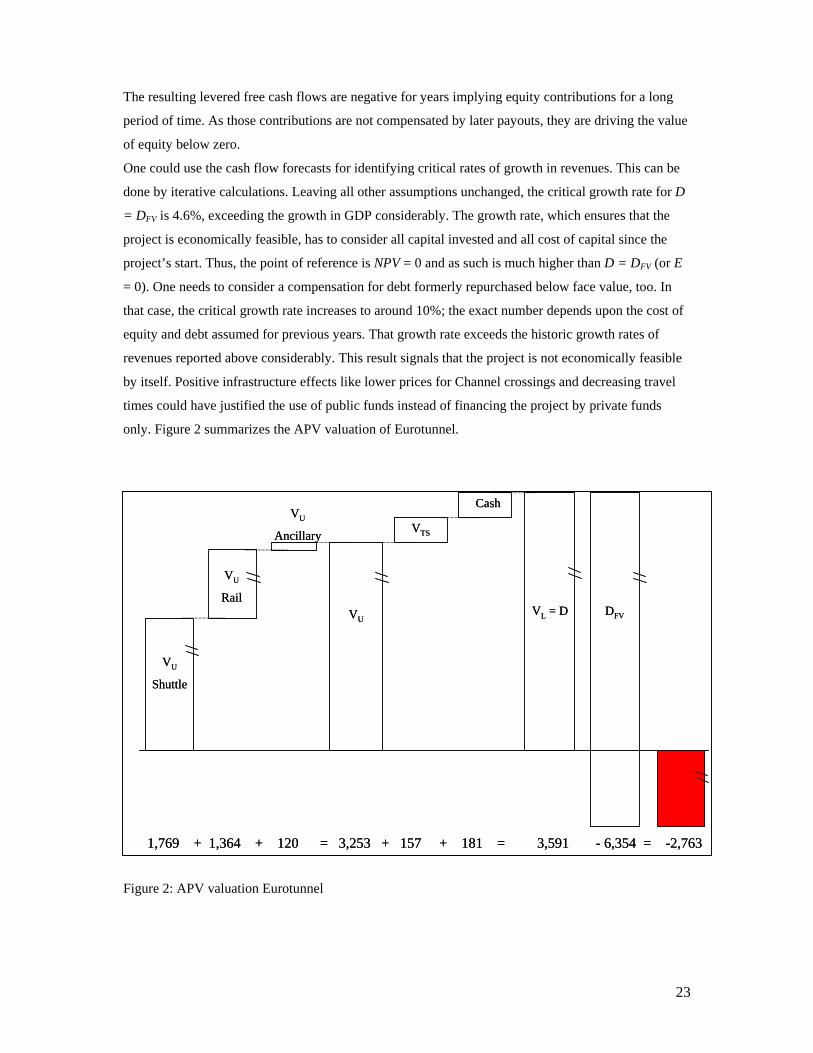
only. Figure 2 summarizes the APV valuation of Eurotunnel.
Figure 2: APV valuation Eurotunnel
1,769 + 1,364 + 120 = 3,253 + 157 + 181 = 3,591 - 6,354 = -2,763
VU
Shuttle
VU
Rail
VU
Ancillary
VU
VTS
DFV
Cash
VL = D
1,769 + 1,364 + 120 = 3,253 + 157 + 181 = 3,591 - 6,354 = -2,763
VU
Shuttle
VU
Rail
VU
Ancillary
VU
VTS
DFV
Cash
VL = D

24
e) Estimated Debt Capacity
Shortly, one could refer to b) and conclude that the maximum amount of debt is VL = £3,591 million.
However, if the focus lies upon a precise DCF valuation, the answer is a bit more demanding, as there
is an interdependence between the value of the tax shield and debt capacity. One could solve that
problem by doing iterative calculations. Exhibit 12 shows the result. The maximum amount of debt is
£3,553 million under the assumptions made above. It is assumed here that yearly repayments equal the
unlevered cash flow available less after tax interest payments. Interestingly, management, acting on
behalf the shareholders explicitly, has demanded recently, that the company can only bear debt in the
range between £2.3 and £2.7 billion. That is clearly below the conclusion drawn from our rather
conservative valuation shown above. It could be interpreted as a first move in a bargaining game.
In either case it should be emphasized that it is derived under a set of assumptions. Exhibit 13 shows
the results while using other growth rates leaving all other paramters unchanged.
2. Other DCF Approaches
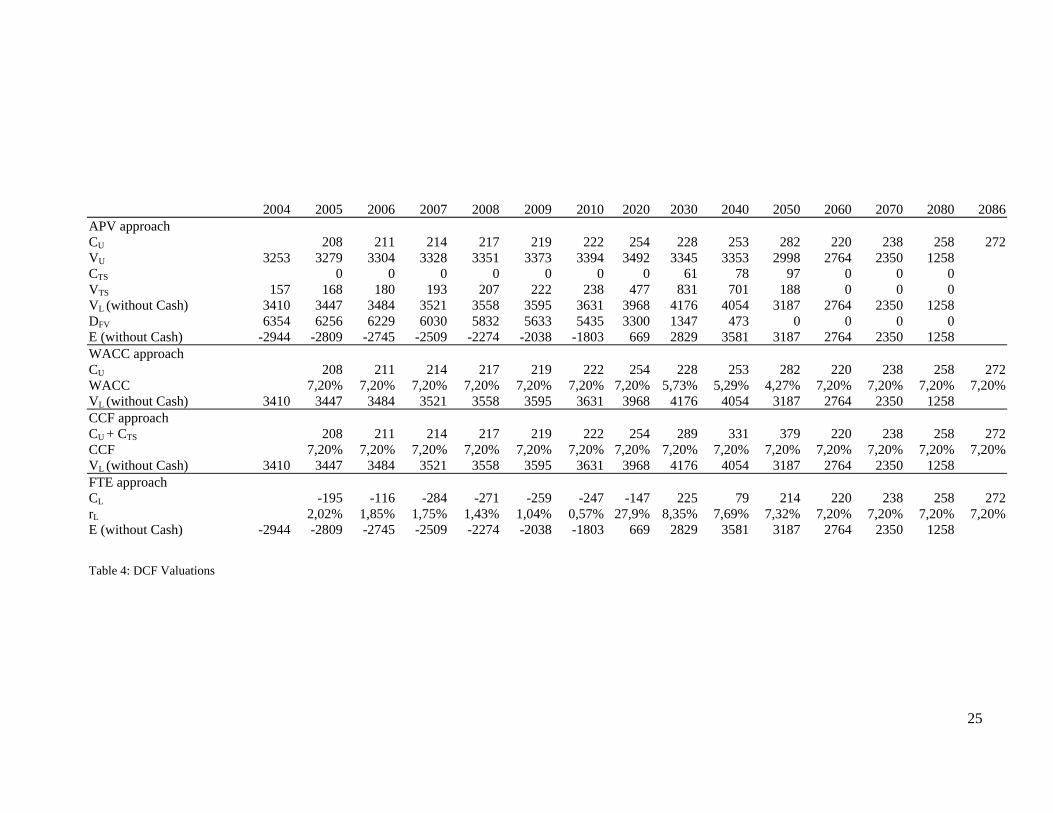
Table 4 summarizes all four DCF approaches. The cost of capital necessary for the valuations besides
APV (i.e. rL, WACC, CCF) are based upon the results delivered by APV. Debt is fully repaid
according to the Credit Agreement in 2050. As stated earlier, the repayment schedule cannot be met,
the value of equity is negative. Negative equity is responsible for the low levered cost of equity which
are to be calculated according to (12). WACC and CCF are identical since in the first year there are no
periodic tax shields (CTS = 0). That follows from a comparison of (15) and (19). Furthermore, TCC
equals rU as we assume that rTS = rU.
25
2004 2005 2006 2007 2008 2009 2010 2020 2030 2040 2050 2060 2070 2080 2086 APV approach CU 208 211 214 217 219 222 254 228 253 282 220 238 258 272 VU 3253 3279 3304 3328 3351 3373 3394 3492 3345 3353 2998 2764 2350 1258 CTS 0 0 0 0 0 0 0 61 78 97 0 0 0 VTS 157 168 180 193 207 222 238 477 831 701 188 0 0 0 VL (without Cash) 3410 3447 3484 3521 3558 3595 3631 3968 4176 4054 3187 2764 2350 1258 DFV 6354 6256 6229 6030 5832 5633 5435 3300 1347 473 0 0 0 0 E (without Cash) -2944 -2809 -2745 -2509 -2274 -2038 -1803 669 2829 3581 3187 2764 2350 1258 WACC approach CU 208 211 214 217 219 222 254 228 253 282 220 238 258 272 WACC 7,20% 7,20% 7,20% 7,20% 7,20% 7,20% 7,20% 5,73% 5,29% 4,27% 7,20% 7,20% 7,20% 7,20% VL (without Cash) 3410 3447 3484 3521 3558 3595 3631 3968 4176 4054 3187 2764 2350 1258 CCF approach CU + CTS 208 211 214 217 219 222 254 289 331 379 220 238 258 272 CCF 7,20% 7,20% 7,20% 7,20% 7,20% 7,20% 7,20% 7,20% 7,20% 7,20% 7,20% 7,20% 7,20% 7,20% VL (without Cash) 3410 3447 3484 3521 3558 3595 3631 3968 4176 4054 3187 2764 2350 1258 FTE approach CL -195 -116 -284 -271 -259 -247 -147 225 79 214 220 238 258 272 rL 2,02% 1,85% 1,75% 1,43% 1,04% 0,57% 27,9% 8,35% 7,69% 7,32% 7,20% 7,20% 7,20% 7,20% E (without Cash) -2944 -2809 -2745 -2509 -2274 -2038 -1803 669 2829 3581 3187 2764 2350 1258 Table 4: DCF Valuations

26
V. Conclusions
In the paper we have shown how different DCF approaches have to be adjusted for valuing firms in
financial distress. The APV approach can be recommended for valuing companies in financial
troubles, as it forces to cope with the implications of a given capital structure step by step. WACC,
CCF and FTE approach face circular arguments due to the definitions of the respective cost of capital.
Based upon the estimated company value possible strategies for the claimholders involved can be
discussed. First of all, it is improbable that lenders will give up anything close to 60% of their claims
without compensation. The lenders could sell their claims to other investors, use their right of
substitution to implement a new tunnel operating organisation. The governments have to approve a
new operator (see Exhibit 1b). In addition, one could ask how a company that went through several
restructurings and that has only a limited chance for developing new business opportunities, could be
run better by a new management. If lenders choose to trigger a legal bankruptcy/insolvency procedure,
(depending upon the question on which national law the procedure will be based upon) an
administrator will operate the business which triggers new costs and lengthens the time needed for
agreement upon the financial restructuring (see Gilson/John/Lang (1990), Gilson (1995),
Tashjian/Lease/McConnell (1996)). Liquidation of the project in the sense of a complete shut down is
not a probable outcome, because the proceeds for selling the assets might be lower than the cash flows
from further operating the tunnel.
Shareholders do not have many options. They could sell the shares or they could try to prevent any
major dilution. However, if they do not agree with a financial restructuring, their position will
probably be worthless when the company has to file for bankruptcy. Thus, they are in a weak position.
Assuming the going concern case, a financially viable strategy is to swap debt for equity. Existing
shareholders will have to endure a dilution of course. That leads to the question of how many shares
shall be assigned to lenders. Since the company is over indebted, an extreme position would be to call
for (almost) full dilution. That shares are still worth something signals that investors consider the
probability of scenarios in which dividends are paid to be positive. To put it differently: at least some
shareholders see light at the end of the tunnel.

27
Exhibit 1a: Treaty (Article 1)
Treaty between the United Kingdom of Great Britain and Northern Ireland and the French Republic concerning the Construction and Operation by Private Concessionaires of a Channel Fixed Link (12 February 1986)
Article 1: Object and Definitions (1) The High Contracting Parties undertake to permit the construction and operation by private concessionaires (hereinafter referred to as “the Concessionaires”) of a Channel fixed link in accordance with the provisions of this Treaty, of its supplementary Protocols and arrangements and of a concession between the two Governments and the Concessionaires (hereinafter referred to as “the Concession”). The Channel fixed link shall be financed without recourse to government funds or to government guarantees of a financial or commercial nature. Exhibit 1b: Concession Agreement (Clause 2, 32, 34) Clause 2: The Project and the Characteristics of the Fixed Link 2.1 Subject to an in accordance with the provisions of this Agreement, the Concessionaires shall jointly and severally have the right and the obligation to carry out the development, financing, construction and operation during the Concession Period of a Fixed Link under the English Channel between the Department of the Pas-de-Calais in France and the County of Kent in England. Subject as aforesaid, they shall do this at their own risk, without recourse to government funds or to government guarantees of a financial or commercial nature and regardless of whatever hazards may be encountered. The Principals shall, in a manner which they will endeavour to co-ordinate between them, adopt such legislative and regulatory measures, and take such steps, including approaches to international organisations, as are necessary for the development, financing, construction and operation of the Fixed Link in accordance with this Agreement and ensure that the Concessionaires are free, within the framework of national and Community laws, to determine and carry out their commercial policy. Clause 32: Provisions relating to Lenders 32.1 Substitution 32.1 (1) The parties to this Agreement agree that new Concessionaires shall be substituted for the initial Concessionaires in the following circumstances: (a) following the occurrence of one of the events referred to in Annex IV and so long as its effect shall be
continuing or if the Principals take or propose to take any action which could result in the premature termination of the Concession Period, two legal entities, one French and the other English (the "Substituted Entities") controlled by the lenders financing the construction and operation of the Fixed Link (the "Lenders") shall, at the option of the Lenders and on the following terms, be simultaneously substituted by the Principals for the initial Concessionaires; and
(b) the Substituted Entities will need to provide evidence to the Principals that they have, at the time of substitution, a financial and technical capability sufficient to perform the obligations of the Concessionaires under this Agreement.
32.1(3) As from the actual or deemed confirmation of the substitution by the Principals, the Substituted Entities will benefit from all the rights and will assume all the obligations to the Principals under this Agreement and any leases granted to the initial Concessionaires pursuant to Annex II in place of the initial Concessionaires. 32.2 New Concession: 32.2(2) If the lenders have not exercised the right of substitution referred to in Clause 32.1(1) or, having been offered a new concession pursuant to Clause 32.2(1) (a), have not accepted the same or if the Substituted Entities have failed to fulfil the conditions specified in Clause 32.1(1) (b), if the Principals grant a new concession, the new concession agreement shall provide that the Lenders shall be entitled to receive from the new concessionaires payments out of the net revenues generated from such new concession in or towards repayment of the amounts owed to them on a subordinated basis agreed between the Lenders and such new concessionaires 32.2(3) If the Substituted Entities become the new concessionaires pursuant to Clause 32.2(1) (a), the new concession agreement will contain provisions to the effect that upon the payment of all amounts of principal, interest and other moneys from time to time owed to the Lenders under their financing agreements, it shall terminate without penalty. Clause 34: Exclusivity and Second Link 34.1 The Concessionaires recognise that, in due course, the construction of a drive through link may become technically and financially viable. They undertake as a result to present to the Principals between now and the year 2000 a proposal for a drive through link which shall be added to the first link when technical and economic

28
conditions for realisation of such a link shall permit it and the increase of traffic shall justify it without undermining the expected return on the first link. 34.2 The Principals undertake not to facilitate the construction of another fixed link whose operation would commence before the end of 2020. However, after 2010, and in the absence of agreement with the Concessionaires on the implementation of their proposal for the construction of a drive through link and as to its timetable, the Principals shall be free to issue a general invitation for the construction and operation of such a link. This new link shall not enter into operation before the end of 2020. 34.3 The Principals agree that throughout the Concession Period no link shall be financed with the support of public funds, either directly or by the provision of government guarantees of a financial or commercial nature. Annex IV to the Concession Agreement Events giving rise to the Right of Substitution (1) failure to make any payment required under the financing agreements within a stated grace period; (2) it appears, by reference to an objective test, that the Concessionaires do not have available and are not in a position to obtain sufficient funds to meet the estimated cost of construction or operation of the Fixed Link, together with the associated financing costs; (3) it appears, by reference to an objective test, that the estimated final maturity date for repayment of the Lenders financing the construction and operation of the Fixed Link will be materially extended; or (4) abandonment of the Project, insolvency, liquidation, enforcement of security by other creditors and related events.
29
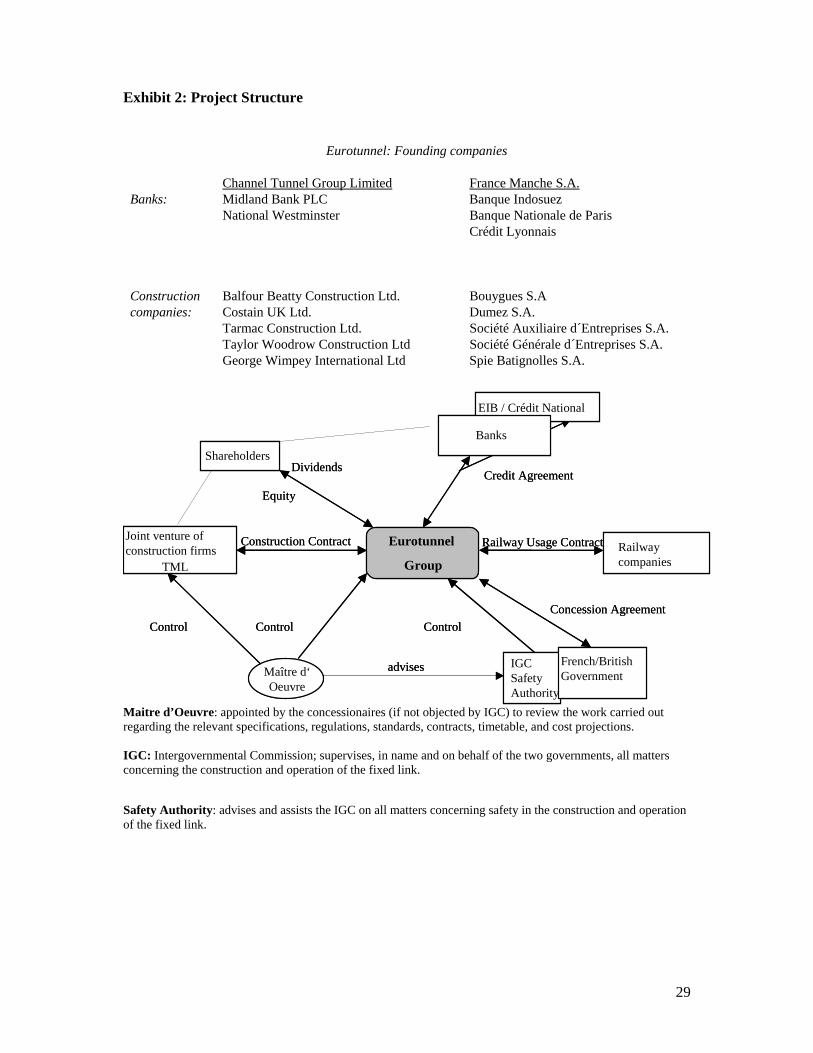
Exhibit 2: Project Structure
Maitre d’Oeuvre: appointed by the concessionaires (if not objected by IGC) to review the work carried out regarding the relevant specifications, regulations, standards, contracts, timetable, and cost projections. IGC: Intergovernmental Commission; supervises, in name and on behalf of the two governments, all matters concerning the construction and operation of the fixed link. Safety Authority: advises and assists the IGC on all matters concerning safety in the construction and operation of the fixed link.
Eurotunnel: Founding companies
Channel Tunnel Group Limited France Manche S.A.Banks: Midland Bank PLC Banque Indosuez
National Westminster Banque Nationale de ParisCrédit Lyonnais
Construction Balfour Beatty Construction Ltd. Bouygues S.Acompanies: Costain UK Ltd. Dumez S.A.
Tarmac Construction Ltd. Société Auxiliaire d´Entreprises S.A. Taylor Woodrow Construction Ltd Société Générale d´Entreprises S.A.George Wimpey International Ltd Spie Batignolles S.A.
Banks
Credit Agreement
Joint venture of construction firms
TML
Construction Contract Eurotunnel
Group
IGCSafety Authority
Maître d‘Oeuvre
Railway companies
advises
Control
French/British Government
Concession Agreement
Shareholders
EIB / Crédit National
Control Control
Dividends
Equity
Railway Usage Contract

30
Exhibit 3a: Cost until Opening £ million Nov. 1987 Nov. 1990 Oct. 1991 May 1994 Target works (e.g. tunnels) Lump sum works (e.g. buildings) Procurement items (e.g. shuttles) Bonus TML Direct works
1,367 1,169 252
2,009 1,305 583 72
2,009 1,305 692 72
2,110 1,753 705 46 36
Project contingency 239 239 Total construction costs Corporate costs Provision for inflation Net financing costs Capital Expenditure Transfer to interest reserve Net Cash Out Flow at the Beginning of Operations
2,788 642 469 975
4,208 787 1,031 1,386
196
4,317 829 1,031 1,534
343
4,650 1,128 1,146 4,757 222 72
-1,859
Total 4,874 7,608 8,054 10,116
Exhibit 3b: Financing until Opening £ million Equity 1 46 Equity 2 IPO
206 770
Capital increase Nov. 90 Capital increase 1994 Warrants*)
568 858
approx. 200 Total equity 2,648 Initial Credit Agreement Revised Credit Agreement EIB Credit Agreement ECSC Credit Agreement Senior debt Interest guarantees
4,985 1,800 300 200 647 -29
Total debt 7,903 Total funds 10,551
*) Consists of several issues; the largest of them in terms of funds raised were granted to shareholders at the IPO; however, until the expiration date (November 1992) only 2.7% of those warrants have been exercised.

31
Exhibit 4a: Management’s Cash Flow Forecast
NOCF: Net Operating Cash Flow = Revenues – Operating Costs – Taxes – Change in Working Capital
Data taken from forecasts published at IPO 1987, SEOs 1990 and 1994, Financial Restructuring 1997.
NOCF 99 is based on the forecasted cash flow published for the financial restructuring 1997, but interpolated for
the extended concession period (until 2086). The operating cash flows are decreased by 59% (agreement with the
government) from 2052 onwards.
Exhibit 4b: Actual Key Figures
£ million 1996 1997 1998 1999 2000 2001 2002 2003 2004Shuttle 145 113 210 270 314 309 333 309 285Rail 198 212 213 215 208 211 217 232 234Ancillary 105 132 196 141 57 27 20 25 19Revenues 448 456 618 627 579 548 570 566 538 Staff 88 86 92 95 95 95 102 105 104Other operating expenses 265 235 240 207 159 146 144 162 157Operating Cost 353 321 332 302 254 241 246 267 261 Capex 44 37 57 59 71 82 41 25 19 NOCF 115 201 356 315 328 320 348 314 283
-1000
0
1000
2000
3000
4000
5000
6000
7000
8000
9000
10000
1993
1998
2003
2008
2013
2018
2023
2028
2033
2038
2043
2048
2053
2058
2063
2068
2073
2078
2083
Mill
ion
Poun
ds
NOCF 87 NOCF 90 NOCF 94 NOCF 97 NOCF 99

32
Exhibit 5: Eurotunnel Group Financial Statements 2003/2004
Balance sheet £'000 2004 2003 Tangible fixed assets Financial fixed assets Total fixed assets Total current assets*) Prepaid expenses
6,933,599 18,910 6,952,509 423,106 36,545
7,426,858 17,205 7,444,063 823,022 52,592
Total assets 7,412,160 8,319,677 Shareholders' funds and liabilities Total shareholders' funds Provisions Total creditors Deferred income
528,241 144,752 6,725,456 13,711
1,099,187 99,508 7,098,298 22,684
Total shareholders' funds and liabilities 7,412,160 8,319,677 *) Including £181 million in cash and cash equivalent investments (2004).
Profit and loss account £'000 2004 2003 Total turnover Total operating expenditure
555,173 383,883
583,944 414,160
Operating profit Total financial income Total financial charges*) Financial result Exceptional result**) Taxation
171,290 32,964 331,158
(298,194) (442,806)
23
169,784 43,005 362,143
(319,138) (1,184,847)
24 Loss for the year (569,733) (1,334,225)
*) Including interest on leasing operations of £27 million; financial charges after leasing are £304 million **) Including an exceptional impairment of £ 395 million in 2004 (2003: £ 1,300 million). Cash flow statement £'000 2004 2003 Net cash inflow from operating activities Returns on investments and servicing of finance Capital expenditure Other non-operating cash flows and taxation
283,312
(281,241) (18,934) (13,859)
314,304
(277,878) (24,717) 20,367
Cash (outflow)/inflow before financing Financing
(30,722) 724)
32,076 (68,100)
Decrease in cash in the period (31,446) (36,024)

33
Exhibit 6: Shareholder Structure & Share Price
Number of Units at December, 31st 2004: 2,546,114,213
Share Price at December, 31st 2004: 17 Pence
0
100
200
300
400
500
600
700
800
900
1000
01.03
.1988
01.09
.1988
01.03
.1989
01.09
.1989
01.03
.1990
01.09
.1990
01.03
.1991
01.09
.1991
01.03
.1992
01.09
.1992
01.03
.1993
01.09
.1993
01.03
.1994
01.09
.1994
01.03
.1995
01.09
.1995
01.03
.1996
01.09
.1996
01.03
.1997
01.09
.1997
01.03
.1998
01.09
.1998
01.03
.1999
01.09
.1999
01.03
.2000
01.09
.2000
01.03
.2001
01.09
.2001
01.03
.2002
01.09
.2002
01.03
.2003
01.09
.2003
01.03
.2004
01.09
.2004
01.03
.2005
Shar
e pr
ice
(pen
ce)
UK Individuals5%
French Individuals62%
Other Individuals1%
Foreign Non-Individuals22%
French Non-Individuals10%

34
Exhibit 7: Capital Structure in Book Values
0
2
4
6
8
10
12
87 88 89 90 91 92 93 94 95 96 97 98 99 01 02 03 04
Debt Equity from conversion/settlements Equity from shareholders/right issues

35
Exhibit 8: Debt Employed 1988 – 2004 £ million 1988 1989 1990 1991 1992 1993 1994 1995 1996 1997 1998 1999 2000 2001 2002 2003 2004
Loan Notes
Equity Notes 935.7 621.9 623.0 615.5 252.4
Participating loan Notes 8.4 1,127.1 820.8 822.3 812.4 839.2 873.8 874.1
Stabilisation Notes 0.1 76.9 161.4
Total Loan Note Prinicipal 0.0 0.0 0.0 0.0 0.0 0.0 0.0 0.0 0.0 8.4 2,062.7 1,442.7 1,445.3 1,427.9 1,091.6 950.6 1,035.5
Bank Loans
EDL, Senior and 4th Tranche Debt 374.4 352.3 352.9 348.9 359.8 374.0 374.1
Tier 1A Debt 740.0 740.0 740.0
Junior Debt 3,639.9 3,397.2 3,404.0 3,352.3 3,126.9 3,264.7 3,264.0
Resettable Advances 1,414.0 1,130.4 1,129.6 1,114.9 550.7 479.1 473.0
Total Bank Loan Prinicpal 174.6 1,061.3 2,339.7 3,487.8 5,387.6 6,936.1 7,857.5 8,579.8 7,915.4 7,544.6 5,428.3 4,879.8 4,886.5 4,816.0 4,777.5 4,857.8 4,851.1
Unpaid interest 307.6 735.1 1,171.7 477.8 508.4 575.4 653.4 495.9 431.5 368.9
Stabilisation Advances 403.8 431.6 470.7 522.5 344.2 352.2 368.9
Deferred interest account 74.0 76.9 104.7 130.9 151.6 79.3
Total Loans 174.6 1,061.3 2,339.7 3,487.8 5,387.6 6,936.1 7,857.5 8,887.4 8,650.5 8,716.2 5,906.1 5,388.3 5,461.9 5,469.4 5,273.4 5,289.3 5,220.1
Accrued interest 1.8 24.5 54.4 64.0 115.5 125.5 156.0 138.6 157.3 158.7 136.3 138.9 136.3 127.6 124.9 98.1
Loan Notes 20.0 13.4 13.4 13.2 6.3 6.5 1.5
Loans 138.8 122.9 125.4 123.1 121.3 118.4 96.6
Overdrafts 0.4 0.7 1.9 0.7 1.4 2.8 2.2 4.2 2.1 2.3 2.5 1.3 0.6 0.0 0.0
Total 176.8 1,086.5 2,396.0 3,552.5 5,504.5 7,064.3 8,015.7 8,891.6 8,791.2 8,884.2 8,130.1 6,968.5 7,046.7 7,033.7 6,492.7 6,364.9 6,353.6
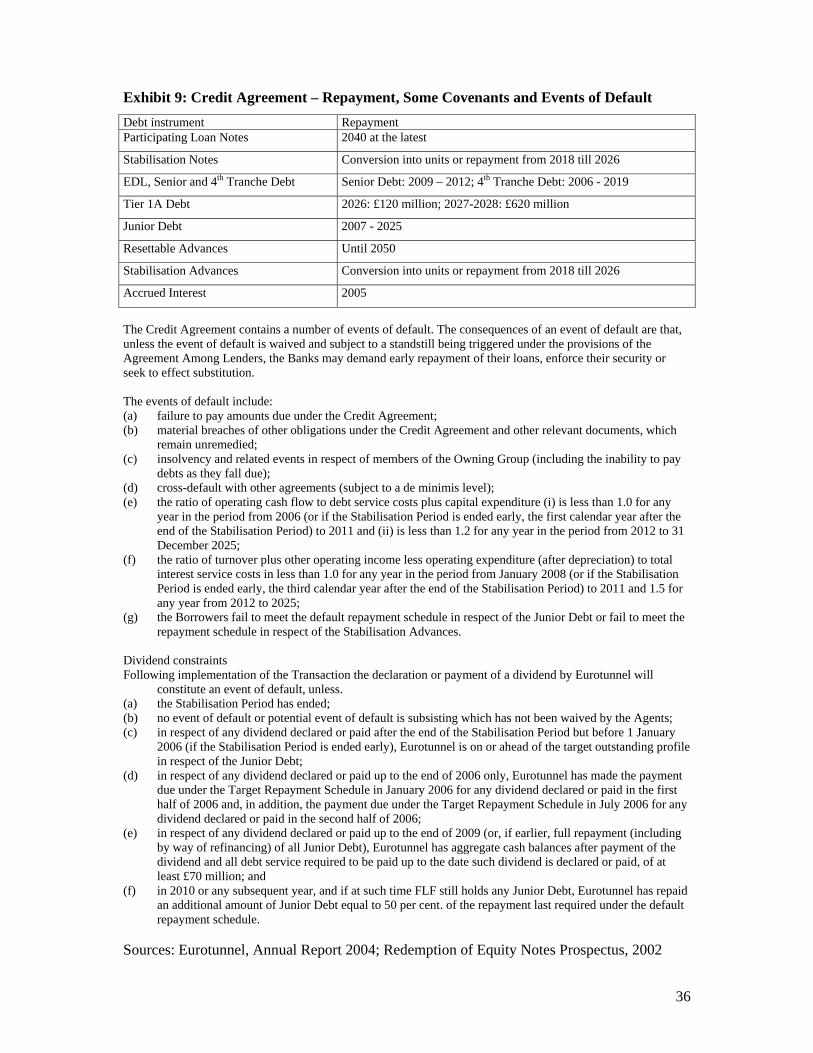
36
Exhibit 9: Credit Agreement – Repayment, Some Covenants and Events of Default
Debt instrument Repayment Participating Loan Notes 2040 at the latest
Stabilisation Notes Conversion into units or repayment from 2018 till 2026
EDL, Senior and 4th Tranche Debt Senior Debt: 2009 – 2012; 4th Tranche Debt: 2006 - 2019
Tier 1A Debt 2026: £120 million; 2027-2028: £620 million
Junior Debt 2007 - 2025
Resettable Advances Until 2050
Stabilisation Advances Conversion into units or repayment from 2018 till 2026
Accrued Interest 2005
The Credit Agreement contains a number of events of default. The consequences of an event of default are that, unless the event of default is waived and subject to a standstill being triggered under the provisions of the Agreement Among Lenders, the Banks may demand early repayment of their loans, enforce their security or seek to effect substitution. The events of default include: (a) failure to pay amounts due under the Credit Agreement; (b) material breaches of other obligations under the Credit Agreement and other relevant documents, which
remain unremedied; (c) insolvency and related events in respect of members of the Owning Group (including the inability to pay
debts as they fall due); (d) cross-default with other agreements (subject to a de minimis level); (e) the ratio of operating cash flow to debt service costs plus capital expenditure (i) is less than 1.0 for any
year in the period from 2006 (or if the Stabilisation Period is ended early, the first calendar year after the end of the Stabilisation Period) to 2011 and (ii) is less than 1.2 for any year in the period from 2012 to 31 December 2025;
(f) the ratio of turnover plus other operating income less operating expenditure (after depreciation) to total interest service costs in less than 1.0 for any year in the period from January 2008 (or if the Stabilisation Period is ended early, the third calendar year after the end of the Stabilisation Period) to 2011 and 1.5 for any year from 2012 to 2025;
(g) the Borrowers fail to meet the default repayment schedule in respect of the Junior Debt or fail to meet the repayment schedule in respect of the Stabilisation Advances.
Dividend constraints Following implementation of the Transaction the declaration or payment of a dividend by Eurotunnel will
constitute an event of default, unless. (a) the Stabilisation Period has ended; (b) no event of default or potential event of default is subsisting which has not been waived by the Agents; (c) in respect of any dividend declared or paid after the end of the Stabilisation Period but before 1 January
2006 (if the Stabilisation Period is ended early), Eurotunnel is on or ahead of the target outstanding profile in respect of the Junior Debt;
(d) in respect of any dividend declared or paid up to the end of 2006 only, Eurotunnel has made the payment due under the Target Repayment Schedule in January 2006 for any dividend declared or paid in the first half of 2006 and, in addition, the payment due under the Target Repayment Schedule in July 2006 for any dividend declared or paid in the second half of 2006;
(e) in respect of any dividend declared or paid up to the end of 2009 (or, if earlier, full repayment (including by way of refinancing) of all Junior Debt), Eurotunnel has aggregate cash balances after payment of the dividend and all debt service required to be paid up to the date such dividend is declared or paid, of at least £70 million; and
(f) in 2010 or any subsequent year, and if at such time FLF still holds any Junior Debt, Eurotunnel has repaid an additional amount of Junior Debt equal to 50 per cent. of the repayment last required under the default repayment schedule.
Sources: Eurotunnel, Annual Report 2004; Redemption of Equity Notes Prospectus, 2002

37
Exhibit 10: Unlevered Value of Eurotunnel (31 December 2004)
GBP million 2004 2005 2006 2007 2008 2009 2010 2020 2030 2040 2050 2060 2070 2080 2086Shuttle 285 288 292 295 298 301 305 340 379 423 472 526 587 655 699Rail 234 238 242 246 250 254 258 305 360 425 501 591 698 824 910Ancillary 19 19 19 19 19 19 19 19 19 19 19 19 19 19 19Revenues 538 545 552 560 567 574 582 664 758 866 992 1137 1304 1498 1628Operating Costs 261 289 293 297 301 305 309 352 402 460 527 604 692 795 864Depreciation 122 170 170 170 170 170 170 170 170 170 170 170 170 170 170Net fixed assets 6934 6811 6689 6567 6446 6326 6207 5049 3968 2975 2085 1313 678 201 0Operating profit 155 85 89 92 96 99 103 141 185 236 295 363 441 532 593Taxes 0 0 0 0 0 0 0 0 -61 -78 -97 -214 -260 -314 -350Loss Carry Forward 3081 2996 2907 2815 2719 2620 2517 1284 0 0 0 0 0 0 0NOPAT 155 85 89 92 96 99 103 141 124 158 198 149 181 218 243Depreciation 122 170 170 170 170 170 170 170 170 170 170 170 170 170 170Change NWC 0 0 0 0 0 0 0 0 0 0 0 0 0 0 0Net Operating Cash Flow 277 256 259 262 266 269 273 311 294 328 368 319 351 388 414Capital Expenditures 24 47 48 49 49 50 51 58 66 75 86 99 113 130 142FCFU 253 208 211 214 217 219 222 254 228 253 282 220 238 258 272
VU 3253

38
Exhibit 11: Value of Tax Shields (31 December 2004)
Mio. GBP 2030 2031 2032 2033 2034 2035 2036 2037 2038 2039 2040 2041 2042 2043 2044 2045 2046 2047 2048 2049 2050 2051 2052 2053 2054
Debt employed 1347 1347 1347 1347 1347 1347 1347 1129 910 692 473 473 473 473 473 473 473 473 315 158 0 0 0 0 0
Repayment 0 0 0 0 0 0 0 219 219 219 219 0 0 0 0 0 0 0 158 158 158 0 0 0 0
Interest expenses 65 65 65 65 65 65 65 65 54 44 33 23 23 23 23 23 23 23 23 15 8 0 0 0 0
Operating P. - Interest expenses
121 125 130 135 140 145 150 155 171 187 203 219 225 230 236 242 248 254 260 274 287 301 308 314 321
Taxes (Levered case) 0 0 0 0 0 0 0 0 0 0 0 0 0 0 0 0 0 0 0 0 0 0 0 -177 -189
LCF (Levered case) 4639 4514 4384 4249 4109 3964 3813 3658 3487 3300 3097 2878 2654 2423 2187 1946 1698 1444 1185 911 624 322 15 0 0
Taxes (Levered case) 0 0 0 0 0 0 0 0 0 0 0 0 0 0 0 0 0 0 0 0 0 0 0 -177 -189
Taxes (Unlevered case) -61 -63 -64 -66 -68 -69 -71 -73 -74 -76 -78 -80 -82 -83 -85 -87 -89 -91 -93 -95 -97 -99 -102 -185 -189
Periodic tax shield 61 63 64 66 68 69 71 73 74 76 78 80 82 83 85 87 89 91 93 95 97 99 102 9 0
Mio. GBP 2004 2005 2006 2007 2008 2009 2010 2011 2012 2013 2014 2015 2016 2017 2018 2019 2020 2021 2022 2023 2024 2025 2026 2027 2028 2029
Debt employed 6354 6256 6229 6030 5832 5633 5435 5236 5038 4839 4641 4442 4244 4045 3788 3530 3300 3069 2838 2607 2377 2146 1967 1657 1347 1347Repayment 98 27 199 199 199 199 199 199 199 199 199 199 199 257 257 231 231 231 231 231 231 179 310 310 0
Interest expenses 305 300 299 289 280 270 261 251 242 232 223 213 204 194 182 169 158 147 136 125 114 103 94 80 65
Operating Profit - Interest expenses
-220 -211 -207 -194 -181 -168 -155 -141 -128 -115 -102 -88 -75 -61 -45 -28 -13 2 17 33 48 64 77 96 116
Taxes (Levered case) 0 0 0 0 0 0 0 0 0 0 0 0 0 0 0 0 0 0 0 0 0 0 0 0 0
Loss Carry Forward (Levered case)
3081 3301 3512 3719 3913 4093 4261 4416 4557 4685 4800 4902 4990 5065 5126 5171 5200 5213 5211 5193 5161 5112 5049 4972 4876 4760
Taxes (Levered case) 0 0 0 0 0 0 0 0 0 0 0 0 0 0 0 0 0 0 0 0 0 0 0 0 0
Taxes (Unlevered case) 0 0 0 0 0 0 0 0 0 0 0 0 0 0 0 0 0 0 0 0 0 0 0 0 -59
Periodic tax shield 0 0 0 0 0 0 0 0 0 0 0 0 0 0 0 0 0 0 0 0 0 0 0 0 59
Present Value of Tax Shields (VTS)
157

39
Exhibit 12: Debt Capacity
GBP million 2004 2005 2006 2007 2008 2009 2010 2020 2028 2029 2030 2031 2039 2040 2041 2042 2043 2044Debt employed 3553 3515 3473 3426 3374 3317 3254 2235 708 457 189 0 0 0 0 0 0 0Repayment 38 42 47 52 57 63 140 237 252 268 189 0 0 0 0 0 0Interest expenses 171 169 167 164 162 159 114 45 34 22 9 0 0 0 0 0 0
OP-Interest expenses -85 -80 -75 -69 -63 -57 27 130 146 163 181 231 236 242 247 253 259Taxes (Levered case) 0 0 0 0 0 0 0 0 0 0 0 0 0 0 0 -58 -85LCF (Levered case) 3081 3166 3246 3321 3389 3452 3509 3648 2993 2847 2683 2503 803 567 325 78 0 0
Taxes (Levered case) 0 0 0 0 0 0 0 0 0 0 0 0 0 0 0 -58 -85Taxes (Unlevered case) 0 0 0 0 0 0 0 0 -59 -61 -63 -76 -78 -80 -82 -83 -85Periodic tax shield 0 0 0 0 0 0 0 0 59 61 63 76 78 80 82 26 0

40
Exhibit 13: Szenario Analysis
Szenario: Growth rate = Inflation rate = 2.1% Szenario: Growth rate = Average GDP growth 2004 = 2.75%
Debt Capacity: £3,974 million Debt Capacity: £4,424 million
3,662
VU
VTS
DFV
- 6,354 = - 2,338
172
Cash
181
VL
4,0163,662
VU
VTS
DFV
- 6,354 = - 2,338
172
Cash
181
VL
4,016 4,101
VU
DFV
- 6,354 = - 1,902
169
Cash
181
VL
4,452
VTS
4,101
VU
DFV
- 6,354 = - 1,902
169
Cash
181
VL
4,452
VTS
41
References
Brennan, M.J/Schwartz, E.S. (1978), Corporate Income Taxes, Valuation, and the Problem of Optimal Capital Structure, in: Journal of Business, Vol. 51, pp 103-114. Damodaran, J. (2002), Dealing with Distress in Valuation, Working Paper Stern School of Business, New York. Drukarczyk, J./Schueler, A. (2006), Bewertungsansätze und –methoden sanierungsbedürftiger Kapitalgesellschaften, erscheint in: Handbuch Unternehmensrestrukturierung/- sanierung: Grundlagen, Instrumente, Strategien, Hommel/Knecht/Wohlenberg (editors). Esty, B.C. (2004), Why Study Large Projects? An Introduction to Research on Project Finance, in: European Financial Management, Vol. 10, pp. 213-224. Eurotunnel, Offer for Sale Prospectus, November 1987. Eurotunnel, Rights Issue Prospectus, November 1990. Eurotunnel, Rights Issue Prospectus, May 1994. Eurotunnel P.L.C./Eurotunnel S.A., Financial Restructuring Proposals, May 1997. Eurotunnel P.L.C./Eurotunnel S.A., Rights Issue Prospectus, October 1999. Eurotunnel, Redemption of Equity Notes Prospectus, 2002. Eurotunnel, Comptes Annuels/Annual Accounts, 2004. Eurotunnel, Presentation Annual General Meetings Eurotunnel EPLC and ESA, 2005. Fitch Ratings, Eurotunnel and Related FLF1 & FLF2 Debt Vehicles – How Far Underwater Are They?, May 2005. Gilson, St. C. (1995), Investing in Distressed Situations: A Market Survey, in: Financial Analysts Journal, p. 9. Gilson, St.C. (2001), Creating Value through Corporate Restructuring, Case Studies in Bankruptcies, Buyouts and Break-ups, New York. Gilson/John/Lang (1990), Troubled debt restructurings: An empirical study of private reorganizatios of firms in default, in : Journal of Financial Economics, Vol. 27, pp. 315-353. Homburg, C./Stephan, J./Weiß, M. (2004), Unternehmensbewertung bei atmender Finanzierung und Insolvenzrisiko, in: Die Betriebswirtschaft, Vol. 64., pp. 276 - 295. Inselbag, I./Kaufold, H. (1997), Two DCF approaches for valuing companies under alternative financing strategies (and how to choose between them), in: Journal of Applied Corporate Finance, Vol. 10, pp. 114-122. Kruschwitz, L./Lodowicks, A./Löffler, A. (2004): Zur Bewertung insolvenzbedrohter Unternehmen, in: Die Betriebswirtschaft, Vol. 65, pp. 221-236. Laitenberger, J./Lodowicks, A. (2005), Das Modigliani-Miller-Theorem mit ausfallgefährdetem Fremdkapital, in: Wirtschaftswissenschaftliches Studium, Vol. 34, pp. 145-149.

42
Luehrmann, T. A. (1997), Using APV – A better tool for valuing operations, in: Harvard Business Review, Vol. 75, No. 3, pp. 145-154. Miles, J.A./Ezzell, J.R. (1980), The weighted average cost of capital, perfect capital markets, and project life: a clarification, in: Journal of Financial and Quantitative Analysis, Vol. 15, S. 719– 730. Modigliani, F./Miller, M.H. (1958), The Cost of Capital, Corporation Finance, and the Theory of Investment, in: American Economic Review, Vol. 48, S. 261 - 297. Modigliani, F./Miller, M.H. (1963), Corporate Income Taxes and the Cost of Capital: A Correction, in: American Economic Review, Vol. 53, pp. 433 - 443. Myers, St. C. (1974), Interactions of Corporate Financing and Investment Decisions: Implications for Capital Budgeting, in: Journal of Finance, Vol. 32, pp. 1-25. Nevitte, P.K./Fabozzi, F.J. (2000), Project Financing, 7th edition. Ruback, R.S. (2002), Capital Cash Flows: A Simple Approach to Valuing Risky Cash Flows, in: Financial Management, Vol. 32, pp. 85-03. Stiglitz, J.E. (1969), A Re-Examination of the Modigliani-Miller Theorem, in: Review of Economics and Statistics, Vol. 59, pp. 784 - 793. Stiglitz, J.E. (1974), On the Irrelevance of Corporate Financial Policy in: American Economic Review, Vol. 64, pp. 851 - 866. Tashjian/Lease/McConnell (1996), Prepacks: An Empirical Analysis of Prepackaged Bankruptcies, in: Journal of Financial Economics, Vol. 40, pp. 135-162. Tham, J./Wonder, N.X. (2002), The Non-conventional WACC with Risky Debt and Risky Tax Shield, Working Paper. The Secretary of State for Transport/Le Ministre de l’Urbanisme, du Logement et des Transports/The Channel Tunnel Group Limited/France-Manche S.A., Concession Agreement, April 1986. Treaty between the United Kingdom of Great Britain and Northern Ireland and the French Republic concerning the Construction and Operation by Private Concessionaires of a Channel Fixed Link with Exchange of Notes, Canterbury, 12 February 1986. Weiss (1990), Bankruptcy resolution: Direct costs and vialotation of priority of claims, in: Journal of Financial Economics, Vol. 27, pp. 285-314.