valuation maximizing corporate value
DESCRIPTION
Valuation maximizing corporate valueTRANSCRIPT


ValuationMaximizing Corporate Value
GEORGE M. NORTON III
John Wiley & Sons, Inc.


Valuation

F ounded in 1807, John Wiley & Sons is the oldest inde-pendent publishing company in the United States. With
offices in North America, Europe, Australia, and Asia,Wiley is globally committed to developing and marketingprint and electronic products and services for our cus-tomers’ professional and personal knowledge and under-standing.
The Wiley Finance series contains books written specifi-cally for finance and investment professionals, as well assophisticated individual investors and their financial advi-sors. Book topics range from portfolio management to e-commerce, risk management, financial engineering, valua-tion, and financial instrument analysis, as well as muchmore.
For a list of available titles, visit our web site atwww.WileyFinance.com.
ValuationMaximizing Corporate Value
GEORGE M. NORTON III
John Wiley & Sons, Inc.

Printed in the United States of America.
10 9 8 7 6 5 4 3 2 1
This book is printed on acid-free paper.
Copyright © 2003 by John Wiley & Sons, Inc. All rights reserved.
Published by John Wiley & Sons, Inc., Hoboken, New JerseyPublished simultaneously in Canada.
No part of this publication may be reproduced, stored in a retrieval system, ortransmitted in any form or by any means, electronic, mechanical, photocopying,recording, scanning, or otherwise, except as permitted under Section 107 or 108 ofthe 1976 United States Copyright Act, without either the prior written permission of the Publisher, or authorization through payment of the appropriate per-copy fee to the Copyright Clearance Center, Inc., 222 Rosewood Drive, Danvers, MA 01923,978-750-8400, fax 978-750-4470, or on the web at www.copyright.com. Requests to the Publisher for permission should be addressed to the Permissions Department,John Wiley & Sons, Inc., 111 River Street, Hoboken, NJ 07030, 201-748-6011, fax 201-748-6008, e-mail: [email protected].
Limit of Liability/Disclaimer of Warranty: While the publisher and author have usedtheir best efforts in preparing this book, they make no representations or warrantieswith respect to the accuracy or completeness of the contents of this book andspecifically disclaim any implied warranties of merchantability or fitness for aparticular purpose. No warranty may be created or extended by sales representativesor written sales materials. The advice and strategies contained herein may not besuitable for your situation. You should consult with a professional where appropriate.Neither the publisher nor author shall be liable for any loss of profit or any othercommercial damages, including but not limited to special, incidental, consequential, orother damages.
For general information on our other products and services, or technical support,please contact our Customer Care Department within the United States at 800-762-2974, outside the United States at 317-572-3993 or fax 317-572-4002.
Wiley also publishes its books in a variety of electronic formats. Some content thatappears in print may not be available in electronic books.
Library of Congress Cataloging-in-Publication Data:
Norton, George M.Valuation : maximizing corporate value / George M. Norton III.
p. cm.Includes index.ISBN Bookz 0-471-38654-5 (cloth : alk. paper)I. Management. 2. Strategic planning. 3. Corporate culture.
I. Title.HD30.28.N677 2003658.4'012—dc21
2002011161

To Paula
for her patience and support in this and all my endeavors


acknowledgments
Iwant to express my gratitude to my father, who instilled inme early in life a love and respect for the power and
irrefutability of mathematics. I would also like to thank allthe coeds with whom I came in contact in college, who con-vinced me that there were better ways to spend four yearsthan doing engineering homework and that one could enjoyboth math and campus life simultaneously. I would like tothank my father again. As manager of the pension fund forone of the big three auto makers for many years, he con-vinced me that intrinsic company value has little to do withthe nuances of market timing or subtle accounting tech-niques and tricks. Rather, it is the soundness and logic ofthe organization’s business model and the intelligence, expe-rience, and honesty of its management that determines cor-porate wealth over the long term.
Next, I would like to thank all my clients over the lastseveral decades, who have so willingly and openly embracedthe concepts contained herein, especially those whose out-spoken comments and suggestions have resulted in a contin-uing evolution of the framework process into the powerfultool it is today. A special thanks goes to the privately heldand not-for-profit clients, whose naturally long-term per-spective allowed for many faithful framework executionsand implementations without concern for and the distrac-tions of reporting quarterly earnings to the public.
vii

Any list of those to whom a debt of gratitude is owedwould not be complete without expressing appreciation tothe many software writers and companies who, over theyears, have made the use of computer spreadsheets andother analytical tools so simple, complete, and foolproof.These programs allow employees not only to understandand contribute to the maximization of the organization’svalue, but also to apply easily the same principles to theirfamily situations and to increase their personal wealth andhappiness.
Creating the framework is only part of any organiza-tion’s success story. Making it a reality requires the work ofmany. Therefore, I wish to thank the many associates, firstencountered in my early days at The Wharton School ofFinance and Commerce and Booz, Allen and Hamilton.Over the years, their expertise in market research, informa-tion technology, executive compensation and recruiting,quality circles, corporation finance, and other areas inwhich clients have had to seek external assistance in orderto execute properly and effectively their framework toobtain corporate value enhancement has been invaluable.
In summary, I would like to thank all the people whohelped create this book. I owe a great deal to my family fortheir support and to all the staff at John Wiley & Sons,especially my editor, Sheck Cho, whose encouragement andpatience throughout the process kept the flame alive, andSujin Hong, whose attention to detail ensured the quality ofthe final product. The many practitioners of managementand finance who over the years so willingly share their find-ings and techniques should not be forgotten. However, anyshortcomings are mine alone.
viii ACKNOWLEDGMENTS

Finally, I would like to thank, in advance, those of yougracious readers who take the time to contact me with your comments and suggestions after you apply the frame-work I have provided in this book. I can be reached at [email protected].
Acknowledgments ix


xi
contents
Preface xv
CHAPTER 1Conduct Strategic Audit 1
Highlight Existing Strengths 2Identify Implicit Strategies 9Plot Growth Performance 13Analyze Profitability Ratios 16Determine Relative Value 18Summary 20Endnotes 20
CHAPTER 2Calculate Current Value 23
Discover Importance of Value 23Master Discounted Cash Flow 30Understand Value Drivers 35Determine Cost of Capital 40Calculate Current Organization Value 43Summary 48Endnotes 48

CHAPTER 3Assess Strategic Landscape 51
Review Planning Fundamentals 52Identify Stakeholders 57Gather Additional Information 61Define Factors for Success 69Identify Barriers to Success 73Summary 73Endnotes 74
CHAPTER 4Build Framework Foundation 75
Review Framework Relevance 76Discover the Process 77Lay the Foundation 81Determine Niche Positions and Goals 88Evaluate Mission, Niches, and Goals 93Summary 95Endnotes 96
CHAPTER 5Formulate Sound Strategies 97
Understand Strategic Thinking 98Develop Objectives 108Develop Strategies 113Select Value-Maximizing Strategies 119Summary 128Endnotes 128
CHAPTER 6Evaluate Alternative Approaches 129
Review the Selected Strategies 130Understand the Methodology 131
xii CONTENTS
Quantify the Selected Strategies 134Calculate Revised Case Value 144Measure Value Enhancement 150Summary 154
CHAPTER 7Execute for Value 157
Create Action Plans 158Plan Implementation 170Embrace Change 177Execute the Framework 187Summary 188Endnotes 190
Epilogue 191
Index 193
Contents xiii

xv
preface
This book is the result of years of experience in assistingmiddle-market manufacturing and service entities, as
well as various not-for-profit organizations, in refining andapplying top-management strategy and valuation tech-niques used by large corporations. Accordingly, it should beof interest to officers, directors, and managers or advisorsto all types of organizations. It is especially relevant forpeople dealing with closely-held firms, autonomous divi-sions or subsidiaries of publicly-traded companies, countyand local governments, and schools and universities as wellas other medium-sized entities.
This book shows how, by understanding and using afew, simple concepts, the leaders and members of any typeof organization can enhance their daily and long-term satis-faction and that of their key stakeholders while simultane-ously reaping substantial financial rewards. It is a “handson” guide to incorporating sound strategic and valuationprinciples into decision making throughout the organiza-tion. It allows leaders and advisors to create a culture inwhich people work to achieve their potential and that ofthe organization by simultaneously improving the well-being of all who come in contact with and have an impacton the organization.
The book is divided into seven chapters. Each chapterexplains what to do, why to do it, and how. Examples usingthe ABC Company facilitate the reader’s ability to translatethe techniques discussed to unique, real-world situations. Inorder to maximize the book’s usefulness, the organization’sleader should put together a management team that canwork together throughout the seven major steps presented.
The first three chapters focus on the organization’s his-tory, worth, and environment. The management teamarrives at a consensus on the organization’s current condi-tion and its potential. Chapter 1 focuses on conducting astrategic audit. The exercises enable the participants todevelop an understanding of the implicit strategies that havetaken the organization to the place where it is today.Chapter 2 presents a methodology to calculate the currentvalue of the organization. The valuation variables involvedrequire five years of financial statements. However, youngeror start-up organizations can develop estimates for the vari-ables and also calculate a current value. Chapter 3 helps themanagement team characterize the organization’s strategiclandscape. It reviews the fundamentals of planning and con-ducting research. It introduces the concept of stakeholdersas all those various groups that have a current or potentialimpact on the future of the organization. In addition, it pre-sents exercises aimed at highlighting the key factors for andbarriers to the organization’s long-term success.
The next three chapters introduce the concept of astrategic framework and how to use it to develop a founda-tion for future action. Chapter 4 discusses the importanceand relevance of a strategic framework. It introduces anddefines the major elements of the framework and helps cre-
xvi PREFACE

ate a common language the management team can usethroughout the remaining steps. It presents exercises andtechniques that enable an organization to define its vision,values, goals, and niches which, in turn, provide a solidfoundation for the rest of the steps. Chapter 5 involves thecreation of specific objectives and strategies that, whentaken collectively, more completely define the organization’svision and long-term goals. It reviews the basic principles ofstrategy formulation and provides checklists to assist in theprocess. Chapter 6 discusses techniques to quantify the eco-nomic impact on the organization of pursuing various alter-native strategies. When followed, these techniques allow forthe selection of those strategies better suited to enhancingthe organization’s overall value.
The last chapter is an action-oriented one. Chapter 7gets into the specifics of executing the selected strategies.Useful forms and checklists are presented which enable theorganization to coordinate implementation of widespreadaction plans across various elements of the framework. Italso addresses methods to deal with changes in the organi-zation and its environment that will inevitably occur overtime.
After completing the seven major steps (each representedby a chapter), the organization will have a shared set of val-ues and purposes and a common language to use in dis-cussing future plans. More importantly, it will have anoverall sense of urgency to achieve key objectives and takespecific actions to change the culture so that each and everyemployee is focused on cash flow optimization.
Preface xvii


CHAPTER 1Conduct Strategic Audit
I f you don’t know where you’ve been, then it’s hard to fig-ure out where you are. If you don’t know where you are,
how can you decide where you want to go? If you don’tknow where you’re going, any road will get you there.
There is great value in reviewing the road your organiza-tion has traveled to get it to the place it is today. An under-standing of its historical functional emphasis (i.e.,marketing, sales, production, finance, or research) helpspaint a picture of the expertise resident in its people and sys-tems. An organization achieves higher levels of success morequickly if it focuses on building on its strengths. A clear pic-ture of how your organization’s resources have been allo-cated over the years enables you to see where assets (people,capital, facilities, and equipment) have been deployed. Byreviewing the returns associated with these investments, youwill be able to make financial decisions with inherently moreconfidence and a higher expectation of superior results.
Accordingly, the process of identifying where you’ve beenis both a qualitative and quantitative process. The strategicaudit encompasses both of these aspects and will assist you inreviewing your organization’s past performance. This multi-stage process results in a strong conceptual understanding of
1

the strategic building blocks at your disposal and is the firststep toward setting sound business goals and maximizingyour organization’s strategic value in the future.
It is important to remember that it is impossible for theorganization’s leader to know all aspects of the organizationas well as those who deal with them on a daily basis.Accordingly, the most effective way to utilize the materialpresented in this and the following chapters is to involve allkey members of the management team. An outside facilita-tor is generally retained to conduct the various exercises.However, it is not uncommon for the organization’s leaderto play this role or to assign another member of the man-agement to do so.
HIGHLIGHT EXISTING STRENGTHS
It is best to start with a qualitative look at your organization.This involves identification of its key processes, historicalfocus, and environmental positioning. The understanding youdevelop will enhance your ability to make sense of the num-bers when you begin the quantitative phase of the strategicaudit. The three procedures used to highlight existingstrengths require the involvement of all the key members ofthe management team.
Key Processes
Requirements You will need a large board on which to draw.
Methodology Diagram each activity in which your organiza-tion engages from the time the outside world first makes con-tact with it until a transaction (such as the delivery of aproduct or service) is complete. Change the diagram until the
2 CONDUCT STRATEGIC AUDIT
team reaches agreement or a consensus that the activitiesshown represent the sum total of the value added by the orga-nization during its normal course of business. Then combineand/or eliminate activities to create a diagram highlightingthe critical few, key processes in which your organizationengages. For an example of what this might look like, seeExhibit 1.1.
Result You have reached an understanding of the importantactivities your organization performs and all those who par-ticipated have a better understanding of the role they play inthe overall success of the organization. You also now have adocument that can be used to measure how effectively yourmanagement information system (manual or electronic)tracks the internal information needs of the organization astransactions flow from one key process to another duringthe course of a typical business day.
Historical Focus
Requirements You will need scratch paper to develop a ques-tionnaire, blank paper on which to print and make copies ofthe questionnaire, and graph paper to display the results ofthe questionnaire.
Methodology—Preparation Select six or seven key areas inwhich you and your organization have spent a fair amountof time and resources over the last five years. Use the outputfrom the Key Processes exercise to assist you in creating thislist if desired. Write down two or three specific activitieswhich have taken place on a more or less regular basisunder each area, starting each with an action verb (e.g.,opening new outlets, achieving low costs, enhancing salestraining). For an example of what this might look like, see
Highlight Existing Strengths 3

Exhibit 1.2. Then arrange the activities in random orderwith a blank column on either side as a questionnaire asshown in Exhibit 1.3. You are now ready to work with yourteam.
4 CONDUCT STRATEGIC AUDIT
EXHIBIT 1.1 Key Processes for ABC Company
Key Process Related Activities/Areas
Create demand Create and place magazine advertisementsMaintain and update web pageDistribute marketing brochuresDesign promotional programs
Process orders Train and staff 800-number operatorsMaintain sales force electronic reporting systemCoordinate invoicing and inventory controlUse common carriers with best rates
Manufacture Test competitive productsproduct Alter designs as external environment dictates
Maintain quality control systemPerform required maintenance in a timely way
Maintain Provide employee communication programwork force Ensure benefits appropriate for local area
Keep training programs frequent and funConduct employee entrance and exit interviews
Increase value Require sound analysis for new investmentsMonitor profit contribution of all departmentsMaintain management information systemComply with tax and other regulatory statutes

Methodology—Team Exercise Pass out the questionnaire to theparticipants and have them fill it out according to theinstructions. Then, one at a time going around the room,sum up the points by area.1 Once the total points by areaare calculated, create a bar graph where the points for the
Highlight Existing Strengths 5
EXHIBIT 1.2 Key Areas and Activities for ABC Company
Key Area Specific Activities
Administration Implementing management information systemsDealing with legal problems and solutions
Costs Negotiating the terms of materials procurementCreating and installing cost-control programs
Customers Ensuring fast project completion; meeting time demands
Establishing long-term customer relationships
Growth Opening new outlets and officesDeveloping and introducing new products and
services
Employees Selecting and training sales people, clerks, and engineers
Sponsoring activities to improve employee motivation
Marketing Engaging in advertising and promotion campaigns
Recognizing customer needs; conducting market research
Production Improving manufacturing processes and policiesMaintaining and enhancing quality control
procedures

6 CONDUCT STRATEGIC AUDIT
EXHIBIT 1.3 Past Areas of Emphasis at ABC Company
Over the last five years we have spent time on a variety of activi-ties as highlighted below. Your task now is to identify those inwhich we invested the most time and resources. That is:
! They were discussed most frequently and intensively inmeetings.
! They absorbed the most management time.! They were allocated most of our financial and manpower
resources.
Step 1In the left-hand column, mark the top five resource-using activities.
Step 2In the right-hand column, rank only those subject areas marked inStep 1 from most to least resource-using (assign five points to most,four points to second-most, three points to third-most, two pointsto fourth-most, and one point to fifth-most).
Remember: Select exactly five activities to rank, no more, no less.
Top Resource-Using Activities Points
1. Implementing management information systems2. Dealing with legal problems and solutions3. Negotiating the terms of materials procurement4. Creating and installing cost-control programs5. Ensuring fast project completion; meeting time demands6. Establishing long-term customer relationships7. Opening new outlets and offices8. Developing and introducing new products and services9. Selecting and training sales people, clerks, and engineers
10. Sponsoring activities to improve employee motivation11. Engaging in advertising and promotion campaigns12. Recognizing customer needs; conducting market research13. Improving manufacturing processes and policies14. Maintaining and enhancing quality control procedures

highest scoring area become 100% and each other area’spoint total becomes a percent of this number (e.g., highestarea = 60 points, next area = 45 points, third area = 30points, so highest area = 60/60 = 100%, next area = 45/60 =75%, third area = 30/60 = 50%). This graph is usually pre-pared using presentation software so it can be projected ona screen where the entire team can view the results.2 For anexample of what this might look like see Exhibit 1.4.
Result The resulting graph shows the relative emphasisplaced on the key areas of the business, perhaps highlightingthose that received too much attention and those that wereoverlooked much of the time. Not surprisingly, organizationsstarted by engineers often have an undue focus on production
Highlight Existing Strengths 7
EXHIBIT 1.4 Historical Focus of ABC Company

and cost-cutting activities, while those started by sales peo-ple stress activities related to marketing and the customer.In Exhibit 1.4, for example, the founders were a strongsales person as Mr. Outside and a competent accountant asMr. Inside, resulting in relatively little attention to employ-ees, production, and growth. Regardless, what you haveachieved is an unbiased consensus of how resources wereallocated over the last five years, without actually perform-ing any financial analysis.
Environmental Positioning
Requirements You will need one can of spray-on artist’sadhesive, index cards of four different colors, felt-tippedpens, a package of stick-on red dots, and a blank wall cov-ered with paper.
Methodology—Preparation Spray the paper on the wall com-pletely with the artist’s adhesive so that index cards can beplaced on and taken off the paper effortlessly. Pass outindex cards of each color to every participant.3 Then passout felt-tipped pens and ten red dots to each participant.
Methodology—Team Exercise Pick one card color each forstrengths, weaknesses, opportunities, and threats. Ask eachparticipant to keep the organization in mind as it exists todayand write down on the appropriate color the most importantor greatest strength, weakness, opportunity, and threat. Writedown other important items in the same categories for eachcard they have, if they have more than one card. Next, allcards are placed on the paper on the wall grouped by color.After the group discards cards that represent duplication of
8 CONDUCT STRATEGIC AUDIT

ideas, all participants place their ten red dots on the remain-ing card or cards that are most important to them.4
Result In less than one hour, a starting consensus is reachedregarding how the organization is positioned in its environ-ment and what strengths it can most readily explore build-ing upon. It also has a pretty good sense for the majorissues, challenges, and opportunities it faces in the yearsahead.
With a solid qualitative understanding of the majorprocesses, asset allocations, and strengths developed overthe last five years in hand, you are now in a position to gainadditional insight based on quantitative analyses. By per-forming some basic financial calculations, you can ascertainwhat the actual strategies have been over the last five yearsas well as measure your organization’s growth and perfor-mance relative to other companies and industries. Often,the results of these efforts suggest that the actual perfor-mance of an organization is different from that espoused byits mission and/or leaders. Identifying such disconnects isthe first step toward creating an organization capable ofstrategically adding value over the long term.
IDENTIFY IMPLICIT STRATEGIES
The simple definition of strategy, and the one used throughoutthe book, is “the allocation or withdrawal of resources.” Eachorganization’s resources are different, but they include the timeof management, staff, and other employees; tangible assets suchas the real estate and facilities the organization owns or leasesand the equipment and tooling used in providing a product or
Identify Implicit Strategies 9

service; and intangible items such as proprietary systems,patents, trademarks and training programs. No organizationhas unlimited resources, although some tend to act like it in theshort run. Accordingly, all resources should be considered pre-cious and scarce.
In order to determine what your organization’s implicitstrategies in the past have been, you must examine howresources were allocated. Each organization is structured ina unique way, with various components comprising thewhole. As a first step, then, you should select the naturalparts of your organization for analysis. You will need tohave financial records for the last five years that tell youyear by year the net assets employed in each selected part ofthe organization and the related contribution. Net assets aresimply total assets less noninterest bearing liabilities, whilecontribution is merely operating profit times one minus thetax rate (1 – tax rate). It is more important for now that thenumbers be calculated the same way for each part ratherthan worrying about precise definitions for net assets orcontribution.
For exemplary purposes, we will look at the past perfor-mance of the ABC Company in the two ways managementtypically thought about the organization:
1. By business unit2. By geographical area
For ease of understanding we use three years of data.After isolating net assets and contribution by business seg-ment, you then calculate the annual net asset growth rateand the average return on net assets for each segment. For
10 CONDUCT STRATEGIC AUDIT

how this output might appear, see Exhibit 1.5. These resultscan then be graphed to demonstrate which segments weregenerating cash (resources) and which segments were usingthem up. This provides a pictorial representation of theimplicit strategy. The ABC Company’s implicit business unitstrategy is shown in Exhibit 1.6, and its implicit geographi-cal area strategy is shown in Exhibit 1.7.
If you examine ABC Company’s implicit business unitstrategy you can see that Unit C clearly has the highestreturns, yet the company has not invested in (allocatedresources to) Unit C at all. Instead, Units A and B, withlower returns, have received all the funds. Note if a unit isright on the diagonal line, its percentage return is exactlythe same as its net asset growth, thereby it is self-funding.
Identify Implicit Strategies 11
EXHIBIT 1.5 Returns and Growth for ABC Company Segments
Business Unit Annual Net Asset Average Return onSegmentation Growth (%) Net Assets (%)
Unit A 41.4 15.8Unit B 33.3 18.3Unit C 0.3 26.9
Geographical Area Segmentation
North 23.1 8.1South 30.6 35.2East 40.9 26.2West 6.8 24.9Canada 28.6 22.1

12 CONDUCT STRATEGIC AUDIT
00
5
10
15
20
25
30
35
40
45
5 10 15 20 25 30 35 40 45Return on Net Assets (%)
Unit A
Unit B
Unit C
Cash Negative(Cash User)
Cash Positive(Cash Provider)
Net
Ass
ets
Gro
wth
Rat
e (%
)
EXHIBIT 1.6 Implicit Business Unit Strategy
Also note, for both Exhibits 1.6 and 1.7, the circles repre-senting the segments are proportional to the overall size ofthe segment.
For ABC Company’s geographical area segmentation, itis clear that the North is the largest operation but it is pro-viding the smallest return. In spite of this, its net assetgrowth rate is over twice its return rate. In fact, note that allareas to the left and above the line are receiving funds at afaster rate than they are earning them.
These two segmentations for the ABC Company madeclear to management that they could not continue to allo-cate resources in the future as they had in the past. Thesesimple calculations and resultant graphical presentationquickly and forcefully got the message across to all involved

and accelerated the speed and enhanced the teamworkinvolved in remedying the situation.
PLOT GROWTH PERFORMANCE
At some point, you must step outside the organization andput it into perspective vis-à-vis other similar organizationsand the economy as a whole. The larger your organizationis or becomes, the more important this is. A good place tostart is to compare your organization’s growth rate to thatof the industry in which it competes. There are many publicsources of information available in the reference section ofyour local library that may provide industry data. Another
Plot Growth Performance 13
00
5
10
15
20
25
30
35
40
45
5 10 15 20 25 30 35 40 45
Return on Net Assets (%)
Net
Ass
ets
Gro
wth
Rat
e (%
)
North
East
Canada
Cash Negative(Cash User)
Cash Positive(Cash Provider)
South
West
EXHIBIT 1.7 Implicit Geographical Area Strategy

good source is to go directly to your industry associationand review their publications and interview the head librar-ian at the association’s headquarters.
Once you have collected overall sales revenue informa-tion for your organization and its industry for five years,you are ready to compare and contrast the two. An effectivemethod for accomplishing this involves converting both setsof numbers to a standard index. This is done for ABCCompany and its industry in Exhibit 1.8.
With the data indexed, it is a simple matter to graph theresults and determine how your organization is doing versusthe industry as a whole. As shown in Exhibit 1.9, ABCCompany is not growing as fast as the industry in which itparticipates.
14 CONDUCT STRATEGIC AUDIT
EXHIBIT 1.8 Indexing Sales Revenue Data
Year 1 Year 2 Year 3 Year 4 Year 5
ABC Company 70.5 75.8 97.9 122.3 162.2$ in MM
Industry Composite 14.3 16.4 21.5 28.7 37.3$ in BB
ABC Company 100 108 139 173 230Index
Industry Composite 100 115 150 201 261Index
Note: To convert from dollars to the index, divide yearly data by year one data and multiplyby 100. For example, for ABC Company Year 1/Year 1 = 70.5/70.5 = 1 ! 100 = 100; Year2/Year 1 = 75.8/70.5 = 1.08 ! 100 = 108, etc.

What this means is that over the last five years, it hasbeen losing market share. If your organization operates inmore than one industry or, like ABC Company, has threeunits operating in different, but measurable segments of alarger industry, it may be desirable to examine the marketshare dynamics at the next level of detail. By plotting indus-try segment sales growth versus business unit sales growth,one can quickly see whether the unit is gaining or losingshare by noting on which side of the line it appears.
This relationship for ABC Company is shown in Exhibit1.10, which clearly indicates Unit B is losing share, Unit A
Plot Growth Performance 15
1100
120
140
160
180
200
220
240
Industry Composite
ABC Company
(23% per year)
(27% per year)
260
280
2 3 4 5
Years
Inde
x
EXHIBIT 1.9 Revenue Growth Years 1 to 5

(right on the line) is holding share and only Unit C is gain-ing market share. As it turns out, Unit C is operating in asegment where it is able to price its goods and services verycompetitively and still make a sound return. It is able to andhas increased its market penetration and gained marketshare over the period in question.
ANALYZE PROFITABILITY RATIOS
Profitability ratios are useful in pointing out changes inoperating performance over several years. They help youassess whether resources were used effectively in the pastand aid in measuring the economic impact of prior manage-
16 CONDUCT STRATEGIC AUDIT
1010
15
20
25
30
35
40
15 20 25 30 35 40
Business Unit Sales Growth
Unit B
Unit A
Unit C
LOSING SHARE
GAINING SHARE
Indu
stry
Seg
men
t Sal
es G
row
th
EXHIBIT 1.10 Business Unit Market Share Trends

ment decisions. A profitability ratio compares profit tosomething else, generally by dividing the profit by the“something else.” The profit number used here is calledoperating profit, which is earnings before interest and taxes.Taxes can vary because of events other than the operationof the business. Interest relates to the amount of debt, whichcan vary based on the stage of growth of the company, theindustry in which it operates, or the risk preferences ofmanagement. Accordingly, these two items are excluded.Operating profit that has been so filtered can be used to cal-culate ratios, which can be compared to other companieswhose financials have also been so filtered and makes formeaningful comparisons of relative management efficiency.
The rate of return on sales (operating profit/net sales)indicates how much profit was generated by each sales dol-lar. To tell how well your organization is doing it is neces-sary to contrast this ratio to that for your industry. Incertain industries rates of return below 1% are common,while in others, rates in excess of 20% are the norm. If yourrate is below that of your industry, this might suggest yourexpenses are on the high side or your prices are on the lowside.
The rate of return on assets (operating profit/totalassets) measures the profit generated by the assets of thebusiness. Again, comparison of your organization to theindustry norm is recommended. However, if you have fixedassets that have been heavily depreciated over time, thismay raise the ratio and give you a more positive indicationthan is warranted.
The rate of return on equity (operating profit/net worth)indicates how much profit was derived from the owners’
Analyze Profitability Ratios 17
investment in the organization. If this ratio is on the lowside, it suggests the funds might be better invested else-where.
Comparing these ratios for your organization with thoseof other organizations in your industry and the industryaverages provides you with another set of external compar-isons. This information can assist you in determining howyour organization is strategically positioned relative to thecompetition.
DETERMINE RELATIVE VALUE
The final step in the strategic audit is to determine the rela-tive value of your organization. When taken together withthe rest of the above analysis, the calculation of relativevalue plants a stake in the ground that clearly indicates thesize and the nature of the opportunities you have to enhancethe value of your organization.
To undertake this analysis you will need to identify thosepublic companies that are most similar to your organizationand obtain three numbers for each:
1. Market value2. Book value3. Five year average return on equity5
Once these are assembled a chart is created. For each com-pany, the market value is divided by the book value andplotted on the y or vertical axis, and the return on equity isplotted on the x or horizontal axis. A regression line (easilycalculated by most spreadsheet software) indicates the aver-
18 CONDUCT STRATEGIC AUDIT
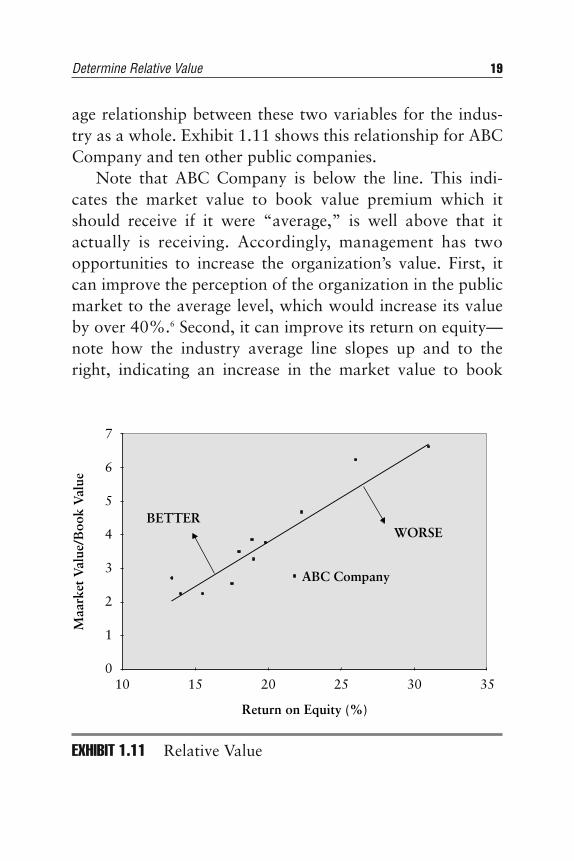
age relationship between these two variables for the indus-try as a whole. Exhibit 1.11 shows this relationship for ABCCompany and ten other public companies.
Note that ABC Company is below the line. This indi-cates the market value to book value premium which itshould receive if it were “average,” is well above that itactually is receiving. Accordingly, management has twoopportunities to increase the organization’s value. First, itcan improve the perception of the organization in the publicmarket to the average level, which would increase its valueby over 40%.6 Second, it can improve its return on equity—note how the industry average line slopes up and to theright, indicating an increase in the market value to book
Determine Relative Value 19
100
1
2
3
4
5
6
7
20 2515 30 35
Return on Equity (%)
BETTERWORSE
ABC Company
Maa
rket
Val
ue/B
ook
Val
ue
EXHIBIT 1.11 Relative Value

value premium when return on equity increases. This rela-tionship generally holds true regardless of the industry inwhich an organization competes; however, the line itselfmay shift up or down depending on the economics andprospects of the particular industry.
For the privately held organization that has no publicmarket for its shares this analysis is still useful. By determin-ing your organization’s return on equity and vertically goingup until you reach the line, you can, at that point, read theaverage market value to book value premium indicated fororganizations in your industry with your return on equity.To estimate your market value, therefore, simply multiplythe premium indicated on the y axis times your book value(shareholders’ equity account).
SUMMARY
Once you have completed the steps involved in the strategicaudit outlined in this chapter, you will have both a qualita-tive and quantitative review of where your organization hasbeen and what it can build on. This will allow you to deter-mine where you are going and how fast you can get there.When you and your team have this kind of overview, thetask of setting sound business goals can begin in earnest.
ENDNOTES
1. If time permits, have participants explain the reasoningbehind their selections and weighting, perhaps by citing aspecific example or two. This type of discussion often feeds
20 CONDUCT STRATEGIC AUDIT
upon itself as points expressed by one individual spark relatedideas in the minds of others. Having a scribe capture thesecomments for future consideration is a good idea becausemajor issues and opportunities for the organization aregenerally identified in this type of interchange forum.
2. Alternative methods for presenting results include the use offlip charts, blackboards, or blank acetates written on withcolored pens and projected on a screen using an overheadprojector.
3. Three cards of each color for five or fewer participants, twocards of each color for six to ten participants, one card ofeach color for groups over ten participants.
4. Ten dots on one card, one dot each on ten cards, or anythingin between is allowed. The only rule is participants must useall their dots.
5. Pick a recent point in time that makes collecting theinformation relatively easy, for example, at the end of the lastcalendar year or latest quarter.
6. Moving straight up from the actual ABC Company point tothe industry regression line increases the ABC Companymarket value to book value ratio from about 2.8 to over 4.0.
Endnotes 21


23
CHAPTER 2Calculate Current Value
Valuation knowledge allows an organization to grow andprosper. It empowers everyone in your organization to
work together to achieve common goals in a disciplined,compassionate, effective manner. When they understandhow value is created and have a clear understanding of theirrole in the process, they know they are making decisionsthat enhance the overall worth of their organization.Accordingly, all individuals gain a higher sense of self-esteem and a feeling of worth and freedom.
In Chapter 1’s “Determine Relative Value,” you wereintroduced to the concept of relative value—how your orga-nization stacks up to other similar operations. While this isa useful starting point, a more accurate value can be deter-mined by examining additional specific financial character-istics of your organization.
DISCOVER IMPORTANCE OF VALUE
There are three primary reasons why every entrepreneurand executive should understand how organizations are val-ued and master the process of valuation. They are:
1. Make decisions to optimize company value when yourun a business
2. Obtain the best price and terms when you buy a business3. Obtain the best price and terms when you sell a business
The wealth an organization generates over time isdirectly related to its ability to create value. Whether youare an individual selling magazines on the corner, an entre-preneur building a fast-growing technology concern, or thedirector of a not-for-profit organization, the more wealthyou create, the better off you will be. The magazine mer-chant will have more money in the bank at the end of theyear to spend on personal or family requirements. Theentrepreneur will provide a higher return for investors. Thedirector can provide more and higher quality services forconstituents.
Individuals and Organizations
The reason organizations are generally formed is becausethe potential exists to achieve more as an entity than is pos-sible on the individual level. One person can work only somany hours in a day and, accordingly, even at a very highwage or hourly billing rate, there is an absolute limit to thewealth a single person can create this way. Some peopleleverage themselves and, hence, their productivity, by hiringothers to do specialized tasks that would otherwise detractfrom their ability to provide the service they can bill out atthe highest rate. The streamlining of the modern medicalpractice, where several nurses, medical assistants, reception-ists, bookkeepers, and insurance specialists all provide an
24 CALCULATE CURRENT VALUE
element of the total health care product you and I receivewhen we visit a doctor or dentist’s office, is an example ofthis type of leverage. Still, the medical practitioner is limitedto only so many hours in the day, regardless of the level ofefficiency that is achieved.
More wealth can be created by the individual when thecollection of skills and practices and procedures used toachieve initial success are institutionalized. That is, instead ofjust providing as much service as one can fit into a day, theentrepreneur, in effect, creates clones that can duplicate theservices provided over and over again. To be effective, theinstitutionalization process requires not only appropriatetraining in product/service delivery and support proceduresand policies, but also that the overall entity is monitored andmanaged effectively.
Some economic opportunities and social services requiresize to compete effectively or deliver a service correctly andat reasonable cost. Certainly, you and I could spend timewith the classifieds and on the internet to identify enoughparts to put a car together and ultimately sell it. However,in the automobile business, as in many traditional economicventures involving a product, there is a world-class scale ofoperations that requires both labor and capital in order toachieve the economies required to provide useful goods at acompetitive and reasonable cost. In the service business andnot-for-profit organizations, training, regulatory, fund rais-ing, and recruitment/retention expertise are just some of theelements of providing services that require this type of largescale focus to operate efficiently. Capital funding for com-puters and other equipment to manage many aspects ofoperations is also important in service-oriented organizations.
Discover Importance of Value 25

Financial Relationships
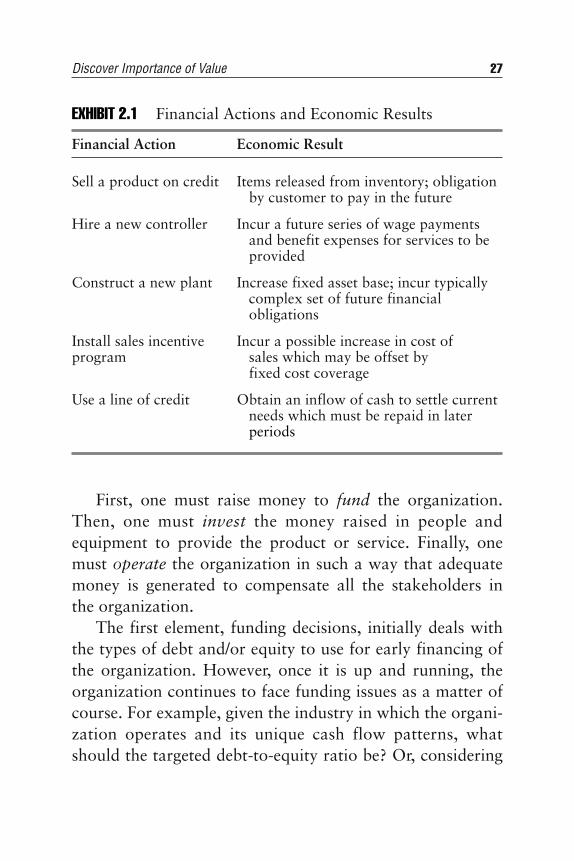
In every organization, there are internal financial relation-ships between departments and functions and operatingentities. There are also external financial relationshipsbetween the organization and its various stakeholders, suchas customers, employees, suppliers, lenders and investors.Decisions made within these relationships generally result inmovements of cash that take place immediately, over timeand/or in the future. That is, each decision results in one ormore actions which have financial or economic conse-quences and, hence, impact the organization’s cash flow.Examples of such actions and the financial results are con-tained in Exhibit 2.1.
The management that can make consistent, high-qualitydecisions that maximize cash flow over time is doing thebest job for its constituents. Just like children, the moremoney in the bank at the end of the year, the happier theyare.
Economic Elements
Despite the wide diversity in types of organizations andmanagement priorities, the decisions which affect cashflows are generally one of three types or elements, which,together, form an integrated economic framework. These, inthe order in which they initially occur, are:
1. Funding2. Investing3. Operating
26 CALCULATE CURRENT VALUE
First, one must raise money to fund the organization.Then, one must invest the money raised in people andequipment to provide the product or service. Finally, onemust operate the organization in such a way that adequatemoney is generated to compensate all the stakeholders inthe organization.
The first element, funding decisions, initially deals withthe types of debt and/or equity to use for early financing ofthe organization. However, once it is up and running, theorganization continues to face funding issues as a matter ofcourse. For example, given the industry in which the organi-zation operates and its unique cash flow patterns, whatshould the targeted debt-to-equity ratio be? Or, considering
Discover Importance of Value 27
EXHIBIT 2.1 Financial Actions and Economic Results
Financial Action Economic Result
Sell a product on credit Items released from inventory; obligation by customer to pay in the future
Hire a new controller Incur a future series of wage payments and benefit expenses for services to beprovided
Construct a new plant Increase fixed asset base; incur typically complex set of future financialobligations
Install sales incentive Incur a possible increase in cost of program sales which may be offset by
fixed cost coverage
Use a line of credit Obtain an inflow of cash to settle current needs which must be repaid in laterperiods

the prospects for growth, how much profit should be paidout in dividends and how much should be kept for futureinvestment?
Investing decisions, the second element, initially dealwith trying to obtain the correct combination of labor andcapital to allow the organization to run as efficiently as pos-sible. Over time, decisions as to credit, inventory, and pay-ment policies that affect the level of working capital becomeadditional investing decisions that must be addressed.Regularly assessing the plant and equipment base as towhether continued investment makes sense and consideringacquiring other operations or selling some already ownedare other types of investing decisions which organizationsface.
Initial operating decisions, such as at what price to sellthe product, which market to target, and what level of ser-vice to provide, allow the organization to plant a stake inthe ground against which to measure subsequent financialperformance. Ongoing adjustments in pricing, markets, andservice and other related and supporting areas, comprise thethird element of the organization’s integrated economicframework—operating decisions.
Cash Generation
Decisions in all of the three elements affect the organiza-tion’s overall cash flow. Some decisions have a positiveeffect, increasing the cash available to the organization,some have a negative effect, decreasing the cash available tothe organization. When the organization generates net posi-tive cash flows over time, it is creating value. Furthermore,
28 CALCULATE CURRENT VALUE

the more cash flow that can be generated and the smallerthe investment required, the greater the value created.
Numerous studies of public companies which measurethe correlation of various alternative financial measures tovalue bear this out. Growth in earnings has very little posi-tive correlation with company value (accounting conven-tions used to arrive at reported earnings and a lack of anyconsideration of the size of investment required to achievethe growth are the key reasons). Return on equity (earn-ings/equity) has a small positive correlation with companyvalue (lack of consideration of how much debt is used anddifferences in depreciation methods resulting in similarassets at differing book values are the key reasons). Returnon capital employed (earnings/(equity + debt)) has a slightlyhigher correlation with company value, but still retainsaccounting-convention flaws associated with reported earn-ings and depreciation and also does not consider leasedproperty. However, when the cash flow return on invest-ment (cash flow/investment) is calculated, the correlationwith company value is two to three times as high as the pre-vious two methods.
The message is clear. As an owner and/or manager of anorganization, focus on maximizing cash flow1 to obtain thebenefits of high value for your organization.
Summary
The key management challenge today, regardless of thenature of the organization, is to create value. Accordingly,the basic purpose of the organization from a value perspec-tive is cash flow production. The more members of the
Discover Importance of Value 29

organization who realize this, and consider the conse-quences of their daily decisions2 in cash flow terms, thegreater chance the organization has to maximize its cashflows over time and survive and prosper in a rapidly chang-ing world.
MASTER DISCOUNTED CASH FLOW
One of the key differences between individuals and organi-zations is that, unlike an individual, the life of an organiza-tion is not necessarily limited by biological factors. Providedit is well managed (i.e., continues to generate adequateamounts of cash for its purposes), an organization can lastas long as it is fulfilling an economic need. Accordingly, it isuseful to consider, from a valuation point of view, that eachorganization is a going concern, regardless of the uniqueeconomic dynamics it might possess. The discounted cashflow methodology considers the net cash flows expectedfrom the organization for a reasonable time in the future,and discounts these to present worth at an appropriate rate.
Future Benefits
Cash flows from a going concern can be considered astream of benefits, much the same as if you placed a sum ofmoney in a savings account and you received a stream ofannual interest payments as benefits from your action. Thevalue of an organization today is dependent on the futurebenefits that will accrue to its stakeholders, with the valueof the future benefits discounted back to the present at someappropriate discount rate. Therefore, the approach to deter-mining today’s value is simply to project the future benefits
30 CALCULATE CURRENT VALUE
(generally cash flows) and to discount the projected streamback to a present value. The more organization-specificsuch projections are, and the more they are based on itsfinancial capabilities and marketplace realities, the higherconfidence it is possible to put into the calculated valuation.
Financial Inputs
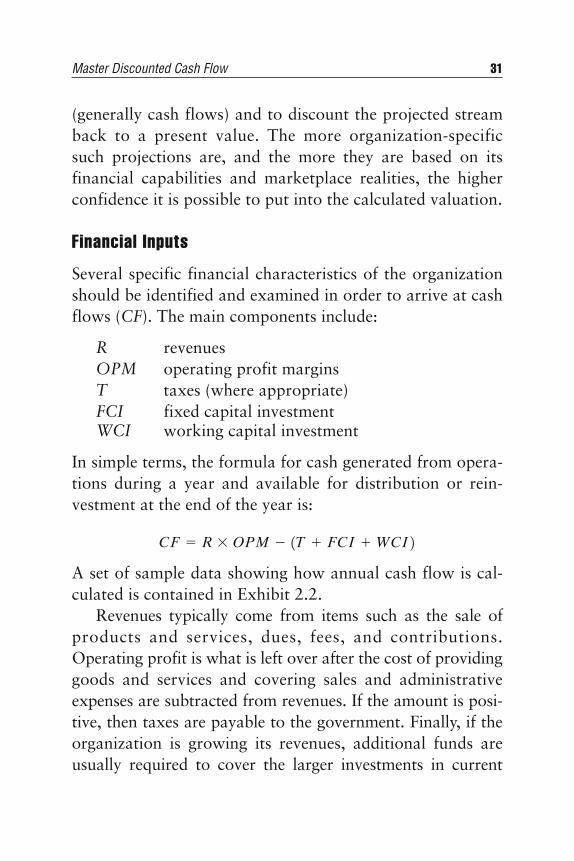
Several specific financial characteristics of the organizationshould be identified and examined in order to arrive at cashflows (CF). The main components include:
R revenuesOPM operating profit marginsT taxes (where appropriate)FCI fixed capital investmentWCI working capital investment
In simple terms, the formula for cash generated from opera-tions during a year and available for distribution or rein-vestment at the end of the year is:
A set of sample data showing how annual cash flow is cal-culated is contained in Exhibit 2.2.
Revenues typically come from items such as the sale ofproducts and services, dues, fees, and contributions.Operating profit is what is left over after the cost of providinggoods and services and covering sales and administrativeexpenses are subtracted from revenues. If the amount is posi-tive, then taxes are payable to the government. Finally, if theorganization is growing its revenues, additional funds areusually required to cover the larger investments in current
CF " R ! OPM # 1T $ FCI $WCI 2
Master Discounted Cash Flow 31
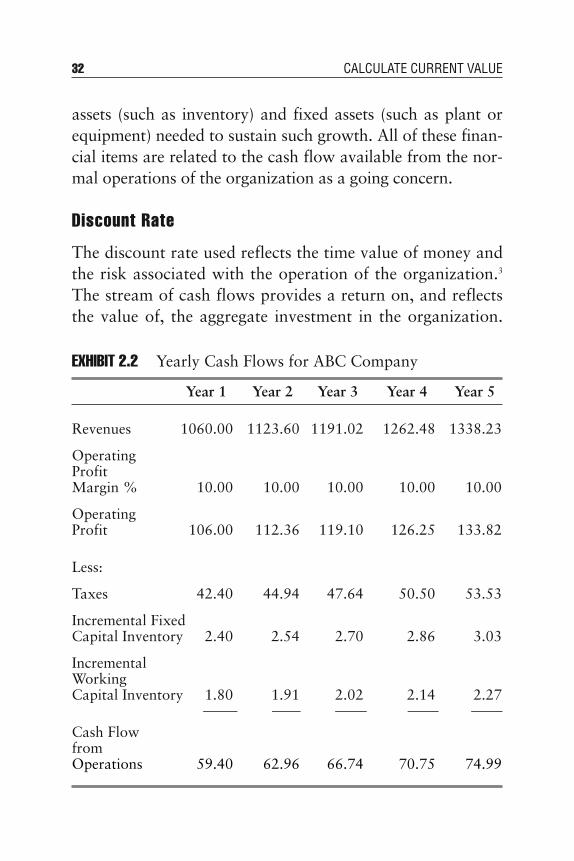
assets (such as inventory) and fixed assets (such as plant orequipment) needed to sustain such growth. All of these finan-cial items are related to the cash flow available from the nor-mal operations of the organization as a going concern.
Discount Rate
The discount rate used reflects the time value of money andthe risk associated with the operation of the organization.3
The stream of cash flows provides a return on, and reflectsthe value of, the aggregate investment in the organization.
32 CALCULATE CURRENT VALUE
EXHIBIT 2.2 Yearly Cash Flows for ABC Company
Year 1 Year 2 Year 3 Year 4 Year 5
Revenues 1060.00 1123.60 1191.02 1262.48 1338.23
OperatingProfitMargin % 10.00 10.00 10.00 10.00 10.00
OperatingProfit 106.00 112.36 119.10 126.25 133.82
Less:
Taxes 42.40 44.94 47.64 50.50 53.53
Incremental Fixed Capital Inventory 2.40 2.54 2.70 2.86 3.03
IncrementalWorkingCapital Inventory 1.80 1.91 2.02 2.14 2.27
Cash Flow fromOperations 59.40 62.96 66.74 70.75 74.99
At the end of the growth period, the organization still hasworth, which is called its ending value.
As seen in Exhibit 2.2, operating cash flows are derivedby subtracting taxes from operating profit as well asallowances for incremental investments to fund increasinglevels of organizational activity and anticipated fixed assetexpenditures. At the end of the cash flow projections for-ward for a reasonable time into the future, cash flows aregenerally assumed to stabilize (grow no more). This allowsan ending value for the organization to be calculated andthen discounted to present worth and added to the presentworth of the interim cash flows.
To find the present worth of a future cash flow or value,one simply multiplies the cash flow by a discount factorappropriate for that time period and the chosen discountrate. The factor is calculated as follows:
1/(1 ! Discount Rate)n
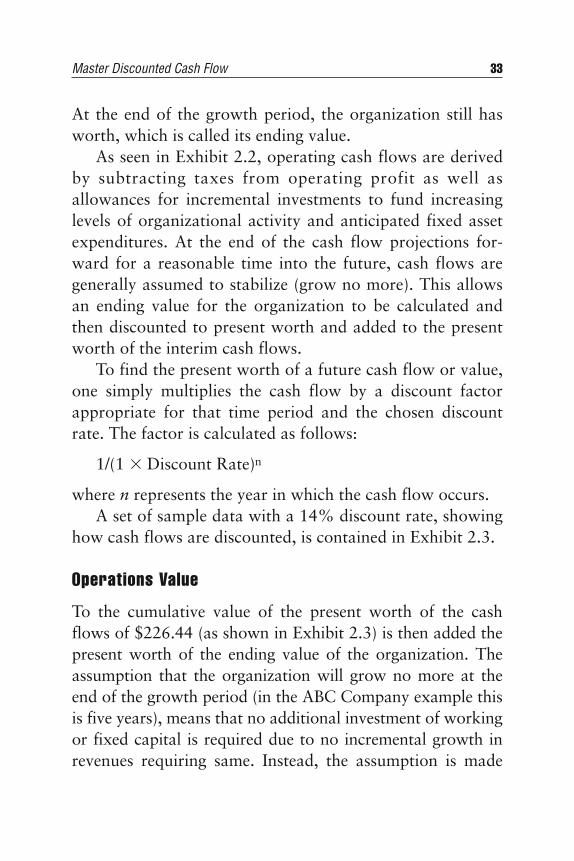
where n represents the year in which the cash flow occurs.A set of sample data with a 14% discount rate, showing
how cash flows are discounted, is contained in Exhibit 2.3.
Operations Value
To the cumulative value of the present worth of the cashflows of $226.44 (as shown in Exhibit 2.3) is then added thepresent worth of the ending value of the organization. Theassumption that the organization will grow no more at theend of the growth period (in the ABC Company example thisis five years), means that no additional investment of workingor fixed capital is required due to no incremental growth inrevenues requiring same. Instead, the assumption is made
Master Discounted Cash Flow 33
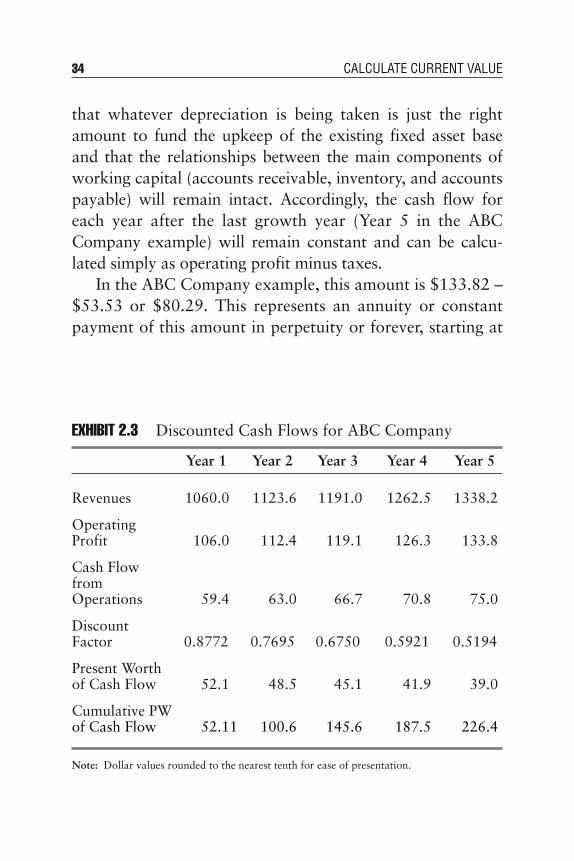
that whatever depreciation is being taken is just the rightamount to fund the upkeep of the existing fixed asset baseand that the relationships between the main components ofworking capital (accounts receivable, inventory, and accountspayable) will remain intact. Accordingly, the cash flow foreach year after the last growth year (Year 5 in the ABCCompany example) will remain constant and can be calcu-lated simply as operating profit minus taxes.
In the ABC Company example, this amount is $133.82 –$53.53 or $80.29. This represents an annuity or constantpayment of this amount in perpetuity or forever, starting at
34 CALCULATE CURRENT VALUE
EXHIBIT 2.3 Discounted Cash Flows for ABC Company
Year 1 Year 2 Year 3 Year 4 Year 5
Revenues 1060.0 1123.6 1191.0 1262.5 1338.2
OperatingProfit 106.0 112.4 119.1 126.3 133.8
Cash Flow fromOperations 59.4 63.0 66.7 70.8 75.0
DiscountFactor 0.8772 0.7695 0.6750 0.5921 0.5194
Present Worth of Cash Flow 52.1 48.5 45.1 41.9 39.0
Cumulative PW of Cash Flow 52.11 100.6 145.6 187.5 226.4
Note: Dollar values rounded to the nearest tenth for ease of presentation.

the end of Year 5. To calculate the worth of this type of pay-ment, the payment itself is divided by the discount rate. Thisworks out to be a value of $573.50 at the end of Year 5($80.29 / 14%). Finally, to obtain the worth of this annuitytoday, this value must be multiplied by the discount ratefactor for Year 5, which results in an ending value for ABCCompany today of $297.87.
When today’s ending value for the organization is addedto the cumulative value of the cash flows, a total valuationof the operating cash flow potential of the organization canbe calculated. In the ABC Company example, this totalvalue is equal to $524.31 ($297.87 + $226.44).4
Summary
The operations value is independent of and does not con-sider how the organization has been financed and whetheror not there is any debt. As you may recall, there is no con-sideration of interest expense in any of the calculationsabove. This is because it is important to always separate outthe investment decision (what is the organization as a col-lection of labor and capital capable of doing), versus howyou might fund the investment required to put such anorganization in place or to buy one which already exists.
UNDERSTAND VALUE DRIVERS
Each of the major financial inputs used to determine thevalue of an organization’s operations is, in turn, itselfimpacted by other variables. These variables determine ordrive the value of the financial inputs used. This section high-lights the key drivers of value for each of the major financialinputs discussed in this chapter’s “Financial Inputs.”
Understand Value Drivers 35
Revenue
Revenues are generally the first item on an organization’sprofit and loss or income statement. It represents the pri-mary source of money received from customers or membersfor goods sold or services rendered. It usually is a net num-ber representing the amount received after taking into con-sideration any product returns and allowances for pricereductions.
The first key driver of revenue is price. If your organiza-tion engages primarily in providing products, then theprices involved would be on a per unit basis. If, however, itprovides services, the prices involved would more likely berelated to the hourly billing rate of the people providing theservices. An upper limit on price is often perceived to be setby demand, the competition, or the marketplace. In reality,any product or service provided is a combination of notonly the basic product or service, but also the quality, fea-tures, and longevity of what is being sold and the deliveryschedule, payment terms, and other characteristics of thesales transaction. The real measure of price is the value per-ceived by and delivered to the consumer.
For example, if a personal tax preparation serviceoffered to review your taxes and save you $3,000 on yourtax bill legally, all for $1,000, you would likely take themup on their offer. Logically, you should not care whether thebilling rate (price) of the preparer is $1,000 per hour (repre-senting one hour of work) or $100 per hour (representing10 hours of work). Conversely, some people who do notwant a product at any price (e.g., you may not be able togive a free candy bar to some people), will not be swayed byan otherwise low price. Therefore, in the area of the price
36 CALCULATE CURRENT VALUE

driver, there is often more flexibility than meets the eye inmaking decisions to increase price and cash flow and orga-nization value.
The other key driver of revenue is volume. The moregoods you provide at a given price, the higher the revenuesare going to be. The more hours your staff is billable in aservice business, the higher the revenues will be. Decisionswhich add a second sale per sales call or result in a serviceprovider selling additional work to the same customer rep-resent examples of how to improve revenues and valueusing the volume driver.
Operating Profit Margin
The operating profit margin is the percentage of revenuesremaining after operating costs for the organization havebeen accounted for. The major elements of operating costsin most organizations consist of the cost of goods sold orservices provided, depreciation expense, and selling andgeneral expenses.
For a typical manufacturing organization, the cost ofgoods sold represents all the costs incurred in the factoryand is usually the largest cost item. Its key drivers generallyinclude raw material, labor, energy, and factory overhead.The key driver for service organizations is generally labor(i.e., the assets go home at night).
The importance of depreciation expense depends on thesize and acquisition time frame of the fixed assets employedby the organization. For the purpose of organization valua-tion, the amount set aside for depreciation is assumed to bespent replacing the assets in question and, accordingly, doesnot drive cash flow or value at all.
Understand Value Drivers 37

The key drivers of selling expenses include sales forcesalaries/commissions, advertising/promotion, and travel/entertainment. For some organizations, the decisions maderegarding product/service distribution and logistics can be amajor area in which to improve cash flows and value as well.
The key driver for general expenses is administrativeefficiency. However, organizations with large research anddevelopment staffs have opportunities for value-enhancingdecisions in this area. The main point to remember is that,in cost-centered operations, the organization can onlyreduce negative cash flow so much without hampering theoverall performance of the organization. Accordingly, aglobal view is important here. Also, some creative organiza-tions, when thinking wisely about cash flow, have actuallyturned cost centers into profit centers by selling servicesthey otherwise normally perform for their own organizationto other organizations as well.
Taxes
When taxes are considered, it is the cash impact of taxeswhich is important to organization value. Certain decisionsregarding depreciation and accounting for acquisitions tend tooverstate reported earnings but adversely affect true cash flow.It generally is a smarter move to maximize the cash flow fromtax decisions rather than be overly concerned with what isreported to the public, banks, investors, or other lenders.5
Fixed Capital Investment
The key drivers of fixed capital investment, again, dependto a great extent on the nature of the organization. For low
38 CALCULATE CURRENT VALUE

fixed capital organizations, this item is often considered asecondary driver. However, when safety requirements,machinery additions and replacements, environmentalrestrictions, and capacity expansion options loom large rel-ative to available cash flow, some or all of these items mightbe considered key drivers of value.
Working Capital Investment
The three key components of working capital are accountsreceivable, inventory, and accounts payable. Each of these,for all organizations, is a key driver. Decisions relating tohow much credit to extend to customers, when to payreceivables, how quickly to turn or mark down inventory,and how much interest to charge on delinquent accountsare all factors that affect the level of working capitalinvestment required for a given level of operations and, inturn, affect the overall cash flow and value of the organi-zation.
Summary
Once you have incorporated the key drivers into a simplespreadsheet economic model of your organization, you caneasily ascertain which ones are most important to cash flow.By changing a key driver assumption, you can test the sensi-tivity of the result to the degree of change in the key driver.Becoming familiar with which key drivers have the largestimpact on cash flow is the first step in focusing your deci-sion making on those operations of the organization whichare the most important to enhancing its value.
Understand Value Drivers 39

DETERMINE COST OF CAPITAL
The discount rate used to determine organization value isthe weighted cost of capital. This number is different foreach organization and reflects the nature or riskiness of theorganization’s operations and its financial structure (which,in turn, is a result of the financing decisions made in thepast and/or to be made in the near future). The three stepsinvolved in determining the weighted cost of capital are:
1. calculating the cost of equity2. calculating the cost of debt3. combining the costs of equity and debt appropriately
Cost of Equity
The components of the cost of equity (Ce) are:
Rf risk-free rate of returnRm rate of return on the overall stock marketB beta or riskiness of the organization or the indus-
try in which it operates
The formula for calculating the cost of equity is:
Assuming you trust the full force and power of the U.S.Government to pay back its financial obligations, the risk-free rate of return at any point in time can be closely approxi-mated by the interest rate being paid on U.S. Treasury Bills.Considering that organizations tend to have a long/indefinitelife, it is prudent to select the rate on Treasury Bills expiringat least five years in the future. These rates can be obtainedfrom most any daily financial publication.
Ce " Rf $ B ! 1Rm # Rf 2
40 CALCULATE CURRENT VALUE

The rate of return on the overall stock market is higherthan the risk-free rate, as one would expect given the higherelement of risk (i.e., the chance your investment might losevalue or disappear altogether). Academic studies of thestock market for periods as long as 50 years indicate thepremium required by investors in the stock market abovethe return available from risk-free investments rangesbetween 5 and 7%. That is, if the risk-free rate is 8%, thenthe rate of return required by stock investors (or Rm) wouldbe between 13 and 15% (8% + 5% and 8% + 7%).
The beta (B) measures the riskiness of a company orindustry relative to the overall stock market. If it is just asrisky as the market (has about the same level of volatility interms of frequency and size of price swing), then the beta isexactly 1.0 (one). If it is more risky than the market, it isgreater than one, if it is less risky, it is less than one. Severalfinancial research firms calculate this number (based on his-torical performance) for both individual companies andindustries. It can be found in stock and industry guidesavailable at the research desks of most libraries.
Cost of Debt
The cost of debt has two components:
1. Interest rate paid on the debt2. Marginal tax rate paid by the organization
Because it is possible to have a number (n) of debtinstruments (amounts = DI), and each might have a differ-ent interest rate (IR), it is generally advisable to use an aver-age interest rate (AIR) paid on the debt which reflects
Determine Cost of Capital 41

proportionally the amounts and rates of the different instru-ments. This is calculated as follows:
Because interest expense is generally a tax-deductibleitem, the government is actually subsidizing the cost ofdebt. This is true because the interest expense can be sub-tracted from the operating earnings before taxes are calcu-lated. Accordingly, the true cash flow cost of debt (Cd) isonly equal to one minus the tax rate (TR) times the averageinterest rate or:
Cd – (1 – TR) ! AIR
In practice, when you are attempting to place a value onan organization, you are interested in the fair market value,that amount a willing buyer and seller would arrive at, nei-ther being under any compunction to act. Accordingly, thecost of debt you would be most interested in would be thatof the likely buyer of the organization. The cost of debt ofthe industry in which the organization operates is a goodproxy for this number and is readily available in guides atyour local library.
Weighted Cost Of Capital
The only new variable one needs to calculate the weightedcost of capital is the debt to equity ratio. For the individualorganization the debt (D) to equity (E) ratio (D/E) is simplythe total long-term debt divided by the total equity. This canbe the one of the organization today, or the one it targetsover the long term, recognizing it will go up and down due
AIR " a an
n"1DI n ! IRn b >a
n
n"1DIn
42 CALCULATE CURRENT VALUE
to the typically large size of major investments and thefinancing decisions involved. For organizations with nodebt, a glance at the industry average might be appropriatein order to arrive at a weighted cost of capital which reflectsthe economics a willing buyer might encounter when plac-ing a value on the organization.
The weighted cost of capital (Cw), which reflects theproportional required returns and interest rates, is calcu-lated as follows:
Cw = (1/(1 $ (D/E) ! Ce) $ ((D/E)/(1 = (D/E)) ! Cd)
Summary
The rate used, therefore, in discounting the future value ofcash flows into a lower equivalent present value of the orga-nization is Cw, the weighted cost of capital. To apply thisrate simply convert it to a series of discount factors asdescribed in this chapter’s “Discount Rate.”
CALCULATE CURRENT ORGANIZATION VALUE
To establish a starting point for examining your organiza-tion’s value it is useful to consider a scenario in which noth-ing in the future changes. That is, the value derivedrepresents the value of the organization today, assuming it isrun and performs as it has in the past. This methodologyallows you to see what the organization is worth today ifyou chose to continue operating in the same world as in thepast with the same policies and procedures and financialinteractions.
Calculate Current Organization Value 43

A value calculated in this way can be viewed as plantinga stake in the ground and creating a base case against whichto consider alternative decisions and their impact on value,as described later in Chapter 6, “Evaluate AlternativeApproaches.” Calculating this base case current organiza-tion value involves three straightforward steps:
1. Analyze historical financial data2. Create financial inputs and project cash flows, based on
historical analysis3. Calculate the cost of capital to use as the discount rate
Once these are completed, it is a simple matter to discountthe cash flows and ending value to the present, and calcu-late the current organization value.
There are obviously many ways to analyze financialdata. The ones used in the example below for ABCCompany are simple to understand and implement and pro-vide a reasonable approximation of how the future cashflows might look, all other things being equal. The impor-tant point at this stage is to understand how a base case iscreated and value calculated. Subsequent iterations andalternative scenarios are limited only by the imaginationand time available to perform them. How to use the organi-zational value model as an important planning tool is dis-cussed in Chapter 6.
Historical Data
For ease of presentation, five years of prior historical datawill be considered. The financial data of particular interestare highlighted in Exhibit 2.4. The five most recent yearsare considered. Year 0 represents the most recent fiscal year,
44 CALCULATE CURRENT VALUE

Year –1 the year before that, Year –2 the year before that,and so on. Note that in order to calculate five year-to-yearchanges for some items, six years of data are required.
Calculate Current Organization Value 45
EXHIBIT 2.4 Selected Historical Data for ABC Company
Year Year Year Year Year Year Mean–5 –4 –3 –2 –1 0
Revenue 750 800 850 900 950 1000% Change 6.7 6.3 5.9 5.6 5.3 6
OperatingProfit 64 77 90 105 120OperatingProfitMargin 8.0 9.1 10.0 11.1 12.0 10
Taxes 26 28 40 44 46Tax Ratea 40.6 36.3 44.4 41.9 38.3 40
Net Working Capitalb 40 41 43 45 46 48Increase 1 2 2 1 2Increase as % of Sales Increase 2 4 4 2 4 3
Net Fixed Capital 80 81 83 86 87 90Increase 1 2 3 1 3Increase as % of Sales Increase 2 4 6 2 6 4
a Taxes as a percent of Operating Profitb Accounts Receivable + Inventories – Accounts Payable

The analysis shows the relevant historical data and alsocalculates an average value or mean for several key percent-ages. Some analysts might weight performance closer to themost recent year higher, others might use compounding, asis done in bank accounts. Knowledge that a major accountwas just won or lost might suggest additional modificationsto or treatment of the data. However, the purpose here is tosimply demonstrate a starting point for value, based onactual data, not on anyone’s hopes or fears.
Financial Inputs and Projections
All of the inputs needed to compute five years of future cashflows for ABC Company are contained in the historicalnumbers and analysis thereof appearing in Exhibit 2.4.Specifically, these inputs are the most recent fiscal year’srevenues and the five-year annual averages for:
! Percentage increase in revenues (6%)! Operating profit margin as a percent of sales (10%)! Tax rate as a percent of operating profit margin (40%)! Increase in net working capital investment as a percent
of the increase in revenues (3%)! Increase in net fixed capital investment as a percent of
the increase in revenues (4%)
When the percentage increase in revenues is applied tothe Year 0 revenue number (1000 increasing by 6% = 1060),the Year 1 projected revenue is generated. By increasing thisnumber again by 6%, the Year 2 projected revenue is gener-ated. The result of using all the average annual percentagesabove creates five-year cash flow projections. Exhibit 2.2
46 CALCULATE CURRENT VALUE

contains the results of the cash flow projections using thesepercentages. The fact that the projections have the sameincremental increase each year is not meant to suggest thislevel of precision. However, over a five-year period, if thefuture does follow the past trends, as measured financially in“Historical Data” earlier, the overall five-year financial per-formance should approximate the totality of the projectedcash flows.
Discount Rate
The discount rate used to arrive at the present value of theorganization is the weighted cost of capital, as described inthis chapter’s “Determine the Cost of Capital.” The formu-lae involved are clearly spelled out in that section and, asmentioned, the inputs are readily available. A set of sampleinputs required to calculate the weighted cost of capital forABC Company is contained in Exhibit 2.5.
Calculate Current Organization Value 47
EXHIBIT 2.5 Weighted Cost of Capital Inputs for ABCCompany
Input Value
Risk-Free Rate of Return (Rf) 8%
Market Rate of Return (Rm) 14%
Beta of Equity (B) 1.2
Average Interest Rate (AIR) 16.5%
Tax Rate (TR) 40%
Debt to Equity Ratio (D/E) 30%

When the appropriate formulae are applied to thesenumbers, the weighted cost of capital, or discount rate touse is 14%. The results of applying this rate to the ABCCompany are contained in Exhibit 2.3, which appears ear-lier in this chapter.
SUMMARY
The present values of the cash flows for this set of projec-tions for ABC Company, along with the present value of theending value of the company, are contained in this chapter’s“Master Discounted Cash Flow.” Taken together, these pre-sent values result in a current worth of ABC Company of$524. The knowledge gained by the management teamwhen this worth is calculated for the organization providesan understanding of its cash-generating capabilities andvalue on the open market. This, in turn, will reap benefits asthe management team builds a strategic framework whichenhances cash flow awareness and generates positive cashflow actions across the entire organization.
ENDNOTES
1. In numerical terms, there are two parts to the cash flow/investment calculation. The result can be higher if oneincreases cash flow while keeping investment constant or byreducing investment while keeping cash flow constant.However, the best way to maximize this result is to considerthe cash flow implications involved in decisions made in allthree economic elements of the organization (see “EconomicElements” in this chapter).
48 CALCULATE CURRENT VALUE

2. In most organizations, only a few large decisions with cash flowconsequences are made each year. The cumulative effect ofsmall, daily decisions over the course of a year can outweighthese large decisions by a factor of two to four. Accordingly, oneof management’s greatest opportunities to enhance value isthrough the inculcation in all organization members of theimportance of and techniques for sound cash flowenhancement. Specifics regarding these items are addressed laterin the book.
3. The discount rate depends not only on the nature of theinvestments made, but also on decisions made in the fundingarea relative to financial leverage used. These issues will beaddressed in greater detail in the “Cost of Capital” section inthis chapter.
4. All the calculations involved in these and similar calculationscan easily be accommodated by any standard spreadsheetsoftware.
5. Many commercial loans have provisions relating to accountingratios and reported figures. It is not suggested that these beignored or slighted, but rather that cash flow implications begiven a high priority when the tax code allows alternativeapproaches to calculating taxes due.
Endnotes 49

CHAPTER 3Assess Strategic Landscape
Fail to plan, plan to fail. Whether it is the family vacationor the annual top management retreat, the more effort
that goes into creating a credible picture of what the desiredoutcome is, the better the result. The more clearly and pre-cisely the plan is put together, the easier it is to communi-cate to all those involved and the fewer the surprises. Themore thought given to various alternative approaches anduncontrollable contingencies, the more likely the event is tobe a success.
The same thing holds true for organizations. This chap-ter examines some of the difficulties and rewards of plan-ning. It explores how to develop a consensus view of thestrategic landscape in which your organization is likely tooperate in the years ahead, including identifying specialinterest groups that might aid or hinder its progress.Techniques for discovering and prioritizing the key factorsfor and major barriers to the success of your organizationare also covered.
51

REVIEW PLANNING FUNDAMENTALS
One of the keys to enhancing the value of your organizationas it moves forward is to be aware of the likely impact oftoday’s decisions on future cash flows. You can choose tocreate financial statements representing the cash flowsdesired five years hence, and then identify various actionswhich might allow you to achieve such results. Conversely,you can identify nonfinancial objectives and the actions thatmight lead to their achievement, and then back into the cashflows generated and/or required by such actions. In eithercase, the shift to a forward-thinking or planning approachis required. This section deals with several aspects of plan-ning to facilitate this shift in focus.
Background
In the mid-twentieth century, after living through the short-ages of World War II, the American people had developed atremendous demand for many products. The key to successfor organizations operating in such an environment wassimply to get as much product into the marketplace as soonas possible. The management response was budgeting orshort-term planning, which allowed resources to be accu-mulated and meted out as necessary for a year or so into thefuture, ensuring a continual flow of product into the vora-cious market and a nice profit in the process.
As demand continued unabated, labor came to be inshort supply. To meet this challenge, managers begandesigning larger machines requiring less labor per unit ofoutput. Such larger machines required increasing amountsof capital and had physical lives of several years. However,
52 ASSESS STRATEGIC LANDSCAPE

over the several year period required to recoup the invest-ment in such machines, labor might go out on strike, ornew, faster machines might technologically obsolete theolder machines. The management response to this increas-ing uncertainty going further out into the future than oneyear was long-range planning.
As demand began to level off later in the twentieth cen-tury, organizations were facing an environment in which therising tide of continual growth lifting all players was chang-ing to more of a zero sum game in which growth for oneorganization frequently came at the expense of another.Management discovered that there was a learning curveeffect which meant the more product built, the cheaper eachsucceeding product was to produce. A premium, therefore,was placed on having the leading market share. This waythe leader built more product than any other, had the cheap-est unit cost, the highest operating margin, and was betterable to survive over time. Organizations also discoveredthat products had a definite life cycle, with different growthcharacteristics for each stage. They began to plot the SCurve, an aid to the timing and impact of innovation.Putting into practice these ideas and techniques, as well asother related ones, was management’s response to flatteningdemand, and collectively was known as strategic planning.
Today, all three types of planning—short-term, long-range,and strategic—are practiced by organizations at different timesand in varying situations. Yet, much like the printed telephonedirectories still popular across the country, no sooner are theyoff the presses than they become out of date. Accordingly, theaccelerating pace of change facing all organizations has fosteredanother tool to assist organizations in managing for the
Review Planning Fundamentals 53

future—the strategic framework. This concept is addressed inChapter 4, “Build Framework Foundation.”
Focus
Chapter 2, “Calculate Current Value,” dealt with currentorganizational value from a historical perspective—financialand management performance that was a direct result of pastdecisions regarding financing, investing, and operating theorganization. Planning, with an emphasis on a forward look,encompasses forecasting likely future conditions, a fairlyimportant requirement for managing any organization.
Planning can be done for any time frame, as indicated inthe last section. It can also be performed at any level of theorganization or at any level of detail desired. However, to bemost useful to the management of an organization, it shouldbe approached with a global perspective, keeping the entireorganization in mind at all times. The reason for this becomesobvious when you realize the dynamic nature of organiza-tions—you cannot change one part without affecting another.This holds true, of course, for cash flows which, at any pointin time, can be generated by one part of the organization andused by another. Unless one’s cash flow view is global, takinginto account these financial interactions, the checkbook canbecome overdrawn, and/or bankers, suppliers, and investorsmay come knocking at your door.
Beyond the financial considerations, however, planningalso deals with positioning the organization in a desiredfuture landscape. Expectations regarding the future techni-cal, social, economic, and competitive environment shouldbe considered. The ability to think outside the parameters
54 ASSESS STRATEGIC LANDSCAPE
management normally considers in day-to-day operations isoften difficult to achieve. It can be enhanced when a differ-ent setting, such as an off-site retreat center,1 and differentpersonnel, such as a team of facilitators, create an environ-ment and structure more conducive to reflection regardingthe future. This holds true whether the focus is on short-term, long-range, or strategic planning.
Techniques
Short-term budgeting and long-range planning are primarilyfinancial in nature. They focus on projecting operating per-formance and the financial requirements required to sup-port future operations. They encompass assumptions madeby organization management regarding a variety of futureconditions. Initial forecasts created generally take the formof standard accounting statements—income statements andbalance sheets—as well as cash flow projections. Time peri-ods covered can range from week-to-week to several yearsinto the future, depending on the type of planning and thepurposes involved.
The ease with which computer spreadsheets can be set upand altered allows initial forecasts to be refined with addi-tional information and insights, and the planning /budgetingprocess is usually an iterative one. However, this computa-tional power needs to be balanced with sound judgment anda highly consistent approach in order to make the planningexercise most useful. Determining which component or com-ponents of the financial statements have the greatest impacton cash flow is fairly easy to accomplish with computerspreadsheet power. This testing of the sensitivity of the initial
Review Planning Fundamentals 55
and subsequent assumptions is also a critical factor in suc-cessful planning.
Strategic planning has gained widespread acceptanceand use across a wide variety of organizations since it wasfirst introduced and promulgated by high-priced consultantsand consulting firms in the 1970s. The techniques involved,some of which were covered in Chapter 1 (see Exhibits 1.6and 1.7), were often based on empirical observations andsophisticated calculations and were closely guarded secrets.Now these techniques and their appropriate application aretaught as a matter of course in most business schools andare available to all in any number of textbooks and refer-ence books.
Pros and Cons
Planning professionals have concerns regarding how plan-ning is actually carried out. These are in the areas of consis-tency, efficiency, and culture. The first two relate toproblems with computer-generated spreadsheets. Becausedifferent parts of the organization have specializedapproaches to solving their individual problems, the seamswhere one department interfaces with another are potentialsources of problems.
For example, long-range plans created cannot alwayseasily incorporate special situations such as acquisitions ormajor capital expenditures. The top-level annual budget,incorporating all the lower-level budgets, does not alwayscoincide with, and therefore, cannot be linked to, the firstyear of the long-range plan. This lack of consistency(remember the importance of global thinking) can nega-tively impact efficiency and cause difficulty in the consolida-
56 ASSESS STRATEGIC LANDSCAPE

tion and revision process and in the ability to conduct vary-ing scenario analysis and what-if and sensitivity analysis.This, in turn, can cause a lack of confidence in the numbersand much rebuilding year after year.
Shortcomings in these two areas can also adverselyaffect the organization’s culture. When it comes to plan-ning, there can be a lack of ownership, a lack of account-ability, and much gamesmanship. The process oftenbecomes more political and, accordingly, less realistic anduseful.
These difficulties are not inherent in planning. They tendto evidence themselves when there is a lack of strong, con-sistent leadership from the top. However, when no suchlack exists, and a strong planning system is in place, thebenefits are numerous. Management and staff can spendtime analyzing investment opportunities for their cash flowpotential, rather than wrestling with inefficient spread-sheets. The longer a solid working system is in place, themore confident everyone who uses it becomes, and the moreuse it gets as the environment continually changes.Decisions can be made more quickly and alternativesassessed with greater flexibility. Just one cautionary note—the installation of a top-to-bottom, comprehensive planningsystem endorsed by all members of the organization andpracticed by people well-educated in its use is a process thatusually takes three to five years.
IDENTIFY STAKEHOLDERS
Each organization interfaces with a number of differentgroups. Each of these groups has its own agenda which is,
Identify Stakeholders 57

generally, more important to it than to the organization withwhich it interfaces. These groups can be outside of or withinthe organization. The groups might stand to gain from thesuccess of your organization or to lose from it, or they maybe indifferent. Actions which they take knowingly or other-wise may aid or hinder the progress of the organization.
Such groups, which have a stake in the success or failure ofyour organization, are called stakeholders. They can bebroadly classified as competitors, external partners, or internalpartners. This section introduces the typical key organiza-tional stakeholders and describes a method for identifying andcharacterizing them for your organization.
Competitors
Every organization has competitors. Universities competefor students and talented faculty. Local governments com-pete for new businesses and federal funds. Businesses com-pete for market control and customer loyalty. Industryassociations compete for the time and votes of the membersof congress.
Stakeholders who are competitors have an interest in thedemise of your organization. This could be a consciousinterest where explicit actions and/or statements are madewhich reflect negatively on your organization. Alternatively,such interest might be unstated and just felt intuitively as ageneral desire for the failure of those organizations makingsurvival more difficult through competitive tactics. In rarecases, for political or other reasons, it might be in the bestinterest of a competitor to act in such a way that anothercompetitor (or competitors) stay afloat (e.g., to avoid thepossibility of antitrust litigation).
58 ASSESS STRATEGIC LANDSCAPE
External Partners
Those stakeholder groups who are not directly competingagainst your organization are partners. Those that exist out-side of your organization are external partners. These part-ners generally stand to gain from the success of yourorganization. However, as in any partnership, they can alsotake actions which might be harmful to your organization.Accordingly, to the extent various stakeholders can have animpact on your organization, it is important to ensure theyare handled with an appropriate amount of care.
Certain external stakeholders are desired by organiza-tions in order to further their ends. These would includestakeholders where, generally, the organization has optionsas to which specific company or institution with which toassociate. For example, organizations usually have choiceswhen it comes to suppliers, lenders, insurers, attorneys, andaccountants.
However, other external groups are partners with theorganization, yet seldom are these types of stakeholderssought out. For example, in each significant acquisitionthere are generally at least three parties:
1. Buyer2. Seller3. Uncle Sam2
The point is, when doing business in the United States and most western countries, the government and its various agencies become stakeholders in your organi-zation, whether you like it or not. For example, depend-ing on the nature of your operation, the IRS (Internal
Identify Stakeholders 59

Revenue Service), SEC (Securities and Exchange Commis-sion), OSHA (Occupational Safety and Health Administra-tion), and/or EEOC (Equal Employment OpportunityCommission) can have a major impact on your organization.Besides the government, other unwanted but necessaryexternal stakeholders with the potential to affect your organization’s health might include unions and commoncarriers.
Internal Partners
Those stakeholder groups which exist within your organiza-tion are internal partners. Depending on the nature and sizeof the organization, all those people on the payroll wouldbe considered stakeholders. They might all fit into onegroup. If, however, their identified needs are sufficiently dif-ferent, it may make sense to segregate them into separatestakeholder groups such as engineers, management, theresearch and development team, customer service represen-tatives, and sales personnel. Some of these groups mightalso be classified as external partners, for example, founders(investors) who still work for the company, and employeeswho own stock.
The nature of internal partners is that the survival andwell-being of the organization is generally considered to beof primary importance to them. For this reason, major cus-tomers and significant clients are sometimes included withthis group. Some managements include these importantcontributors to the organization’s success in the internalpartner world and seek their views and value their input inmaking important decisions.
60 ASSESS STRATEGIC LANDSCAPE

Profile Exercise
After reviewing the definition of stakeholders and the vari-ous generic types with your management team, hold a briefbrainstorming session and collectively list all the possiblestakeholder categories you can. Sort the results into relatedgroups. Then ask the following question, “Which categoriescould have a major impact on the success or failure of ourorganization?” Once this list of categories is constructedand agreed on, place the name of each category on the leftside of a two-column flip chart entitled “Stakeholders.” Thetitle of the right column should be “Needs To Be Met.” Thelast stage of the process is to discuss and identify the keyneed or needs for each selected stakeholder and record themin the right column. An example of what this might looklike is contained in Exhibit 3.1.
If the stakeholders identified truly do have the capabilityto have a major impact on your organization, then it isimportant you do everything within your power to meetand exceed the expectations of these groups.
GATHER ADDITIONAL INFORMATION
In many cases, organizations can develop a list of stake-holders and their needs in one sitting, using just the knowl-edge of the management team assembled for that purpose.Often, notes taken during the various strategic audit stages(see Chapter 1) provide an adequate information base forthe organization to feel comfortable that it has a collectiveview of the environment into which it is headed.
Sometimes, however, there may be some aspects of theexternal world or some issues or conflicts internal to the
Gather Additional Information 61

organization for which insufficient data exists within theteam for them to arrive at a consensus regarding key stake-holders and their needs. After all, to ensure a stakeholdercan have a significant impact on your organization requiresa fairly good working knowledge of its attributes and capa-bilities. To ascertain a stakeholder’s key needs demands asound understanding of its values and goals.
Accordingly, obtaining reliable data beyond that gener-ated in internal team meetings may be necessary in order toanswer important questions raised by meeting participants.Additional information can also provide an unbiased, fac-tual basis from which to develop a joint understanding ofthe internal and external environments in which the organi-zation must operate in the future.
62 ASSESS STRATEGIC LANDSCAPE
EXHIBIT 3.1 Stakeholders and Their Needs for ABC Company
Stakeholders Needs
Air Force High-energy, low-weight engines
Aircraft Manufacturers Low-cost products
Airline Companies Creative financing packages
Airplane Maintenance Crews Reliable parts, timely delivery
Banks Predictable cash flow
Component Suppliers Secure market
Engineers Cutting-edge design challenges
Investors Superior capital appreciation
Top Management Financially sound project plans
Union Members Steady work

This section highlights secondary and primary sourcesavailable to the organization from which to glean such sup-porting data. It also discusses the use of surveys and con-cludes with some general research suggestions.
Secondary Sources
The best starting point for gathering additional material oncompeting organizations and other prospective stakeholdersis data that has already been prepared and organized byothers, often referred to as secondary source information.Printed material created by organizations themselves, suchas annual reports and other required financial disclosures,promotional brochures, product descriptions, and pressreleases are publicly available. Industry and trade publica-tions as well as Wall Street analysts’ reports on public com-panies can be found at local and industry associationlibraries as well as over the Internet. The government pub-lishes a great deal of information every day including indus-trial reports, demographic and labor rate information, and traffic patterns and can also be an excellent source.Furthermore, conversations with your accountants, bankers,and attorneys can often put you in touch with their librariesand knowledgeable staff members who may be able to pro-vide additional information on organizations not readilyavailable elsewhere, as well as simply expedite the data col-lection process.
Primary Sources
Once a review of secondary sources is complete, it is possi-ble more questions may arise and new hypotheses about the
Gather Additional Information 63

environment and potential stakeholders may need to betested. Going to primary sources and obtaining additionalinformation is generally the approach taken, one where theresults are much more customized.
Observation and questioning are the two basic methodsof collecting this type of data. In observation, one asks noquestions but just notes how people behave and interact.For our purposes, this approach is too slow and expensive.The more direct route of asking questions of peoplebelieved to have the desired information is generally pre-ferred. Depending on where the information shortfalls maylie, the list of potential primary sources might includeemployees, customers, vendors, distributors, dealers, com-petitors, and former executives of related organizations.
Once a list of primary sources is developed, there are atleast four ways to approach them. The most useful is the per-sonal interview. It allows for a direct, private interchange ofideas and gives the interviewer a chance to probe for addi-tional information in areas of special interest. If you own arestaurant, you can wander out onto the floor, buy a dessertand coffee for an elderly couple, and ask a few pertinentquestions, such as, “Why do you eat here?” and “Where doyou live?” which may help you profile what and how toadvertise to that age group. If you are at a trade show, youcan pass the time of day by asking a few questions concerningname recognition and product reputation regarding yourorganization and the competition. Formal interviews, wherethe interviewer has requested some time of the interviewee,are more common, but also more expensive.
Another approach to primary sources is by telephone. Ifa broad base of coverage is desired and the questions are
64 ASSESS STRATEGIC LANDSCAPE
fairly brief and straightforward, a series of interviews bytelephone may be in order. Marketplace issues such as rela-tive ranking of your organization versus competitionregarding quality and service lend themselves well to thetelephone interview. A large-enough base of prospect andcustomer sources should exist to account for the inevitableearly call termination syndrome—the interviewee hangs up!
In certain situations, when more in-depth information isdesired and candor in responses is called for, the focusgroup approach is useful. Gather six to ten related primarysources (e.g., East Coast buyers of your product) and con-vene a session led by a skilled facilitator who guides thegroup through a series of open-ended questions. As the dis-cussion feeds on itself, creative suggestions and wish listsoften emerge along with possible areas for improvement—the kind of information useful to those responsible for identifying and agreeing on the key needs of critical stake-holders.
The fourth way to approach primary sources is by con-ducting a mail survey. Even if they are short and direct, theresponse rates are often low and there is usually a large por-tion of the target audience underrepresented. Nonetheless,this method is cost-effective and often the only one feasiblewhen large groups are involved. Also, statistical samplingtechniques can reduce the uncertainty associated with thisapproach. If an employee survey is involved, then it is mucheasier to ensure a high level of participation. To ensure hon-esty in answers in such situations, it is usually a good ideato have filled-out forms sent to an independent third partywith anonymity assured.
Gather Additional Information 65
Survey Guidelines
Surveys have become so commonplace in today’s world thatthe average manager seldom questions the idea that usefulinformation can be obtained in this manner. The question-naires which comprise surveys, however, can make or breakany individual data-gathering effort. To be successful, theyshould translate the data requirements or hypothesis to betested into specific, easily answered questions and alsomotivate the respondent to furnish the correct informationand completely finish the survey. The type of questionnaireshould match the method used, be it a personal, group, ortelephone interview or a direct mail piece.
The content of the questions in the first draft of anyquestionnaire is a good place to begin checking its logic.Seasoned survey editors evaluate several items:
! Is the question interesting but not necessary?! Is more than one question really required to get at the
answer?! Does the respondent have access to the data necessary to
answer correctly?! Will the respondent have to do some work to get the
required information?! Will the respondent, in fact, be willing to share the
desired information?! Does the form of the question (e.g., multiple choice) fit
the situation?! Are there any leading questions?! Might the placement of a question bias the potential
response?
66 ASSESS STRATEGIC LANDSCAPE
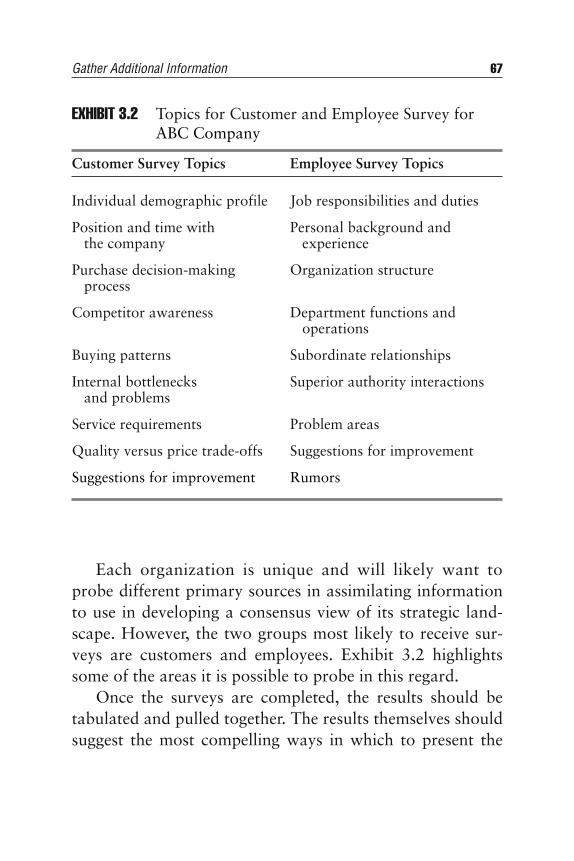
Each organization is unique and will likely want toprobe different primary sources in assimilating informationto use in developing a consensus view of its strategic land-scape. However, the two groups most likely to receive sur-veys are customers and employees. Exhibit 3.2 highlightssome of the areas it is possible to probe in this regard.
Once the surveys are completed, the results should betabulated and pulled together. The results themselves shouldsuggest the most compelling ways in which to present the
Gather Additional Information 67
EXHIBIT 3.2 Topics for Customer and Employee Survey for ABC Company
Customer Survey Topics Employee Survey Topics
Individual demographic profile Job responsibilities and duties
Position and time with Personal background and the company experience
Purchase decision-making Organization structureprocess
Competitor awareness Department functions and operations
Buying patterns Subordinate relationships
Internal bottlenecks Superior authority interactionsand problems
Service requirements Problem areas
Quality versus price trade-offs Suggestions for improvement
Suggestions for improvement Rumors
findings. Share them with your team and watch the confi-dence level rise.
Research Suggestions
If poor data is collected, poor conclusions will be the result.It is necessary, therefore, to collect accurate data to achieveuseful results. Practice the “sufficiency of information”rule—once you believe you have enough information, stopthe research, and move on with other tasks—becauseresearch efforts take time and money and reduce cash flow.
In personal interview situations, always ask the easyquestions first. That way, if you aggravate an intervieweewith a hard question and are thrown out, you have at leastreceived some answers for your effort (note the “easy tocontroversial” order of the employee survey topics inExhibit 3.2). To improve participation, offer to share theresults (disguised or in group summary format) with theparticipants. This might mean sending a report to customersor vendors involved after the completion of the survey pro-cessing or holding a companywide meeting with allemployee participants to present the survey results.
If the type of data you are seeking involves externalstakeholders’ views of your organization, it is probably bestto have an outside firm conduct the research to encouragefrankness in the responses. Customers or vendors, forexample, who know it is your organization asking the ques-tions may be reluctant to be totally honest because they donot want to offend. This does not have to be an expensiveprocess. Often, a call to the marketing professor at the localcommunity college will result in a plethora of students will-ing to conduct the survey as well as assist in the question-
68 ASSESS STRATEGIC LANDSCAPE
naire design and subsequent tabulation and analysis of theresults.
If your organization chooses the telephone survey,remember to have a script of the entire interface, not justthe questions. This ensures consistency in delivery andimproved responses and results. Tell the respondent the rea-son for the call immediately and about how long it willtake. Do not be discouraged if some potential respondentsrefuse to cooperate. It is amazing how many people are will-ing to speak freely and frankly over the telephone withabsolute strangers.
The more research you and your team members performand get involved in, the more comfortable you will be withwho the key stakeholders are and what their key needs are.Hopefully, you will discover other information along theway which will help you, along with the organization’sinternal expertise and self-knowledge, to perform the exer-cises which complete the strategic landscape picture in thenext two sections.
DEFINE FACTORS FOR SUCCESS
The next step in defining the strategic landscape for yourorganization is to define the key factors necessary for itssuccess. This exercise pulls together all the informationgathered and discussions held up to this point. This is ateam effort that requires the involvement of all the membersof your management team. It takes only a small hole to sinka ship; likewise, if a critical success factor is overlooked, itcould mean disaster for the organization. In addition, byworking together, a joint sense of urgency and commitment
Define Factors for Success 69

is more likely to emerge and aid in moving the organizationforward through the next stage—designing the strategicframework. As in past exercises, you can be the team leader,or appoint another member of the team, or hire an outsidefacilitator to conduct the exercises.
Requirements You will need five to ten blank acetates (for usewith an overhead projector) on which to make copies oftwo forms. You will also need presentation software and aprojector to share the results.
Methodology Create groups with at least three people in eachone (seek balance, but uneven numbers are okay).Distribute the Key Factors for Success worksheet as shownin Exhibit 3.3.
Make sure the worksheets are copied onto blankacetates, and there is space on the form for the team to listten factors critical to the organization’s success over thenext five years. Have each group present their results usingthe overhead projector and discuss the rationale behindtheir selections. Combine the results of the groups usingpresentation software and create a single, weighted averageranking list of the top ten factors. Then plot the answers inthe appropriate boxes on the action grid. For an example ofwhat this might look like, see Exhibit 3.4.
Results By reviewing the location of each factor on the prior-ity grid, you and your management team can quickly seewhere the organization stands relative to its ability to suc-ceed. For example, for the ABC Company, a strong salesforce is an important factor for success, but it is an area inwhich they rank their organization strong today, so immedi-ate attention is not indicated. However, regarding the factor
70 ASSESS STRATEGIC LANDSCAPE
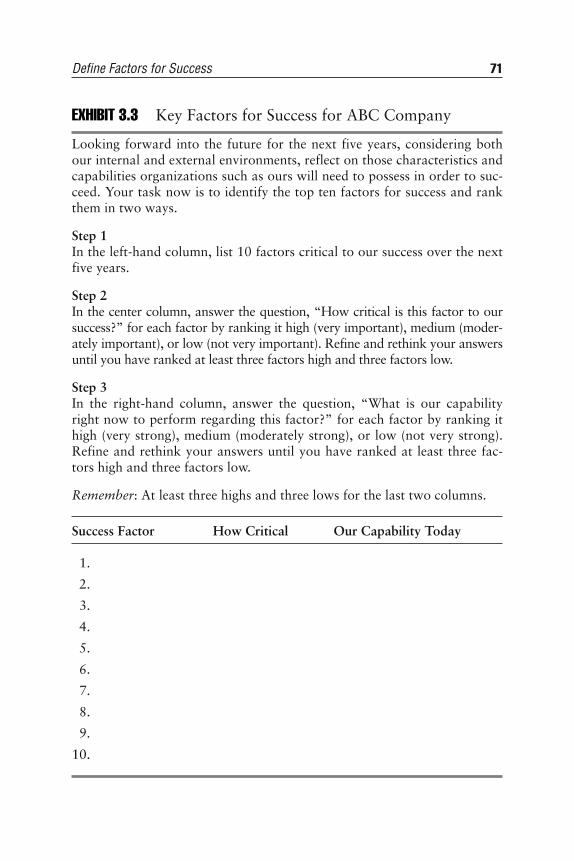
Define Factors for Success 71
EXHIBIT 3.3 Key Factors for Success for ABC Company
Looking forward into the future for the next five years, considering bothour internal and external environments, reflect on those characteristics andcapabilities organizations such as ours will need to possess in order to suc-ceed. Your task now is to identify the top ten factors for success and rankthem in two ways.
Step 1In the left-hand column, list 10 factors critical to our success over the nextfive years.
Step 2In the center column, answer the question, “How critical is this factor to oursuccess?” for each factor by ranking it high (very important), medium (moder-ately important), or low (not very important). Refine and rethink your answersuntil you have ranked at least three factors high and three factors low.
Step 3In the right-hand column, answer the question, “What is our capabilityright now to perform regarding this factor?” for each factor by ranking ithigh (very strong), medium (moderately strong), or low (not very strong).Refine and rethink your answers until you have ranked at least three fac-tors high and three factors low.
Remember: At least three highs and three lows for the last two columns.
Success Factor How Critical Our Capability Today
1.
2.
3.
4.
5.
6.
7.
8.
9.
10.

72 ASSESS STRATEGIC LANDSCAPE
High
StrongSales Force
Air FramePatentsHigh
Medium
Medium
Low
Low
CAPABILITY
IMPO
RT
AN
CE
air frame patents, the company sees them as very important,yet low in its current capability. Accordingly, some licensingor swapping action will likely need to be taken to shore uptheir capability in this area.
After reviewing the placement of all factors for yourorganization and reaching agreement that the placementsare fairly correct relative to one another, your team shouldbe eager to start taking actions to improve the organiza-tion’s capabilities in the areas with the greatest impact on itsgrowth and survival.
EXHIBIT 3.4 Success Factor Action Priority Grid for ABC Company

IDENTIFY BARRIERS TO SUCCESS
Examining your organization from the point of view ofwhat is required for success, as in the preceding section, isimportant. However, it is also useful to look at the organi-zation from the opposite direction. That is, identify the hur-dles your team will need to clear, the blockades they willhave to surmount, and the bottlenecks they must eliminateto increase revenues and cash flows over the next five years.
The exercise with which to accomplish this is basicallythe same as that described in the section prior, with onlyminor differences in the forms. For listing and ranking themajor barriers to success, use a form similar to Exhibit 3.3but change the column headings from left to right to:
! Success barrier! How large! Capability to overcome today
For Exhibit 3.4, simply change the titles for the x and yaxes to “Capability to Overcome” and “Size of Barrier,”respectively. The ranking, consolidation, and grid-displayingsteps remain the same. The desire to shore up weaknesses andbuild capabilities to overcome barriers and the ability to pri-oritize the action required to accomplish these tasks shouldassist in preparing your organization to withstand the uncer-tainties of the future.
SUMMARY
After accomplishing the tasks discussed in this chapter, youand your team should be well on the road to achieving a
Summary 73

consensus view of the strategic landscape. You will have anunderstanding of other organizations with whom you mustdeal, those groups who, by their very nature and relationshipwith you, will have to be considered in your decision-makingprocesses. Also, your knowledge of the relative importanceof the key factors for and barriers to your organization’s suc-cess will form the basis for current actions outside the scopeof normal operations. The sense of global thinking and bet-ter understanding of the role and techniques of planningplace you in a position to take the next step and create thestrategic framework described in the next chapter.
ENDNOTES
1. Holding planning meetings off-site also has the addedadvantage of physically freeing the participants from thepossibility of work-related interruptions or psychologicalreminders of the normal routine.
2. Often, there are other parties which might be more or lessdesired, including investment bankers, business brokers, andfinance companies.
74 ASSESS STRATEGIC LANDSCAPE

CHAPTER
75
4Build Framework Foundation
Aplace for everything and everything in its place. A niceconcept to enhance efficiency around the office, reduce
stress on the home front, or save your life in an emergency,such as when your yacht starts taking on water in the mid-dle of that trans-Atlantic crossing you have always dreamedabout completing. It is also a pretty valuable approachwhen it comes to coordinating and communicating all thosegoals, objectives, and strategies your organization must dealwith on a regular basis. The tool that allows you to put thisapproach into practice is called the strategic framework.
The strategic framework presented here encompasses allthe strategic issues facing an organization. The key to itssuccess in practice is its logical format, simplicity, and thor-oughness.
This chapter explores the background and major com-ponents of the strategic framework and the key steps anorganization typically takes in developing its own. It goesthrough the steps required to build a strong foundation forcontinuing the process and highlights some of the benefitslikely to accrue to those organizations that embrace it.

REVIEW FRAMEWORK RELEVANCE
Until the advent of the information age, a healthy, growingeconomy provided ample space for many organizations toprosper alongside each other. Clever, proprietary techniquesdeveloped by organizations to give them a competitive edgewere sustainable over some reasonable period of time.However, with the explosion of available information, anda workforce more willing and more able to shift from onecompany to the next, sustaining such competitive positionshas become much harder to do. Coupled with a leveling offof the population and the resultant flattening of demand,many organizations are faced with the challenge of surviv-ing in this new world order.
Accordingly, organization leaders are facing several keyissues:
! How to deal with ever-increasing competition! How to cope with accelerating change! How to motivate their work force to accomplish the
desired tasks
Traditional plans developed exclusively by top manage-ment and/or outside consultants have fallen short in thisenvironment. These types of plans fail because they:
! Lack clarity and specificity! Do not deal explicitly with risk! Delegate key strategic tasks to the wrong people
Such results can be avoided if plan formulation is inter-active. The development of a workable strategic framework
76 BUILD FRAMEWORK FOUNDATION

by the team of managers responsible for carrying it outaddresses these issues and shortcomings head on. The over-all process for accomplishing this is discussed in the nextsection.
DISCOVER THE PROCESS
Strategic framework development is a highly structuredprocess that assists leaders and managers in taking a hardlook at the future of their organization. Working throughvarious elements step-by-step, a six-level structure is createdthat can be used to guide the organization in the directionnecessary to achieve its agreed-upon goals. The six levelsfrom top to bottom, in the general order in which they arecreated, are:
1. Mission2. Niches3. Goals4. Objectives5. Strategies6. Actions
The mission provides a single focus for all of the organi-zation’s activities. It acts as a filter to exclude ideas anddiversions not related to achieving objectives critical to suc-cess. It appears at the top of the output schematic shown inExhibit 4.1.
There are five levels below mission. Each level supportsthe one above it. (In practice, levels two and three are oftencombined into one level called Strategic Goals). When taken
Discover the Process 77

78 BUILD FRAMEWORK FOUNDATION
Mission
Niche Niche
Goal Goal
Objective Objective
Strategy Strategy
Action Action
EXHIBIT 4.1 Strategic Framework: Output Schematic

collectively, all of the elements (boxes) in a given levelshould clearly and precisely describe what is meant by theachievement of the level above it. More specifically, eachgroup of elements tied together by lines and to a specific ele-ment above it defines success for this upper element. This isan important strategic and logical point to grasp, for inframework development, if at the end of the day you do notknow whether or not you have won or lost (i.e., you areunable to clearly measure success or failure), then you havenot described the element in adequate detail (i.e., insuffi-cient clarity and specificity).
Typically, the creation of a framework for an organiza-tion is a three- to six-month process. It generally involvesfive distinct steps1:
1. Planning meeting. Information collection, processscheduling
2. Fundamentals workshop. Mission, niches, goals3. Economic model creation. How cash flows impact
organization value4. Development workshop. Objective and strategy creation
and selection5. Execution workshop. Action plan design and participant
commitments
This structure acts as a feasibility check once the processis completed. It provides a simple framework whereby, inthe naturally iterative process of strategy development, eachgoal, objective, strategy, and so on (i.e., the contents of abox) can be seen in its relationship to the whole. It describeshow all of an organization’s resources are combined and
Discover the Process 79

80 BUILD FRAMEWORK FOUNDATION
focused on achieving the single mission at the top of theschematic.
As you become more familiar with each level of theframework, the terms used and their applicability to yourorganization will tend to become standardized. You andyour team will develop a common vocabulary to use in dis-cussing strategic and valuation issues. However, by way ofintroduction, a brief description/definition of each level/element is included in Exhibit 4.2.
The strategic framework, when created in a workshopenvironment, with all the key members of the management
EXHIBIT 4.2 Strategic Framework Definitions
Term Definition
Mission Statement of the organization’s vision for the future, its core values, and its primary purposes.
Niche Distinctive position that the organization occupies that allows it to earn higher and more stablereturns than similar organizations.
Goal Broadly based, longer-term, desired state that contributes to achieving and maintaining one ormore niches.
Objective Quantifiable, measurable, time-related achievement critical to goal attainment.
Strategy Creative allocation or withdrawal of resources consistent with traditional principles.
Action Plan identifying the who, when, and how much required to execute one or more strategies.

Lay the Foundation 81
team participating, results in a shared vision for the organi-zation and creates joint commitment to the purposes andvalues developed. It provides a working knowledge ofstrategic principles and allows for creative, cost-effective,powerful solutions using newly discovered/developed skills.This, in turn, is the key to building sustainable advantage inthe arena in which the organization operates.
LAY THE FOUNDATION
With a basic understanding of the benefits and key elementsof the framework in hand, you are now ready to begin theprocess. Just as a foundation is important to the long-termviability of a building, so it is to your strategic framework.It begins with the initial planning meeting and is strength-ened as the mission is developed.
Planning Meeting
Perhaps the most important part of the process is the selec-tion of the team with whom to construct the framework.Generally, a good starting point is the chief executive officerand his direct reports. An individual responsible for eachmajor part of the organization should be in attendance,thereby allowing for a sense of ownership and understand-ing of the framework and ease in its implementation. A typ-ical number of participants is six to ten, although it canrange from three to thirty. The final decision rests with theorganization’s leader.
Once the team is assembled, calendars are set for thefirst workshop, and the process and its benefits are pre-sented. Depending on the geographical or functional close-

82 BUILD FRAMEWORK FOUNDATION
ness of the team, some organizations conduct psychologicalinteraction profiles to share with each participant particularpersonality traits and attitudes they might find useful toknow. An awareness of one’s innate reticence or aggressive-ness, for example, may make an intense group interactionsession more productive, if not at least more bearable.
A packet of information containing the results of rele-vant recent prior sessions (such as those involved in assess-ing the organization’s strategic landscape) and summaries ofany relevant recent surveys conducted (such as those of cus-tomers and/or employees) should be distributed to all par-ticipants for review prior to the first workshop. In addition,it is worthwhile to discuss what ground rules will be ineffect throughout the process and gain the acceptance by allthat they are reasonable. The first, and most important, isthat the organization’s leader is to remain as quiet as possi-ble. This is to avoid a setting in which the team members donothing more than agree with whatever is on the leader’smind. Other ground rules that are popular include:
! There is no such thing as a bad idea, some just needmore work than others.
! This is a safe and secure environment.! Frankness is encouraged; everything remains inside these
four walls.! Under-contribution is as inappropriate as over-contribution.! If everyone’s ideas were not important they would not be
here.! Success is a unified front to the world at the end of the
process.

! Participation in input and analysis does not mean con-sensus in decisions.
! Bluntly stating the truth may be bad manners.! Compromising the truth is unacceptable.! If it is not substantive (occasionally disagreeable), it is
not worth the effort.! Do not sacrifice the long term for the sake of the short term.! Do not use the long term as a reason to avoid the short
term.
Whatever list is ultimately developed, ground rules shouldbe rigorously enforced and adhered to in order to ensurecandor and commitment throughout the process.
Administrative details relating to off-site room reserva-tions, obtaining the appropriate equipment, arranging forthe proper recording, and distribution of workshop resultscan also be addressed and resolved at the planning meeting.
Mission
The first job at the fundamentals workshop is to develop adraft mission statement. Like the foundation of a house,once it is created, it should not change. You can repaint thehouse, redo the kitchen, and add another room, but thefoundation stays the same. The same is true for your organi-zation. Once the mission is set, it should be timeless andprovide a lasting base upon which the organization canbuild. Because of its importance, at this stage of the processit is vital to stress that it is simply a draft mission that isbeing created. At subsequent workshops, this mission canbe reviewed and revised as the team sees fit, until at the end
Lay the Foundation 83

of the process it fits the organization like a glove. Then,when over time as everything about the organization and itsenvironment changes, its fundamental purposes and valueswill remain intact.
The key components of the mission are values and pur-poses. In a rapidly changing world—one in which the sys-tems and procedures book is out of date the moment itcomes off the press—the mission is a necessity. Stating theoverall purposes of the organization allows members todetermine whether an activity is related and should be pur-sued or is not related and, therefore, should be ignored.Likewise, stating the values important to the organizationallows members to select methods with which they will pur-sue the organization’s purposes that are commensurate withits beliefs. Jointly developed (and, therefore, shared) pur-poses provide a unified focus for the organization, andjointly developed (and, therefore, shared) values providecontrol by guiding member actions. If the mission that isdeveloped is successful in capturing the purposes and valuesof the organization, and it is communicated and positivelyreinforced on a regular basis, different members of the orga-nization, when faced with the same situation, are likely tomake similar decisions.
The mission statement should also reflect the vision ofthe organization’s leaders and take into account its keystakeholders.2 One way to capture the essence of theframework development team members’ ideas regardingvision is to ask each of them to write down three answersthat would complete the statement, “I would really beproud of our organization in four years if . . . .” No finan-cial-only answers should be allowed (e.g., “Increase sales
84 BUILD FRAMEWORK FOUNDATION

by 10% per year.”). Collecting the results on a flip chartor overhead acetate or on an LCD projector using a pre-sentation graphics program then allows for the clarifica-tion of ideas, a discussion of pros and cons, anddevelopment of a preliminary prioritization. This consen-sus vision list, when taken in conjunction with the stake-holder analysis, provides the basis for the participants tocreate purposes that represent states to be achieved inresponse to specific stakeholder needs.
Values, equally important to a sound mission, can bedeveloped and discussed through informal sharing of orga-nization war stories with a moral. For example, the reasonswhy people are hired and fired provide a clue to the valuesat work in these types of major decisions. Anecdotes of howcustomers are treated and how employees are rewarded orpunished are also potentially good places to find an organi-zation’s values at work. For example, if one of your employ-ees chartered a plane to deliver a part to a customerexperiencing some major downtime in a remote location,should that employee be rewarded for creativity or pun-ished for an excessive expenditure? The answer, of course,depends on the organization’s values. Does it place cus-tomer service as a driving value or reward people who dis-cover low-cost solutions to problems? The circumstancessurrounding employees who become heroes or villains tendto reveal a great deal about an organization’s core values.
A more formal approach, often useful after an informalvalue-story-sharing session, involves prioritizing and rank-ing various values. One way to do this is simply to list valueareas that might be important to the organization and thenweight them as to degree of importance on a scale of one to
Lay the Foundation 85

86 BUILD FRAMEWORK FOUNDATION
five, with five being very important. As a start, morebroadly defined terms are generally best. This way, the teamcan more quickly identify the key value areas important tothe organization and refine them further as necessary toincorporate into the mission statement. A typical list ofbroad value areas might include:
! Teamwork! Product leadership! Service orientation! Cost control! Market presence! Work pace! Communications! Fair compensation! People
An alternative, yet still quantifiable, method is to listboth ends of a value-related spectrum in two columns andhave the participants place an “X” representing their viewof where the organization stands on that particular valuealong a line between the two extremes. An “X” in the mid-dle would indicate the organization is fairly neutral regard-ing that particular value, and it would move more closely toeither column, depending on how close to the extreme itwas perceived to be. Some sample sets of value extremes arelisted in the following two columns:
Meritocracy (promote Tenure (promote on time on merit) in grade)
Purposeful (high sense Wandering (low senseof direction) of purpose)

Aggressive (risk taking) Conservative (risk averse)
Long-term focus Short-term focus
Command style Consensus (management (strong leader) by committee)
Tight controls Loose controls
Market leader Market follower
Decisions made Decisions made by gut feelrationally
Employees need Employees primarily strong direction self-directed
Strong work ethic Balanced work ethic (overtime expected) (family time expected)
The discussion and prioritization of values is important,because inevitably there will be situations that arise inwhich two values are in conflict and an understanding ofwhich one is more critical to the organization is required.They should also be stated in a fairly precise manner. Forexample, if the concierge in a hotel has been instructed onlythat the key value is treat the customer as royalty, how isthe decision to be made as to whether to serve first the per-son in a three-piece suit or the one holding a crying child? Amore narrowly defined statement, such as treat the busi-nessperson as royalty or treat all families as royalty, enablesthe concierge to quickly make the correct decision and morelikely satisfy both parties due to swift, sure action.
Once purposes and values have been identified and dis-cussed, it is time to break the framework development par-ticipants into small groups and let each of them craft theirversion of a mission. This is typically a one- to two-hour
Lay the Foundation 87
process, followed by justification and explanation to thegroup. This, in turn, is followed by another breakout ses-sion and more presentations, this time using differentgroupings. The iterative nature of the process is importantto achieve buy-in by all involved. Most annual reports ofpublicly traded companies, as well as most educational andgovernment institutions, have publicly stated their missions.You would be well served to review a number of these aspart of the mission creation session in order to familiarizeyour team with the many ways it can be stated. To limitfrustration at this stage it is important to remember that themission statement created here is just a draft.
In summary, by combining all of the above elements,your organization has crafted a mission with vision-inspiredpurposes to provide focus to its strategies and actions andvalues spelling out the organization’s code of conduct pro-viding control even when the leaders are miles away.Because the mission is designed to be timeless (or for at leastten years for those with a fear of commitment), some meatneeds to be put on its bones. The niche identificationprocess, discussed next, begins this process.
DETERMINE NICHE POSITIONS AND GOALS
Niche positions and goals represent the second level of thestrategic framework and, collectively, they begin to definemore concretely the future direction of the organization. Thedescriptive statements used at this level tend to be longerterm in nature, generally describe a desired state, and arebroadly based. Niches tend to be more externally oriented
88 BUILD FRAMEWORK FOUNDATION

and distinctive, while goals deal with areas critical to theorganization’s operation, but more internal and basic.Consider a bath soap company—its niche might be a creamy,pink, sweet-smelling foam, but its goal is to have the foamclean effectively whatever it comes in contact with.
Niche Positions
A niche is generally defined as, “a place or position suitableor appropriate for a person or organization.” For example,professionals or organizations are often spoken of as, “find-ing their niche,” usually after reflecting on the successesthey have enjoyed. The trick in strategic framework devel-opment is to build on the strengths of the organization insuch a way that niche positions are created or enhanced thatcan sustain the success of the organization over time.
Success in the context of the strategic framework is a rel-ative concept. That means that your organization must ulti-mately be compared to the competition. In that comparison,you will have achieved success if your organization is ableto achieve results that are higher and more stable than com-parable entities. But do not higher rewards involve less sta-bility and more risk? After all, we have been told fordecades by stockbrokers that in order to achieve higherreturns we must be willing to accept higher risk—morevolatility.
However, the sailboat with the higher mast catches morewind, applying more force to the keel, thereby increasingthe boat’s stability. The same principle can also hold true fororganizations. Consider an abbreviated income statementfor two firms making the same product:
Determine Niche Positions and Goals 89
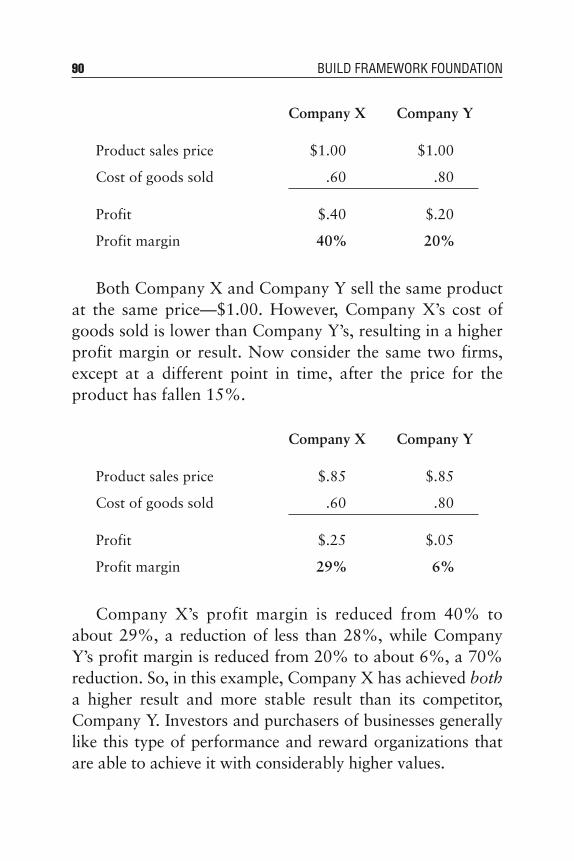
90 BUILD FRAMEWORK FOUNDATION
Company X Company Y
Product sales price $1.00 $1.00
Cost of goods sold .60 .80
Profit $.40 $.20
Profit margin 40% 20%
Both Company X and Company Y sell the same productat the same price—$1.00. However, Company X’s cost ofgoods sold is lower than Company Y’s, resulting in a higherprofit margin or result. Now consider the same two firms,except at a different point in time, after the price for theproduct has fallen 15%.
Company X Company Y
Product sales price $.85 $.85
Cost of goods sold .60 .80
Profit $.25 $.05
Profit margin 29% 6%
Company X’s profit margin is reduced from 40% toabout 29%, a reduction of less than 28%, while CompanyY’s profit margin is reduced from 20% to about 6%, a 70%reduction. So, in this example, Company X has achieved botha higher result and more stable result than its competitor,Company Y. Investors and purchasers of businesses generallylike this type of performance and reward organizations thatare able to achieve it with considerably higher values.

Determine Niche Positions and Goals 91
How does an organization achieve better and more sta-ble results than competition? Certainly, close attention tocash flow is part of it. But, from a strategic point of view,the niche is created when the organization achieves a posi-tion in its market that draws customers and clients andother stakeholders of importance to its doors. In practice,such positions generally require an organization to developand focus a number of its capabilities in one or more areasof the market that are strategically significant (i.e., thatdetermine the outcome of competition in the marketplace).
Determining appropriate niche positions requires an orga-nization and management team that not only understands itsown strengths and limitations, but also has a strong workingknowledge of the external environment, including customermotivations and loyalties and competitive strategies. Oncethese are assembled (see, for example, the output from theexercises in Chapter 3, “Define Factors for Success” and“Identify Barriers to Success”), the strategic frameworkdevelopment task force can assess various aspects of the orga-nization to discover competitive advantages that can possiblybe brought together to create potential niches in which toestablish or enhance positions over time. The most commonway this is accomplished is by segmenting the organizationinto its several value-added phases and contrasting each onewith what is known about these phases in similar organiza-tions. Depending on the nature of the organization, typicalvalue-added phases might include:
! Product research! Process research! Raw material procurement! Component procurement
92 BUILD FRAMEWORK FOUNDATION
! Manufacturing! Marketing! Distribution! Retailing! Service! Back room operations! Management information systems
Usually, after a fairly thorough review of these areas, thetask force is able to identify a number of competitive advan-tages. After some discussion, those which actually takentogether would have a strategic impact in the marketplaceand create a sustainable niche are agreed upon.
It is worthwhile to remember some common-senseguidelines when engaging in this part of the frameworkdevelopment process:
! The more functional areas that are involved in a niche,the stronger it is.
! The more resources applied toward a niche, the strongerit is.
! Building on existing strengths shortens the nichecreation time.
! The value of niches changes over time.
Because it takes a fair amount of time and money todevelop and maintain a niche, only a limited number (oneto three) should be sought by an organization. Also,because the benefit of the niche is enhanced the more wide-spread it is, attention to communicating and developing aconsistent organizational culture is important to facilitatinginter-departmental cooperation.

Goals
Key areas in which to develop goal statements tend to be dri-ven by the content of the mission. In the review of value-addedareas in the search for niches, many organizations identifyareas they consider critical to their success, but not worthy ofinclusion in a niche. Accordingly, the list of typical value-added phases might be useful as a checklist in goal creation.
To a very great extent, the stratification of goals dependson how the framework development task force visualizesthe company. For example, a CEO might look at the vari-ous parts of the organization in terms of how they con-tribute to the “Ps” learned in school (e.g., product, position,people, profit, etc.). Another might simply think of theorganization chart and decide that each functional areashould become a goal area and use this as a starting pointfor discussions among the team members.
Regardless of how the discussions begin, or the initialformat goals take, the final test is simple. Collectively, withthe niches, they must completely describe a state and timewhen the achievement of the mission (out in the future fourto ten years) is complete.
This principle continues to hold true throughout theframework development process. That is, the boxes in thelevel below that are connected by lines to the one above it,describe the achievement of the box above in its entirety forthe time period in question.
EVALUATE MISSION, NICHES, AND GOALS
Because niches and goals appear on the same line under-neath mission in the framework, they are often referred to
Evaluate Mission, Niches, and Goals 93

94 BUILD FRAMEWORK FOUNDATION
collectively as strategic goals. The final wording of the mis-sion and strategic goals should be examined closely. A usefulexercise to ensure the task force is in agreement is to selectsome of the key words used in the statements and have thegroup write down for the record what that word means tothem in the context of the organization’s mission and strate-gic goals. For example, for one group, the word “disci-plined” played a dominant role in the mission, and the teamcreated the following list of behaviors, actions, and attitudesthat might represent this in the organizational setting:
! Willpower! Controlled thoughts! Carefully planned! Organized! Unwavering! Controlled actions! Thoughtful execution! Highly focused! Uncompromising! Defined characteristics! Committed! Given direction! Not distracted
Whatever else the mission described, it is clear that theteam would have a pretty sound idea of what “disciplined”meant when it came to motivating and evaluating their ownand their staffs’ performance on the job.
Once the mission and strategic goals are created in draftform, they should be contrasted to the following list andrevised as necessary based on inconsistencies with it:

! Defines the nature of the organization’s operations! States the purposes of the organization! Links the organization to the outside world! Addresses all the organization’s key stakeholders! Expresses the organization’s targeted niche(s)! Differentiates the organization from other similar ones! Looks toward the future! Reflects the organization’s values
Further revisions of the mission and strategic goalsshould take place at the beginning and end of all futureworkshops as more information is gathered and morespecifics are identified.
SUMMARY
The strategic framework development process is well-developed, logical, and interactive. It is time effective, cre-ating winning strategies understood and endorsed by theindividuals responsible for implementation. It is compre-hensive, ensuring no inconsistencies or omissions occur.
It educates the management team (and, ultimately, theirstaffs) to act strategically every day. It enhances their strate-gic understanding by providing a working knowledge of thesource and application of strategic principles. It creates ashared vision with a commitment to jointly developed pur-poses, values, and niches.
It creates a sustainable competitive advantage and,through the framework, enables changes in circumstancesand strategy to be easily communicated. It results in man-agement team members using more precise language in
Summary 95

daily interactions regarding the strategic fit and importanceof daily actions.
Through the clarified market focus, it combines func-tional and departmental perspectives and strengths to serveclients and customers and meet the needs of other organiza-tional audiences in a superior fashion. The next steps in cre-ating the framework, adding specific objectives andstrategies to the mission and strategic goals, are containedin Chapter 5.
ENDNOTES
1. The first two steps, “Planning meeting” and “Fundamentalsworkshop,” are addressed in the remaining sections of thischapter; “Economic model creation” and the “Developmentworkshop” are addressed in Chapter 5; the “Executionworkshop” is addressed in Chapter 6. There is usually some“homework” prior to and between most steps.
2. See Chapter 3’s “Identity Stakeholders” for a discussion ofstakeholders and an exercise to assist in profiling them.
96 BUILD FRAMEWORK FOUNDATION

CHAPTER 5Formulate Sound Strategies
What does it take to run an organization? Essentially, theleadership group has two primary tasks:
1. Manage the organization’s day-to-day operations2. Allocate the organization’s scarce resources
The strategic framework assists in these efforts. Day-to-daychallenges can be dealt with using the mission and strategicgoals as guidelines. They provide a filtering mechanismthrough which to evaluate alternative decisions relating towhat to do and how to do it. By considering the commonpurposes and values as contained in the mission statementand the broadly stated strategic goals, every employee canmove the organization toward achieving the consensusvision.
Allocating scarce resources is accomplished throughcrafting sound objectives and strategies. To ensure the orga-nization stays on the right course, the leadership team mustcreate a number of objectives for each strategic goal which,when taken collectively, define a measure of success for thatgoal. Objectives are generally developed to be achieved in ashorter period of time (i.e., one to three years) than the
97

98 FORMULATE SOUND STRATEGIES
desired states represented by strategic goals (which may lastfive to ten years). Once a list of objectives is created, it isthen winnowed down to the critical few, those most impor-tant to be reached first. Then strategies are identified which,if successful, can aid in the achievement of the objectives.Before pursuing a strategy, management should evaluate itwith respect to sound strategic principles and its likelyimpact on the overall value of the organization.
This chapter covers the steps necessary to move from thedraft statement of mission and strategic goals throughobjectives creation and strategy selection. It introducesfinancial and nonfinancial methods for prioritization andevaluation. By the completion of this chapter, the organiza-tion will have built all levels of the strategic frameworkexcept that related to execution. The knowledge of andpractice relating to strategic thinking contained in the fol-lowing pages will greatly enhance the enthusiasm and confi-dence the leadership team has as it embarks on executingthe strategic framework.
UNDERSTAND STRATEGIC THINKING
Although objectives appear above strategies on the frame-work (see Exhibit 4.1), they represent fairly straightforwardstatements that provide the “glue” between strategic goalsand specific strategies. Accordingly, an overview of strategicthinking and guidelines is worthwhile prior to the actualexercise of formulating specific, quantifiable objectives.
At the beginning of the session in which your teamencounters and begins to become more familiar with strate-gic thinking and guidelines, be sure to start with a brief

review and reaffirmation of the mission and strategic goalsalready developed. With these in mind, the strategy creationprocess can be highly productive. To ensure good ideas(which can occur at any time) are not lost, it is a good ideato keep two separate lists on the team room wall. One list isPossible Strategies, which may or may not ultimately beused or altered prior to selection. The other is ImmediatelyImplementable Ideas1—suggestions that are commensuratewith the current mission (even if it is only in draft form) andcan be put into practice the next business day.
Most people have had some exposure to strategy. It mayhave been through participation in the development of astrategic plan, involvement in an exercise using one of thenumerous strategic analysis techniques currently in fashion,or attendance at an educational seminar. Regardless, a sim-ple yet comprehensive method of thinking strategically isimportant. This will enable your organization to develop acommon approach in creating the strategic framework thatmakes the updating and enhancing process easier. In theinterest of simplicity and ease of understanding, the treat-ment of strategy in this section is divided into three parts:
1. Philosophy2. Dimensions3. Guidelines
Philosophy
When dealing with and reviewing or reaffirming the mis-sion, niches, and strategic goals of your organization, amind-set encompassing a philosophical view of strategy is
Understand Strategic Thinking 99

helpful. There are three attributes to this mind-set. All relateto the perspective brought to the creative process andshould guide the thinking of each team member throughoutthe development of the strategic framework. Each is funda-mental to the survival of the organization, and accordinglyall must be considered when thinking strategically about theorganization. The three attributes that characterize strate-gies are:
1. Long term2. Relative3. Interconnected
Long Term The first attribute of a strategy is that it is longterm. When creating and enunciating clear statements ofdesired states or positions that the organization shouldachieve to allow it to sustain itself in the future, you mustconsider the fact that the organization is currently in animperfect state. It will take time, therefore, after programsare implemented, to see the results of the targeted changes.Because organizations, much like people, do not have theability to change all at once, patience is required.
Creating a future vision requires the ability to envision,with all parts working in tandem, how the organization canreach the vision. A vision that is worthwhile stretches farinto the future, yet considers the existing environment. It isstructured in such a way that all people involved in its cre-ation can picture their role in achieving it. The ability of theleadership team to understand their specific contributionand see how they make a difference positively impacts the timing and nature of the vision’s ultimate attainment.
100 FORMULATE SOUND STRATEGIES
Because the organization will always be in an imperfectstate, and the environment in which it operates will con-tinue to change, the leadership’s mind-set must be longrange or long term in nature.
Relative The second attribute recognizes that strategyinvolves the outside world and should, therefore, berelative. Many organizations are well equipped to measurehow they performed this year versus last year in terms ofprofitability, productivity, quality, and costs. This informa-tion is useful as a means of providing feedback to the man-agement group that allows them to make changes to keepprograms and operations on the desired track. However,this data is more tactical (short term or budget-oriented)than strategic in nature.
The strategic mind-set recognizes it is how the organiza-tion performs relative to other similar organizations thatimpacts its ability to sustain itself into the future. For exam-ple, beating a competitor’s price by 1% may be all that isrequired to make the sale or increase market share. Beatinga competitor’s price by 50%, however, may still give yourorganization the sale, but at a cost of many more of itsresources than necessary, thereby leaving the organizationvulnerable to defeat over the long term.
Interconnected The third attribute recognizes that strategyinvolves the entire organization and visions and programsshould be interconnected. If one part of the organization isexperiencing success while another is failing, it may not beable to sustain itself in the future. More important, anapproach combining many parts of the organizationenhances the overall product or service and can create a totalpackage more attractive than that offered by competing
Understand Strategic Thinking 101
organizations. For example, if, when my product is com-pared to the competition, not only is its price 1% less, but ithas a more durable package, is offered in a wider array ofcolors, has a longer shelf life, is sold on more generousterms, and has less of a wait on the customer service tele-phone line, it may not only garner the initial sale, but resultin sustained repeat sales as well. The marketing, manufactur-ing, quality control, finance, and customer service areas ofthe organization are interconnected, all working together tocreate a total concept which is superior relative to the vari-ous components of the competitors’ offering and able to sus-tain its position over the long term.
When the strategic framework is developed with astrategic philosophy that considers the long-term position ofthe organization and its performance relative to similar enti-ties, it is likely to be a framework able to be sustained andmodified successfully over time. When it is also developedwith a strategic philosophy that keeps all parts of the orga-nization interconnected, its chances for greater relative andlong-term success are further enhanced.
Dimensions
There are three major thrusts or dimensions of strategy.Each can be measured according to standard benchmarksfor your organization’s industry or, more directly, comparedto your key competitors. Knowledge of these dimensionswill enable you and your management team to take a snap-shot of where your organization is or would like to be atany point in time and mark its relative position. Think ofeach dimension as an axis emanating from a zero point and
102 FORMULATE SOUND STRATEGIES

moving out to perfection, much like a simple line graph inelementary geometry. Another way to picture the threedimensions is as a cube, where the zero point is one cornerand each of the three sides emanating from that point repre-sent one of the dimensions. Your position can then be deter-mined by moving along each of the three corners or linesand imagining a plane intersecting the line where your posi-tion is for each dimension. Where all three planes crossinside the cube is your current position. The current com-bined position of ABC Company for the three dimensions isshown in Exhibit 5.1.
Understand Strategic Thinking 103
Current Position
Differentiation
Time
Efficiency
EXHIBIT 5.1 ABC Company Current Strategic Dimensions Position

104 FORMULATE SOUND STRATEGIES
As Exhibit 5.1 shows, the three dimensions of strategyare:
1. Efficiency2. Differentiation3. Time
ABC Company is fairly low on the efficiency scale, rela-tively more advanced on the differentiation scale, and fairlyfar along on the time scale. This is not surprising consider-ing ABC Company’s smaller size relative to its competitors.This small size is a drawback when it comes to achievingmassive economies of scale and major efficiency, forcing it, therefore, to compete more through differentiation.However, this small size pays dividends in the time area,allowing it to move more quickly and effectively relative toits larger competitors.
The dimension of efficiency measures where on a scaleof dollars spent on investment for a given level of outputand cost per unit sold or provided, your organization is rel-ative to the competition. If you build a manufacturing facil-ity which is of an optimal size to produce products at thelowest possible cost, your organization will have achievedefficiency of investment. If you locate this manufacturingfacility near a favorable source of raw materials and alsoinitiate a program of cost minimization in overhead,research, and marketing areas, your organization will haveachieved efficiency of cost.
The dimension of differentiation measures where on ascale of uniqueness (matching market needs, wants, anddesires) your organization is relative to the competition. If you
build a durable product sold to an industry where dependabil-ity is critical, your organization will gain a reputation for highquality. If you supplement this product with a wide-spreaddealer network making spare parts available quickly, yourorganization will gain a reputation for excellent service. If youcontinue to enhance your product with the latest advances intechnology, your organization will gain a reputation for set-ting the industry standard for performance. If you accomplishall three of these objectives, you will have created an intangi-ble image for your organization as a leader and will haveachieved substantial differentiation in the eyes of your cus-tomers relative to your competitors.
Because of the wealth of information available today,most organizations have access to similar cost reductiontechniques, operating technology, and functional skills.Therefore, the strategic dimension of efficiency becomesmore or less simply a ticket to “start the race.” To searchfor a lasting competitive advantage based solely on effi-ciency is futile. In fact, most organizations must strive con-stantly to reduce costs and improve operating efficienciesjust to survive. However, if both a sound defense and strongoffense are required to consistently win team sportingevents, efficiency regarding the organization can be thoughtof as the defense. But differentiation is the strong offense,which allows superior price realization per unit of output.It, in effect, can become the way for the organization to“win the race.” Put another way, you can only squeeze somuch cost out of an operation, but you can continue togrow market share indefinitely!
The dimension of time measures where your organiza-tion is and needs to be on the scale of agility (the ability to
Understand Strategic Thinking 105

move quickly) relative to the competition. Not only do themoves have to be quick, they also have to be correct most ofthe time. To move at all, the organization needs to observewhat is going on in its environment, make a decision to act,structure itself in such a way that the desired action oractions are implemented as desired, and, last, take action.
Subsequent to action, continued monitoring and modifi-cation are usually required to ensure the action achieves thedesired result. For example, as you sail across the AtlanticOcean, the boat is seldom headed precisely toward its desti-nation. Rather, the helmsman is constantly making adjust-ments to the rudder based on wind and wave action on thehull. If the sum total of the actions is correct, the boat landson a dime.
In an organization, for the strategic dimension of timeto be effective, the lines of communication between theobservers, decision makers, and implementers should be asshort as possible. Frequently communicated mission state-ments, which effectively inculcate organization memberswith a unified purpose to guide direction and shared valuesto provide control, are most often successful in exploitingthe strategic dimension of time to the organization’s long-term competitive advantage.
Guidelines
When thinking strategically, it is important to consider notonly specific competitors, but also various other sources ofcompetitive pressures. It is also useful to examine how anorganization might be structured to take advantage ofstrategic realities. These two aspects of strategic thinkingare discussed in the following paragraphs.
106 FORMULATE SOUND STRATEGIES

Understand Strategic Thinking 107
In the preceding strategy discussion regarding philoso-phy and dimensions, competition generally is assumed tocome from organizations similar to yours. In fact, competi-tive forces, which drive the level or intensity of competitionin your industry, come from several places. In addition tosimilar organizations, these forces may emanate from cus-tomers, suppliers, or organizations that might, in the future,become competitors.
How does this work? Assume your organization isembarking on a program to become the most efficient orlowest cost producer of a given product. If you are success-ful, you should be able to deal with all the sources of exist-ing and potential competitive forces. For direct competitors,your low cost position will result in higher and more stablereturns (as shown in the “Niche” example in Chapter 4’s“Niche Positions”). Your customers can exert pressure todrive down prices to the level of your next most efficientcompetitor. If they go too far, they will give you monopolypower over the longer term because they will drive yourcompetition out of business.
As the low cost producer, you can also deal with suppli-ers who raise prices, because there is more room in yourmargins and, hence, more flexibility than your competitors.Organizations that might consider becoming direct competi-tors will likely see your low cost position and decide itmight be too expensive to obtain the experience necessaryto match it. However, other organizations considering com-peting with yours that have a new or modified technologythat might replace your product with a lower cost substitutewill be much more difficult to defend against. When consid-ering strategy, therefore, a sound guideline is not only to

consider organizations similar to yours, but also to examinethe leverage of your customers, suppliers, and that of poten-tial competitors and new technologies.
Regardless of how large or complex an organization is,as a general rule, the more it is decentralized, the moreauthority is delegated down. When this happens, those withthe most knowledge about situations and, generally, whostand to benefit the most, are making the decisions, allowingthe organization to move more quickly than otherwise mightbe the case. Traditions or policies2 that serve to empower themembers or employees of an organization to act as owners,whereby the organization’s mission and strategic goals aretreated as their own personal goals, enable quick decisionsto be made which, on balance, will serve the long term inter-ests of the organization. Measurement systems that keeptrack of the costs associated with holding material, parts,and finished goods, and the time required to move an orderor product through the organization can contribute toimproved efficiency if the managers responsible for the vari-ous areas in question are charged with the appropriate asso-ciated costs and rewarded when reducing these to aminimum.
In summary, when thinking strategically about yourorganization, do not forget to consider all the possiblesources of competitive pressure. Also, recognize the unique-ness of your organization and utilize structural and policyinitiatives where appropriate to enhance the effectiveness ofits strategies.
DEVELOP OBJECTIVES
Now that you and your team have a working knowledge ofstrategic thinking, it is time to add the next level to the
108 FORMULATE SOUND STRATEGIES
Develop Objectives 109
strategic framework. Underneath and associated with eachstrategic goal are objectives. Typically, there are two to fiveobjectives for each strategic goal. As indicated in Exhibit4.2, each agreed-upon objective represents a quantifiable,measurable, time-related achievement critical to goal attain-ment.
When taken collectively, all the objectives for a goaldescribe in sufficient detail precisely what and when theteam members will be satisfied that the entire goal or somemajor part of it has been reached. Because goals typicallydescribe states desired over the next five to ten years, andobjectives relate to achievements with a one- to three-yearhorizon, it is not uncommon for a collection of objectives tosimply describe what the organization understands to be asingle phase or stage of several required for overall goalachievement.
Once your team has had time to consider the originalmission and strategic goals created in the first workshop, itis likely there will be some revisions. It is usually a goodidea at the beginning of each session to take the current ver-sion of the mission and strategic goals and contrast them tothe checklist at the end of Chapter 4’s “Evaluate Mission,Niches, and Goals.” It may also be worthwhile to raise thequestion as to whether the strategic goals as stated, consid-ering the consensus view of the environment, will, ifachieved, result in a sufficient, sustainable competitiveadvantage that will allow the organization to fulfill its mis-sion. When the team is satisfied with the updated version ofthe mission and strategic goals, it is time to begin to createpossible objectives for each strategic goal.
Remind all team members that objectives deal simplywith what the desired state will be, not how it will be

110 FORMULATE SOUND STRATEGIES
achieved. Without any further discussion of the nuances ofobjectives (to avoid distracting the team and turning the ses-sion into an academic exercise), three- to five-membercross-functional teams should be formed and each assigneda strategic goal. The teams are to break out into a privatearea and spend about an hour discussing and recording pos-sible objectives which, if achieved, would result in attain-ment of the strategic goal (or a major part thereof) to whichthey have been assigned. One team member should be des-ignated the scribe to record all the possible objectives andanother the presenter to share the results with the group.Hand-written notes on acetates used in overhead projectorsare adequate for this exercise, although some organizationsenjoy using higher technology alternatives. The importantpoint is that each possible objective be shared with the over-all framework development team and suggestions or alter-ations which arise during the group discussion be recorded.
A second breakout session then takes place with teamcompositions being altered and strategic goals reassigned toensure maximum exposure and input opportunities for allparticipants. This time the teams should spend 90 to 120minutes and include the remarks recorded at the prior pre-sentation meeting as well as begin to prioritize which of thepossible objectives should occur first. Similar objectives orobjectives with several components are often groupedtogether during this time. Once the breakout groups havecompleted their revised objectives listing, the entire groupreconvenes and reviews and comments on the presentationsfor every strategic goal. If there are more strategic goalsthan there are teams, tackle related groups of strategic goalsone at a time and repeat the process as necessary.

The purpose of charging right into this exercise withouta great deal of discussion about objectives is to enable eachparticipant to grapple with objective formation without anypreconceived paradigms to limit creativity. However, beforea final first draft set of objectives for each strategic goal iscompleted, it is worthwhile to review more completely whatmakes a good objective.
First, a good objective should be well-suited to the strategicgoal. It should reflect an understanding of the internal andexternal environment in which it must be achieved. Oftentimes, more research will be required to place specific numbersor attributes within an objective. However, this should notpreclude its inclusion. It is perfectly acceptable at this stage toleave a blank in the objective statement until additional analy-sis can provide a reasonable figure (e.g., “attain a __% marketshare in product A in __ years”). Suitability should also berevisited once other objectives are created to ensure all objec-tives selected are consistent with each other.
Second, a good objective should be quantifiable. Theability to measure objectives allows managers to determineif they have, in fact, been achieved as well as monitorprogress toward their achievement over time. Numbers areone way in which objectives can be quantified. However, incertain instances, qualitative measurements, when statedfairly specifically, are more appropriate.
Third, an appropriate objective should be understand-able by all involved. It should be clearly stated and suffi-ciently explicit that it can be easily communicated withoutconfusion. If junior high school students can understandwhat it means and what is meant by its achievement, it isprobably worded well.
Develop Objectives 111

112 FORMULATE SOUND STRATEGIES
The timing required for completion is a fourth compo-nent of a good objective. If the objective is critical, thesooner it can be completed the better (Take enough time—but not too much!). More often than not, a specific date inthe future serves this purpose well. However, it is notuncommon to tie one objective to the completion ofanother, thereby still including a time element, but in anindirect way.
Finally, a good objective is feasible. That is, given allthat is known about the organization’s economic, political,technical, and social environment and its existing internalcapabilities, it is likely that the objective can be attainedwithin the time allowed.
These five guidelines should be considered just that. Noone can predict with certainty what actions the organiza-tion’s competitors are going to take in the future, whatdirection the national economy will take next year, or whattechnological advances will become commercial in the com-ing months. Accordingly, it is more important to focus onensuring that the objectives that are selected do, in fact,characterize the strategic goals in a manner considered fairand consistent by the framework development team.
Once all team members are comfortable, they under-stand what is meant by sound objective characteristics, andwhen the review of the guidelines is completed, a thirdround of breakout sessions is generally conducted to facili-tate the creation of a first final draft of objectives for all thestrategic goals. This time, as breakout groups are formed, itmight be useful to have teams that represent those individu-als within the organization that will likely be responsible for

Develop Strategies 113
achieving the ultimately agreed-upon objectives working onthe related strategic goals. The scribe and presenter func-tions are still in effect here, but the time required shouldremain open, allowing each objective to be refined to a levelsupportable by a consensus of the entire framework devel-opment team. Once this is accomplished, the next step is tocreate specific strategies to achieve the objectives.
DEVELOP STRATEGIES
Now that you and your team have developed a set of objec-tives for each strategic goal, it is time to add the next levelto the strategic framework. Underneath and associated witheach objective are several strategies. Typically, there are twoto five strategies for each objective. The less experiencedyour organization is with an objective, the more strategiesthere should be. This improves your chances of achieve-ment, allowing the organization to try another strategy if anunproved one does not work out. As indicated in Exhibit4.2, a strategy is a creative allocation or withdrawal ofresources consistent with traditional principles. Every strat-egy should describe what resources are involved and howthey will be employed.
Strategy formulation is an iterative process. Therefore,your team may want to complete the following three stepsmore than one time before agreeing on a set of strategies:
1. Brainstorm2. Evaluate3. Prioritize

Brainstorm
The first step is to convene the entire development teamand, as a group, create a list of possible strategies for eachobjective, taken one at a time. At this stage, one member ofthe group should be recording all ideas. The atmosphereshould be a totally nonjudgmental one, where brainstorm-ing with abandon is taking place. Although both the leftbrain (analytical, linear, quantitative thinking) and rightbrain (intuitive, creative, qualitative thinking) of each par-ticipant should be involved, the emphasis here is on theright brain. Every strategy and idea that comes up should beincluded on the list, and the list should be in plain sight forall to see. The following guidelines should be reviewed andfollowed as much as possible to ensure the differing per-spectives of the participants and the collective wisdom ofthe group are utilized:
! This is an idea generation exercise (no judgment orcriticism of ideas is allowed and no defense of ideas isnecessary).
! Far-out or wild ideas are encouraged (they often triggermore practical ones).
! Building on another’s idea, or combining in two or moreto come up with another approach is desirable (variationrather than improvement is all that matters).
! The more strategies, the better (quantity is preferredover quality because the more ideas there are, the morelikely useful strategies may develop).
! There is no such thing as a bad idea (some just requiremore work and refinement than others).
114 FORMULATE SOUND STRATEGIES

Some groups prefer to go around the room continually,giving each person a turn to contribute in order. Othersenjoy keeping it a free-form experience, allowing anyone tochime in whenever a thought occurs. In either case, groupmembers should feel comfortable voicing whatever occursto them as a strategy.
Furthermore, strategies that might be useful for oneobjective might come into play as a means of accomplishinganother. This kind of duplication, too, should be encour-aged. Because resources are generally scarce, and strategiestypically use up these scarce resources, the more objectivesthat can be achieved with one strategy (i.e., fewer resources),the better.
Evaluate
The second step is to break out into groups, with eachgroup responsible for one objective and its related list ofbrainstormed strategies. The responsibility of each group isto combine and rework the strategies so that they begin tocontain a certain amount of realism. At this stage they canbegin to prioritize and make suggestions regarding whichstrategies should be selected. Consideration should be givento how well each reworded strategy conforms to these tradi-tional principles:
! Focus. Is it clearly directed toward the achievement ofthe objective?
! Realism. Does it seem do-able with available resources?! Mass. Does it concentrate resources at the right place to
ensure a win?
Develop Strategies 115
! Exploitation. Does it take advantage of competitors’weaknesses?
! Indirection. Does it concentrate resources where there isno competition?
! Economy. Can it be accomplished at the same level withfewer resources?
! Cooperation. Will it adversely impact other parts of theorganization?
! Flexibility. Can we change course or withdraw withminimal expense?
! Unity. Will coordination within or without the organi-zation be an issue?
! Simplicity. Is there a less complex solution available atthe same cost?
! Surprise. Will it give the organization a sustainable leador edge?
! Change. Does it take advantage of or exploit knowntrends?
Sometimes, one or more of these traditional principlesmay not apply. For example, if an idea involves a marketresearch project, it may, at first blush, appear to not meetthe realism principle (not do-able with available resources)if the organization has no market research staff or budget.However, a creative strategy might involve establishing aconnection with a marketing professor at the local collegewho will then encourage his students to become involved inthe project with little cost to the organization.
Once the group is satisfied with its initial effort, it is topresent the list of reworked strategies to the entire team,making sure none of the initial brainstormed strategies have
116 FORMULATE SOUND STRATEGIES
Develop Strategies 117
been eliminated. This ensures that others in the group, whomight have a particular inclination toward a particular ideaof their own, have an opportunity to explain how it worksand defend it prior to its being given a lower priority oreliminated.
Prioritize
Once the entire group has had an opportunity to review andprovide input on all the strategies, the breakout groups areto retire to privacy again, incorporate the feedback, andrework and shrink down the list of strategies to come upwith the final first draft of strategies.3
Once this is done for each objective, it is time to create afinal first draft of the strategic framework for the first fourlevels (Mission, Strategic Goals, Objectives, and Strategies).A simplified example of how this might look is contained inExhibit 5.2.
Notice how ABC Company’s mission and strategic goalscontain statements which are:
! long term (“to be a leader”),! relative (“cleverest, fastest, and most economical”), and ! interconnected (“designing, assembling, and selling”).
Also notice how their objectives are:
! well suited to the strategic goal (“reduce cost” tiesdirectly to “most economical”),
! quantifiable (“0.5% annually”),! understandable (“one new device every quarter”), and ! include timing (“within three years”).

118 FORMULATE SOUND STRATEGIES
To be a leader in designing, assembling, and selling cockpit instruments
Mission
Strategic Goals
Objectives
Strategies
To be known for having the cleverest, fastest, and most economical avionics products in the industry
Achieve growth by expanding the use of our products in all types of aircraft worldwide
Have at least one of our instruments specified in three out of four new designs
Increase after-market parts sales by at least 20% within three years
Introduce one new device every quarter for the next two years
Increase operating profit margin of current instruments 0.5% annually for the next three years
Increase R&D staff 50%
Double university research grants
Establish strategic alliances with electronics firms
Retain productivity consulting firm
Offer employee awards for cost reduction ideas
Conduct annual cycle time review
Advertise in design publications
Publish technical articles
Provide product demonstrations at major conferences
Initiate training program for distributors
Provide product financing to users
Install inventory control program
EXHIBIT 5.2 ABC Company Draft Strategic Framework

Select Value-Maximizing Strategies 119
Whether or not these objectives are feasible is not dis-cernible by reviewing the wording alone. However, assum-ing the framework was created by a knowledgeabledevelopment team, it is likely the selected objectives areachievable.
Finally, notice how the stated strategies involve allocat-ing resources. Financial resources will be spent directly onuniversity grants, outside consultants, employee awards,and advertising. Staff resources will be spent directly onestablishing strategic alliances, conducting annual reviews,writing articles, providing product demonstrations, andtraining distributors. To determine the total resourcesrequired to achieve the objectives, simply add up the directfinancial expenditures, multiply the staff and facility timerequired by an appropriate billing rate or hourly charge,and combine the two. Most organizations discover that thefirst time through, such a summation results in far moreresources than those which are readily available to it. Hencethe iterative nature of the framework development process.
SELECT VALUE-MAXIMIZING STRATEGIES
Once the development team has created a draft frameworkthrough the strategy level with which it is satisfied, the partic-ipants will have completed a most important workshop andcan be freed to return to their “normal” jobs and routines.However, additional analyses of their output should be con-ducted to consider which combination of strategies is mostlikely to maximize the value of the organization and has thegreatest chance for successful implementation. The firstanalysis is a financial one whereby strategies are converted

120 FORMULATE SOUND STRATEGIES
into cash flows and the impact on the overall valuation of theorganization is determined. The second analysis contrasts theselected strategies to a qualitative checklist to ensure nomajor principles are violated or logic flaws exist.
Cash Flow Valuation
As a general rule, the more cash flow that can be generatedand the smaller the investment required, the better the strat-egy and the more it enhances the organization’s value.However, seldom are real-world strategies this simple orexecuted in a vacuum. Rather, they usually involve a varietyof resources and impact a number of different financialvariables.
For example, looking at Exhibit 5.2, let us contrast thevalue-enhancing effects of two different objectives (con-tained in boxes two and four from the left) and their relatedthree strategies:
Objectives Strategies
S.1 Retain productivityconsulting firm
S.2 Offer employee awardsfor cost reduction ideas
S.3 Conduct annual cycletime review
O.2 Increase operatingprofit margin ofcurrent instruments0.5% annually for thenext three years
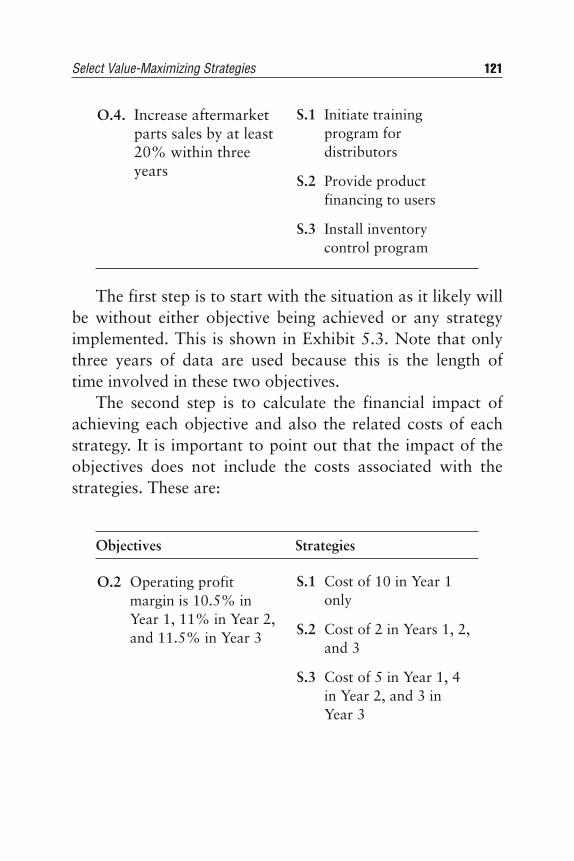
The first step is to start with the situation as it likely willbe without either objective being achieved or any strategyimplemented. This is shown in Exhibit 5.3. Note that onlythree years of data are used because this is the length oftime involved in these two objectives.
The second step is to calculate the financial impact ofachieving each objective and also the related costs of eachstrategy. It is important to point out that the impact of theobjectives does not include the costs associated with thestrategies. These are:
Objectives Strategies
S.1 Cost of 10 in Year 1only
S.2 Cost of 2 in Years 1, 2,and 3
S.3 Cost of 5 in Year 1, 4in Year 2, and 3 in Year 3
O.2 Operating profitmargin is 10.5% inYear 1, 11% in Year 2,and 11.5% in Year 3
S.1 Initiate trainingprogram fordistributors
S.2 Provide productfinancing to users
S.3 Install inventorycontrol program
O.4. Increase aftermarketparts sales by at least20% within threeyears
Select Value-Maximizing Strategies 121

If we implement only the strategies aimed at achievingthe first objective, O.2, the revised cash flow decreases inyear one then improves markedly in Years 2 and 3, asshown in Exhibit 5.4.
S.1 Cost of 6 in Year 1, 2 inYear 2, and 2 in Year 3
S.2 Increase in workingcapital 1 in Year 1, 2 inYear 2, and 3 in Year 3
S.3 Increase in fixed capitalinvestment of 3 in Year1 only
O.4 Operating Profit is 108in Year 1, 116 in Year2, and 128 in Year 3
122 FORMULATE SOUND STRATEGIES
EXHIBIT 5.3 ABC Company Yearly Cash Flows Before Strategy Implementation
Year 1 Year 2 Year 3
Revenues 1060.00 1123.60 1191.02
Operating Profit Margin (%) 10.00 10.00 10.00
Operating Profit 106.00 112.36 119.10
Less:
Taxes 42.40 44.94 47.64
Increased Fixed Capital Investment 2.40 2.54 2.70
Increased Working Capital Investment 1.80 1.91 2.02
Cash Flow from Operations 59.40 62.96 66.74

Select Value-Maximizing Strategies 123
If we implement only the strategies aimed at achievingthe second objective, O.4, the revised cash flow alsodecreases in Year 1, but does not become greater than theoriginal case until Year 3, as shown in Exhibit 5.5.
The cash flow results by scenario are summarized inExhibit 5.6. When looking at the total cash flows during theperiod in question, it becomes obvious that implementingObjective O.2 is superior to implementing Objective O.4.Also, on the surface, when total cash flows are compared, itappears that Objective O.2 is superior to the No Objectivescenario. However, considering the time value of money, NoObjective may be a better value-enhancing alternativebecause its cash flow in Year 1 is over seven times greater
EXHIBIT 5.4 ABC Company Projected Cash Flows:Objective O.2
Year 1 Year 2 Year 3
Revenues 1060.00 1123.60 1191.02
Operating Profit Margin (%) 10.50 11.00 11.50
Operating Profit 94.30 117.60 131.97
Less:
Taxes 37.72 47.04 52.79
Increased Fixed Capital Investment 2.40 2.54 2.70
Increased Working Capital Investment 1.80 1.91 2.02
Cash Flow from Operations 52.38 66.11 74.46

124 FORMULATE SOUND STRATEGIES
EXHIBIT 5.5 ABC Company Projected Cash Flows: Objective O.4a
Year 1 Year 2 Year 3
Revenues NA NA NA
Operating Profit Margin (%) NA NA NA
Operating Profit 102.00 114.00 126.00
Less:
Taxes 40.80 45.60 50.40
Increased Fixed Capital Investment 5.40 2.54 2.70
Increased Working Capital Investment 2.80 3.91 5.02
Cash Flow from Operations 53.00 61.95 67.88
a Revenues and Operating Profit Margins are NA (not applicable) because achieving thisobjective involves changes in volumes in product lines (parts versus original products) withdifferent margins; accordingly, only the final impact on operating profit is shown.
than Objective O.2. The way to resolve these types of timingdifferences, of course, is to discount the cash flows to theirrespective present values, as covered in Chapter 2’s “MasterDiscounted Cash Flow.”
When dealing with combining several objectives andtheir related strategies, or selecting only some of all identi-fied strategies and implementing as a group, one must con-sider the cross-financial impacts involved. However, the

Select Value-Maximizing Strategies 125
methodology remains the same. Linear programming mod-els and software abound to simplify the kind of analysesinvolved here.
Once the cash-flows are ultimately determined, then thecomparisons of multiple strategic combinations can beaccomplished. By following the guidelines in Chapter 2’s“Calculate Current Organization Value” for each set ofstrategic combinations, the one set that yields the greatestvalue for the organization (and hence, maximizes its value)can be identified. The financial homework is tentativelycompleted, subject to the selected strategies being evaluatedagainst principles.
Principles Evaluation
Once the more attractive cash flow valuation strategies havebeen selected, they should be qualitatively ranked. This is afairly straightforward procedure that allows the organiza-tion to assess alternative strategic options for achieving sim-ilar objectives. Considering the time and effort that such
EXHIBIT 5.6 ABC Company Objectives Cash FlowComparison
Total Scenario Year 1 Year 2 Year 3 Cash Flow
No Objective 59.40 62.96 66.74 189.10
Objective O.2 52.38 66.11 74.46 192.95
Objective O.4 53.00 61.95 67.88 182.83

126 FORMULATE SOUND STRATEGIES
evaluations typically take, this kind of detailed qualitativeevaluation is usually reserved for major strategic optionsonly. It works best if two to four options are being con-trasted at the same time.
Exhibit 5.7 provides an objective framework to contrastalternative strategic options. For exemplary purposes theseare called options A, B, and C. The principles that areinvolved are the twelve listed in the “Develop Strategies”section of this chapter. The questions associated with eachprinciple should be asked of every strategic option andnumerically ranked on a scale of one to ten, with one indi-cating the option unsatisfactorily follows the principle andten indicating it follows it completely. The results for eachoption are then summarized at the bottom.
Generally, the winner with the highest number of pointswill be clear. Considering that these are usually importantstrategic options under consideration, however, it is worth-while asking three more questions concerning the mathe-matical results:
1. Should a low score anywhere disqualify the optioncompletely?
2. Should some of the principles be weighted more heavilythan others?
3. How do the results compare to our intuition? Does itmatter?
This exercise should be completed for the major strate-gies developed.
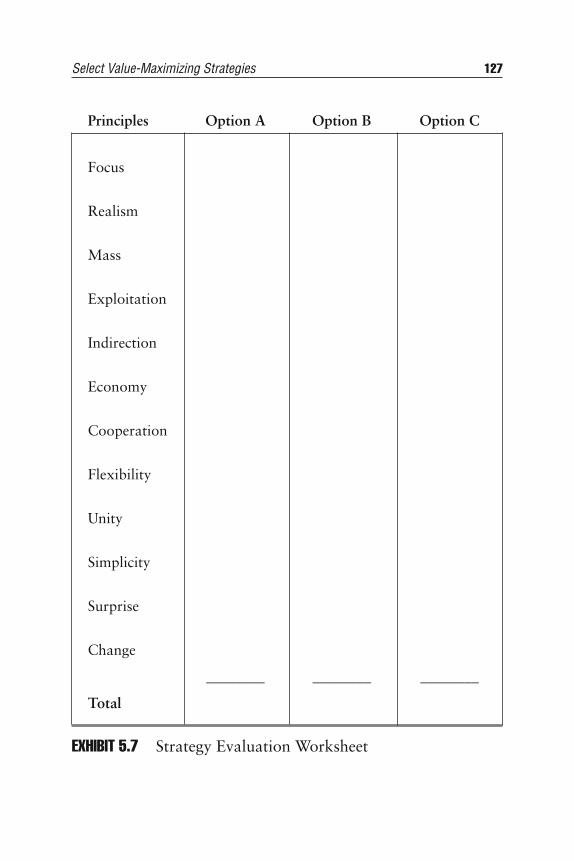
Select Value-Maximizing Strategies 127
Principles Option A Option B Option C
Focus
Realism
Mass
Exploitation
Indirection
Economy
Cooperation
Flexibility
Unity
Simplicity
Surprise
Change
________ ________ ________
Total
EXHIBIT 5.7 Strategy Evaluation Worksheet

128 FORMULATE SOUND STRATEGIES
SUMMARY
The initial strategy formulation period requires a great dealof creativity and patience. Once the draft framework iscompleted, it can be laid to rest for a while (three to sixweeks) in preparation for the next phase of its development.In this step, the key strategies are evaluated and prioritizedby the organization’s development team in preparation forthe execution step, where action plans are developed andimplementation begins.
ENDNOTES
1. Also known as the I3 list. This collection of ideas representsconcrete, yet simple ways to demonstrate how the strategicframework process can result in positive changes, startingimmediately. One of the ways to implement change is to studyand refine a new approach in great detail before implementingit. The ideas on this list are often better altered as necessaryafter they are implemented, thereby creating an action-orientedatmosphere within the organization and replacing time spentstudying with time spent monitoring and altering (an approachusually benefiting overall efficiency and organization cashflow).
2. Informal Friday afternoon parties, wearing impressiveuniforms, company songs, and formal award ceremonies aresome of the countless techniques companies use to giveemployees a sense of ownership and pride in the organization.
3. To ensure no good ideas are lost in the shrinking downprocess, many organizations keep a strategic frameworkcreation notebook that contains copies of all the workingpapers created during the iterative development process.
CHAPTER
129
6Evaluate Alternative Approaches
All of the work to date is for naught if the strategic frame-work is not executed. Specifically, the organization needs
to focus on executing the selected strategies contained in theframework. When successfully executed, these strategiesshould aid in the achievement of the critical few objectiveswhich, in turn, move the organization toward strategic goaland mission attainment.
Execution is a process involving all aspects of the orga-nization. Highly motivated people working on tasksmatched to their skill levels, conscious of the actions andprogress of other parts of the organization, represent theideal in execution. Achieving this state is no simple task, butthe result—enhanced organization value—is well worth theeffort.
But how can you be sure the strategies developed willenhance your organization’s value? The answer is simple—quantify the impact that executing the selected strategieswill have on value and contrast this to the value your orga-nization would have if none of the selected strategies is exe-cuted. In order to assist you in communicating quantifiableresults in a clear and precise manner, this chapter contains
130 EVALUATE ALTERNATIVE APPROACHES
an example which you should easily be able to adapt toyour organization’s possible strategies. It shows you how,step by step, to make this critical comparison.
REVIEW THE SELECTED STRATEGIES
There are four objectives identified in the ABC CompanyDraft Strategic Framework (see Exhibit 5.2). These objec-tives deal with:
! New product (device) introductions! Cost reduction (margin improvement) efforts! New markets (designs) for existing products! Accelerating growth (parts)
The variety of these objectives and their supportingstrategies provide many examples of the specifics involvedin the process of evaluating a strategic framework. Theseobjectives (labeled “O.n”) and their supporting strategies(labeled “S.n”) are:
O.1 Introduce one new device every quarter for thenext two years
S.1 Increase R&D staff by 50%S.2 Double university research grantsS.3 Establish strategic alliances with electronic
firms
O.2 Increase the operating profit margin of currentinstruments 0.5% annually for the next three years
S.1 Retain productivity consulting firm

Understand the Methodology 131
S.2 Offer employee awards for cost reductionideas
S.3 Conduct annual cycle time review
O.3 Have at least one of our instruments specified inthree out of four new designs
S.1 Advertise in design publicationsS.2 Publish technical articlesS.3 Provide product demonstrations at major
conferences
O.4 Increase after-market parts sales by at least 20%within three years
S.1 Initiate training program for distributorsS.2 Provide product financing to usersS.3 Install inventory control program
Each of the twelve strategies involves the use of certainresources and is expected to achieve a certain result. Thepeople involved in developing the cost and revenue projec-tions associated with these strategies should be familiarwith the organization and the functional areas involved.After all, major resource decisions will be based on theiranalysis and the level of success of the strategies willdepend, to a large extent, on their assessment of the capabil-ities of those charged with execution.
UNDERSTAND THE METHODOLOGY
Convincing yourself and key members of your team that effec-tive execution of strategies improves the value of the organiza-tion requires a credible and repeatable methodology for

132 EVALUATE ALTERNATIVE APPROACHES
quantifying the financial impact of executing the proposedstrategies. Specifically, the methodology employed in thisexample shows how to estimate the results that would beobtained by achieving all four of the objectives spelled out inthe ABC Company Draft Strategic Framework (see Exhibit5.2). These results, in turn, are used to calculate a new, highervalue for the organization if all the strategies are executed.
The benchmark against which to measure the increase invalue resulting from executing the above strategies will bethe ABC Company Current Organization Value of $524.3(calculated in Chapter 2’s “Calculate Current OrganizationValue”) in which “nothing in the future changes.” For easeof reference it will be called the Base Case. By way ofreview, this Base Case value is computed using the dis-counted cash flow methodology. This cash flow, in turn, isgenerated from a five-year projection of financial perfor-mance using historical averages. The historical averagesused in the projections are applied to figures representingcurrent financial performance (Year 0 numbers).
The new ABC Company value, incorporating the twelvestrategies proposed earlier, will be called the Revised Case.To ensure the Revised Case is comparable to the Base Case,both begin with identical figures for the current year (Year0), the key line items of which appear in some detail, alongwith their five-year historical averages, in Exhibit 6.1.
Furthermore, to maintain comparability, both cases usea five-year projection period. These numbers, therefore,provide the starting point for the strategy execution valueanalysis embodied in the Revised Case.
Notice in Exhibit 6.1 that total revenues in the startingyear (Year 0—the year preceding the one in which the

Understand the Methodology 133
EXHIBIT 6.1 ABC Company Starting Year
Five YearYear 0 Historical Average
Total Revenues 1000 6% growth/year
! Instruments—Existing 500 6% growth/yearAirplane Designs
! Instruments—New Airplane Designs 0! Parts 500 6% growth/year! New Devices 0
Total Operating Profit Margina 10% 10%
! Instruments—ExistingAirplane Designs 8% 8%
! Instruments—New Airplane Designs! Parts 12% 12%! New Devices
Total Operating Profit 100
! Instruments—ExistingAirplane Designs 40
! Instruments—New Airplane Designs 0! Parts 60! New Devices 0
Less:
Taxes 40% of operating profit
Incremental Working Capital Investment 3% of change in revenues
Incremental Fixed Capital Investment 4% of change in revenues
a Figures expressed as a percentage of associated revenues.

strategies are executed) are 1000 and that they are com-posed of two line items, each with 500 in revenues—instru-ments compatible with existing airplane designs, and parts.However, because the strategies address two new sources ofrevenue—new devices not currently developed or sold, andinstruments compatible with new airplane designs—theseline items are included for clarity’s sake, even though theirrevenue in Year 0 is zero.
Furthermore, notice that the total operating profit mar-gin in Year 0 is 10%, the average of 8% on instrumentscompatible with existing airplane designs and 12% onparts. The actual operating profit of 100 in Year 0 is alsoshown with the appropriate amount allocated to the twocurrent line items. Again, for clarity’s sake, line items for thetwo new sources of revenue are shown as line items in theoperating profit sections.
Finally, note that the five-year historical averages areincluded. All of these are used in the Base Case and will beused in the Revised Case, unless a strategy is proposedwhich alters a particular historical average.
QUANTIFY THE SELECTED STRATEGIES
Determining the overall impact on the Revised Case valueof achieving the selected objectives by executing theirrespective strategies requires an examination of the costsand benefits involved. The example which follows uses eco-nomics developed by the ABC Company management teamafter several iterations in which more cost-effectiveapproaches were developed and the principles of strategywere revisited and incorporated. The key drivers of cash
134 EVALUATE ALTERNATIVE APPROACHES

Quantify the Selected Strategies 135
flow for each objective are built up based on calculations atthe strategy level. The methodology involved is demon-strated in the analysis of the four selected ABC Companyobjectives contained in the following subsections. The focusis on the incremental costs and revenues resulting from theexecution of the selected strategies (i.e., those above theones already embodied in the Base Case).
Objective 1: New Devices
The first strategy employed to obtain the objective of introduc-ing a new device every quarter is to increase the research anddevelopment staff by 50%. Inasmuch as the Year 0 cost waseight, the incremental cost will be an additional four per yearfor the upcoming five years (Years 1 through 5). Additionally,hiring costs in Year 1 will make this value five, not four.
The second strategy is to double university researchgrants. These grants were one in Year 0 and, accordingly,will be two in Years 1 through 5. Included in this increaseare the costs associated with directing the universityresearchers toward technology specifically applicable in newABC Company devices.
The third strategy is to establish strategic alliances withelectronic firms. The purpose here is to ensure ABC’s newdevices have access to the latest electronic technology.Cooperation from firms that have such technology will begarnered by offering them ABC technology that can be uti-lized by other organizations not competing directly withABC. The ongoing costs associated with this technologytransfer are estimated to be one annually in Years 1 through5, with an additional cost of one in Year 1 to establish andnegotiate relationships.
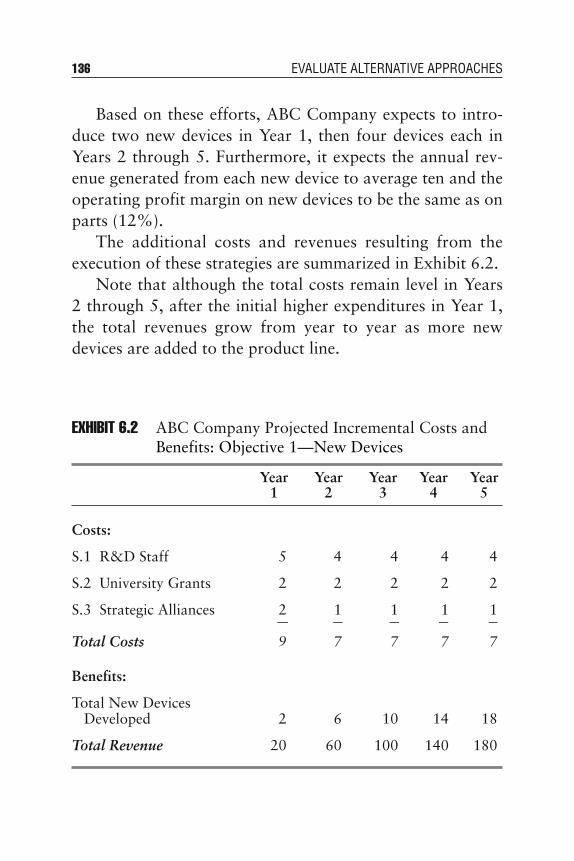
136 EVALUATE ALTERNATIVE APPROACHES
EXHIBIT 6.2 ABC Company Projected Incremental Costs andBenefits: Objective 1—New Devices
Year Year Year Year Year 1 2 3 4 5
Costs:
S.1 R&D Staff 5 4 4 4 4
S.2 University Grants 2 2 2 2 2
S.3 Strategic Alliances 2 1 1 1 1
Total Costs 9 7 7 7 7
Benefits:
Total New Devices Developed 2 6 10 14 18
Total Revenue 20 60 100 140 180
Based on these efforts, ABC Company expects to intro-duce two new devices in Year 1, then four devices each inYears 2 through 5. Furthermore, it expects the annual rev-enue generated from each new device to average ten and theoperating profit margin on new devices to be the same as onparts (12%).
The additional costs and revenues resulting from theexecution of these strategies are summarized in Exhibit 6.2.
Note that although the total costs remain level in Years2 through 5, after the initial higher expenditures in Year 1,the total revenues grow from year to year as more newdevices are added to the product line.

Quantify the Selected Strategies 137
Objective 2: Operating Profit Margin
The first strategy indicated to increase operating profit mar-gins on the existing instrument product line of 0.5% annu-ally for the next three years is to retain a productivityconsulting firm. This effort requires a six-month study andsix months to implement the recommendations, resulting ina cost of five in Year 1. Because the new recommendationsare up and running by Year 2, there are no additional costsin Years 2 through 5.
The second strategy involves offering employee awardsfor cost reduction ideas. For most employees at ABCCompany, the recognition is as important as the compensa-tion. However, the costs of communicating and managingthe program for the three-year horizon spelled out in theobjective are substantive, resulting in an annual cost,including awards of two in Years 1 through 3.
The third strategy involves conducting cycle time reviewsevery year for the three-year horizon of the objective. Theseanalyses follow the path the typical order takes from origina-tion through product delivery and follow-up service. Theyidentify disconnects and inefficiencies in processing and man-ufacturing and are fairly time consuming. However, the com-pany gets better each year at the process, resulting in annualcosts of four in Year 1, three in Year 2, and two in Year 3.
Because these three strategies focus on current instrumentsthat have an operating profit margin of only 8% in Year 0,and are carried out only in the first three years, the benefitslikely to accrue are limited to this time period as well.Accordingly, the operating profit margin for instruments-existing airplane designs grows to 8.5% in Year 1, 9.0% inYear 2, and 9.5% in Year 3, where it remains through Year 5.
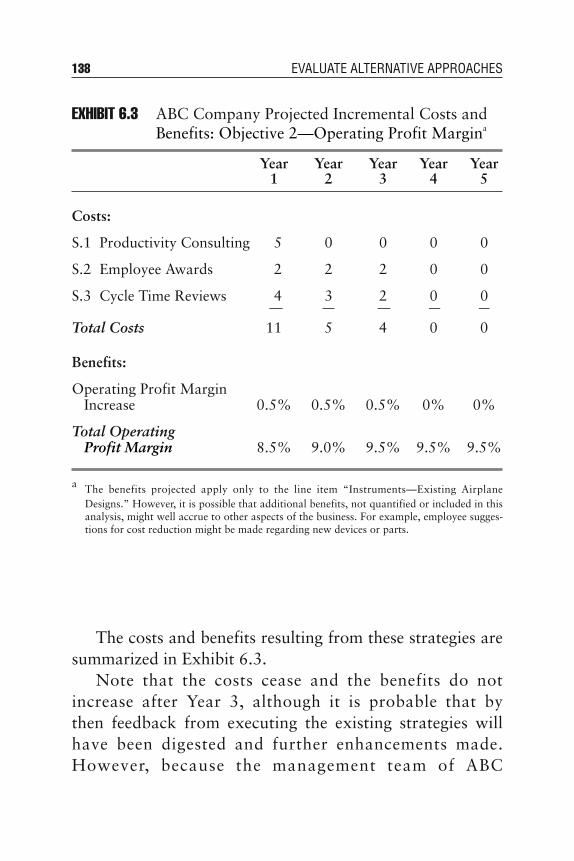
138 EVALUATE ALTERNATIVE APPROACHES
EXHIBIT 6.3 ABC Company Projected Incremental Costs andBenefits: Objective 2—Operating Profit Margina
Year Year Year Year Year 1 2 3 4 5
Costs:
S.1 Productivity Consulting 5 0 0 0 0
S.2 Employee Awards 2 2 2 0 0
S.3 Cycle Time Reviews 4 3 2 0 0
Total Costs 11 5 4 0 0
Benefits:
Operating Profit Margin Increase 0.5% 0.5% 0.5% 0% 0%
Total Operating Profit Margin 8.5% 9.0% 9.5% 9.5% 9.5%
a The benefits projected apply only to the line item “Instruments—Existing AirplaneDesigns.” However, it is possible that additional benefits, not quantified or included in thisanalysis, might well accrue to other aspects of the business. For example, employee sugges-tions for cost reduction might be made regarding new devices or parts.
The costs and benefits resulting from these strategies aresummarized in Exhibit 6.3.
Note that the costs cease and the benefits do notincrease after Year 3, although it is probable that by then feedback from executing the existing strategies willhave been digested and further enhancements made.However, because the management team of ABC

Quantify the Selected Strategies 139
Company is conservative, the analysis does not take thislikelihood into consideration.
Objective 3: New Designs
The first strategy employed to reach the objective of havingone or more ABC instruments specified in 75% or more ofnew designs is to advertise in aircraft design publications. Astudy of the average advertising expenditures for instrumentcompanies, coupled with several meetings with the mediadepartment of the organization’s advertising agency,resulted in cost projections of two for Years 1 through 5.This level of expenditure is believed to be adequate for mak-ing the desired impact on the design community.
The second strategy is for ABC employees and/or relatedparties to publish technical articles espousing the cuttingedge technology and cost effectiveness of ABC products.Considering that much of the talent required for this strat-egy is in-house, its additional annual cost is estimated to beone for Years 1 through 5.
The third strategy involves setting up booths, conductingproduct demonstrations, and generating goodwill at majorconferences and conventions. The agreed-upon approachinvolves starting small, presenting at only a couple of loca-tions in Year 1. Then, as the people working the exhibitsgain more experience, and feedback from customers andprospects is evaluated, the number of events with which theorganization is associated increases, as does the sophistica-tion and effectiveness of its conference and conventionefforts. Accordingly, the costs associated with this strategygrow from one in Year 1 to two in Year 2 to three in Years3 through 5.

The combined result of executing these strategies is thenestimated, based on the following assumptions:
! The industry average is eight new designs per year.! ABC is specified in six new designs per year (75%).! The average annual ABC revenue for each design in
which its products are specified is four in the first year,six in the second year, and eight in the third year andbeyond.
Accordingly, the number of new designs into which ABCinstruments are specified grows by six per year from six inYear 1 to thirty in Year 5. Because these are existing instru-ments, the operating profit margins will rise 0.5% per yearas defined in Objective 2.
The additional costs and revenues resulting from theexecution of these strategies are summarized in Exhibit 6.4.
Note that in this case both costs and revenues rise overtime.
Objective 4: Parts
The first strategy to achieve the objective of increasing partssales by at least 20% within three years is to initiate a train-ing program for distributors. The time involved to conducta distributor survey to assess the level of existing ABC prod-uct knowledge and desire for some form of training suggestsfirst year expenses will be higher than ongoing expenses.However, in addition to preparing materials and conductingthe actual training, consideration was given to the necessityto regularly upgrade the program content. Accordingly, the
140 EVALUATE ALTERNATIVE APPROACHES

costs associated with executing this strategy are estimatedto be four in Year 1 and two in Years 2 through 5.
The second strategy is to provide product financing tousers or customers. This would allow them to keep moreparts inventory, yet not necessarily bear the additional cost
Quantify the Selected Strategies 141
EXHIBIT 6.4 ABC Company Projected Incremental Costs andBenefits: Objective 3—New Designsa
Year Year Year Year Year 1 2 3 4 5
Costs:
S.1 Publication Advertising 2 2 2 2 2
S.2 Technical Articles 1 1 1 1 1
S.3 Conference Demonstrations 1 2 3 3 3
Total Costs 4 5 6 6 6
Benefits:
Cumulative New Designs In 6 12 18 24 30
Total Revenue 24 60 108 156 204
a The first year in which ABC products are specified in a new design, its revenues are 4, thesecond year they are 6, and the third year and beyond they are 8. For example, in Year 3,ABC is specified in 6 first-year designs, 6 second-year designs, and 6 third-year designs.Accordingly, revenue in Year 3 is calculated as (6 ! 4) + (6 ! 6) + (6 ! 8) = 108.

142 EVALUATE ALTERNATIVE APPROACHES
of financing the added working capital involved. After sub-stantial analysis by the accounting department, ABC pro-jected this strategy would raise the level of their accountsreceivable (and, hence, short-term working capital require-ment) by a factor of 1% of average annual revenues.
The third strategy involves installing an inventory con-trol program. If effective levels of inventory are maintained,ABC would not lose sales on out-of-stock items or incurexcess financing costs related to low turnover items.Furthermore, by monitoring customer usage patterns, sucha program would enable ABC to keep its customersinformed when their inventories might be running low,thereby enhancing the level of service to an important groupof stakeholders in the organization.
The manufacturing, marketing, and finance team puttogether to analyze this strategy identified two major costelements. The costs involved with designing, installing, andtesting the system in the first year were estimated to bethree, and the costs associated with the ongoing operationand maintenance of the system were estimated to averageone per year. There was also a financial benefit particular tothis strategy. As a result of better controls, the level ofinventories required (and, hence, the short-term workingcapital requirement) would be reduced by a factor of 1% ofaverage annual revenues.
The combined impact on parts sales of these strategies isestimated to improve over time. Because of the substantialamount of initial development work required, parts revenuegrowth in Year 1 is expected to remain only at the historicallevel of 6%. However, as the training, financing, and inventory

Quantify the Selected Strategies 143
programs are executed, this growth rate is expected to increaseto 7% in Year 2, 8% in Year 3, and 9% in Years 4 and 5.
The combined costs and benefits resulting from thesethree strategies are summarized in Exhibit 6.5.
Notice how, for this objective, a significant investment isrequired before the benefits are achieved. Note also that the
EXHIBIT 6.5 ABC Company Projected Incremental Costs andBenefits: Objective 4—Parts Salesa
Year Year Year Year Year 1 2 3 4 5
Costs:
S.1 Distributor Training 4 2 2 2 2
S.2 Product Financing 0 0 0 0 0
S.3 Inventory Control 3 1 1 1 1
Total Costs 7 3 3 3 3
Benefits:
Working Capital Reduction 0 0 0 0 0
Annual Parts Revenue Growth 6% 7% 8% 9% 9%
a The cost associated with the Product Financing strategy is an increase in the ABC annualworking capital requirement of 1% of revenues. However, one of the benefits of the InventoryControl strategy is a decrease in the ABC annual working capital requirement of 1% of rev-enues. Accordingly, these effects cancel each other out and are recorded as “0” in both the costand benefit sections.
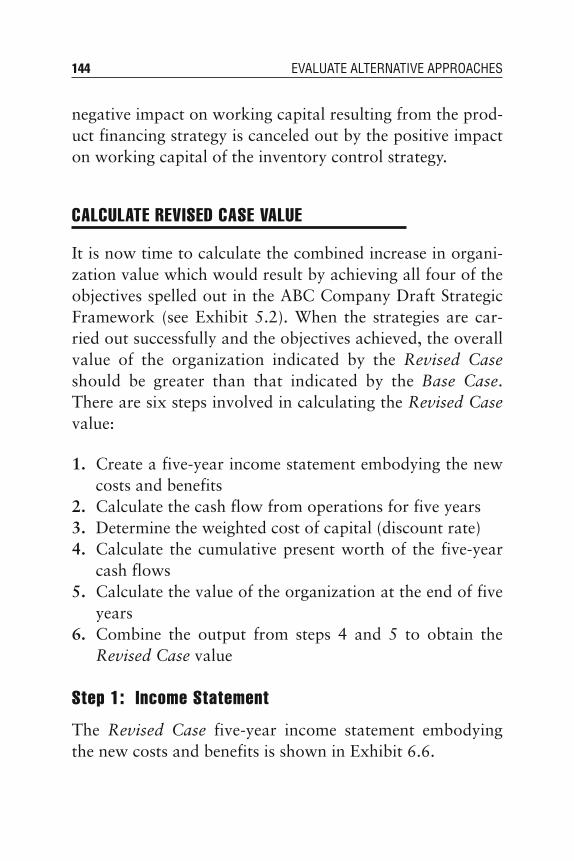
144 EVALUATE ALTERNATIVE APPROACHES
negative impact on working capital resulting from the prod-uct financing strategy is canceled out by the positive impacton working capital of the inventory control strategy.
CALCULATE REVISED CASE VALUE
It is now time to calculate the combined increase in organi-zation value which would result by achieving all four of theobjectives spelled out in the ABC Company Draft StrategicFramework (see Exhibit 5.2). When the strategies are car-ried out successfully and the objectives achieved, the overallvalue of the organization indicated by the Revised Caseshould be greater than that indicated by the Base Case.There are six steps involved in calculating the Revised Casevalue:
1. Create a five-year income statement embodying the newcosts and benefits
2. Calculate the cash flow from operations for five years3. Determine the weighted cost of capital (discount rate)4. Calculate the cumulative present worth of the five-year
cash flows5. Calculate the value of the organization at the end of five
years6. Combine the output from steps 4 and 5 to obtain the
Revised Case value
Step 1: Income Statement
The Revised Case five-year income statement embodyingthe new costs and benefits is shown in Exhibit 6.6.
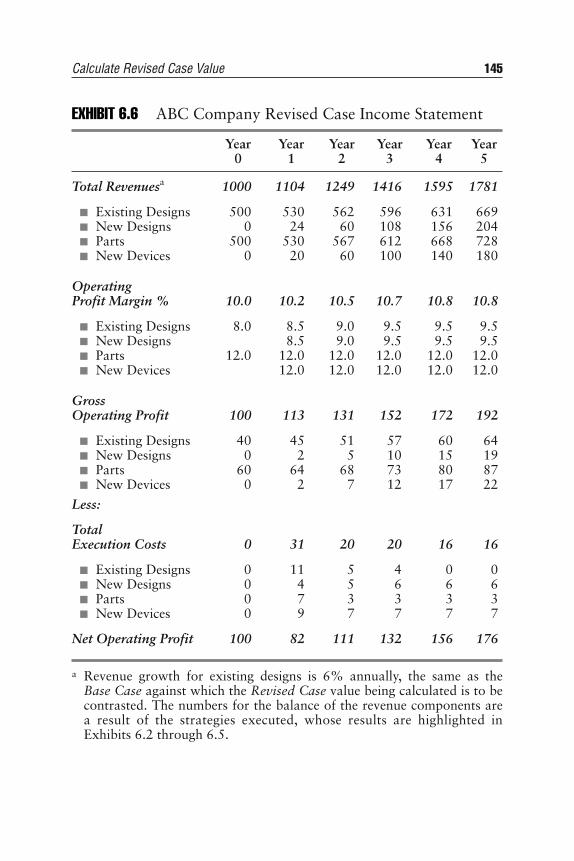
Calculate Revised Case Value 145
EXHIBIT 6.6 ABC Company Revised Case Income Statement
Year Year Year Year Year Year 0 1 2 3 4 5
Total Revenuesa 1000 1104 1249 1416 1595 1781
! Existing Designs 500 530 562 596 631 669! New Designs 0 24 60 108 156 204! Parts 500 530 567 612 668 728! New Devices 0 20 60 100 140 180
OperatingProfit Margin % 10.0 10.2 10.5 10.7 10.8 10.8
! Existing Designs 8.0 8.5 9.0 9.5 9.5 9.5! New Designs 8.5 9.0 9.5 9.5 9.5! Parts 12.0 12.0 12.0 12.0 12.0 12.0! New Devices 12.0 12.0 12.0 12.0 12.0
GrossOperating Profit 100 113 131 152 172 192
! Existing Designs 40 45 51 57 60 64! New Designs 0 2 5 10 15 19! Parts 60 64 68 73 80 87! New Devices 0 2 7 12 17 22
Less:
Total Execution Costs 0 31 20 20 16 16
! Existing Designs 0 11 5 4 0 0! New Designs 0 4 5 6 6 6! Parts 0 7 3 3 3 3! New Devices 0 9 7 7 7 7
Net Operating Profit 100 82 111 132 156 176
a Revenue growth for existing designs is 6% annually, the same as theBase Case against which the Revised Case value being calculated is to becontrasted. The numbers for the balance of the revenue components area result of the strategies executed, whose results are highlighted inExhibits 6.2 through 6.5.
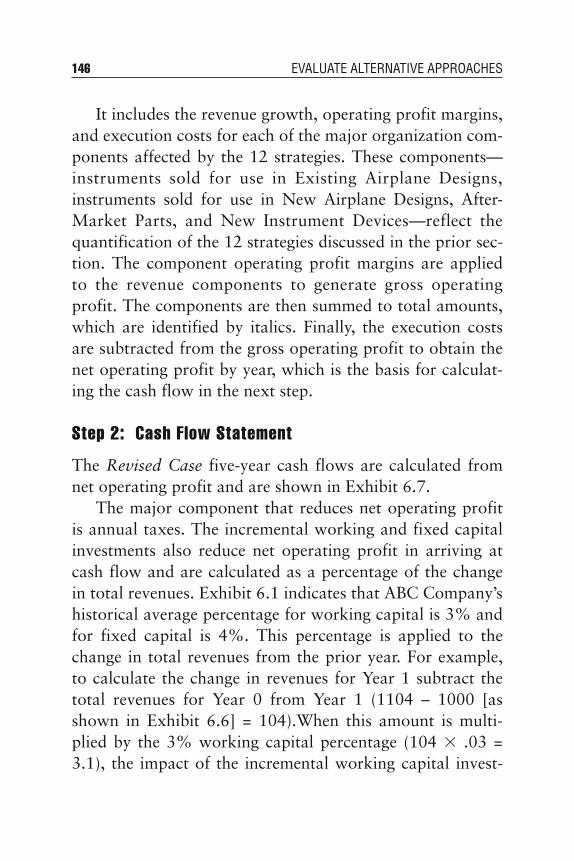
146 EVALUATE ALTERNATIVE APPROACHES
It includes the revenue growth, operating profit margins,and execution costs for each of the major organization com-ponents affected by the 12 strategies. These components—instruments sold for use in Existing Airplane Designs,instruments sold for use in New Airplane Designs, After-Market Parts, and New Instrument Devices—reflect thequantification of the 12 strategies discussed in the prior sec-tion. The component operating profit margins are appliedto the revenue components to generate gross operatingprofit. The components are then summed to total amounts,which are identified by italics. Finally, the execution costsare subtracted from the gross operating profit to obtain thenet operating profit by year, which is the basis for calculat-ing the cash flow in the next step.
Step 2: Cash Flow Statement
The Revised Case five-year cash flows are calculated fromnet operating profit and are shown in Exhibit 6.7.
The major component that reduces net operating profitis annual taxes. The incremental working and fixed capitalinvestments also reduce net operating profit in arriving atcash flow and are calculated as a percentage of the changein total revenues. Exhibit 6.1 indicates that ABC Company’shistorical average percentage for working capital is 3% andfor fixed capital is 4%. This percentage is applied to thechange in total revenues from the prior year. For example,to calculate the change in revenues for Year 1 subtract thetotal revenues for Year 0 from Year 1 (1104 – 1000 [asshown in Exhibit 6.6] = 104).When this amount is multi-plied by the 3% working capital percentage (104 ! .03 =3.1), the impact of the incremental working capital invest-
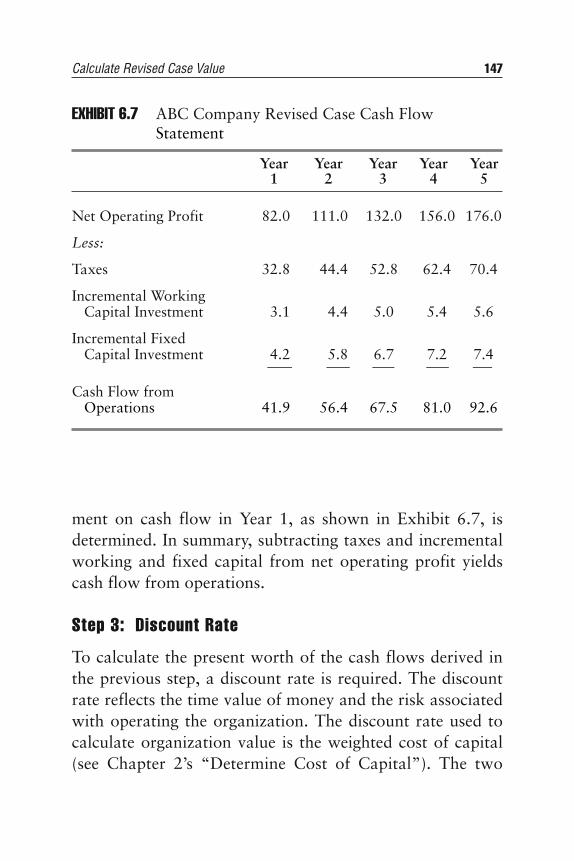
Calculate Revised Case Value 147
ment on cash flow in Year 1, as shown in Exhibit 6.7, isdetermined. In summary, subtracting taxes and incrementalworking and fixed capital from net operating profit yieldscash flow from operations.
Step 3: Discount Rate
To calculate the present worth of the cash flows derived inthe previous step, a discount rate is required. The discountrate reflects the time value of money and the risk associatedwith operating the organization. The discount rate used tocalculate organization value is the weighted cost of capital(see Chapter 2’s “Determine Cost of Capital”). The two
EXHIBIT 6.7 ABC Company Revised Case Cash FlowStatement
Year Year Year Year Year 1 2 3 4 5
Net Operating Profit 82.0 111.0 132.0 156.0 176.0
Less:
Taxes 32.8 44.4 52.8 62.4 70.4
Incremental Working Capital Investment 3.1 4.4 5.0 5.4 5.6
Incremental Fixed Capital Investment 4.2 5.8 6.7 7.2 7.4
Cash Flow from Operations 41.9 56.4 67.5 81.0 92.6

148 EVALUATE ALTERNATIVE APPROACHES
components of this cost of capital are the cost of equity andthe cost of debt. The former is affected by the riskiness ofthe organization’s operations relative to other organizationsand the latter by the amount and nature of the organiza-tion’s debt.
The strategies selected by the management team for ABCCompany, and the resultant objectives if achieved, are incre-mental in nature and, therefore, should not change eitherthe overall risk associated with operating the organizationor the amount of long-term debt required. Accordingly, theRevised Case uses 14%, the same weighted cost of capitaland, therefore, discount rate as that used in the calculationof the Base Case value (see Chapter 2’s “Determine Cost ofCapital”).
However, many strategies, such as building a new plantor buying a competitor, are not just incremental in nature.They involve bold decisions that may alter both the organi-zation’s risk and debt levels. In such cases, the weighted costof capital should be recalculated before using it as a dis-count rate in any comparison.
Step 4: Cash Flow Value
By applying the discount rate of 14% from the prior step tothe cash flow statement of Step 2 (Exhibit 6.7), it is possibleto calculate the cumulative present worth of the five-yearcash flows associated with the Revised Case. The annualcash flow from operations, discount factor, and presentworth of the cash flow are highlighted in Exhibit 6.8.
The last line of this exhibit shows the cumulative presentworth of the cash flows as it increases each year to a total of221.9 in Year 5.

Calculate Revised Case Value 149
Step 5: Ending Value
The next step is to calculate the value of the organization atthe end of five years, after the twelve strategies have beenexecuted. The number resulting from this calculation is called the ending value. The rationale and detail behindthis calculation are contained in Chapter 2’s “MasterDiscounted Cash Flow.” The specific line items needed tocalculate this value and the amounts for the Revised Caseare as follows:
Item Amount
Year 5 net operating profit 176.0
Year 5 taxes 70.4
Discount rate 14%
Year 5 discount factor .5194
EXHIBIT 6.8 ABC Company Revised Case Discounted Cash Flows
Year Year Year Year Year 1 2 3 4 5
Cash Flow from Operations 41.9 56.4 67.5 81.0 92.6
Discount Factor 0.8772 0.7695 0.6750 0.5921 0.5194
Present Worth of Cash Flow 36.8 43.4 45.6 48.0 48.1
CumulativePresent Worth of Cash Flows 36.8 80.2 125.8 173.8 221.9

150 EVALUATE ALTERNATIVE APPROACHES
To calculate the Revised Case ending value, subtract theYear 5 taxes from the Year 5 net operating profit (176 –70.4 = 105.6). Then divide the result by the discount rate(105.6/.14 = 754.3). Finally, multiply the result by the Year5 discount factor (754.3 ! .5194 = 391.8). Therefore, theending value at the end of five years for the Revised Case is391.8.
Step 6: Revised Case Value
In order to obtain the total Revised Case value, reflectingthe execution of the twelve strategies discussed above, sim-ply combine the cumulative present worth of the five-yearcash flows from Step 4 and the ending value from Step 5.Therefore, the Revised Case value is 221.9 + 391.8 or613.7.
MEASURE VALUE ENHANCEMENT
Having completed the analysis of the Revised Case, it isnow time to compare it to the original Base Case. For thetime being, assume these are the only two alternatives avail-able to ABC Company. That is, they can continue to oper-ate the organization as they have historically—the BaseCase, or they can go about executing the dozen strategiesselected in the strategic framework they developed—theRevised Case.
A good place to start is to contrast the characteristicsand financial implications of each case. Accordingly, the dif-ferences in revenue growth, operating profit, and cash flowgeneration are highlighted in Exhibit 6.9.
Each of these three elements are examined as follows:

Measure Value Enhancement 151
Revenue Growth
Three of the four objectives in the Revised Case (O.1—introducing new devices, O.3—specifying instruments in
EXHIBIT 6.9 ABC Company Base Case Versus Revised CaseFinancial Performancea
YearsYear Year Year Year Year 1–5
1 2 3 4 5 Total
Total Revenues:
! BaseCase 1060.0 1123.6 1191.0 1262.5 1338.2 5975.3
! RevisedCase 1104.0 1249.0 1416.0 1595.0 1781.0 7145.0
Net Operating Profit:
! BaseCase 106.0 112.4 119.1 126.3 133.8 597.6
! RevisedCase 82.0 111.0 132.0 156.0 176.0 657.0
Cash Flow from Operations:
! BaseCase 59.4 63.0 66.7 70.8 75.0 334.9
! RevisedCase 41.9 56.4 67.5 81.0 92.6 329.4
a For the original source and calculation of Base Case figures see Exhibit 2.2.

Measure Value Enhancement 153
the Base Case. Moreover, over the five-year period, totaloperating profit is 10% greater for the Revised Case thanfor the Base Case, and is, in fact, over 30% greater in Year5 alone.
Cash Flow from Operations
Cash flows are generally derived from operating profit.Accordingly, they are also lower in Years 1 and 2 for theRevised Case than for the Base Case. However, becausethey are also a function of working and fixed capitalrequirements, which rise with the overall level of revenues,the total cash flows for the Revised Case over the five-yearperiod are actually somewhat less than those for the BaseCase (329.4 versus 334.9). However, by Year 5, as the newstrategies take hold, the Revised Case cash flow is already24% greater than that for the Base Case.
In summary, a review of the differences in financial char-acteristics of the two cases indicates that positive revenueenhancements come quickly but that, due to the additionalcosts associated with spending additional resources onstrategies, operating profit and cash flow improvementstake a while. Therefore, it is important not to lose the long-term focus when analyzing value-enhancing strategies.Often, the management of public companies is accused ofbeing overly concerned with short-term profits. As the ABCCompany comparison shows, a management looking onlyat short-term profits might very well be inclined not to exe-cute value-enhancing strategies because of the negative near-term impact on profits.
However, the long term is where the real value lies. Inreexamining the two components of organization value—
Summary 155
analyze alternative strategies and combinations of strategiesto achieve its desired objectives.
The ability to enhance value by simply following thesteps outlined in the preceding sections exists for all organi-zations. However, it requires a thoughtful approach tobuilding the components of the strategic framework prior toengaging in strategy selection. If shortcuts are taken, thelikelihood of selecting strategies which are not supported bythe skills, resources, people, equipment, or facilities of theorganization can be quite high, resulting in less-than-perfectexecution. Remember, if the strategy is not executed prop-erly and the objective not attained, then the increase invalue will not necessarily follow. But, with practice, contin-ued use and modification of the Strategic Framework willallow you and your management team to generate and exe-cute strategies that maximize the value of your organizationwell into the future.

CHAPTER 7Execute for Value
Well-crafted, value-enhancing strategies have no worth ontheir own. They become significant only when executed.
In order to accomplish this, the last level of the strategicframework must be completed. This straightforwardprocess simply involves creating and attaching action plansto each strategy.
Then, once the final strategic framework is complete, itsexecution can begin. This process can be done forcefully,using direct, in-your-face, confrontational methods or canbe approached more gently, employing indirect, subtle,roundabout means. In practice, most organizations use acombination of both. Regardless of which style an organiza-tion prefers, however, successful implementation willdepend, in large part, on how effectively it is able to directactivities toward achieving and maintaining the agreed-upon niches and long-term goals.
This concentration of effort on enhancing the organiza-tion’s expertise in areas which have a significant impact onsuccess in the marketplace is what will allow it to continueto differentiate itself over time and survive and prosper wellinto the future. It is not a focus on generating cash flow forits own sake, but rather an emphasis on serving targeted
157
Create Action Plans 159
tives, and that achieving these objectives in this fashion will,indeed, increase the overall value of the organization, thetask force should reconvene for an action planning work-shop. The purpose of this session is to decide which individ-ual or group or department is ultimately responsible forachieving which objectives.
It is not necessary that a single individual or departmentperform all the tasks required to obtain an objective. Effortscan cross organizational lines. Likely interdepartmentalinterfaces should be spelled out and highlighted so agree-ment as to levels of involvement and time and resourcecommitments can be anticipated. It is during such discus-sions that a spirit of cooperation should be fostered and allparticipants reminded that it is the organization workingtogether which creates the goal of marketplace differentia-tion and long-term success.
Once responsibilities for each objective and relatedstrategies are clearly spelled out, the formal session is over.The next step is for every team member to take the agreed-upon strategic framework (from the top mission level all theway through the strategy level) and present it to their staffs.The intimate knowledge of the methodology behind and therationale for the framework obtained during the varioussessions involved in its creation is usually enough to ensureits enthusiastic endorsement by the members of the organi-zation. However, a high level of enthusiasm coupled withsome basic sales techniques should facilitate each originalteam member’s chances for achieving buy-in from the staffon the first go ’round. The goal is for the staff to agree thatthe urgency and importance of achieving the stated objec-tives are commensurate not only with the success of theorganization but also their long-term well-being.
160 EXECUTE FOR VALUE
However, if major objections, road blocks, and/or con-flicts arise during the staff presentations, they should not beoverlooked or just set aside. Another action planning work-shop should be scheduled where team members consider allthe feedback obtained from the organization. By now theiterative nature of the overall process should be secondnature to the participants. Accordingly, they should calmlyreflect on the new internal input and, after referring to thepurposes and values elements of the mission, revise respon-sibilities, objectives, and strategies as necessary in an appro-priate way.
Once the revised framework is complete, it should be pre-sented again to the members of the organization. Wherechanges have been made, the reasons should be explained.Where no changes have been made, in spite of protestationsfrom some members of the organization, the rationale behindkeeping things as they were should also be spelled out.Remember it is unlikely any document will please all mem-bers of an organization.
Once the strategic framework is complete down to thestrategy level and buy-in at all levels of the organization ismore or less complete, the next step is for every individualwith objective-achievement responsibilities to convene anaction planning workshop. Prior to doing so, however, eachteam member should review the material on action planningdiscussed later in this section.
The methodology for the staff action planning workshopis very straightforward and similar to that used in previoustop management team workshops. The leader should be theindividual with overall responsibility for objective achieve-ment. Breakout groups should be organized and sent off to

develop specific action plans indicating who, what, where,when, how, and how much. Each breakout group generallyworks on one strategy at a time, creating however manyaction plans seem to be required to accomplish it fully.
Financial Considerations
When working with staff members on the creation of actionplans, regardless of which techniques and guidelines mightbe employed, it is critical to stress that one of the key rea-sons behind all the implementation effort is to increase theoverall value of the organization. The way this gets done isby each individual and group making decisions that alwayscontribute to this end. The way to achieve this is to makeeveryone aware of one simple, mathematical truth:
The value of the organization is enhanced each time aninvestment is made that has a higher return than theorganization’s weighted cost of capital.
The participants need to know only one number—the organi-zation’s weighted cost of capital (see Chapter 2’s “Determinethe Cost of Capital”). This number should be the sameregardless of which area of the organization is involved increating action plans.1 The participants also need to knowhow to calculate an estimated return on investment. Mostorganizations supply calculators, economic models, orspreadsheets that simplify this process. The participantanswers just a few questions related to the investment and thereturn is calculated.
With the weighted cost of capital in one hand and thereturn on the investment in the other, decision making issimple. For example, if one expects to invest $100 at the
Create Action Plans 161

management information systems. Indirect methods utilizeimprecise means such as symbolic actions aimed at alteringthe organization’s culture. Regardless of which method isbeing employed, however, the leader involved should beaware that one of the biggest challenges to be faced isremoving the emotion and fear that staff members typicallybring to such processes. Clear communications as tomethodology, expectations, and roles to be played go a longway toward quelling such concerns.
To better understand the direct approach, let us considerthe first strategy under the first objective for ABC Company(see Chapter 6’s “Review The Selected Strategies”). Thisstrategy is to “Increase R&D staff by 50%,” and one wayto achieve the objective is to “introduce one new deviceevery quarter for the next two years.” One possible directapproach would be to create a detailed action plan spellingout who, what, where, when, and how.
Mr. Smith, Director of Human Resources will run help-wanted advertisements in the local Sunday paper for sixmonths starting next week; Mr. Smith will authorize aproject aimed at identifying competitive compensationand benefits for R&D personnel offered by other com-panies in the area; a committee of Mr. Smith, Ms.Jones, Manager of Technology, and Mr. Jackson, ChiefFinancial Officer, will develop a statement of job speci-fications and candidate requirements to be used in theadvertisement and screening process; all submissionswill be reviewed by the committee weekly and candi-dates selected will be invited to visit promptly. Up to$5,000 in advertising and 50 labor hours will be spent
Create Action Plans 163

to generate up to ten offers to ensure the two positionswhich need to be filled will be done so within eightmonths.
Another direct approach would be to institute a manage-ment information systems procedure. For example, screen-ing criteria to apply to the employee database will be runperiodically to identify potential new R&D staff transferswithin the organization. Also, revisions to budgets and theorganization chart should be made (other direct methods)to reflect the increased expenses and management timeassociated with new hires.
Now let us assume ABC is also interested in using indi-rect means that will support the same objective and strat-egy discussed above. By using the employee newsletter andpress releases, the company reminds all its stakeholders ithas a continuing commitment to innovation in the devicesit sells and to overall corporate growth. This formal, writ-ten communication helps paint a picture of a nice place towork for the candidates identified by the direct means andmay even generate unsolicited inquiries from other inter-ested parties. At staff meetings, managers may share storiesof bonuses and promotions employees have received in thepast for referring candidates or submitting productimprovement ideas, further communicating and inculcatingthe organization’s values of excellence, rewards, andgrowth. Flowers in the R&D reception area, plaques on thewalls, well-designed research smocks, clean facilities, above-average research capabilities and access, and other symbolicyet substantive enhancements all contribute in an indirectway to achieving the implementation of the strategy and theobjective.
164 EXECUTE FOR VALUE

Create Action Plans 165
The main lesson to be learned here is that a combinationof direct and indirect methods is generally more effective inachieving objectives than an approach that just focuses onone or the other. Also, by bringing in different departmentsand functions, the expertise resident therein can aid in moreefficient (less costly) and more effective (longer lasting)results.
Practical Aids
With so many different team members off working withtheir staff members to design action plans, the chances for abreakdown in communications and overall confusion multi-ply. One way to minimize the risk of this happening is tocreate consistency in the way plans are evaluated, docu-mented, communicated, and monitored. Because each orga-nization is different, there is no one way that is likely toprovide the ideal solution for everyone.
The ABC Company uses a structure which is identicalacross all departments. It appears as Exhibit 7.1.
Notice how the relevance of the action plan is emphasizedright at the top of the page. The ABC Strategic Framework isemphasized and tied into by requiring the Long-Term Goaland Niche to which the action plan is related to be stated.The supporting objective and specific strategy are also high-lighted. This reminds the staff that the action they are plan-ning is important to the overall success of the organizationand shows them specifically how this is so.
If repetition is one of the keys to ownership, this formdoes a good job of creating a sense of organizational entre-preneurship among all those involved in action planning. Thecolumns underneath the heading area allow for multiple

166 EXECUTE FOR VALUE
Niche:
Long-Term Goal:
Objective:
Strategy:
Activity Responsibility Timing Resources Costs
EXHIBIT 7.1 ABC Company Action Planning Form

Create Action Plans 167
entries by row, but require important information for eachevent or activity that is likely to take place. Specifically, whois responsible, what timing is involved, what resources will berequired, and what costs will be incurred. The form used byABC may be a useful starting point as your organizationwrestles with designing something which will be appealingand effective in all corners of the organization.
Often, action planning is more complicated than perform-ing a single task by a single individual or committee. Multitaskjobs or projects are generally best designed and controlledusing a form similar to that contained in Exhibit 7.2.
Prior to filling out the form, agreement is reached in fiveareas:
! Description. Clear definition of what will take placewhere
! Outcome. What the project will accomplish! Timing. Targeted start and completion dates! Requirements. People, facilities, supplies, and
equipment involved! Costs. Projected dollars and employee time involved
The next step is to list and number the various tasks inthe order in which they most likely will be accomplished, asshown in Exhibit 7.2. If one task must be completed priorto starting another, it is noted by number in the Follows col-umn. The next four columns—Duration, Target Start,Target Finish, and Responsibility—are filled out prior tobeginning the project. Finally, once the project begins, theactual finish date for each task along with the actual dollarsand time spent are tracked in the last three columns.

168
Tar
get
Tar
get
Act
ual
Act
ual
Act
ual
#T
ask
Follo
ws
Dur
atio
nSt
art
Fini
shW
hoFi
nish
Dol
lars
Tim
e
EXHI
BIT
7.2
ABC
Com
pany
Pro
ject
Pla
nnin
g an
d M
onito
ring
For
m

Create Action Plans 169
Forms such as the preceding are a good starting pointand an excellent means of communication during the actionplan development stage. Of course, all those involved recog-nize that results may not be exactly as expected and/or thatcircumstances may change as the project moves forward.However, these realities should not stand in the way of aneffort to describe each task in as much detail as possible orreasonable.
Prestart Review
The final step to take before actually embarking on frame-work execution is to review all the action and project plans.The following list of questions may prove useful in thisregard:
! Are steps, tasks, and responsibilities stated in sufficientdetail so that an outsider can clearly understand them?
! Are anticipated costs and timing reasonable when allaction plans are considered together?
! Do the various plans contain both direct and indirectmethods?
! Are there both short-term and long-term plans, and is iteasy to differentiate which is which?
! Do the plans individually and collectively clearly focuson achieving the stated niches and long-term goals?
! Do the plans demonstrate a thorough understanding ofthe types of managerial competencies required in theirexecution?
! Considering the importance of people in achievingstrategic goals, are staff members aligned with the rightjobs across all tasks and projects?

170 EXECUTE FOR VALUE
! Are there action plans for functional units (e.g., finance,personnel) as well as line units (e.g., Division A, Division B)?
! Is communication of strategic framework elements (e.g.,mission and niche explanations) included and is it a one-time effort or a continuing program?
! Are staff rewards for action plan and project taskcompletion built in?
! Is there a clear difference between operational andstrategic plans, and have mechanisms been included toensure one is not emphasized at the expense of the other?
! Are there plans to share progress in a timely way and ona regular basis with all members of the organization?
! Is there a credible and repeatable way to quantify and trackthe cash flow and financial returns on the investments beingmade in the action plans?
! Are the plans aggressive enough to achieve the desiredchanges yet modest enough so the staff will not burn outand lose their motivation trying to attain them?
! Is the organization’s leader solidly behind the executionof action plans in both words and deeds?
Once the above questions have been asked and correctlyanswered, the timing is right to begin execution.
PLAN IMPLEMENTATION
This section addresses the steps involved in actually executingthe action plans created. Consideration is given to creating anatmosphere conducive to successful plan implementation, pri-oritizing action plans consistent with strategic imperatives,
Plan Implementation 171
and incorporating action plan activities into the daily routine.Special attention is given to balance, technology, and cus-tomer issues. The section closes with a discussion of thepotential pitfalls inherent in action plan execution.
Cultural Considerations
The first job facing the leadership of an organization that isabout to embark on plan implementation is to create anatmosphere or culture that supports and encourages takingaction. Although the strategic framework is developed, byand large, with an eye toward the organization as a whole,taking action is primarily an individual matter.
Managers and staff charged with executing action plansshould have a sound understanding of what the groundrules are and the personal traits on which they should focusto be successful in implementation. If your organization isone involved in a fast-paced industry, most of the staff isprobably already attuned to taking action fairly quickly, justto keep up. On the other hand, if your organization hasslowly evolved over time, the effort required to introduceand support action steps may be more intense. The ABCCompany has several guidelines regarding action planswhich may be useful for your organization. They are:
! Make a definite, clear, concise, and public commitmentto achieve it.
! Use all available resources to achieve it.! Take responsibility for all tasks under your control.! Accept the good as well as the bad results from your
actions.
Plan Implementation 173
In addition to a shift in the organization’s culture, theaction plans created to support the strategic framework oftenrequire the skills of people not currently part of the organiza-tion and/or information not currently created or captured byits management information system. Accordingly, plans tohire people and upgrade management information systemsgenerally are ranked before most others. It is awfully tough toget something done if you do not have the right person for the job or enough information to make an intelligent decision.
An important conceptual tool in action plan prioritiza-tion is to envision the time available to the organizationover a year as comprising a pie. Before the start of actionplan execution, slices of different sizes comprise the varioustasks which fill the organization’s typical year. Part of theprioritization process is to identify those older tasks (piecesof pie) that, from a strategic and/or operational point ofview, are now of less importance. New slices, representingstrategically important tasks, are likely to replace these. It isalso important to identify critical, ongoing, operating tasksthat must be done. By recognizing the importance of thesetasks, it is less likely that the new, strategically importanttasks will be left undone owing to the pressures of existingoperations.
Those using the pie approach should recognize thataction plans do not cover everything in which an organiza-tion is involved. When they do exist, action plans ofteninvolve repetitive projects. Nonetheless, in the prioritizationprocess it is important to identify and rank those criticalfew matters that warrant immediate, planned action. Aftercompleting a logic check, which ensures no task is to be

started before other required tasks are completed, thesequencing of action plans should be complete.
Balance Consideration
A sense of urgency when it comes to achieving action plansis important. It is contagious and ensures a sustained effortover time. However, a sense of moderation and balancewhen all the action plans are considered together is alsocritical for several reasons. By avoiding extremes, the orga-nization is likely to be able to endure longer and act morewisely in the process. There is more staff enjoyment and lessturnover. It is easier to maintain a sense of ongoing motiva-tion in the organization’s work force. With balance andmoderation the norm, staff members are more likely toarrive at work each day refreshed and looking forward tomany years of productive, fun-filled participation in theorganization’s activities.
The organization should also balance executing actionplans related to products and markets with those involvingthe various support functions. Getting too far ahead in onearea may mean that a higher level of activity cannot beeffectively supported or that support resources are beingwasted on low levels of business.
The less familiar an organization is with how to achievea particular objective, the more likely it will not be able tostructure an action or project plan that will take it to thedesired result. Accordingly, several different test actionplans may be implemented simultaneously and, then, closelymonitored to see which one is working the best. When thisis determined, the others can be dropped.
174 EXECUTE FOR VALUE

It is perfectly normal to have both types of action plansunderway during execution. In fact, balance should be soughtbetween these two types. If there aren’t at least a few simulta-neously executed test action plans, then it is likely the organi-zation is not pursuing enough change to be meaningful.
Technology Considerations
The information revolution is so pervasive that action plansoften require enhanced electronic equipment and systems. Thecost of outfitting the organization with the desired level oftechnology can be quite high and subject to fairly quick obso-lescence. A sound understanding of the interface between theorganization’s strategic framework and its information tech-nology needs is important.
There are four critical steps to accomplishing this:
1. Identify the elements of the framework involved in orrequiring technology
2. Define clearly the solution desired by technology foreach element
3. Match the costs and benefits associated with each elementand contrast with the cost of capital
4. Obtain competitive quotes for a system that supplieswell-bounded solutions for those elements where theinvestment is warranted
Because the strategic framework has been created for thelong term, the chances of making unnecessary or unwiseinformation technology investments is significantly reduced.
Plan Implementation 175

176 EXECUTE FOR VALUE
Customer Consideration
Without customers or clients, most organizations wouldcease to exist. It is useful when executing action plans toconsider the customer is king! Generally, customers defineyour organization’s product and/or service by paying onlyfor what gives them value. While organizations and theirofferings differ widely, customers seem to be driven primar-ily by wanting things faster, cheaper, and better. Actionplans which assist the organization in accomplishing thiswill be the most productive.
To grow, the organization must increase at least one ofthree things:
1. The longevity of the customer (number of repeatpurchases/visits)
2. The sales per customer3. The number of customers
Achieving success in one or more of these areas requiresrecognizing and adapting to changes in the marketplace.Action plans which involve researching and monitoring theindustry in which the organization operates, as well as itscompetitors and vendors, will likely be more fruitful.
Potential Pitfalls and Recovery Techniques
Sound action plans are supported by well-thought-out pro-cedures, operating instructions, rules, and regulations. Thissupporting documentation minimizes confusion and mis-takes during execution. They also have feedback systems.When problems are imminent, an early warning system

should trigger some responsive action. Well-designed feed-back systems also can predict not only upcoming delays,but also new opportunities for alternate, more economicalapproaches and results.
Good action plans should also have financial monitoringcapabilities built in. For example, when the estimated returnon investment from an action or project plan falls below thecost of capital due to unforeseen circumstances during itsexecution, the organization should be immediately informedso a decision as to whether to continue or withdraw can bemade. Each dollar invested after a project becomes finan-cially untenable reduces, unnecessarily, cash flow and hence,organization value.
Well-publicized remedial steps associated with actionplans send the message to staff members that action plansare important, everyone knows they are imperfect, and thatproceeding with all due haste is desirable, because anylosses due to circumstances beyond the control of theresponsible party will be minimized. An organization thatpublishes its action planning failures is actually doing every-one a favor. It is much better to learn from another’s mis-take than to repeat it yourself.
EMBRACE CHANGE
The strategic framework provides a structure that allowsthe organization to stay focused on accomplishing its mis-sion and enhancing cash flow through the actions of moti-vated employees guided by shared values. Its flexiblestructure also allows the organization to continually adaptand reorient its operations in response to changes in its
Embrace Change 177

environment. This section addresses the differing levels ofimpetus to change, the challenges of change, and variousways to confront these challenges within the context of thestrategic framework.
Impetus to Change
The urgency which different departments within the organi-zation feel regarding how important it is to implement theiraction plans varies depending on how threatened theybelieve the organization’s survival is. Informally, there arethree broad levels of urgency which seem to exist. Rankedfrom low to high they are:
1. “Let’s think about it.”2. “We ought to do something soon.”3. “It’s now or never!”
In the first case, there is a sense that the health of theorganization is okay, but that changes in the environment, ifnot addressed at some point, may cause harm to the organi-zation. In the second case, there is some proof that organi-zational performance is not what it should be now, that theearly warning signs of a downturn have already appeared,and that some action should be taken in the not-too-distantfuture. In the third case, the implementation of action planshas been put off so long that the organization is now in acrisis mode and its very survival is threatened. Confrontingchange and taking resolute action provides the only hope ofsurvival.
In practice much of society operates according to thetheory of countervailing power. That is, people or groups
178 EXECUTE FOR VALUE

wait until a situation becomes critical before taking actionto compensate for past indifference and to counteract theforces of destruction. One of the challenges in implementa-tion, therefore, is to provide a sense of urgency and commit-ment when the organization is only at level one or two,before the impetus to change reaches level three.
Challenges to Change
Change is inevitable. If you do not recognize this fact andembrace it, it will crush you. The organization must facechange not only as it occurs internally, but also as it is man-ifested in the overall external environment in which it oper-ates. The challenge to the organization is to deal with bothsimultaneously, ensuring that actions taken in one arenareflect the changes occurring in the other.
Internally, as action plans are executed, the organizationand its people will grow and be stretched, but along the waysome rough moments will be encountered. Some staff mem-bers, after attempting to adjust to the new value system andculture dictated by the strategic framework, will likely not seethemselves as fitting in. The causes for this may have more todo with changes in prior vested interests and relationshipsthan with actual differences in values or personalities. Beingaware of this, the challenge to management is to allow peopletime to change their interests and relationships so that theyare aligned with the new framework, rather than just forcingor accepting employee turnover as the only option.
Another challenge internally is dealing with those staff mem-bers who continue to embrace the status quo. They frequentlywill give lip service to accepting the idea of change, but, if notwatched closely, may obstruct progress at every turn.
Embrace Change 179

180 EXECUTE FOR VALUE
Other employees may be resistant to embarking uponchange because of the fear of failure. The internal challengein this case is to encourage new actions that simultaneouslycreate an atmosphere in which failure and losses are accept-able learning experiences, not embarrassing or career-threatening catastrophes.
Externally, the organization operates in an environmentwhere technological change is more revolutionary than evo-lutionary, customer or client needs and perceptions of valuecan shift rapidly, and competition is increasingly global.Against this backdrop, the challenge to the organization istwofold. First, it must have research and data-gathering sys-tems in place to ensure that critical information is providedin a timely fashion to all personnel requiring it. Second, itmust continually monitor niches and long-term goals to seethat they are still relevant and provide that combination ofattributes which will encourage existing and potential cus-tomers and clients to beat a path to its door.
In summary, the challenges of implementation in theorganization are both internal and external. The organiza-tion must determine how to take actions and adapt behav-ior and culture to achieve the niches and long-term goals ithas set for itself in the strategic framework, while facingand dealing with the demands of a rapidly changing world.
Responses to Change
The responses to change are really the secret to successfulstrategy execution. They include:
! Inculcating the organization’s vision and values in allemployees on a regular and consistent basis

Embrace Change 181
! Communicating effectively across the board! Empowering managers successfully! Leading by example from the top
Inculcation If the strategic framework is designed properly,the vision and values will remain constant over time, even ifeverything else about the organization and its environmentchanges. Decisions made at every level of the organizationthat are in line with its overall vision will move it in thedesired direction. Decisions made in line with the organiza-tion’s shared values will provide the proper control.
The job of inculcating vision and values is similar toconditioning the crew on a racing sailboat. Each crewmember has a job to do and in changing winds and highseas there is not enough time to think about what to do.The decision and action have to be almost automatic. Thisconditioning involves training over a long period of timeand continued practice even after the appropriate skills aremastered.
Similarly, conditioning all employees to automaticallyrespond in line with the organization’s vision and values is aprocess that takes time and repetition. Some organizationsview it as a task that should be repeated daily, such asshowering or brushing one’s teeth. This way every individ-ual is reconditioned and ready to act correctly in the face ofwhatever challenges and changes come their way.
If the organization’s traditional vision and related valuesare different than those developed in the strategic frame-work, some effort may be required to position the new,desired culture as more desirable than the old. By clearlydemonstrating that the new culture will result in a more

182 EXECUTE FOR VALUE
trouble-free and profitable future, and that continuing inthe old ways would be more painful, the organization canease potential resistance and accelerate the conditioningprocess. Questions such as, “What is the future likely to beif we don’t change?” and “What positive results can weexpect if we do change?” can facilitate acceptance if theanswers are clearly documented and logically correct.
Once acceptance is generally achieved throughout theorganization, regular conditioning can take place. The waysto accomplish this are limited only by the imagination of theorganization. A list of suggestions developed by ABCCompany is contained in Exhibit 7.3. As your organizationexperiments with different approaches to accomplishing this,it may be useful to recall that every sharpshooter who hits abulls-eye has missed many shots in the past. Finding the col-lection of methods that works for your organization may bepainful at times, but that is nothing compared to the resultswhich can be expected if it chooses to avoid the condition-ing process altogether.
Communication Communication is a more complicatedprocess than is generally assumed. There are four elements,all of which have to take place in order for communicationto happen. First, information is provided. For example, thestrategic framework is a piece of information; a project planis a piece of information. Second, there has to be under-standing. For example, the parts of the strategic frameworkare interrelated; the time to complete project tasks is an esti-mate. Third, what is seen and understood must be believed.For example, the values in the framework, if followed, will
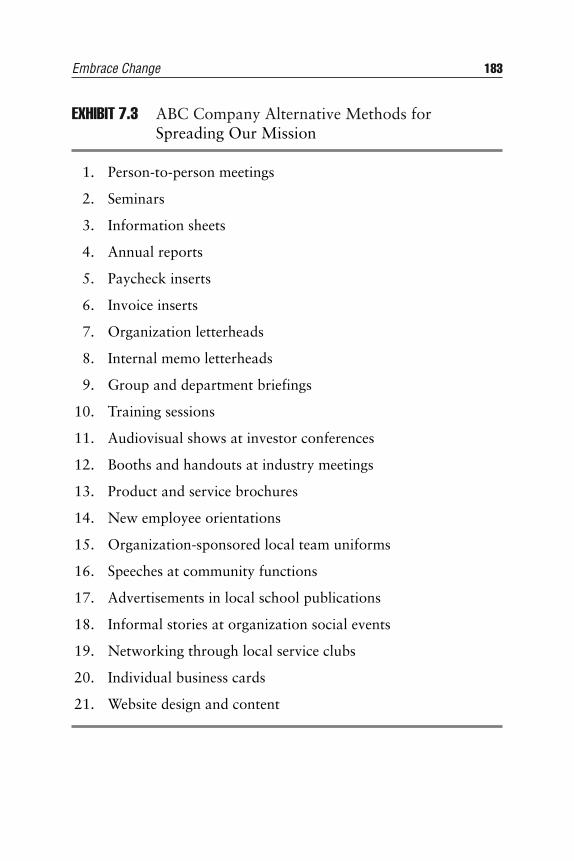
Embrace Change 183
EXHIBIT 7.3 ABC Company Alternative Methods forSpreading Our Mission
1. Person-to-person meetings
2. Seminars
3. Information sheets
4. Annual reports
5. Paycheck inserts
6. Invoice inserts
7. Organization letterheads
8. Internal memo letterheads
9. Group and department briefings
10. Training sessions
11. Audiovisual shows at investor conferences
12. Booths and handouts at industry meetings
13. Product and service brochures
14. New employee orientations
15. Organization-sponsored local team uniforms
16. Speeches at community functions
17. Advertisements in local school publications
18. Informal stories at organization social events
19. Networking through local service clubs
20. Individual business cards
21. Website design and content
184 EXECUTE FOR VALUE
assist in attaining the agreed-upon vision; the project tasks,if completed, will achieve the specified results. Finally, theremust be acceptance. For example, a willingness to followthe framework values in practice; agreement that projectcompletion is good for the organization.
Communication takes place in small groups where atti-tudes are formed as well as plans made. Using sound com-munication skills can keep the discussion on track and keepparticipation positive. Generally recognized communicationskills include:
! Using people’s names! Looking at people intently when they speak! Listening nonjudgmentally! Rewording questions to ensure understanding! Responding in a positive manner with a positive phrase! Saying so when you do not know the answer! Encouraging input from all participants! Avoiding arguments! Sidestepping foolish questions! Relating to participants in a kind and gentle way
Organizations also communicate symbolically throughlanguage, signs, ceremonies, and events. For example, hotelemployees are more likely to treat customers better if theythink of them as guests rather than boarders; a sign withthree lights out at the entrance to the best restaurant in thecity does not indicate a first class establishment; employeeaward banquets communicate what types of behavior theorganization truly encourages; and the location of theannual holiday party reveals how much the organizationvalues its employees.
Embrace Change 185
Empowerment The language used by superiors to empowertheir subordinates has a great deal to do with how effectivelythey are able to motivate them. Phrases such as, “I won’t, wecan’t, they don’t know how,” seldom instill the desire to learnor perform at one’s highest level. However, providing gentleinstruction and information couched in phrases such as, “Wecan, I will, they did it!” builds confidence and skills in allteam players.
One of the advantages of having a vision and values thatbecome part of the personality of the workforce is that itenables management to push decision making down to theappropriate level—the people in the field who are best ableto assess the current situation. Successful delegationinvolves an ability to communicate clearly and effectively. Italso requires a desire to provide adequate support and anability to obtain commitments. The following guidelinesmay be useful in this regard:
! Describe what needs to be done and when.! Explain the results anticipated and the measurements to
be used.! Point out possible hurdles to overcome.! Place the task within the context of the framework so its
relevance is clear.! Provide the resources required for successful completion,! Obtain a firm commitment to perform and an
acceptance of the job.! Grant the authority required, including interfaces with
other departments.
Another aid to empowering employees is a good story.By sharing an example of others who got a tough job done

186 EXECUTE FOR VALUE
or creatively solved a problem on their own, you aredemonstrating a positive approach and the realm of possi-bility open to the empowered.
Leadership It is at the top of the organization where the abil-ity to encounter, embrace, and exploit change is predeter-mined. This is where a positive attitude in responding tochange and dealing with risk sets the tone for the how theentire organization acts.
Leaders and how they spend their time are noticed. Donot expect an organization where the leader spends no timemonitoring the competition, checking up on project plancompletions, tracking the returns on investments, or tweak-ing the strategic framework to be very good at dealing withchange, restructuring the culture, maximizing organizationvalue, or planning for the future.
Effective leadership in response to change requires set-ting an example. When the organization needs to berearranged, people notice who gets promoted and for what.The leader who outwardly professes to believe in the valueof rewards based on merit, yet promotes staff membersbased on time in grade sends a mixed message. The one thatemployees receive is the one conveyed by what actually hap-pens, not what is spoken or written in a framework.
Employees also are sensitive to how the organization’smoney is spent in the process of change. A leader whoscrupulously reviews prospective investments for appropri-ate returns and makes expenditures commensurate with theorganization’s vision and values reinforces the strategicframework and sets an example for all his managers to fol-low. One who spends the organization’s money on low-

return pet projects and no-return perquisites also sets anexample. In this case, however, it is not one of maximizingthe organization’s value or the security and happiness of itsemployees.
Leaders who deal effectively with change generally havethe ability to:
! Listen carefully to learn the source and nature of change.! Anticipate the direction of change based on small shifts
in trends.! Probe as deeply as necessary to retrieve important
details.! Build solid, trusting relationships with outside advisors.! Maintain a flexible approach to achieving objectives.! Act in a courageous, calm, and decisive way when
required.
When these abilities are combined with a knack formotivating people, a commitment to framework vision andvalues, and the discipline to operate within the requiredreturn constraints, the leader is well on the way to enhanc-ing the organization’s value over the long term. That is,strategic leadership assists the organization in anticipatingand initiating changes that will ensure its future viability.
EXECUTE THE FRAMEWORK
This section provides a review of the execution process in thecontext of the strategic framework as a whole. The summarywhich follows it reviews all seven steps covered in this bookthat lead toward maximizing the organization’s value.
Execute the Framework 187

188 EXECUTE FOR VALUE
The best strategic document will be useless if it does notprove possible to implement the framework that has beenformulated. Whether it can be successfully executed verylargely depends on whether it proves possible to direct theorganization’s efforts toward the niches and long-term goalsthat define its vision. This requires more than simply initiat-ing a few selected measures. All activities, departments, anddecisions should be justified only if they build or sustain thechosen niches and supporting long-term goals.
The main aim of strategic framework design is to define afew central and key factors in the form of viable niches andorient all the organization’s resources toward their achieve-ment. It is then that the individual areas and divisions of theorganization will no longer operate in isolation, directed bythe considerations of their specific interests. Instead, they willbe concentrated on the organization’s chosen niches.
Once consensus is reached on the action plans, the exe-cution of the framework begins in earnest. The frameworkbecomes meaningful when it leads to concrete action in thereal world, where successful implementation is the result ofhaving small decisions made strategically every day. Well-conceived and -communicated execution ensures this resultis achieved. It consistently raises the organization’s level ofoperational efficiency and, hence, cash flow.
SUMMARY
The overall process discussed in this book covers sevensteps which deal with:
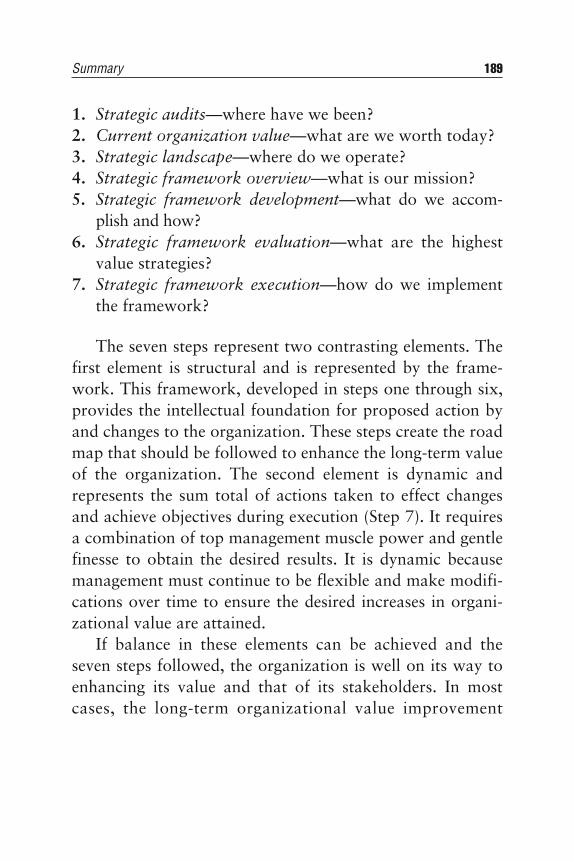
Summary 189
1. Strategic audits—where have we been?2. Current organization value—what are we worth today?3. Strategic landscape—where do we operate?4. Strategic framework overview—what is our mission?5. Strategic framework development—what do we accom-
plish and how?6. Strategic framework evaluation—what are the highest
value strategies?7. Strategic framework execution—how do we implement
the framework?
The seven steps represent two contrasting elements. Thefirst element is structural and is represented by the frame-work. This framework, developed in steps one through six,provides the intellectual foundation for proposed action byand changes to the organization. These steps create the roadmap that should be followed to enhance the long-term valueof the organization. The second element is dynamic andrepresents the sum total of actions taken to effect changesand achieve objectives during execution (Step 7). It requiresa combination of top management muscle power and gentlefinesse to obtain the desired results. It is dynamic becausemanagement must continue to be flexible and make modifi-cations over time to ensure the desired increases in organi-zational value are attained.
If balance in these elements can be achieved and theseven steps followed, the organization is well on its way toenhancing its value and that of its stakeholders. In mostcases, the long-term organizational value improvement

more than pays for the time and money spent in frameworkcreation, execution, monitoring, and modification.
ENDNOTES
1. For large, multidivisional organizations that have a portfolioof businesses, each with different risks, a separate cost ofcapital for each division is sometimes created to reflect thevariations in risk across the components of the portfolio.
190 EXECUTE FOR VALUE

Epilogue
We invite you to contact the author via e-mail at [email protected] with questions and/or sugges-
tions for the next edition. We also welcome stories of successand/or failure as well as modifications your organizationmade to the process and how they turned out. We remaindedicated to making organizations more fun in which towork, able to do a better job for all their stakeholders, andmore viable and profitable over the long term.
191


index
193
Assets, 1, 9–11, 12, 17, 29,32–34, 37
Beta, 40–41
Capital, cost of, 32, 40,42–44, 47–48, 144, 148,161–162, 175, 177
Capital, fixed, 31, 33, 38, 46,122, 146, 153
Capital, working, 28, 31, 34,39, 46, 122, 142, 144,146
Cash flowdiscounted, 30, 132, 162operating, 33, 35positive, 28, 48projected, 47, 122, 123
Debt, cost of, 40–42, 148Discount rate, 30, 32–33, 35,
40, 43–44, 47–48, 144,147–150
Earnings, 17, 29, 38, 42Efficiency, 17, 25, 38, 56, 75,
99, 104–105, 108, 188Equal Employment
OpportunityCommission, 60
Equity, cost of, 40, 148
Feedback, 101, 117, 138–139,160, 176
Forecasting, 54–55Formula, cash flow, 31Formula, cost of equity, 40
Government, 31, 40, 42,58–59, 63, 88
Growth rate, 10–13, 143
Implementation, 81, 95, 119,121, 128, 157, 161–162,164, 170–172, 178–180,188

Income statement, 36, 55, 89,144
Internal Revenue Service, 59Investment, 1, 18, 28–29,
31–33, 35, 38–39, 41,43, 46, 53, 57, 59, 104,120, 122, 143, 146, 154,161–162, 170, 175, 177,186
Management information sys-tems, 3, 92, 163–164, 173
Management team, 2, 48, 61,69–70, 91, 95, 102, 134,139, 148, 155, 160
Market research, 116Market share, 15–16, 53, 101,
105, 111Mission, 9, 77, 80–81, 83–88,
93–99, 106, 108–109,117, 159, 160, 170, 177,189
Niches, 77, 79, 88–89, 91–93,95, 99, 107, 109, 157,165, 169–170, 180, 188
Occupational Health andSafety Agency, 60
Opportunities, 5, 8–9, 18–19,25, 30, 38, 57, 110, 117,177
Planningaction, 159–160, 165, 167,
177
long-range, 53, 55meeting, 55, 79, 81, 83strategic, 53, 55, 56workshop, 159–160
Profit margin, 31, 37, 46, 90,120–121, 130, 134,136–138, 140, 146, 152
Profitability, 16, 101
Rate of return, 17, 40–41, 162Ratios, 16–19, 27, 38, 42Research, 1, 38, 41, 60, 63,
68–69, 91, 104, 111,116, 130, 135, 164, 180
Return on equity, 17–20, 29Return on investment, 29,
161–162, 177Revenue growth, 14, 142,
146, 150–152Revenues, 14, 31, 33, 36–37,
46, 73, 131–132,134–136, 140–142, 146,150–153
Risk, 17, 32, 40–41, 76, 87,89, 147–148, 161, 165,186
Securities and ExchangeCommission, 60
Stakeholders, 26–27, 30,57–65, 68–69, 84, 91,95, 142, 158, 164, 189,191
Stock market, 40–41Strategic audit, 1–2, 18, 20,
61, 189
194 INDEX
Strategic framework, 48, 54,70, 74–77, 80–81,88–89, 91, 95, 97–100,102, 109, 113, 117, 120,129–130, 132, 144, 150,154–155, 157–160, 165,170–173, 175, 177,179–182, 186–189
Strengths, 1, 2, 8–9, 89,91–92, 96
Successbarriers to, 73factors for, 69–70
Surveys, 63, 65–69, 82, 140
Taxes, 10, 17, 31, 33–34, 36,38, 41–42, 46, 146,149–150
Technology, 24, 105, 107,110, 135, 139, 163, 171,175
Threats, 8, 178, 180Time value of money, 32, 123,
147
Top management, 51, 76, 160,189
Valuation, 23, 30–31, 35, 37,80, 120, 125
Valuebook, 18–20, 29company, 24, 29drivers of, 35–39, 134ending, 33, 35, 44, 48,
149–150, 154market, 18–20, 42organization, 19, 37–38, 40,
43–44, 79, 85, 95, 120,129, 144, 147, 153,158, 162, 164, 177,184, 186–187, 189
present, 31, 43, 47–48, 124,162
relative, 18, 23shared, 106, 177, 181time, 32, 123, 147
Weaknesses, 8, 73, 116
Index 195