validity of the sat for predicting first-year college ... · sat ® for predicting first-year...
TRANSCRIPT

www.collegeboard.com
Research Report No. 2008-5
Validity of the SAT® for Predicting First-Year College Grade Point Average
Jennifer L. Kobrin, Brian F. Patterson, Emily J. Shaw, Krista D. Mattern, and Sandra M. Barbuti

The College Board, New York, 2008
Jennifer L. Kobrin, Brian F. Patterson, Emily J. Shaw, Krista D. Mattern, and Sandra M. Barbuti
Validity of the SAT® for Predicting
First-Year College Grade Point Average
College Board Research Report No. 2008-5
Jennifer L. Kobrin is a research scientist at the College Board.
Brian F. Patterson is an assistant research scientist at the College Board.
Emily J. Shaw is an assistant research scientist at the College Board.
Krista D. Mattern is an assistant research scientist at the College Board.
Sandra M. Barbuti is a data analyst at the College Board.
Researchers are encouraged to freely express their professional judgment. Therefore, points of view or opinions stated in College Board Reports do not necessarily represent official College Board position or policy.
The College Board: Connecting Students to College Success
The College Board is a not-for-profit membership association whose mission is to connect students to college success and opportunity. Founded in 1900, the association is composed of more than 5,400 schools, colleges, universities, and other educational organizations. Each year, the College Board serves seven million students and their parents, 23,000 high schools, and 3,500 colleges through major programs and services in college admissions, guidance, assessment, financial aid, enrollment, and teaching and learning. Among its best-known programs are the SAT®, the PSAT/NMSQT®, and the Advanced Placement Program® (AP®). The College Board is committed to the principles of excellence and equity, and that commitment is embodied in all of its programs, services, activities, and concerns.
For further information, visit www.collegeboard.com.
Additional copies of this report (item #080482568) may be obtained from College Board Publications, Box 886, New York, NY 10101-0886, 800 323-7155. The price is $15. Please include $4 for postage and handling.
© 2008 The College Board. All rights reserved. College Board, Advanced Placement Program, AP, connect to college success, SAT, and the acorn logo are registered trademarks of the College Board. ACES and Admitted Class Evaluation Service are trademarks owned by the College Board. PSAT/NMSQT is a registered trademark of the College Board and National Merit Scholarship Corporation. All other products and services may be trademarks of their respective owners. Visit the College Board on the Web: www.collegeboard.com.
Printed in the United States of America.
AcknowledgmentsThe authors wish to acknowledge many contributors to this research. Wayne Camara, Mary-Margaret Kerns, Andrew Wiley, Robert Majoros, and Helen Ng were crucial to planning and securing the resources necessary to undertake such a large-scale study. Stephen Frustino, Pooja Kosunam, and Mylene Remigio expertly prepared the database for analysis. Gerald Melican, Anne Harvey, and Kurt Geisinger provided valuable reviews and feedback. The College Board’s regional staff greatly assisted by recruiting institutions for participation. Finally, the College Board’s Research Advisory Committee and Psychometric Panel provided important guidance along the way.

Contents
Abstract . . . . . . . . . . . . . . . . . . . . . . . . . . . . . . . . . . . . . 1
Introduction . . . . . . . . . . . . . . . . . . . . . . . . . . . . . . . . . 1
Method . . . . . . . . . . . . . . . . . . . . . . . . . . . . . . . . . . . . . 2
Recruitment and Sample . . . . . . . . . . . . . . . . . . . . 2
Measures . . . . . . . . . . . . . . . . . . . . . . . . . . . . . . . . . 3
SAT® Scores . . . . . . . . . . . . . . . . . . . . . . . . . . . . . 3
SAT Questionnaire Responses . . . . . . . . . . . . . . 3
First-Year GPA (FYGPA) . . . . . . . . . . . . . . . . . . 3
Data Analyses . . . . . . . . . . . . . . . . . . . . . . . . . . . . . 3
Results . . . . . . . . . . . . . . . . . . . . . . . . . . . . . . . . . . . . . . 4
Descriptive Statistics . . . . . . . . . . . . . . . . . . . . . . . . 4
Correlations with FYGPA . . . . . . . . . . . . . . . . . . . . 5
Conclusions . . . . . . . . . . . . . . . . . . . . . . . . . . . . . . . . . . 6
Future Research . . . . . . . . . . . . . . . . . . . . . . . . . . . . . . 6
References . . . . . . . . . . . . . . . . . . . . . . . . . . . . . . . . . . . 7
Appendix A: Participating Institutions . . . . . . . . . . . 8
Appendix B: Characteristics of Participating Institutions . . . . . . . . . . . . . . . . . . . . . . . . . . . . . . . . 9
Tables 1. Percentage of Institutions by Key Variables:
Comparison of Population to Sample. . . . . . . . . 3
2. Demographic Characteristics of the Sample and 2006 SAT College-Bound Seniors Cohort . . . . . . . . . . . . . . . . . . . . . . . . . . . . 4
3. Descriptive Statistics on the Total Sample . . . . . 5
4. Raw (and Adjusted) Pooled Correlation Matrix of SAT and HSGPA. . . . . . . . . . . . . . . . . . 5
5. Unadjusted and Adjusted Correlations of Predictors with FYGPA . . . . . . . . . . . . . . . . . . 5
6. Raw and Adjusted Correlations of SAT and HSGPA with FYGPA by Institution Control, Selectivity, and Size . . . . . . . . . . . . . . . . 6

1
AbstractThis report presents the results of a large-scale national validity study of the SAT®. In March 2005, the College Board introduced a revised SAT, with an additional section in writing and minor changes in content to the verbal and mathematics sections. The first full cohort of students taking this test completed their first year of college in May/June 2007. This report documents the methods undertaken to recruit institutions to participate in the study; the procedures for gathering, cleaning, and aggregating data; and the statistical corrections and analyses applied to the data and the results of those analyses. The report concludes with a discussion of the results in light of prior SAT validity studies and a description of future SAT validity research studies. The results show that the changes made to the SAT did not substantially change how well the test predicts first-year college performance. Across all institutions, the recently added writing section is the most highly predictive of the three individual SAT sections. As expected, the best combination of predictors of first-year college grade point average (FYGPA) is high school grade point average (HSGPA) and SAT scores. The College Board continues to encourage institutions to use both measures when making admissions decisions.
IntroductionIn March 2005, the SAT was revised to incorporate a number of important changes. These changes were made to enhance the test’s alignment with current high school curricula and emphasize the skills needed for success in college (Lawrence, Rigol, Van Essen, and Jackson, 2003). The verbal section of the test was renamed the critical reading section (SAT-CR) to reflect changes in emphasis and format. Foremost, analogies were removed and were replaced by more questions on both short and long reading passages from a variety of fields, including science and the humanities. The mathematics section (SAT-M) was changed to include items from more advanced mathematics courses such as second-year algebra and to remove quantitative comparison items.1 The most notable change to the SAT was the addition of a writing section (SAT-W) that measures basic writing skills and includes multiple-choice questions on grammar and usage and a student-produced essay. The SAT is now 3 hours and 45 minutes in length, compared to the prior length of 3 hours.
The primary purpose of the SAT is to measure a student’s potential for academic success in college. As stated in the Standards for Educational and Psychological Testing (AERA/APA/NCME, 1999), the test maker is “responsible for furnishing relevant evidence and a rationale in support of the intended test use” (p. 11). The College Board is the test maker of the SAT. The Standards also state that “When substantial changes are made to a test, the test’s documentation should be amended, supplemented, or revised to keep information for users current and to provide useful additional information or cautions” (Standard 6.13, p. 70). This requirement certainly includes gathering new evidence of the test’s validity.
Validity evidence comes in many forms, and “a sound validity argument integrates various strands of evidence into a coherent account of the degree to which existing evidence and theory support the intended interpretation of test scores for specific uses” (AERA/APA/NCME, 1999, p. 17). Perhaps the most common and most critical form of validity evidence for large scale admissions tests such as the SAT is evidence of the test’s predictive validity, that is, the extent to which the SAT is a good predictor of college performance.
As the SAT is one of the most well-known and visible standardized tests in the world, studies on the predictive validity of the SAT have a very long history, going back to the 1950s. Fishman and Pasanella (1960) reviewed some of the earliest SAT predictive validity studies, which were conducted between 1950 to 1960. In their review of 147 studies including the SAT as a predictor, they reported multiple correlations of the SAT and high school record with first-year GPA (FYGPA) ranging from 0.34 to 0.82, with a median of 0.61.
Morgan (1989) analyzed the predictive validity of the SAT and high school grades from 1976 to 1985, using data from the College Board’s Validity Study Service (currently ACES™). He found that the correlation of SAT scores with FYGPA, corrected for restriction of range, declined from 0.51 to 0.47 over the period, but there was less change for private institutions, small institutions, and more selective institutions. More recently, Hezlett et al. (2001) performed a comprehensive meta-analysis of approximately 3,000 validity studies, with more than one million students, and found that the SAT is a valid predictor of FYGPA, with multiple correlations corrected for range restriction and attenuation ranging from 0.44 to 0.62.
When the SAT underwent major revision in 1995, Bridgeman, McCamley-Jenkins, and Ervin (2000) examined the impact of the revisions as well as the recentering of the score scale on the predictive validity of the test. Predictions of FYGPA for the entering class of
1 The quantitative comparison items presented test-takers with two quantities, one in Column A and one in Column B. Test-takers were asked to compare the two quantities and determine if the quantity in Column A is greater; the quantity in Column B is greater; the two quantities are equal; or if the relationship cannot be determined from the information given. See Lawrence, Rigol, Van Essen, and Jackson (2003) for an example of this item type.
2
1994 were compared with predictions for the class of 1995 who had taken the revised SAT. This study found that changes in the test content and recentering of the score scale had virtually no impact on the validity of the SAT for predicting FYGPA.
Shortly after the announcement that a writing section would be added to the SAT, the College Board commissioned a study to examine the predictive validity of a prototype version of the writing section and the incremental validity of the writing section over the verbal and mathematics sections. Norris, Oppler, Kuang, Day, and Adams (2006) administered a pilot version of the SAT writing section to 1,572 incoming freshmen at 13 colleges and universities. The authors compared students’ scores on the verbal and mathematics sections of the SAT taken prior to the pilot writing test in an operational setting in order to assess the incremental validity of the SAT writing section for the prediction of FYGPA and first-year English composition course grades. The results revealed that the weighted average correlation (the average correlation weighted by the number of students at each college/university) between SAT writing scores and FYGPA was 0.46, and the weighted average correlation between SAT writing scores and English composition course grades was 0.32, after correcting for range restriction. After controlling for high school grade point average (HSGPA) and SAT mathematics and verbal scores, the incremental validity of the prototype SAT writing section for predicting FYGPA was 0.01.
This report documents the results of the predictive validity of the newest version of the SAT. The first full cohort of students taking this test completed their first year of college in May/June 2007. The methods undertaken to recruit institutions to participate in the study; the procedures for gathering, cleaning, and aggregating data; and the statistical corrections and analyses applied to the data and the results of those analyses are each discussed in turn. The report concludes with a discussion of the results in light of prior SAT validity studies and a description of future SAT validity research studies.
MethodRecruitment and SampleColleges and universities across the United States were contacted in order to provide first-year performance data from the fall 2006 entering cohort of first-time
students. Preliminary recruitment efforts were targeted based on the 726 four-year institutions that received at least 200 SAT score reports in 2005. These 726 institutions served as the population, and available information on these schools from the College Board’s Annual Survey of Colleges2 on various characteristics including institutional control (public/private), region of the country, selectivity, and full-time undergraduate enrollment were used to form stratified target proportions on those characteristics for the target institutions to be recruited. Hundreds of institutions were contacted and informed about participating in the study via e-mail, phone calls, visits by College Board regional staff members, online newsletters, conference presentations, and exhibit booth informational materials. The desired sample size was between 75 and 100 institutions.
Participating institutions were offered a stipend for the work involved in creating the files containing students’ first-year performance data and retention to the second year. Participating institutions uploaded these files to the free and secure Admitted Class Evaluation Service™ (ACES) after the 2006-07 school year concluded.3 ACES allows institutions to design and receive unique admissions validity studies to—among other things—evaluate existing admissions practices. In addition to these reports, institutions also receive a copy of their originally submitted student data that have been matched to SAT and SAT Subject Test and other SAT Questionnaire data for use in their own research. The ACES system served as the data portal for the study, securely transferring data from the institution to the College Board for aggregate analysis. The data collected from each institution included students’ course work and grades, FYGPA, and whether or not the students returned for the second year. These data were matched to College Board databases that included SAT scores, self-reported HSGPA from the SAT Questionnaire, and other demographic information for these students. See Appendix A for a list of participating institutions.
Table 1 provides a comparison of the population described above to the actual sample of institutions that participated in this study. The sample is largely representative of the target population; however, there is some overrepresentation of New England and Mid-Atlantic institutions and underrepresentation of Southern institutions. As for selectivity, institutions admitting 50 to 75 percent of students are overrepresented, while institutions admitting over 75 percent of students are underrepresented in the sample. In terms of institution size, the sample is quite representative of the target population.
2 The Annual Survey of Colleges is a yearly survey of colleges, universities, vocational/technical, and graduate schools with the objective to obtain information that is important for potential students.3 Data files, including retention to the second year, were submitted separately for those institutions uploading ACES first-year performance data files prior to September/October 2007. All ACES data files were uploaded by participating institutions by November 2007.

3
Finally, there are more private institutions represented in the sample than in the target population. Appendix B lists the characteristics of each participating institution.
The original sample consisted of individual level data on 196,364 students from 110 colleges and universities from across the United States. Upon transmission from the ACES system to the College Board, all data were examined for inconsistencies and miscoding to ensure the integrity of the analyses described below. One check was for institutions with particularly high proportions of students with zero FYGPAs. This was incorporated into the data cleaning procedures to ensure that these FYGPAs were not miscoded as zero when they should have been coded as missing.4 Students in the sample that did not have a valid FYGPA from their institution were removed from the sample (n = 6,207, 3 percent). Similarly, students without scores on the revised SAT were not included (n = 31,151, 16 percent). Additional students were
removed from the sample because they did not indicate their HSGPA on the SAT Questionnaire (n = 7,690, 4 percent). The final sample included 151,316 students.
MeasuresSAT® Scores
Official SAT scores obtained from the 2006 College-Bound Seniors cohort database were used in the analyses. This database is composed of the students who participated in the SAT Program and reported plans to graduate from high school in 2006. The most recent scores from a single administration of the SAT were used in the analyses for students with multiple testing results. The SAT is composed of three sections, critical reading (SAT-CR), mathematics (SAT-M), and writing (SAT-W). The score scale range for each section is 200 to 800.
SAT Questionnaire ResponsesStudents’ self-reported gender, race/ethnicity, best language, and HSGPA5 were obtained from the SAT Questionnaire completed by students during registration for the SAT.
First-Year GPA (FYGPA)Each participating institution supplied FYGPA values for their 2006 first-time, first-year students. The range of FYGPA across institutions was 0 to 4.27.
Data AnalysesThe main analytic method used for this study was the comparison of the single and multiple correlations of predictors (SAT scores, HSGPA) with FYGPA. A correlation indicates the extent to which variables are linearly related and can range from –1.0 to 1.0 (Miles and Shevlin, 2001). A correlation of 1.0, for example, indicates a perfect positive linear relationship. A general rule of thumb for interpreting correlation coefficients is offered by Cohen (1988): a small correlation has an absolute value of approximately 0.1; a medium correlation has an absolute value of approximately 0.3; and a large correlation has an absolute value of approximately 0.5 or higher. A multiple correlation is the correlation of multiple independent or predictor variables with one dependent variable. The
4 There were 118 cases where an institution indicated that a student had a zero FYGPA when they in fact had at least one nonfailing letter grade in a course. It was suspected that these were cases where the school miscoded the student as having a zero FYGPA, so these FYGPAs were set equal to missing. 5 Although most colleges use actual student HSGPA from students’ transcripts when making admissions decisions, this study used students’ self-reported HSGPA on the SAT Questionnaire because actual HSGPA was not provided by many of the institutions participating in the study. The SAT Questionnaire asks students to indicate their cumulative grade point average for all academic subjects in high school, choosing one of the following options: A+ (97–100), A (93–96), A– (90–92), B+ (87–89), B (83–86), B– (80–82), C+ (77–79), C (73–76), C– (70–72), D+ (67–69), D (65–66), or E or F (Below 65). Much of the literature on the relationship between self-reported and actual HSGPA has found a strong positive correlation between the two—usually around 0.80 (Baird, 1976; Freeberg, 1988; Kuncel, Credé, and Thomas, 2005; Maxey and Ormsby, 1971). The College Board is in the process of conducting research on the correspondence of self-reported and school-supplied HSGPA in the SAT Validity Study, with a report scheduled to be released in September 2008.
Table 1 Percentage of Institutions by Key Variables: Comparison of Population to Sample
Variable Population Sample
Region of U.S.
Midwest 16% 15%
Mid-Atlantic 18% 24%
New England 13% 22%
South 25% 11%
Southwest 10% 11%
West 18% 17%
Selectivity
Admits under 50% 20% 24%
Admits 50 to 75% 44% 54%
Admits over 75% 36% 23%
Size
Small 18% 20%
Medium to Large 43% 39%
Large 20% 21%
Very Large 19% 20%
Control Public 57% 43%
Private 43% 57%
Note: Percentages may not sum to 100 due to rounding. With regard to institution size, small = 750 to 1,999 undergraduates; medium to large = 2,000 to 7,499 undergraduates; large = 7,500 to 14,999 undergraduates; and very large = 15,000 or more under-graduates.

4
increment in prediction (incremental validity) afforded by the SAT over HSGPA was indicated by the difference between the correlation of high school grades alone with FYGPA and the multiple correlation based on high school grades and the three separate sections of the SAT. Conversely, the incremental validity of HSGPA over SAT was indicated by the difference between the multiple correlation of SAT scores alone and the multiple correlation based on SAT scores and HSGPA.
One goal of this study is to present the correlations of the predictors with the criterion for the entire applicant pool. Presenting correlations for only enrolled students results in the underestimation of the true correlation due to a phenomenon called restriction of range. The range is considered restricted because admitted students tend to have a narrower range of scores than the larger applicant pool; that is, the applicant pool has a wider range of scores with more variation. Therefore, analyzing only admitted and enrolled students restricts the amount of variation in SAT scores, which thereby restricts any covariation the scores may have with other variables such as FYGPA.6 It is also true that the average score of the admitted class is higher than that of the applicant pool. While the raw (unadjusted) correlations accurately portray the relationships among the variables of interest for enrolled students, the raw correlations invariably underestimate the relationships that are found in the applicant pool, which is the group for which admissions decisions are made. To estimate the relationships among variables in the applicant pool, certain statistical adjustments or corrections are made. In this study, all correlations were corrected for range restriction using the Pearson-Lawley multivariate correction (Gulliksen, 1950; Lawley, 1943; Pearson, 1902). This approach requires the use of an unrestricted population covariance matrix on which to base the correction. In this study, the 2006 College-Bound Seniors cohort was used as the population.7
Just as academic requirements and admissions practices vary across institutions, the relationships between standardized test scores and FYGPA also vary across institutions. For that reason, it is not useful to compute one single correlation matrix for all institutions in the study. In order to address this problem and the restriction of range problem mentioned above, the following procedures were followed in this study: (1) compute separate correlations for each institution; (2) apply the multivariate correction for restriction of range to each set of correlations separately; and (3) compute a set of average correlations, weighted by the size of the institution-specific sample.
ResultsDescriptive StatisticsTable 2 displays the demographic characteristics of the sample compared to the 2006 College-Bound Seniors cohort, which is made up of all students taking the SAT who were scheduled to graduate high school in 2006. The final sample for the study consisted of 151,316 students, 54 percent of whom were female and 46 percent of whom were male. The racial/ethnic breakdown of the sample was 69 percent white/Caucasian, 9 percent Asian American, 7 percent African American, 7 percent Hispanic, 3 percent Other race/ethnicity, and less than 1 percent American Indian. About 4.5 percent of the students in the sample did not respond to the SAT Questionnaire item asking for their race/ethnicity. The racial/ethnic composition of the sample is similar to the 2006 College-Bound Seniors cohort, with a slight overrepresentation of white students and a slight underrepresentation of African American and Hispanic students in the sample. Nearly all of the students in the sample (93 percent) reported English as their best language, while approximately 5 percent reported both English and another language as their best language, slightly more than 1 percent reported another language as their best language, and another 1 percent did not
6 Even after applying the correction for restriction of range, there is some evidence that the corrected correlations may still be conservative (lower) estimates of the true correlation (Linn, Harnisch and Dunbar, 1981).7 Other possible statistical corrections that could have been employed are corrections for unreliability of the criterion or attenuation (see for example, Muchinsky, 1996; Pedhazur and Schmelkin, 1991, p. 114) and for shrinkage (see for example, Pedhazur and Schmelkin, 1991, p. 446). These corrections were not applied in this study but will be investigated in future studies.
Table 2 Demographic Characteristics of the Sample and 2006 SAT College-Bound Seniors Cohort
Variable Population Sample
GenderFemale 54% 54%
Male 46% 46%
Race/Ethnicity
American Indian 1% 1%
African American 10% 7%
Asian American 9% 9%
Hispanic 10% 7%
White 56% 69%
Other 4% 3%
No Response 9% 4%
Best Language
English 83% 93%
English and Another
Language8% 5%
Another Language
3% 1%
No Response 6% 1%
Note: Percentages may not sum to 100 due to rounding.
5
respond to this question. Students whose best language is English are overrepresented in this sample compared to the 2006 College-Bound Seniors cohort.
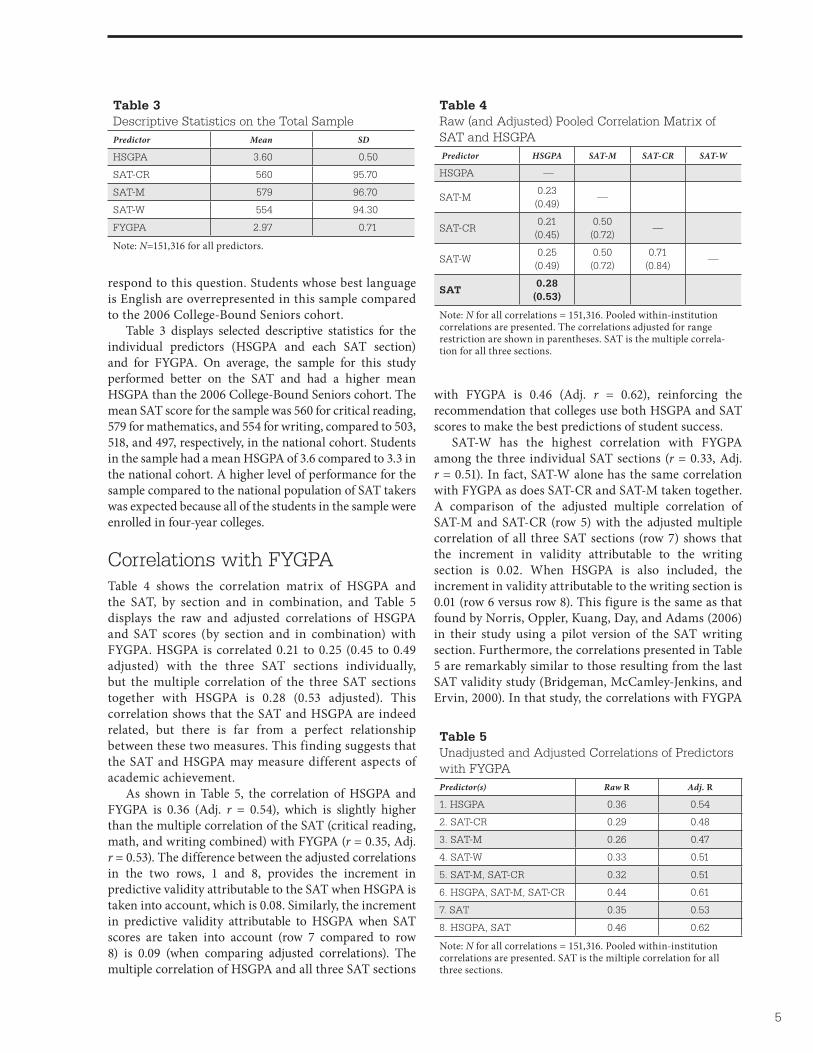
Table 3 displays selected descriptive statistics for the individual predictors (HSGPA and each SAT section) and for FYGPA. On average, the sample for this study performed better on the SAT and had a higher mean HSGPA than the 2006 College-Bound Seniors cohort. The mean SAT score for the sample was 560 for critical reading, 579 for mathematics, and 554 for writing, compared to 503, 518, and 497, respectively, in the national cohort. Students in the sample had a mean HSGPA of 3.6 compared to 3.3 in the national cohort. A higher level of performance for the sample compared to the national population of SAT takers was expected because all of the students in the sample were enrolled in four-year colleges.
Correlations with FYGPATable 4 shows the correlation matrix of HSGPA and the SAT, by section and in combination, and Table 5 displays the raw and adjusted correlations of HSGPA and SAT scores (by section and in combination) with FYGPA. HSGPA is correlated 0.21 to 0.25 (0.45 to 0.49 adjusted) with the three SAT sections individually, but the multiple correlation of the three SAT sections together with HSGPA is 0.28 (0.53 adjusted). This correlation shows that the SAT and HSGPA are indeed related, but there is far from a perfect relationship between these two measures. This finding suggests that the SAT and HSGPA may measure different aspects of academic achievement.
As shown in Table 5, the correlation of HSGPA and FYGPA is 0.36 (Adj. r = 0.54), which is slightly higher than the multiple correlation of the SAT (critical reading, math, and writing combined) with FYGPA (r = 0.35, Adj. r = 0.53). The difference between the adjusted correlations in the two rows, 1 and 8, provides the increment in predictive validity attributable to the SAT when HSGPA is taken into account, which is 0.08. Similarly, the increment in predictive validity attributable to HSGPA when SAT scores are taken into account (row 7 compared to row 8) is 0.09 (when comparing adjusted correlations). The multiple correlation of HSGPA and all three SAT sections
with FYGPA is 0.46 (Adj. r = 0.62), reinforcing the recommendation that colleges use both HSGPA and SAT scores to make the best predictions of student success.
SAT-W has the highest correlation with FYGPA among the three individual SAT sections (r = 0.33, Adj. r = 0.51). In fact, SAT-W alone has the same correlation with FYGPA as does SAT-CR and SAT-M taken together. A comparison of the adjusted multiple correlation of SAT-M and SAT-CR (row 5) with the adjusted multiple correlation of all three SAT sections (row 7) shows that the increment in validity attributable to the writing section is 0.02. When HSGPA is also included, the increment in validity attributable to the writing section is 0.01 (row 6 versus row 8). This figure is the same as that found by Norris, Oppler, Kuang, Day, and Adams (2006) in their study using a pilot version of the SAT writing section. Furthermore, the correlations presented in Table 5 are remarkably similar to those resulting from the last SAT validity study (Bridgeman, McCamley-Jenkins, and Ervin, 2000). In that study, the correlations with FYGPA
Table 3 Descriptive Statistics on the Total SamplePredictor Mean SD
HSGPA 3.60 0.50
SAT-CR 560 95.70
SAT-M 579 96.70
SAT-W 554 94.30
FYGPA 2.97 0.71
Note: N=151,316 for all predictors.
Table 4 Raw (and Adjusted) Pooled Correlation Matrix of SAT and HSGPA Predictor HSGPA SAT-M SAT-CR SAT-W
HSGPA —
SAT-M 0.23
(0.49)—
SAT-CR0.21
(0.45)0.50 (0.72)
—
SAT-W0.25
(0.49)0.50 (0.72)
0.71 (0.84)
—
SAT0.28
(0.53)
Note: N for all correlations = 151,316. Pooled within-institution correlations are presented. The correlations adjusted for range restriction are shown in parentheses. SAT is the multiple correla-tion for all three sections.
Table 5 Unadjusted and Adjusted Correlations of Predictors with FYGPAPredictor(s) Raw R Adj. R
1. HSGPA 0.36 0.54
2. SAT-CR 0.29 0.48
3. SAT-M 0.26 0.47
4. SAT-W 0.33 0.51
5. SAT-M, SAT-CR 0.32 0.51
6. HSGPA, SAT-M, SAT-CR 0.44 0.61
7. SAT 0.35 0.53
8. HSGPA, SAT 0.46 0.62
Note: N for all correlations = 151,316. Pooled within-institution correlations are presented. SAT is the miltiple correlation for all three sections.

6
(corrected for range restriction) were 0.47 for the verbal section (SAT-V), 0.48 for SAT-M, 0.54 for HSGPA, 0.52 for the combination of SAT-V and SAT-M, and 0.61 for the combination of HSGPA, SAT-V, and SAT-M.
Table 6 shows the adjusted correlations of SAT, HSGPA, and their combination with FYGPA by institution control, selectivity, and size. These correlations should be compared with caution because some institution types were over- or underrepresented in the study sample (refer back to Table 1 for a comparison of the study sample to the target population). The multiple correlation of the SAT with FYGPA is slightly higher in private institutions compared to public institutions; it is higher in more selective institutions (those admitting less than half of their applicants) compared to those that admit at least half of their applicants; and it is also higher in small institutions compared to very large institutions (and is slightly higher in small institutions compared to medium and large institutions). A similar pattern emerges when disaggregating the correlations of HSGPA with FYGPA by institutional characteristics, albeit the differences tend to be smaller.
ConclusionsThis report documents the results of the SAT validity study, based on a large sample of students entering 110 four-year colleges and universities in fall 2006 and completing their first year of college in May/June 2007. The results show that the changes made to the SAT did not substantially change how predictive the test is of first-year college performance. Across all institutions, the recently added writing section is the most highly predictive of the three individual SAT sections. As expected, the best combination of predictors of FYGPA is HSGPA and SAT scores, and the College Board continues
to encourage institutions to use both measures when making admissions decisions.
Future ResearchThe preceding study is one of the first of a long series of projects the College Board is engaged in and will continue to undertake to examine the validity of the SAT. A companion report on the differential validity of the SAT compares the predictive validity and the predictive accuracy of the revised SAT for gender, racial/ethnic, and best language subgroups. Prior research has found that the SAT underpredicts females’ college performance and overpredicts minority students’ college performance. The differential validity study replicates previous analyses to determine whether the revisions to the SAT have affected the overprediction/underprediction found on the prior version of the SAT. An SAT placement validity study, to be released in December 2008, will examine the placement validity of the SAT critical reading, mathematics, and writing sections for success in certain first-year courses. The results will be useful to the many institutions that are interested in using the SAT to place incoming students into first-year courses.
The list of future studies to be completed in 2009 also includes studies of how well the SAT and HSGPA predict retention to the second year of college; the relationship of high school course-taking and academic rigor with the SAT and with college performance and retention; the relationship of student self-efficacy to college performance and retention; additional analyses of the predictive validity of the SAT implementing statistical adjustments for course difficulty and unreliability of the criterion (FYGPA); and an exploration of the variability in the predictive validity of the SAT and HSGPA across institutions using hierarchical approaches, among many other studies.
Table 6 Raw and Adjusted Correlations of SAT and HSGPA with FYGPA by Institution Control, Selectivity, and Size
n SAT HSGPA SAT + HSGPA
ControlPrivate 45,786 0.39 (0.57) 0.37 (0.55) 0.48 (0.65)
Public 105,530 0.34 (0.52) 0.36 (0.53) 0.45 (0.61)
Selectivity
Under 50% 27,272 0.39 (0.58) 0.36 (0.55) 0.47 (0.65)
50–75% 84,433 0.34 (0.53) 0.35 (0.54) 0.44 (0.62)
Over 75% 39,611 0.36 (0.51) 0.40 (0.54) 0.47 (0.60)
Size
Small 6,471 0.42 (0.60) 0.41 (0.57) 0.52 (0.67)
Medium to Large 30,333 0.36 (0.55) 0.38 (0.55) 0.47 (0.63)
Large 40,861 0.34 (0.53) 0.37 (0.55) 0.45 (0.62)
Very Large 73,651 0.36 (0.53) 0.35 (0.53) 0.45 (0.61)
Note: Pooled within-institution correlations are presented. The adjusted correlations (in parentheses) are corrected for restriction of range. With regard to institution size, small = 750 to 1,999 undergraduates; medium to large = 2,000 to 7,499 undergraduates; large = 7,500 to 14,999 undergraduates; and very large = 15,000 or more undergraduates. SAT is the multiple correlation for all three sections.

7
ReferencesAmerican Educational Research Association/American
Psychological Association/National Council on Measurement in Education (1999). Standards for educational and psychological testing.
Baird, L.L. (1976). Using self-reports to predict student performance (Research Monograph No. 7). New York: The College Board.
Bridgeman, B., McCamley-Jenkins, L., & Ervin, N. (2000). Predictions of freshman grade-point average from the revised and recentered SAT I: Reasoning Test. (College Board Research Report No. 2000-1). New York: The College Board.
Cohen, J. (1988). Statistical power analysis for the behavioral sciences (2d ed.). Hillsdale, NJ: Lawrence Erlbaum Associates.
Courville, T., & Thompson, B. (2001). Use of structure coefficients in published multiple regression articles: B is not enough. Educational and Psychological Measurement, 6, 229–48.
Fishman, J.A., & Pasanella, A.K. (1960). College admission selection studies. Review of Educational Research, 30(4), 298–310.
Freeberg, N.E. (1988). Analysis of the revised student descriptive questionnaire, phase I (College Board Report No. 88-5). New York: The College Board.
Gulliksen, H. (1950). Theory of mental tests. New York: John Wiley and Sons.
Hezlett, S.A., Kuncel, N., Vey, M.A., Ahart, A.M., Ones, D.S., Campbell, J.P., & Camara, W.J. (2001, April). The effectiveness of the SAT in predicting success early and late in college: A comprehensive meta-analysis. Paper presented at the annual meeting of the National Council on Measurement in Education, Seattle, WA.
Kuncel, N.R., Credé, M., & Thomas, L.L. (2005). The validity of self-reported grade point average, class ranks, and test scores: A meta-analysis and review of the literature. Review of Educational Research, 75, 63–82.
Lawley, D.N. (1943). A Note on Karl Pearson’s Selection Formulae. Proceedings of the Royal Society of Edinburgh, 62(1), 28–30.
Lawrence, I.M., Rigol, G.W., Van Essen, T., & Jackson, C.A. (2003). A Historical Perspective on the Content of the SAT. (College Board Research Report No. 2003-3). New York: The College Board.
Linn, R.L., Harnisch, D.L., & Dunbar, S.B. (1981). Corrections for Range Restriction: An Empirical Investigation of Conditions Resulting in Conservative Corrections. Journal of Applied Psychology, 66(6), 655–63.
Maxey, E.J., & Ormsby, V.J. (1971). The accuracy of self-report information collected on the ACT Test Battery: High school grades and items of nonacademic achievement (ACT Research Report No. 45). Iowa City: The American College Testing Program.
Miles, J., & Shevlin, M. (2001). Applying regression and correlation: A guide for students and researchers. London: SAGE.
Morgan, R. (1989). Analysis of the Predictive Validity of the SAT and High School Grades from 1976 to 1985. (College Board Research Report No. 89-7). New York: The College Board.
Muchinsky, P.M. (1996). The correction for attenuation. Educational and Psychological Measurement, 56(1), 63–75.
Norris, D., Oppler, S., Kuang, D., Day, R., & Adams, K. (2006). The College Board SAT writing validation study: An assessment of predictive and incremental validity. (College Board Research Report No. 2006-2). New York: The College Board.
Pearson, K. (1902). Philosophical Transactions of the Royal Society of London, Series A, Containing Papers of a Mathematical or Physical Character, pp. 198, 235–99.
Pedhazur, E.J., & Schmelkin, L.P. (1991). Measurement design and analysis: An integrated approach. Hillsdale, NJ: Lawrence Erlbaum Associates.

8
Appendix A: Participating InstitutionsInstitution NameAlbany College of PharmacyAustin College Baldwin-Wallace College Boston College Boston University Brandeis University California Lutheran University California University of PennsylvaniaChapman University Claremont McKenna College Clemson University Coastal Carolina UniversityColby CollegeDrew University Eastern Connecticut State UniversityFlorida Southern CollegeFordham University Framingham State CollegeGeorgia Institute of TechnologyIllinois Institute of TechnologyIndiana Wesleyan University Kenyon College Kutztown University Lafayette College Lasell College Lesley University Loyola Marymount University Lycoming College Manchester College Meredith College Miami University: Oxford CampusMidwestern State University Millersville University of PennsylvaniaMontclair State University Northern Arizona UniversityNorthwestern UniversityPurdue University Rhode Island College Saint Peter’s CollegeSalve Regina UniversitySamford University Schreiner University Seattle University Sewanee: The University of the SouthSiena College Smith College Southern Connecticut State UniversitySpelman College St. Anselm CollegeSt. Michael’s CollegeSyracuse UniversityTemple University Texas A&M University, College StationTexas A&M University, CommerceTexas State University: San Marcos
Institution NameTexas Tech University The Ohio State UniversityThe State University of New York at BuffaloThe University of Texas at AustinThe University of Texas at San AntonioUnited States Coast Guard Academy* University of Cincinnati University of Denver University of Georgia University of Hawaii at ManoaUniversity of Illinois at Urbana-ChampaignUniversity of Mary Washington University of Massachusetts AmherstUniversity of Massachusetts DartmouthUniversity of New Haven University of New Mexico University of North Texas University of Oregon University of Pittsburgh University of Portland University of Rhode Island University of Southern California University of Southern Indiana University of the PacificUniversity of Washington Valdosta State University Vanderbilt University Villanova University Washington State University, PullmanWashington State University, VancouverWest Chester University of PennsylvaniaWest Virginia University Western Washington University Westmont College Wheaton College Whitman College Wilkes University Williams College Yale University Anonymous AAnonymous BAnonymous CAnonymous DAnonymous EAnonymous FAnonymous GAnonymous HAnonymous IAnonymous JAnonymous KAnonymous LAnonymous MAnonymous NAnonymous OAnonymous P
* Did not accept the stipend given for participation in this study.

9
Appendix B: Characteristics of Participating InstitutionsRegion of U.S. Control Applicants Admitted Undergraduate Enrollment SizeMidwest Private 50 to 75% Large: 7,500 to 14,999 undergraduatesMidwest Private 50 to 75% Medium to Large: 2,000 to 7,499 undergraduatesMidwest Private 50 to 75% Medium to Large: 2,000 to 7,499 undergraduatesMidwest Private 50 to 75% Medium to Large: 2,000 to 7,499 undergraduatesMidwest Private 50 to 75% Small: 750 to 1,999 undergraduatesMidwest Private over 75% Medium to Large: 2,000 to 7,499 undergraduatesMidwest Private over 75% Medium to Large: 2,000 to 7,499 undergraduatesMidwest Private under 50% Large: 7,500 to 14,999 undergraduatesMidwest Private under 50% Large: 7,500 to 14,999 undergraduatesMidwest Private under 50% Small: 750 to 1,999 undergraduatesMidwest Public 50 to 75% Very Large: 15,000 or more undergraduatesMidwest Public 50 to 75% Very Large: 15,000 or more undergraduatesMidwest Public over 75% Large: 7,500 to 14,999 undergraduatesMidwest Public over 75% Large: 7,500 to 14,999 undergraduatesMidwest Public over 75% Very Large: 15,000 or more undergraduatesMidwest Public over 75% Very Large: 15,000 or more undergraduatesMidwest Public over 75% Very Large: 15,000 or more undergraduatesMid-Atlantic Private 50 to 75% Large: 7,500 to 14,999 undergraduatesMid-Atlantic Private 50 to 75% Medium to Large: 2,000 to 7,499 undergraduatesMid-Atlantic Private 50 to 75% Medium to Large: 2,000 to 7,499 undergraduatesMid-Atlantic Private 50 to 75% Medium to Large: 2,000 to 7,499 undergraduatesMid-Atlantic Private 50 to 75% Medium to Large: 2,000 to 7,499 undergraduatesMid-Atlantic Private 50 to 75% Small: 750 to 1,999 undergraduatesMid-Atlantic Private over 75% Medium to Large: 2,000 to 7,499 undergraduatesMid-Atlantic Private over 75% Medium to Large: 2,000 to 7,499 undergraduatesMid-Atlantic Private over 75% Small: 750 to 1,999 undergraduatesMid-Atlantic Private over 75% Small: 750 to 1,999 undergraduatesMid-Atlantic Private over 75% Small: 750 to 1,999 undergraduatesMid-Atlantic Private under 50% Large: 7,500 to 14,999 undergraduatesMid-Atlantic Private under 50% Medium to Large: 2,000 to 7,499 undergraduatesMid-Atlantic Private under 50% Medium to Large: 2,000 to 7,499 undergraduatesMid-Atlantic Private under 50% Medium to Large: 2,000 to 7,499 undergraduatesMid-Atlantic Private under 50% Medium to Large: 2,000 to 7,499 undergraduatesMid-Atlantic Public 50 to 75% Large: 7,500 to 14,999 undergraduatesMid-Atlantic Public 50 to 75% Large: 7,500 to 14,999 undergraduatesMid-Atlantic Public 50 to 75% Large: 7,500 to 14,999 undergraduatesMid-Atlantic Public 50 to 75% Medium to Large: 2,000 to 7,499 undergraduatesMid-Atlantic Public 50 to 75% Very Large: 15,000 or more undergraduatesMid-Atlantic Public 50 to 75% Very Large: 15,000 or more undergraduatesMid-Atlantic Public over 75% Large: 7,500 to 14,999 undergraduatesMid-Atlantic Public over 75% Medium to Large: 2,000 to 7,499 undergraduatesMid-Atlantic Public under 50% Large: 7,500 to 14,999 undergraduatesMid-Atlantic Public under 50% Very Large: 15,000 or more undergraduatesNew England Private 50 to 75% Medium to Large: 2,000 to 7,499 undergraduatesNew England Private 50 to 75% Medium to Large: 2,000 to 7,499 undergraduatesNew England Private 50 to 75% Medium to Large: 2,000 to 7,499 undergraduatesNew England Private 50 to 75% Small: 750 to 1,999 undergraduatesNew England Private 50 to 75% Small: 750 to 1,999 undergraduatesNew England Private 50 to 75% Small: 750 to 1,999 undergraduatesNew England Private 50 to 75% Very Large: 15,000 or more undergraduatesNew England Private under 50% Large: 7,500 to 14,999 undergraduatesNew England Private under 50% Medium to Large: 2,000 to 7,499 undergraduatesNew England Private under 50% Medium to Large: 2,000 to 7,499 undergraduates
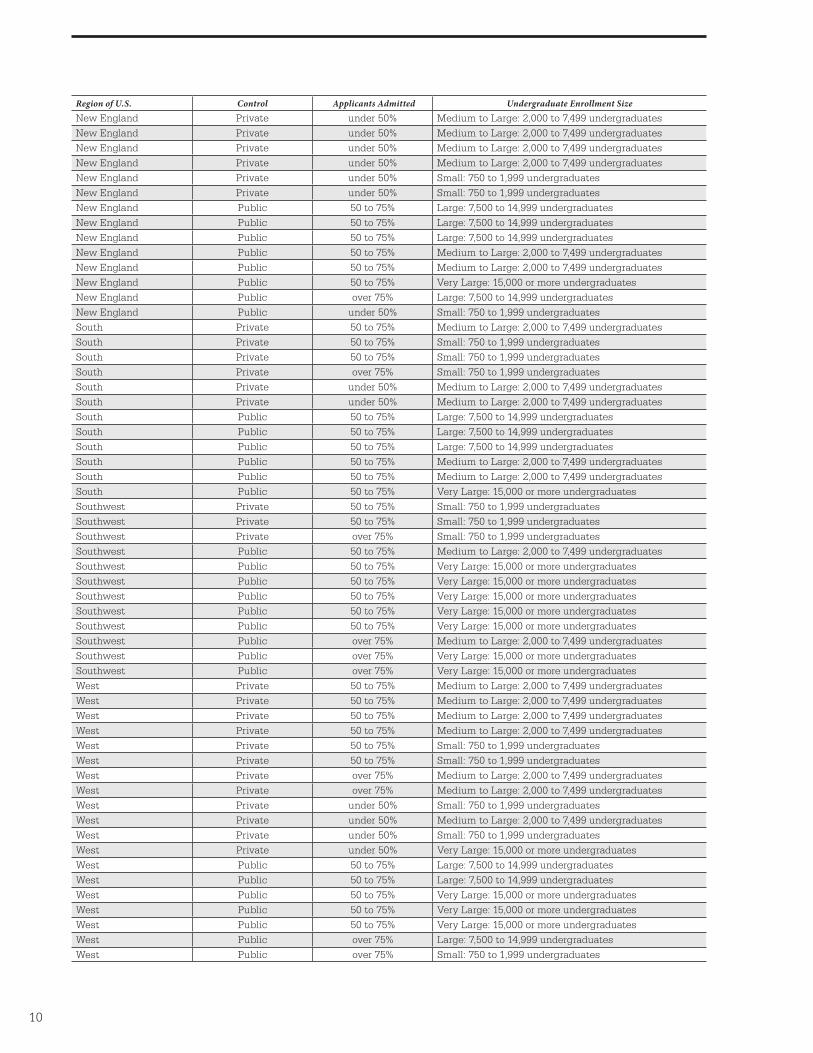
10
Region of U.S. Control Applicants Admitted Undergraduate Enrollment SizeNew England Private under 50% Medium to Large: 2,000 to 7,499 undergraduatesNew England Private under 50% Medium to Large: 2,000 to 7,499 undergraduatesNew England Private under 50% Medium to Large: 2,000 to 7,499 undergraduatesNew England Private under 50% Medium to Large: 2,000 to 7,499 undergraduatesNew England Private under 50% Small: 750 to 1,999 undergraduatesNew England Private under 50% Small: 750 to 1,999 undergraduatesNew England Public 50 to 75% Large: 7,500 to 14,999 undergraduatesNew England Public 50 to 75% Large: 7,500 to 14,999 undergraduatesNew England Public 50 to 75% Large: 7,500 to 14,999 undergraduatesNew England Public 50 to 75% Medium to Large: 2,000 to 7,499 undergraduatesNew England Public 50 to 75% Medium to Large: 2,000 to 7,499 undergraduatesNew England Public 50 to 75% Very Large: 15,000 or more undergraduatesNew England Public over 75% Large: 7,500 to 14,999 undergraduatesNew England Public under 50% Small: 750 to 1,999 undergraduatesSouth Private 50 to 75% Medium to Large: 2,000 to 7,499 undergraduatesSouth Private 50 to 75% Small: 750 to 1,999 undergraduatesSouth Private 50 to 75% Small: 750 to 1,999 undergraduatesSouth Private over 75% Small: 750 to 1,999 undergraduatesSouth Private under 50% Medium to Large: 2,000 to 7,499 undergraduatesSouth Private under 50% Medium to Large: 2,000 to 7,499 undergraduatesSouth Public 50 to 75% Large: 7,500 to 14,999 undergraduatesSouth Public 50 to 75% Large: 7,500 to 14,999 undergraduatesSouth Public 50 to 75% Large: 7,500 to 14,999 undergraduatesSouth Public 50 to 75% Medium to Large: 2,000 to 7,499 undergraduatesSouth Public 50 to 75% Medium to Large: 2,000 to 7,499 undergraduatesSouth Public 50 to 75% Very Large: 15,000 or more undergraduatesSouthwest Private 50 to 75% Small: 750 to 1,999 undergraduatesSouthwest Private 50 to 75% Small: 750 to 1,999 undergraduatesSouthwest Private over 75% Small: 750 to 1,999 undergraduatesSouthwest Public 50 to 75% Medium to Large: 2,000 to 7,499 undergraduatesSouthwest Public 50 to 75% Very Large: 15,000 or more undergraduatesSouthwest Public 50 to 75% Very Large: 15,000 or more undergraduatesSouthwest Public 50 to 75% Very Large: 15,000 or more undergraduatesSouthwest Public 50 to 75% Very Large: 15,000 or more undergraduatesSouthwest Public 50 to 75% Very Large: 15,000 or more undergraduatesSouthwest Public over 75% Medium to Large: 2,000 to 7,499 undergraduatesSouthwest Public over 75% Very Large: 15,000 or more undergraduatesSouthwest Public over 75% Very Large: 15,000 or more undergraduatesWest Private 50 to 75% Medium to Large: 2,000 to 7,499 undergraduatesWest Private 50 to 75% Medium to Large: 2,000 to 7,499 undergraduatesWest Private 50 to 75% Medium to Large: 2,000 to 7,499 undergraduatesWest Private 50 to 75% Medium to Large: 2,000 to 7,499 undergraduatesWest Private 50 to 75% Small: 750 to 1,999 undergraduatesWest Private 50 to 75% Small: 750 to 1,999 undergraduatesWest Private over 75% Medium to Large: 2,000 to 7,499 undergraduatesWest Private over 75% Medium to Large: 2,000 to 7,499 undergraduatesWest Private under 50% Small: 750 to 1,999 undergraduatesWest Private under 50% Medium to Large: 2,000 to 7,499 undergraduatesWest Private under 50% Small: 750 to 1,999 undergraduatesWest Private under 50% Very Large: 15,000 or more undergraduatesWest Public 50 to 75% Large: 7,500 to 14,999 undergraduatesWest Public 50 to 75% Large: 7,500 to 14,999 undergraduatesWest Public 50 to 75% Very Large: 15,000 or more undergraduatesWest Public 50 to 75% Very Large: 15,000 or more undergraduatesWest Public 50 to 75% Very Large: 15,000 or more undergraduatesWest Public over 75% Large: 7,500 to 14,999 undergraduatesWest Public over 75% Small: 750 to 1,999 undergraduates

www.collegeboard.com 080482568