validity as a measure of data quality in internet of
TRANSCRIPT
Validity as a Measure of Data Quality in Internet ofThings SystemsRishabh Deo Pandey ( [email protected] )
Birla Institute of TechnologyItu Snigdh
Birla Institute of Technology
Research Article
Keywords: Internet of Things (IoT), Validity, Data Freshness, Completeness, Availability, Usability.
Posted Date: November 19th, 2021
DOI: https://doi.org/10.21203/rs.3.rs-811543/v1
License: This work is licensed under a Creative Commons Attribution 4.0 International License. Read Full License

Validity as a measure of Data Quality in Internet of Things Systems
Rishabh Deo Pandey
Dept of CSE, BIT Mesra
Itu Snigdh
Dept. of CSE, BIT Mesra
Abstract
Data quality became significant with the emergence of data warehouse systems. While accuracy
is intrinsic data quality, validity of data presents a wider perspective, which is more
representational and contextual in nature. Through our article we present a different perspective
in data collection and collation. We focus on faults experienced in data sets and present validity
as a function of allied parameters such as completeness, usability, availability and timeliness for
determining the data quality. We also analyze the applicability of these metrics and apply
modifications to make it conform to IoT applications. Another major focus of this article is to
verify these metrics on aggregated data set instead of separate data values. This work focuses on
using the different validation parameters for determining the quality of data generated in a
pervasive environment. Analysis approach presented is simple and can be employed to test the
validity of collected data, isolate faults in the data set and also measure the suitability of data
before applying algorithms for analysis.
Keywords
Internet of Things (IoT), Validity, Data Freshness, Completeness, Availability, Usability.
1. Introduction
Internet of Things (IoT) is a network of physical devices or things embedded with electronic
devices such as sensors, actuators, software and an interconnecting network which enables it to
collect and manage data without involving human interaction [1]. Common to all the mentioned
applications, the IoT application comprises of four major segments [2]. The sensor and actuators
with the communication capabilities are the integral part and mostly hardware oriented. The
software segment consists of the user interface modules, connectivity and adaptability of the
apps across different machine capabilities and interfaces [3]. IoT combines various technologies
into a single intelligent unit. This intelligence in IoT networks is attributed to the amount and
quality of data. All IoT devices generate varied amounts of data at varied levels of scalability and
time dependence like a point of sales terminal, distributed sensors or industrial machinery [4].
These data range from being mission critical to custom business logic. Also, with the
proliferation of organizations in to the IoT domains and its enablement through hardware,
software services and connectivity, the complexity of the applications have increased. In addition

to handling increased software complexity, IoT performance also depends on its responsiveness
and real time digital services. Since an important part of an IoT application is the software in
addition to its hardware, evaluation of the performance of an IoT application becomes necessary
[5]. Software metrics therefore need to be developed for IoT applications, in order to monitor
IoT performance for fulfilling the following requirements:
• Able to monitor devices that run on different processor architecture.
• Able to monitor IoT application written in different programming languages.
• Overhead in monitoring should be minimal.
• Able to receive data generated
It is recognized that Software metrics is a measure of characteristics of the software that are
quantifiable or countable. Also, the main objective of any software metric is to analyze the
product or process; to determine its quality and suggest improvements as well as predict when
the software development process is over [6].
In this paper, we try to determine data quality in an IoT application on the basis of different
metrics namely, validity, data freshness, completeness, usability and availability. These metrics
have been studied using two separate data sets. The major focus of this paper is to verify these
metrics on aggregated data set instead of separate data values. In order to determine performance
of a software model, we have predefined ISO-9126 Software Quality Characteristics which is
used for evaluating the software model [7].
1.1.Role of data and its quality in IoT applications
Analysis of IoT data can be helpful in many ways such as optimizing operations, efficient use of
energy and resources. Combining IoT with data analytics becomes effective in real time
applications like healthcare, telematics, smart cities and the like.[8]. We have a large number of
real time applications available in the market which are fully dependent on the data for its
functioning. Therefore, if the data quality degrades it will have a negative impact on the
customer relationship. To implement any IoT based application, large number of sensors are
deployed which further generate huge amount of data. This data generally falls under the
category of big data since it justifies the properties of big data namely volume, velocity and
variety. Data obtained from the sensors needs to be validated before using it for any decision-
making process [9]. Also, IoT application domains like utilities, mobile and enterprises require
continuous monitoring of the data as any type of fault can lead to wrong analysis, thereby
leading to decrease in trust by the customer. Apart from affecting the reasoning capability, it also
leads to wastage of energy since in case of wireless sensor nodes, every bit of transmission
consumes energy. [10] In addition, IoT based monitoring applications require alerting
capabilities that are sophisticated and customizable considering the most decentralized network

of devices or the inherent excessive dynamics of the network and devices. The volume of
telemetry data that is collected from IoT devices are impacted by the intermittent connectivity
issues [11]. Therefore, the traditional alerting tools face challenges which can be overcome to an
extent by measuring the quality of the data collected. We are also aware that every IoT
application is unique with a said functionality and rarely uses off-the-shelf products [12].
Therefore, a generalized solution “one-size-fits-all” is not applicable.
2. Methodology for analysis of Metrics
We consider “Temperature” as a common attribute that forms a part of most applications
varying from personalized healthcare, to environment monitoring. The data quality
dimensions related to parameter “temperature” can be illustrated as figure 1.
Figure 1: Data Quality requirements for different Applications.
Whenever we apply the concept of IoT for studying environmental behavior in any geographical
location, large number of sensors are deployed. The data obtained from these sensor nodes go
through various issues such as hardware & software problem, poor connectivity, environmental
effects [13]. Thus, the data samples obtained needs to be validated. Several types of faults occur
which needs to be sorted for data validation. In this paper, we focus on two classes of faults; out-
of-range faults and struck-at faults.
1. Out-of–range faults occur when the data obtained from the sensors doesn’t lie within an
expected range of values. Generally, in this type of fault we compare using a threshold
limit which is usually based on domain knowledge.
Input: Actual and Obtained maximum temperature for different months in a year.
Output: Number of invalid entries that suffer out of range faults. 𝑐𝑜𝑢𝑛𝑡𝑖𝑛𝑣𝑎𝑙𝑖𝑑= 0;
Tem
pe
ratu
re
Healthcare Availability, usability,
accuracy, timeliness.
Environment
Modelling
Completeness, data
volume.
Event based Systems Timeliness, accuracy,
confidence.
Smart homes, smart
cities, Utilities
Completeness, data
volume, timeliness.

n = number of months;
for i ← 0 to n do i ← i+1
difference[i] = | actual[i] – obtained[i] |
end for
// Average and SD is obtained for difference data set and limits are defined. 𝛿𝑙𝑜𝑤𝑒𝑟 = Average – SD; // lower threshold value 𝛿𝑢𝑝𝑝𝑒𝑟 = Average + SD; // upper threshold value
for i ← 0 to n do i ← i+1
if (difference[i] < 𝛿𝑙𝑜𝑤𝑒𝑟 or difference[i] > 𝛿𝑢𝑝𝑝𝑒𝑟)
then 𝑐𝑜𝑢𝑛𝑡𝑖𝑛𝑣𝑎𝑙𝑖𝑑← 𝑐𝑜𝑢𝑛𝑡𝑖𝑛𝑣𝑎𝑙𝑖𝑑+1
end if
end for
end
2. Struck-at faults or constant faults occur when the data obtained from the sensor nodes
show no change or very little change for a significant amount of time. It behaves as if
data has reached in a frozen state and shows no variation.
Input: Maximum temperature readings of a month.
Output: Number of updates which acts as a parameter to determine struck-at faults or constant
faults. 𝑐𝑜𝑢𝑛𝑡𝑢𝑝𝑑𝑎𝑡𝑒= 0;
n=number of days in a month;
// Average and SD is obtained for a month data set. 𝛿𝑙𝑜𝑤𝑒𝑟 = Average – SD; // lower threshold value 𝛿𝑢𝑝𝑝𝑒𝑟 = Average + SD; // upper threshold value
for i ← 0 to n do i ← i+1
if (temperature[i] < 𝛿𝑙𝑜𝑤𝑒𝑟 or temperature[i] > 𝛿𝑢𝑝𝑝𝑒𝑟)
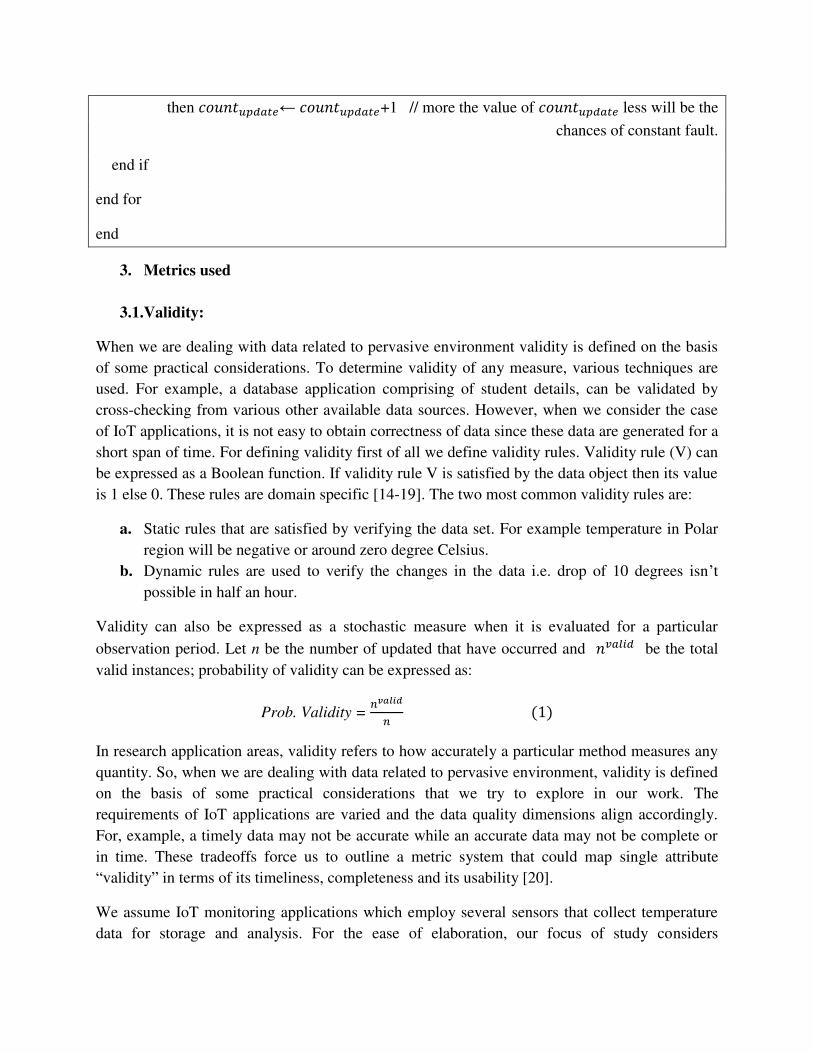
then 𝑐𝑜𝑢𝑛𝑡𝑢𝑝𝑑𝑎𝑡𝑒← 𝑐𝑜𝑢𝑛𝑡𝑢𝑝𝑑𝑎𝑡𝑒+1 // more the value of 𝑐𝑜𝑢𝑛𝑡𝑢𝑝𝑑𝑎𝑡𝑒 less will be the
chances of constant fault.
end if
end for
end
3. Metrics used
3.1.Validity:
When we are dealing with data related to pervasive environment validity is defined on the basis
of some practical considerations. To determine validity of any measure, various techniques are
used. For example, a database application comprising of student details, can be validated by
cross-checking from various other available data sources. However, when we consider the case
of IoT applications, it is not easy to obtain correctness of data since these data are generated for a
short span of time. For defining validity first of all we define validity rules. Validity rule (V) can
be expressed as a Boolean function. If validity rule V is satisfied by the data object then its value
is 1 else 0. These rules are domain specific [14-19]. The two most common validity rules are:
a. Static rules that are satisfied by verifying the data set. For example temperature in Polar
region will be negative or around zero degree Celsius.
b. Dynamic rules are used to verify the changes in the data i.e. drop of 10 degrees isn’t possible in half an hour.
Validity can also be expressed as a stochastic measure when it is evaluated for a particular
observation period. Let n be the number of updated that have occurred and 𝑛𝑣𝑎𝑙𝑖𝑑 be the total
valid instances; probability of validity can be expressed as:
Prob. Validity = 𝑛𝑣𝑎𝑙𝑖𝑑𝑛 (1)
In research application areas, validity refers to how accurately a particular method measures any
quantity. So, when we are dealing with data related to pervasive environment, validity is defined
on the basis of some practical considerations that we try to explore in our work. The
requirements of IoT applications are varied and the data quality dimensions align accordingly.
For, example, a timely data may not be accurate while an accurate data may not be complete or
in time. These tradeoffs force us to outline a metric system that could map single attribute
“validity” in terms of its timeliness, completeness and its usability [20].
We assume IoT monitoring applications which employ several sensors that collect temperature
data for storage and analysis. For the ease of elaboration, our focus of study considers

‘Maximum’ temperature. Since we consider data for an entire year, we also focus on evaluating
metrics for aggregated data in our study. We usually obtain large set of temperature data because
it keeps on fluctuating. Therefore, large volume of data will be obtained for a year. The data sets
[21,22] which has been used for evaluating validity is obtained from the meteorological lab, in
the district of Ranchi, India [23.3441° N, 85.3096° E]. It consists of maximum and minimum
temperature of all months for the year 2012. We have considered maximum temperature as a
measure for determining its validity. For deciding the validity of a dataset, first of all we need to
calculate the update_value which serves as an important entity for validation of any data. To
obtain update_value, we followed following steps:
Step 1: Obtain mean of maximum temperature for each month and calculate Standard
Deviation (SD) for the dataset.
Step 2: Set the limits with the help of obtained mean and SD values.
Step 3: To determine updates in a month, check those temperature values which doesn’t lie in the limit.
Step 4: Calculate the different update_value for each month which is the difference
between the consecutive updates in terms of the duration.
On the basis of these values, max update_value for each month was determined which is
depicted in figure 2. From the figure we see that there are two discrepancies in the graph, in the
month of February and July which should ideally be aligned as they belong to the same period
and same geographical location. Thus, any irrelevance is an anomaly.
Figure 2: shows maximum update value determined for each month.
To determine validity, we used weather data [23] and our algorithm compared the max
temperature value. Then, we isolated the particular day in a month where max-update was found
0
5
10
15
20
25
JAN
FE
B
MA
R
AP
R
MA
Y
JUN
E
JULY
AU
G
SE
P
OC
T
NO
V
DE
C
Max Update_Value D1
Max Update_Value D2

and compared max temperature for that particular day with reading of the reference website.
When there was a considerable difference we calculated average and standard deviation for those
differences. As, we have earlier stated that to determine validity, firstly we need to find those
validity rules that are true (1) or false (0). They are represented as bool values. This process was
performed for an entire year as well as for five separate years. Probability Validity was
calculated for both scenarios so as to determine the more valid data set among the two data sets.
Table1 (a): representing update day, their corresponding actual and obtained max temperature
values for data set 1.
Up_DATES Actual Obtained Difference bool
07-01-2012 18 18 0 0
09-02-2012 23 23.6 0.6 1
10-03-2012 28 29.6 1.6 0
15-04-2012 34 34.8 0.8 1
23-05-2012 41 41.7 0.7 1
19-06-2012 31 31.8 0.8 1
31-07-2012 27 27.2 0.2 1
14-08-2012 25 25.4 0.4 1
30-09-2012 32 32.1 0.1 1
27-10-2012 28 28 0 0
18-11-2012 24 23.9 0.1 1
22-12-2012 22 21.8 0.2 1
Table 1 (b): representing update day, their corresponding actual and obtained max temperature
values for data set 2.
Up_DATES Actual Obtained Difference bool
18-01-2012 24 26.8 2.8 1
22-02-2012 31 35.2 4.2 1
12-03-2012 31 32.78 1.78 1
06-04-2012 33 40.14 7.14 0
31-05-2012 39 47.76 8.76 0
23-06-2012 25 27.65 2.65 1
25-07-2012 29 28.23 0.77 0
22-08-2012 25 30.72 5.72 1
15-09-2012 28 26.72 1.28 0
23-10-2012 28 32.72 4.72 1
12-11-2012 25 30.78 5.78 1
10-12-2012 27 30.40 3.40 1
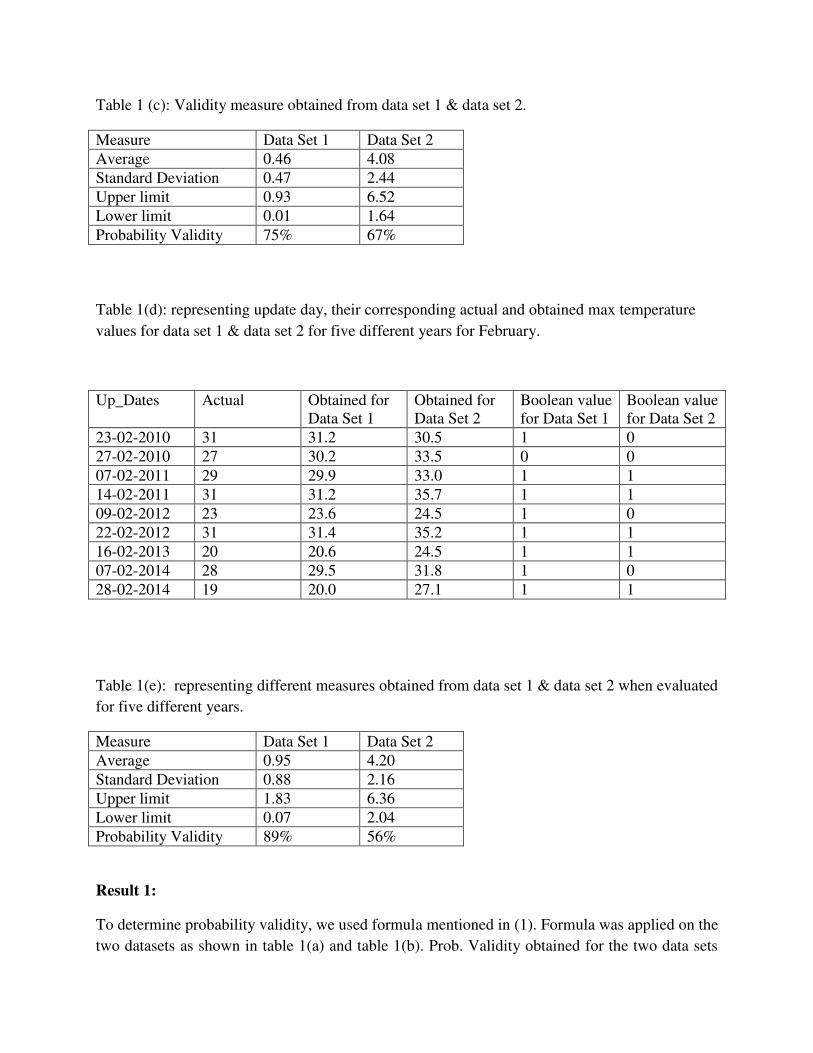
Table 1 (c): Validity measure obtained from data set 1 & data set 2.
Measure Data Set 1 Data Set 2 Average 0.46 4.08 Standard Deviation 0.47 2.44 Upper limit 0.93 6.52 Lower limit 0.01 1.64 Probability Validity 75% 67%
Table 1(d): representing update day, their corresponding actual and obtained max temperature
values for data set 1 & data set 2 for five different years for February.
Up_Dates Actual Obtained for Data Set 1
Obtained for Data Set 2
Boolean value for Data Set 1
Boolean value for Data Set 2
23-02-2010 31 31.2 30.5 1 0 27-02-2010 27 30.2 33.5 0 0 07-02-2011 29 29.9 33.0 1 1 14-02-2011 31 31.2 35.7 1 1 09-02-2012 23 23.6 24.5 1 0 22-02-2012 31 31.4 35.2 1 1 16-02-2013 20 20.6 24.5 1 1 07-02-2014 28 29.5 31.8 1 0 28-02-2014 19 20.0 27.1 1 1
Table 1(e): representing different measures obtained from data set 1 & data set 2 when evaluated
for five different years.
Measure Data Set 1 Data Set 2 Average 0.95 4.20 Standard Deviation 0.88 2.16 Upper limit 1.83 6.36 Lower limit 0.07 2.04 Probability Validity 89% 56%
Result 1:
To determine probability validity, we used formula mentioned in (1). Formula was applied on the
two datasets as shown in table 1(a) and table 1(b). Prob. Validity obtained for the two data sets

was 75% and 67% as mentioned in table 1(c), which shows that data set 1 has higher chances of
validity than data set 2. Similarly, when Prob. Validity was evaluated for five different years, it
was found that for data set 1 it came out to be 89% while in data set 2 it was 56%, which further
suggests that validity of data set 1 is more than data set 2.
3.2.Data Freshness:
Timeliness of data processing has also been referred to as “perishable insights”. If data is not
collected and analyzed within the real time constraints, it no longer remains valid and is
unusable. So, data freshness becomes one of the most important attributes for measuring the
quality of data. It’s a highly beneficial measure especially in case of an IoT application due to the
heterogeneity of data sources, high interoperability and rapid generation of data from the sensors.
Playing a major role for the analysis of data, it mainly refers to how often a new data is obtained.
As we have considered two separate data sets, so we obtained number of updates occurring in
each month for both data sets shown in figure 3. When the number of updates is more, the
guarantee for data freshness is established.
Figure 3: represents the number of updates occurring in each month for both data sets.
Result 2:
From the figure 3 we see that for the majority of months, number of updates is more for data set
1 as compared to data set 2. Thus, we found data freshness more in data set 1 than data set 2.
3.3.Availability:
0
2
4
6
8
10
12
14
Jan
Fe
b
Ma
rch
Ap
ril
Ma
y
Jun
e
July
Au
g
Se
p
Oct
No
v
De
c
Number of updates D1
Number of updates D2
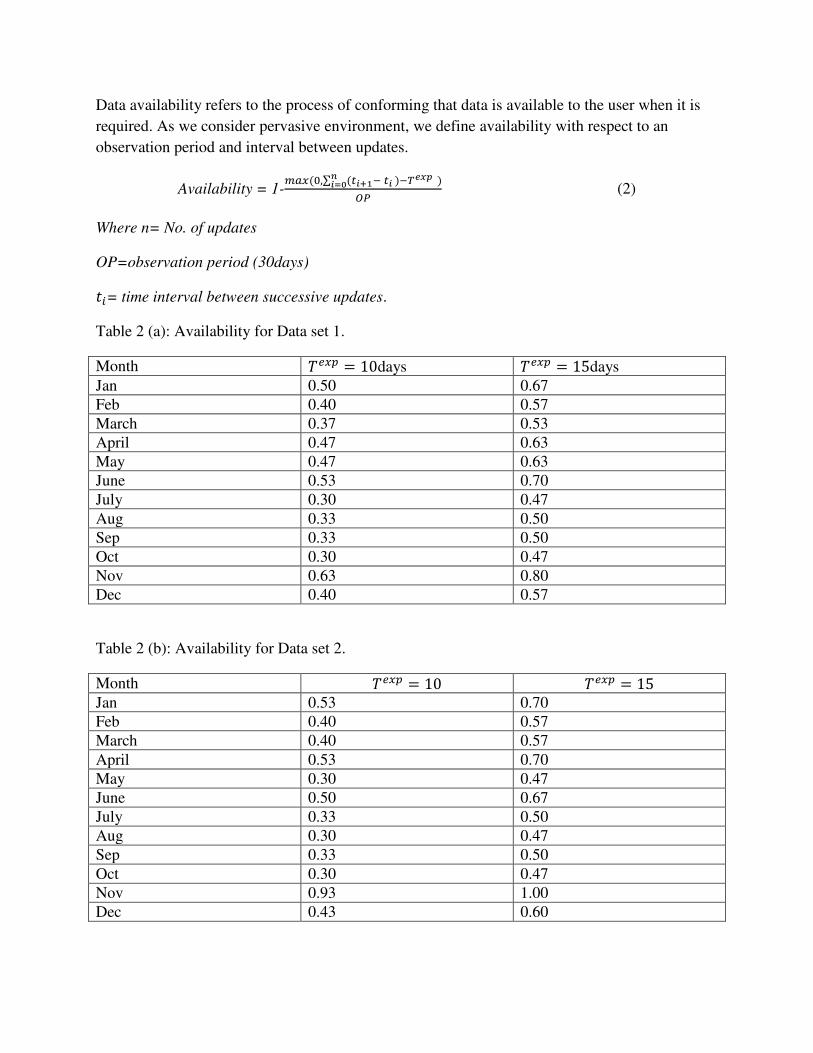
Data availability refers to the process of conforming that data is available to the user when it is
required. As we consider pervasive environment, we define availability with respect to an
observation period and interval between updates.
Availability = 1-𝑚𝑎𝑥 (0,∑ (𝑡𝑖+1− 𝑡𝑖 )−𝑇𝑒𝑥𝑝 )𝑛𝑖=0 𝑂𝑃 (2)
Where n= No. of updates
OP=observation period (30days) 𝑡𝑖= time interval between successive updates.
Table 2 (a): Availability for Data set 1.
Month 𝑇𝑒𝑥𝑝 = 10days 𝑇𝑒𝑥𝑝 = 15days Jan 0.50 0.67 Feb 0.40 0.57 March 0.37 0.53 April 0.47 0.63 May 0.47 0.63 June 0.53 0.70 July 0.30 0.47 Aug 0.33 0.50 Sep 0.33 0.50 Oct 0.30 0.47 Nov 0.63 0.80 Dec 0.40 0.57
Table 2 (b): Availability for Data set 2.
Month 𝑇𝑒𝑥𝑝 = 10 𝑇𝑒𝑥𝑝 = 15 Jan 0.53 0.70 Feb 0.40 0.57 March 0.40 0.57 April 0.53 0.70 May 0.30 0.47 June 0.50 0.67 July 0.33 0.50 Aug 0.30 0.47 Sep 0.33 0.50 Oct 0.30 0.47 Nov 0.93 1.00 Dec 0.43 0.60
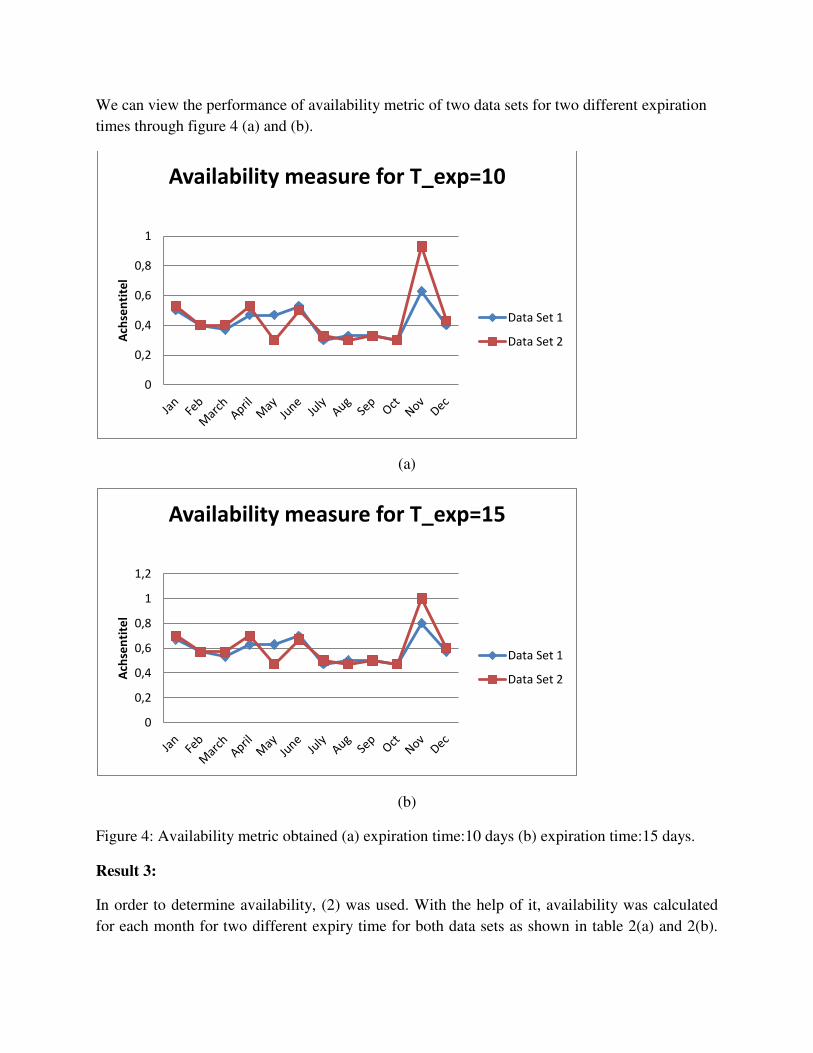
We can view the performance of availability metric of two data sets for two different expiration
times through figure 4 (a) and (b).
(a)
(b)
Figure 4: Availability metric obtained (a) expiration time:10 days (b) expiration time:15 days.
Result 3:
In order to determine availability, (2) was used. With the help of it, availability was calculated
for each month for two different expiry time for both data sets as shown in table 2(a) and 2(b).
0
0,2
0,4
0,6
0,8
1
Ach
sen
tite
l
Availability measure for T_exp=10
Data Set 1
Data Set 2
0
0,2
0,4
0,6
0,8
1
1,2
Ach
sen
tite
l
Availability measure for T_exp=15
Data Set 1
Data Set 2

When we observe the availability metric obtained from figure 4(a) and figure 4(b), it was found
that data set 2 was better in terms of availability as compared to data set 1.
3.4.Completeness
In case of contextual and representational quality of data [21], concise representation,
completeness, Value added and relevancy are most important. Completeness generally refers to
the property of any system that doesn’t suffer from data loss. It defines that whether the data
source is capable of providing all the information which it mentioned and is required by the
application [20]. Completeness can be evaluated at different levels such as:
Scheme Completeness (entities and attributes are missing)
Column Completeness (column values are missing)
Population Completeness (column doesn’t contains all the samples of population)
Mathematically, it can be defined as: 𝐶𝑜𝑚𝑝𝑙𝑒𝑡𝑒𝑛𝑒𝑠𝑠 = 1 − 𝑛𝑜.𝑜𝑓 𝑖𝑛𝑐𝑜𝑚𝑝𝑙𝑒𝑡𝑒 𝑖𝑡𝑒𝑚𝑠𝑡𝑜𝑡𝑎𝑙 𝑛𝑜.𝑜𝑓 𝑖𝑡𝑒𝑚𝑠 (3)
In our study, completeness is directly proportional to the number of updates. Since, more the
number of updates less will be the chances of missing the updated data. As, we are computing
completeness annually, it will be depending upon the update values of individual month and will
be calculated in a relative term with respect to the maximum number of updates found in a yearly
dataset i.e.
Completeness = ∑ 𝑢𝑖∑ 𝑢𝑚𝑎𝑥 (4)
Where: 𝑢𝑖 = 𝑛𝑜. 𝑜𝑓 𝑢𝑝𝑑𝑎𝑡𝑒𝑠 𝑜𝑐𝑐𝑢𝑟𝑟𝑖𝑛𝑔 𝑖𝑛 𝑎 𝑚𝑜𝑛𝑡ℎ 𝑢𝑚𝑎𝑥 = 𝑀𝑎𝑥𝑖𝑚𝑢𝑚 𝑛𝑜. 𝑜𝑓 𝑢𝑝𝑑𝑎𝑡𝑒𝑠 𝑜𝑐𝑐𝑢𝑟𝑖𝑛𝑔 𝑖𝑛 𝑎 𝑚𝑜𝑛𝑡ℎ. Table 3: Representing number of updates obtained for each month for the two datasets.
Month Updates in Dataset 1 Updates in Dataset2 Jan 11 9 Feb 11 11 March 13 8 April 10 9 May 8 6 June 7 6 July 10 6 Aug 9 12 Sep 7 6 Oct 13 10
Nov 8 6 Dec 10 10
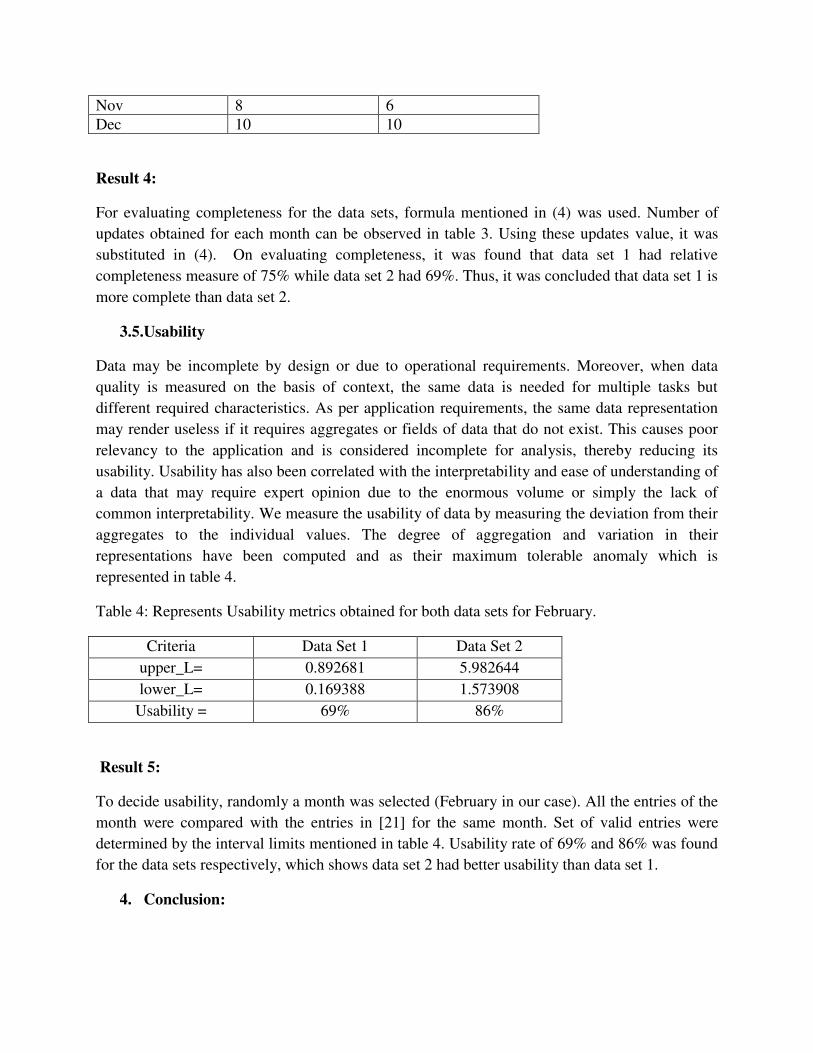
Result 4:
For evaluating completeness for the data sets, formula mentioned in (4) was used. Number of
updates obtained for each month can be observed in table 3. Using these updates value, it was
substituted in (4). On evaluating completeness, it was found that data set 1 had relative
completeness measure of 75% while data set 2 had 69%. Thus, it was concluded that data set 1 is
more complete than data set 2.
3.5.Usability
Data may be incomplete by design or due to operational requirements. Moreover, when data
quality is measured on the basis of context, the same data is needed for multiple tasks but
different required characteristics. As per application requirements, the same data representation
may render useless if it requires aggregates or fields of data that do not exist. This causes poor
relevancy to the application and is considered incomplete for analysis, thereby reducing its
usability. Usability has also been correlated with the interpretability and ease of understanding of
a data that may require expert opinion due to the enormous volume or simply the lack of
common interpretability. We measure the usability of data by measuring the deviation from their
aggregates to the individual values. The degree of aggregation and variation in their
representations have been computed and as their maximum tolerable anomaly which is
represented in table 4.
Table 4: Represents Usability metrics obtained for both data sets for February.
Criteria Data Set 1 Data Set 2
upper_L= 0.892681 5.982644
lower_L= 0.169388 1.573908
Usability = 69% 86%
Result 5:
To decide usability, randomly a month was selected (February in our case). All the entries of the
month were compared with the entries in [21] for the same month. Set of valid entries were
determined by the interval limits mentioned in table 4. Usability rate of 69% and 86% was found
for the data sets respectively, which shows data set 2 had better usability than data set 1.
4. Conclusion:

Metrics that have been defined for measuring the data quality for an IoT application have been
implemented on weather data to display its significance. In earlier research works, metrics for
data quality had not been applied for aggregated data. Thus, we used five metrics namely
validity, data freshness, availability, completeness and usability for observing the data quality on
a collective basis. The result shows that validity, freshness and availability metrics for data set 1
is more than data set 2. We also depicted that completeness and usability of data collected may
vary but is always aligned with the validity of data. A more valid data will be more complete,
more usable, more available and also up-to-date. In future we aim to implement other context
based metrics on data obtained from IoT based applications.
Declarations:
Funding: Not Applicable
Conflicts of Interests/ Competing Interests: Not Applicable
Availability of Data & Material: The data sets which were used for the study have been
mentioned in the reference section. Please refer ref. number [21, 22 and 23]. [21, 22] are
the two data sets that have been used for the study while [23] acts as a reference point.
Code Availability: Code can be provided if the editor requires.
References:
1. Chen, Hao, XueqinJia, and Heng Li. "A brief introduction to IoT gateway." IET
international conference on communication technology and application (ICCTA 2011).
IET, 2011.
2. Alam, Mahbubul, Rasmus H. Nielsen, and Neeli R. Prasad. "The evolution of M2M
into IoT." 2013 First International Black Sea Conference on Communications and
Networking (BlackSeaCom). IEEE, 2013.
3. Udoh, Itorobong S., and Gerald Kotonya. "Developing IoT applications: challenges and
frameworks." IET Cyber-Physical Systems: Theory & Applications 3.2 (2018): 65-72.
4. Babovic, Zoran B., JelicaProtic, and VeljkoMilutinovic. "Web performance evaluation
for internet of things applications." IEEE Access 4 (2016): 6974-6992.
5. Fenton, Norman E., and Martin Neil. "Software metrics: roadmap." Proceedings of the
Conference on the Future of Software Engineering. 2000.

6. Miguel, José P., David Mauricio, and Glen Rodríguez. "A review of software quality
models for the evaluation of software products." arXiv preprint
arXiv:1412.2977 (2014).
7. Bhatti, Shahid Nazir. "Why quality? iso 9126 software quality metrics (functionality)
support by uml suite." ACM SIGSOFT Software Engineering Notes 30.2 (2005): 1-5.
8. Power, Alexander, and Gerald Kotonya. "Providing fault tolerance via complex event
processing and machine learning for iot systems." Proceedings of the 9th International
Conference on the Internet of Things. 2019.
9. Nieh, Jason, and Monica S. Lam. "A SMART scheduler for multimedia
applications." ACM Transactions on Computer Systems (TOCS) 21.2 (2003): 117-163.
10. Kuemper, Daniel, et al. "Valid. IoT: a framework for sensor data quality analysis and
interpolation." Proceedings of the 9th ACM Multimedia Systems Conference. 2018.
11. Jayashree, L. S., S. Arumugam, and A. R. Meenakshi. "A communication‐efficient
framework for outlier‐free data reporting in data‐gathering sensor
networks." International Journal of Network Management 18.5 (2008): 437-445.
12. Nisa, Ishrat Un, and Syed Nadeem Ahsan. "Fault prediction model for software using
soft computing techniques." 2015 International Conference on Open Source Systems &
Technologies (ICOSST). IEEE, 2015.
13. Ravichandran, Jaichandran, and Anthony Irudhayaraj Arulappan. "Data validation
algorithm for wireless sensor networks." International Journal of Distributed Sensor
Networks 9.12 (2013): 634278.
14. Klima, Matej, et al. "Quality and reliability metrics for IoT systems: a consolidated
view." International Summit Smart City 360°. Springer, Cham, 2020.
15. Karkouch, Aimad, et al. "Data quality in internet of things: A state-of-the-art
survey." Journal of Network and Computer Applications 73 (2016): 57-81.
16. Pipino, Leo L., Yang W. Lee, and Richard Y. Wang. "Data quality
assessment." Communications of the ACM 45.4 (2002): 211-218.
17. Byabazaire, John, Gregory O’Hare, and Declan Delaney. "Data Quality and Trust:
Review of Challenges and Opportunities for Data Sharing in IoT." Electronics 9.12
(2020): 2083.
18. Kaiser, Marcus, Mathias Klier, and Bernd Heinrich. "How to measure data quality?-a
metric-based approach." ICIS 2007 Proceedings (2007): 108.

19. Buchholz, Thomas, Axel Küpper, and Michael Schiffers. "Quality of context: What it
is and why we need it." Workshop of the HP OpenView University Association. 2003.
20. Thomas, Michael Onuoha, and Babak Bashari Rad. "Reliability evaluation metrics for
internet of things, car tracking system: a review." Int. J. Inf. Technol. Comput.
Sci.(IJITCS) 9.2 (2017): 1-10.
21. https://mausam.imd.gov.in/
22. http://amsskolkata.gov.in/mc/ranchi
23. https://www.timeanddate.com, last accessed: July 2020.