validity and reproducibility of a food frequency
TRANSCRIPT

nutrients
Article
Validity and Reproducibility of a Food FrequencyQuestionnaire to Assess Nutrients Intake of Pregnant Womenin the South-East of Spain
Daniel Hinojosa-Nogueira 1,2,† , Desirée Romero-Molina 2,3,†, María José Giménez-Asensio 2,Beatriz Gonzalez-Alzaga 2,4, Inmaculada Lopéz-Flores 2,5, Silvia Pastoriza de la Cueva 1,José Ángel Rufián-Henares 1,2,* , Antonio F. Hernández 2,6,7 and Marina Lacasaña 2,4,7,*
�����������������
Citation: Hinojosa-Nogueira, D.;
Romero-Molina, D.;
Giménez-Asensio, M.J.;
Gonzalez-Alzaga, B.; Lopéz-Flores, I.;
Cueva, S.P.d.l.; Rufián-Henares, J.Á.;
Hernández, A.F.; Lacasaña, M.
Validity and Reproducibility of a
Food Frequency Questionnaire to
Assess Nutrients Intake of Pregnant
Women in the South-East of Spain.
Nutrients 2021, 13, 3032. https://
doi.org/10.3390/nu13093032
Academic Editor: Tim Green
Received: 27 July 2021
Accepted: 27 August 2021
Published: 30 August 2021
Publisher’s Note: MDPI stays neutral
with regard to jurisdictional claims in
published maps and institutional affil-
iations.
Copyright: © 2021 by the authors.
Licensee MDPI, Basel, Switzerland.
This article is an open access article
distributed under the terms and
conditions of the Creative Commons
Attribution (CC BY) license (https://
creativecommons.org/licenses/by/
4.0/).
1 Centro de Investigación Biomédica, Departamento de Nutrición y Bromatología,Instituto de Nutrición y Tecnología de los Alimentos, Universidad de Granada, 18071 Granada, Spain;[email protected] (D.H.-N.); [email protected] (S.P.d.l.C.)
2 Instituto de Investigación Biosanitaria ibs.GRANADA, Av. de las Fuerzas Armadas, 2, 18014 Granada, Spain;[email protected] (D.R.-M.); [email protected] (M.J.G.-A.);[email protected] (B.G.-A.); [email protected] (I.L.-F.); [email protected] (A.F.H.)
3 Statistics and Operations Research Department, Faculty of Sciences, University of Granada,Fuente Nueva s/n, 18071 Granada, Spain
4 Andalusian School of Public Health (EASP), 18011 Granada, Spain5 Department of Genetics, Faculty of Sciences, University of Granada, Fuente Nueva s/n, 18071 Granada, Spain6 Department of Legal Medicine and Toxicology, University of Granada School of Medicine,
Health Sciences Technological Park, Avenida de la Investigación, 11, 18016 Granada, Spain7 CIBER Epidemiology and Public Health (CIBERESP), Instituto de Salud Carlos III, Monforte de Lemos 3-5,
Pabellón 11, Planta 0, 28029 Madrid, Spain* Correspondence: [email protected] (J.Á.R.-H.); [email protected] (M.L.)† These authors contributed equally to this work.
Abstract: Proper nutrition during pregnancy is pivotal to maintain good health for the child andthe mother. This study evaluates the reproducibility and validity of a food frequency questionnaire(FFQ) designed to assess nutrient intake during pregnancy in the GENEIDA (Genetics, Early lifeEnvironmental Exposures and Infant Development in Andalusia) prospective birth cohort study.In addition, the nutrient intake was estimated and then compared with European guidelines andother studies. Diet information was collected from 690 pregnant women using a FFQ administeredat two periods of pregnancy (used for the reproducibility study) and 24-h dietary recall (for thevalidity study). Statistical approaches included Spearman’s correlation coefficient and percentageagreement, classifying women into the same or adjacent quintiles to assess reproducibility, and limitsof agreement (LoA) to evaluate validity. In the study of reproducibility, significant correlations fornutrients adjusted for total energy had an average of 0.417. Moreover, the percentage of subjectsclassified in the same quintile for nutrient intakes were above 66%. In the validation study, thesignificant correlation for nutrients adjusted for total energy had an average of 0.272. Nevertheless, thepercentage of results in the LoA was above 94%. Our results were similar to other studies suggestingthat the FFQ used is a valid tool of collect dietary intakes for South-East Spanish pregnant women.
Keywords: pregnant women; nutrition; intake; food frequency questionnaire; 24-h dietaryrecalls; Spain
1. Introduction
During pregnancy, women undergo physiological and anatomical changes [1], whichmodify nutritional requirements [2]. Several studies have identified that dietary changesduring pregnancy could either improve or worsen newborn health. Moreover, maternaldiet during pregnancy can affect the child’s development and growth [3]. Consequently,a healthy diet plays an important role in the fetal growth trajectories and the subsequent
Nutrients 2021, 13, 3032. https://doi.org/10.3390/nu13093032 https://www.mdpi.com/journal/nutrients

Nutrients 2021, 13, 3032 2 of 15
state of health [4,5]. One of the diets associated with better healthy eating habits is theMediterranean diet, characterized by a high consumption of fresh fruit, vegetables, cereals,legumes, nuts, seeds, olive oil (main source of fats), moderate intake of fish, cheese, yogurtand only small amounts of red and processed meat [6]. The Mediterranean diet has beenassociated with lower risk of preterm birth [7], lower child adiposity [8], higher weight atbirth [9], and lower offspring waist circumference at preschool age [10].
Despite Spain is located in the Mediterranean area, several epidemiological studiessuggest that food patterns do not reach nutritional recommendations [11–13]. Accordingly,the evaluation of nutrients intake would result in a more accurate reflection of theiradequacy with respect to recommendations [14]. However, valid instruments to assessdietary composition and nutrient intake during pregnancy are required [15]. Biochemicalparameters are the most precise methods to study the nutritional status, but they onlyreflect nutritional status at a specific time and are also the most expensive approach [16,17].Moreover, food records or 24-h dietary recalls may provide accurate information, althoughthey are difficult to administer and a high level of cooperation is necessary [18]. The foodfrequency questionnaire (FFQ) is the most used method in epidemiological studies as itprovides a better approximation of the usual dietary intake over a longer period [19]. FFQis also a low-cost and easy-to-apply instrument [20] and thus it is one of the most usedmethods in pregnancy studies [21,22].
Dietary habits vary widely among the population according to different factors (e.g.,geographic area, population type or cultural beliefs) and, therefore, the FFQ must beadapted and validated for use in each specific population [22]. Adaptations must take intoaccount the type of food consumed, the accessibility to that food, the traditions or, in thecase of pregnant women, the use of dietary supplements.
FFQs have to be validated, usually with 24-h dietary recalls [23–25] or biochemicalparameters [26] in order to avoid errors and biases. The validity of the FFQ must beevaluated using several measures and statistical methods. The most commonly usedmethod is the correlation coefficient, though this is not a measure of agreement but insteada measure of association that can be partly influenced by the size of the sample. TheBland-Altman method is also a good method to assess the level of agreement betweendifferent methods of measurement. Most epidemiological studies use more than onestatistical approach to demonstrate the robustness of the validation and reproducibilityprocess [27,28].
The aim of this study was to evaluate the reproducibility and validity of a FFQdesigned to assess maternal nutrient intake during pregnancy in the GENEIDA (Genetics,Early life Environmental Exposures and Infant Development in Andalucia) project, aprospective birth cohort study of mother/child pairs conducted in the South-East of Spain,as well as to highlight the importance of the adequate intake of nutrients during pregnancy.
2. Materials and Methods2.1. Study Design and Population
Participants involved in this study were healthy pregnant women from a population-based birth cohort study, the GENEIDA Project, set up in “El Poniente” district (provinceof Almeria, South-Eastern Spain) in April 2014. Eight hundred pregnant women in thefirst trimester of pregnancy (before 13 weeks of gestation) were enrolled in the study. Theywere followed-up during the second and third trimesters of pregnancy, delivery, and theirchildren during the first 48 months of age.
Criteria for inclusion of the mothers were: (a) to be a resident of El Poniente district,(b) to be at least 16 years old, (c) to have a singleton pregnancy, (d) to not have followedany programme of assisted reproduction, (e) planning to deliver at El Poniente Hospital,(f) speak fluent Spanish, and (g) have no chronic disease diagnosed before pregnancy andnot to be under medical treatment.
Of the 800 women initially enrolled in the study between April 2014 and November2016, 690 women completed a FFQ at the first (weeks 10–13) and third trimesters of

Nutrients 2021, 13, 3032 3 of 15
gestation (weeks 32–36). 24-h dietary recalls were completed by a subgroup of 43 women.This study was conducted according to the guidelines laid down in the Declaration ofHelsinki and all procedures involving research and study protocol were approved by theHospital Ethics Committee. Written informed consent was obtained from all participantsor the legally responsible.
2.2. Data Collection2.2.1. General Questionnaire and Medical Records
Information relative to participants was obtained from a structured questionnaireadministered by trained personnel in the first and third trimesters of pregnancy, andfrom medical records. This information consisted of socio-demographic characteristics(age, marital status, birth country, education level, household total net income), medicaland reproductive history, self-reported pre-pregnancy weight and weight at 32 weeksof gestation, height, tobacco smoking and alcohol consumption, vitamin and mineralsupplementation. Body mass index (BMI) was calculated by dividing pre-pregnancyweight (Kg) by the square of their height (meters). BMI was classified as underweight(<18.5), normal (18.5–24.9), overweight (25.0–29.9) and obesity (≥30) [3]. Smoking duringpregnancy was defined as never, yes at the first trimester only, and yes during the entirepregnancy. Information on alcohol (g/day) intake was assessed in the FFQ with specificitems for wine, beer, and liquor consumption, together with standard servings for allthe items. The FFQ also collected information about vitamin and mineral supplementconsumption.
2.2.2. Dietary Assessment
A modified version of a previous validated semi-quantitative FFQ for Spanish popu-lation [18] was used. Additional food items (n = 40) were added in order to assess betterthe usual daily food intake of the Andalusian population.some food Thus, food groupssuch as legumes, cereals, oils, sausages, fish and industrial bakery products, among others,were disaggregated into individual categories to better characterize the sources of dietaryexposure Specific foods of this geographic area (such as strawberries and cherries) andspecific traditional dishes (like the gazpacho, a Spanish-style soup made from tomatoesand other vegetables and spices, served cold) were also included. The new restructuringis shown in (Table 1). The FFQ includes nine possible responses according to frequencyof consumption and serving size of each food. The FFQ was administered twice duringpregnancy, during the first and the third trimesters of pregnancy.
The 24-h dietary recall was chosen as the reference method to validate the FFQ.Pregnant women were asked to complete their dietary intake (all beverages and foodsconsumed in the past 24 h) on three non-consecutive days, including two weekdays andone weekend day. FFQs were administered by the same interviewer to reduce bias and toimprove the response rate and accuracy of the data obtained. The i-Diet software (GSN,Spain) was used to estimate energy and daily nutrients intake [29]. This software wasoriginally developed to generate healthy diets by dieticians and nutritionists and contains alarge database of Spanish foods that allows estimating the intake of more than 50 nutrients.It has been widely used over the last years in epidemiological and dietary interventionstudies to estimate nutrient intakes in study populations.

Nutrients 2021, 13, 3032 4 of 15
Table 1. Structure of the FFQ separated by groups, subgroups and number of items.
Food Groups of FFQ Subgroups of Food Items for Groups
Dairy products Milk 4Cheese 2Dairy Derivatives 5
Meat, fish and eggs Meat 6Meat Derived 7Fish 9Other 4
Vegetables Vegetables 14Spices 2Tubers 3
Legums Pulses 4Fruits Fruits 11
Derived of Fruits 3Nuts 2
Breads and cereals Bread and Derived 3Cereals 2Other 3
Oils and fats Oil 7Other fats 3
Bakery and Pastry Biscuits 6Cakes 6Chocolate 2Other 2
Drinks Alcoholic drinks 9Other drinks 10
Mixed Fried 3Sauces 4Other 5
2.3. Data Analysis
Medians, means and standard deviations (SD) for total nutrient intakes were calcu-lated for the two FFQs and three 24-h dietary recalls administered to pregnant women. Apaired-sample sign test was applied to compare the medians of total nutrient intakes in thetwo study periods (first and third trimesters of pregnancy). The residual method of Willettwas used to adjust macro and micronutrients for energy intake [19]. The reproducibil-ity of the FFQ was assessed using two different statistical approaches: The Spearmancorrelation coefficient and a classification of the nutrient intakes divided into quintiles.Correlations were calculated depending on every nutrient before and after adjusting forenergy; additionally, nutrient intakes were divided into quintiles and the percentage ofcorrectly classified subjects into the same or adjacent quintiles was calculated. Both statisti-cal techniques were also used to evaluate the validity of the FFQ by comparing the totalnutrient intakes obtained by FFQ and 24-h dietary recalls. The limit of agreement (LoA)technique was also used in validation. LoA technique or Bland-Altman method is based ona graphical technique, whose limits of agreement were established as ±1.96 SD of the meandifference between the total nutrient intakes obtained in FFQs and 24-h dietary recalls [27].
Finally, the mean nutrient intake of the two FFQ results was compared with the dietaryreference values for each nutrient recommended by the European Food Safety Authority(EFSA) [30] for pregnant women by calculating the percentage of the relative differencefrom the recommended values. Furthermore, these average values were compared withother studies in pregnant women. All analyses were performed with the SPSS 22.0 statisticspackage. The level of significance was established at p < 0.05.

Nutrients 2021, 13, 3032 5 of 15
3. Results3.1. Characteristics of Participant Pregnant Women
Table 2 presents the main characteristics of the 690 pregnant women: the mean age ofwomen was 31 with a standard deviation of 4.9 years old, 32.9% had overweight or obesebefore pregnancy, 84.4% were Spanish, 26.8% had university studies, 94.5% of women livedwith their couples, 61.3% were primiparous, 5.5% were diagnosed of hypertension and/ordiabetes, 12.5% smoked during the entire pregnancy and 4.3% only during first trimester,6.2% reported alcohol consumption during the first trimester and 1.9% during the thirdtrimester of pregnancy. Supplement consumption of folic acid, vitamin B complex andVitamin complex was reported by 92%, 0.7% and 3.8% of women, at first trimester and by95.8%, 0.9% and 1.7% at the third trimester, respectively.
Table 2. Characteristics of participant pregnant women of the GENEIDA study (n = 690).
Variables Mean ± SD/n (%)
Woman’s age at assessment (years) (mean ± SD) 31.1 ± 4.9Weight before pregnancy (kg) (mean ± SD) 64.8 ± 13.0Weight at 32 week of gestation (kg) (mean ± SD) 76.1 ± 12.7Weight gained through week 32 11.2 ± 5.4Classified BMI pre-pregnancy 1
Underweight (<18.5) 26 (3.8)Normal (18.5–24.99) 432 (62.6)Overweight (25.00–29.99) 162 (23.5)Obesity (≥30) 65 (9.4)Classified BMI 1
Underweight (<18.5) 1 (0.1)Normal (18.5–24.99) 135 (19.6)Overweight (25.00–29.99) 347 (50.3)Obesity (≥30) 202 (29.3)Birth Country 1
Spain 585 (84.4)Other 105 (15.2)Education level 1
Primary or lower studies 45 (6.5)Secondary studies 448 (64.9)Higher studies 185 (26.8)Family income (Euros/month) 1
<500 22 (3.2)500–1000 85 (12.3)1001–2000 308 (44.6)2001–3000 212 (30.7)3001–5000 51 (7.4)>5000 8 (1.1)Status maritalMarried/Couple 652 (94.5)Alone 38 (5.5)Medical historyNothing 652 (94.5)Diabetes 18 (2.6)Hypertension 18 (2.6)Diabetes and Hypertension 2 (0.3)Parity≥1 267 (38.7)0 423 (61.3)SmokingNo 574 (83.2)1st trimester 30 (4.3)All pregnancy 86 (12.5)

Nutrients 2021, 13, 3032 6 of 15
Table 2. Cont.
Variables Mean ± SD/n (%)
Alcohol consumption 1st trimester (gr/day) (mean ± SD) 4.5 (6.2)Alcohol consumption 3st trimester (gr/day) (mean ± SD) 0.6 (1.9)Supplements consumption 1st trimester 2
Vitamin B complex 5 (0.7)Vitamin complex 26 (3.8)Folic acid 635 (92.0)Nothing 40 (5.8)Supplements consumption 3st trimester 2
Vitamin B complex 6 (0.9)Vitamin complex 12 (1.7)Folic acid 661 (95.8)Nothing 17 (2.5)
1 In these variables there are some missing data. 2 In these variables the categories are not exclusive, that is, anindividual can present multiple categories.
3.2. Reproducibility
Table 3 shows the median daily intake of nutrients (assessed by two FFQs) for 690 preg-nant women. Intake of all nutrients was slightly lower in the third trimester of pregnancy(p < 0.01 in sign test). The Spearman correlation coefficients for nutrients estimated bythe two FFQs are also presented in Table 3. Significant correlations were observed for allestimated nutrients. Correlations coefficients ranged from 0.509 to 0.297 for vitamin B6and E, respectively. When the analysis was based on energy-adjusted nutrient intakes,higherand statistically significant Spearman correlation coefficients were found for mostnutrients (Table 3). According to quintile classification for nutrient intake, the percentageof subjects in the same or adjacent quintile, estimated by the two FFQs, ranged from 72.6%to 60.5% for alcohol and molybdenum, respectively (Table 3).
Table 3. Mean daily energy and nutrient intakes based on food-frequency questionnaires, FFQ 1 and FFQ 2 (n = 690).
FFQ1 FFQ2CorrelationCoefficient
Unadjusted a
CorrelationCoefficientAdjusted b
Agreementby Quintile
(%) c
Mean SD Median Mean SD Median
Energy (kcal) 2401 742.7 2320 2052 671.3 1976 * 0.448 * 68.70Protein (g) 103.2 29.51 100.1 89.94 28.67 86.23 * 0.408 * 0.411 * 65.80Total fat (g) 109.2 39.43 102.2 94.02 36.87 87.36 * 0.407 * 0.434 * 64.49
Carbohydrate (g) 267.4 99.75 253.4 229.9 84.24 215.6 * 0.432 * 0.433 * 67.54Saturated fat (g) 24.70 9.08 23.15 20.57 8.11 19.21 * 0.405 * 0.405 * 63.77Cholesterol (mg) 347.9 126.1 327.1 291.7 111 273.5 * 0.415 * 0.464 * 64.49
Fiber (g) 34.48 13.66 32.31 30.61 13.24 29.17 * 0.416 * 0.443 * 67.83Alcohol (g) 2.07 3.39 0.90 0.25 0.76 0.00 * 0.366 * 0.366 * 72.61
Sodium (mg) 2637 997 2494 2177 871.1 2037 * 0.366 * 0.381 * 61.59Potassium (mg) 5175 1781 4934 4704 1768 4479 * 0.384 * 0.406 * 65.80Calcium (mg) 1175 430.8 1128 1048 398.5 1005 * 0.387 * 0.405 * 66.67
Magnesium (mg) 454.5 152.1 439.9 431.9 165.7 410.9 * 0.359 * 0.381 * 65.65Phosphorus (mg) 1704 511 1637 1531 504.1 1475 * 0.430 * 0.427 * 67.83
Iron (mg) 18.69 5.98 18.01 16.12 5.58 15.52 * 0.426 * 0.432 * 67.39Zinc (mg) 13.24 4.02 12.88 11.32 3.80 10.84 * 0.437 * 0.459 * 66.96
Manganese (µg) 3750 1309 3643 3291 1296 3132 * 0.395 * 0.407 * 63.04Iodine (µg) 139.2 58.22 133.3 119 52.38 111.8 * 0.443 * 0.432 * 66.52
Molybdenum(µg) 195.8 95.61 177.5 179.5 90.76 168.5 * 0.373 * 0.401 * 60.58
Chromium (µg) 65.64 25.63 63.24 57.79 24.76 55.14 * 0.372 * 0.372 * 66.96Cobalt (µg) 26.40 12.91 24.43 22.83 12.14 20.28 * 0.445 * 0.447 * 67.54
Vitamin A (µg) 2234 1216 1870 1904 1112 1624 * 0.418 * 0.396 * 61.59Vitamin E (mg) 13.11 5.04 12.27 11.40 4.69 10.71 * 0.297 * 0.301 * 60.87Vitamin D (µg) 4.65 2.46 4.11 3.74 2.04 3.29 * 0.435 * 0.458 * 63.04

Nutrients 2021, 13, 3032 7 of 15
Table 3. Cont.
FFQ1 FFQ2CorrelationCoefficient
Unadjusted a
CorrelationCoefficientAdjusted b
Agreementby Quintile
(%) c
Mean SD Median Mean SD Median
Vitamin C (mg) 299.1 149.4 272.7 244.2 125.6 218.7 * 0.344 * 0.337 * 60.58Vitamin B1 (mg) 1.76 0.56 1.70 1.51 0.53 1.46 * 0.446 * 0.450 * 68.70Vitamin B2 (mg) 2.36 0.78 2.25 2.05 0.71 1.96 * 0.449 * 0.449 * 68.70Vitamin B6 (mg) 2.63 0.85 2.54 2.28 0.83 2.19 * 0.509 * 0.502 * 72.03
Niacin (mg) 26.31 8.69 25.29 24.08 9.28 23.01 * 0.337 * 0.375 * 62.90Biotin (µg) 48.78 17.40 46.73 45.05 18.16 42.58 * 0.469 * 0.479 * 69.28
Vitamin K (µg) 371.5 161.7 352.7 291.8 137.8 265.9 * 0.419 * 0.402 * 66.67Vitamin B12 (µg) 7.00 2.82 6.59 6.10 2.88 5.53 * 0.385 * 0.387 * 60.87
Folate (µg) 462.8 167.4 447.7 412.3 165.5 393.1 * 0.472 * 0.486 * 70.00a Spearman Correlation coefficient using unadjusted nutrient intakes. b Spearman Correlation coefficients when adjusting for total energyintake. c Percentage of the subjects classified in the same or adjacent nutrient intakes’ quintile. * Correlation significant at p < 0.01.
3.3. Validity
Among the 690 participants, a subsample of 43 was selected for the validation analysis(Table 4). These pregnant women filled in three 24-h dietary recalls in addition to theFFQs. Median daily energy and nutrient intakes based on FFQ and 24-h dietary recalls arepresented in Table 4. Similar values (paired-sample sign test) were observed between thedifferent methods for vitamins (except B6 and Biotin), minerals (except sodium, potassium,magnesium, iron, molybdenum, chromium and cobalt) and others (except for protein, satu-rated fat, cholesterol and energy). Those showing significant differences had slightly lowervalues in the FFQs. The Spearman correlation coefficients of nutrients intake adjusted forenergy were calculated and only 13 of the 31 estimated values were statistically significant.These correlation coefficients ranged from 0.465 for cobalt to 0.305 for cholesterol.
Table 4. Mean daily energy and nutrient intakes based on food-frequency questionnaire (FFQ) and 24-h dietary recalls(n = 43).
FFQ 24-h Dietary Recalls CorrelationCoefficient b
Agreementby Quintile
(%) c
Agreementby LoA(%) d
Mean SD Median Mean SD Median a
Energy (kcal) 1745 530 1646 2165 437.6 2133 * 44.19 97.67Protein (g) 80.69 30.37 73.7 97.07 21.51 101.6 * 0.217 58.14 93.02Total fat (g) 78.17 23.50 78.94 99.97 25.32 100.1 0.113 60.47 95.35
Carbohydrate (g) 192.7 74.89 182.2 228.4 51.28 234.1 0.300 67.44 95.35Saturated fat (g) 16.12 4.69 17.25 28.15 9.01 28.77 ** 0.176 53.49 95.35Cholesterol (mg) 227.8 63.02 236.1 228.2 70.08 439.2 ** 0.305 * 55.81 93.02
Fiber (g) 26.64 13.19 25.36 24.04 6.99 24.68 0.358 * 62.79 93.02Alcohol (g) 0.19 0.56 0.00 0.54 1.56 0.00 0.341 * 60.47 83.72
Sodium (mg) 1849 612.8 1857 2500 836.6 2463 ** 0.130 51.16 93.02Potassium (mg) 3742 1489 3424 4699 1304 4450 * 0.332 * 67.44 95.35Calcium (mg) 850.2 362.3 818.7 1014 267.9 1028 0.397 ** 62.79 95.35
Magnesium (mg) 327.5 115.7 325.5 416.5 103 417.8 * 0.378 * 62.79 95.35Phosphorus (mg) 1378 556.6 1287 1502 323.9 1503 0.299 62.79 93.02
Iron (mg) 14.35 5.82 13.41 18.19 4.37 17.92 * 0.113 60.47 95.35Zinc (mg) 10.49 4.02 9.70 10.79 2.95 11.09 0.433 * 53.49 97.67
Manganese (µg) 3150 1512 2721 3004 796.2 2935 0.228 62.79 93.02Iodine (µg) 107.7 47.8 105.4 99.26 40.17 91.70 0.257 62.79 95.35
Molybdenum(µg) 140.9 56.92 138.2 222.8 99.18 202.3 ** 0.349 * 65.12 93.02
Chromium (µg) 54.99 21.44 53.32 70.11 18.73 71.42 ** 0.114 58.14 95.35Cobalt (µg) 18.36 9.79 16.90 17.92 7.46 34.58 ** 0.465 ** 74.42 93.02
Vitamin A (µg) 1690 961.7 1657 1811 902.3 1701 0.197 65.12 93.02Vitamin E (mg) 10.52 4.20 9.93 8.85 3.40 8.34 0.332 * 60.47 90.70

Nutrients 2021, 13, 3032 8 of 15
Table 4. Cont.
FFQ 24-h Dietary Recalls CorrelationCoefficient b
Agreementby Quintile
(%) c
Agreementby LoA(%) d
Mean SD Median Mean SD Median a
Vitamin D (µg) 3.01 1.47 2.90 3.58 2.28 3.74 0.271 55.81 95.35Vitamin C (mg) 190.1 105 183.6 202.4 80.21 194.6 0.398 ** 60.47 97.67VitaminB1 (mg) 1.35 0.46 1.34 1.56 0.38 1.51 0.337 * 58.14 93.02Vitamin B2 (mg) 1.89 0.79 1.80 1.95 0.47 2.03 −0.130 51.16 97.67Vitamin B6 (mg) 2.12 0.87 1.90 2.36 0.61 2.42 * 0.391 ** 67.44 95.35
Niacin (mg) 19.94 7.39 18.86 22.89 7.44 22.15 0.173 60.47 97.67Biotin (µg) 35.30 12.81 35.35 47.89 14.36 49.04 ** −0.055 46.51 95.35
Vitamin K (µg) 283.5 142.1 240.1 313.8 179.8 305.1 0.283 55.81 95.35Vitamin B12 (µg) 5.27 2.45 4.82 6.04 1.74 6.38 0.268 60.47 93.02
Folate (µg) 363.9 164.9 328.4 323.2 99.06 320.8 0.298 62.79 90.70a Paired-sample sign test. b Correlation coefficients of Spearman were adjusted for total energy intake. c Percentage of the subjects classifiedin the same or adjacent nutrient intakes’ quintile. d Overall proportion of agreement limits between both questionnaires. Corresponding toBland–Altman plots. * Significant at p < 0.05 level; ** Significant at p < 0.01 level.
On the other hand, the percentage of subjects classified in the same or adjacent nutrientintakes’ quintile varied from 44.1% for total energy to 74.4% for cobalt. As commentedbefore, the correlation coefficient is not a measure of agreement but a measure of associationand can be partly influenced by the sample size. For this reason, we also applied the Bland-Altman method and calculated the percentage of subjects into the limits of agreement(Table 4). This varied from 83.7% for alcohol to 97.6% for total energy, vitamin C and Niacin.Figure 1 illustrates some graphics of the Bland-Altman method.
3.4. Nutrients Intake in Pregnant Women
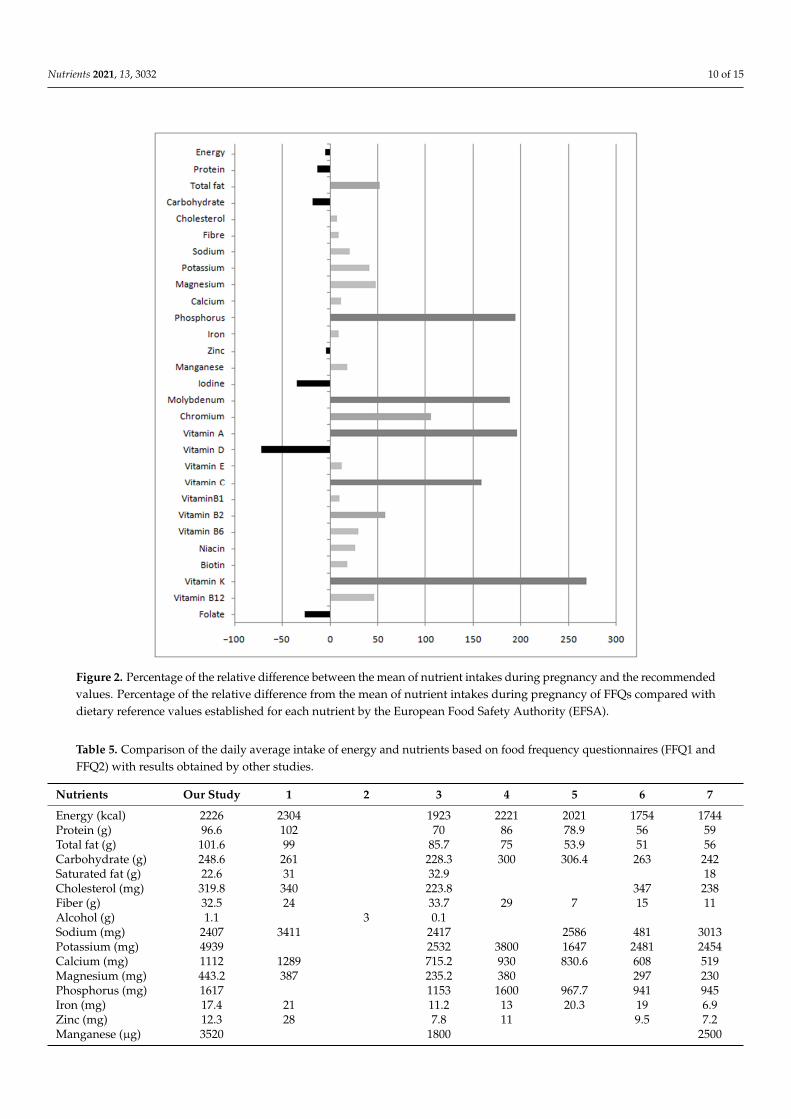
Figure 2 illustrates the comparison of the nutrients intake with the dietary referencevalues for each nutrient for pregnant women [30]. Percentages of the relative differencefrom the values were near or above the dietary reference values. Some micronutrientsdoubled or tripled the recommendations, such as vitamin K (268.5%), vitamin C (158.7%),vitamin A (195.6%), molybdenum (188.7%) and phosphorus (194.1%). Conversely, othernutrients such as iodine (−35.4%), vitamin D (−72%) and folate (−27%) were notablybelow the recommended values.
Table 5 shows the comparison of our results with seven other studies carried out onpregnant women. Although some nutrients show a wide difference, our results are withinthe ranges shown by other studies. Nutrient intakes were similar and comparable withother studies, especially of Spanish populations.

Nutrients 2021, 13, 3032 9 of 15Nutrients 2021, 13, x FOR PEER REVIEW 9 of 15
Figure 1. Bland–Altman plot. Bland–Altman plot between food frequency questionnaire (FFQ) and 24-h dietary recalls methods for measuring daily (a) energy, (b) protein, (c) calcium, (d) vitamin B12, (e) carbohydrate, (f) iron, (g) vitamin C and (h) vitamin E intake. Solid lines represent mean differences between the two methods. Dashed lines represent the limits of agreement corresponding to ±1.96 SD.
Figure 1. Bland–Altman plot. Bland–Altman plot between food frequency questionnaire (FFQ) and 24-h dietary recallsmethods for measuring daily (a) energy, (b) protein, (c) calcium, (d) vitamin B12, (e) carbohydrate, (f) iron, (g) vitamin Cand (h) vitamin E intake. Solid lines represent mean differences between the two methods. Dashed lines represent the limitsof agreement corresponding to ±1.96 SD.
Nutrients 2021, 13, 3032 10 of 15
Nutrients 2021, 13, x FOR PEER REVIEW 10 of 15
3.4. Nutrients Intake in Pregnant Women Figure 2 illustrates the comparison of the nutrients intake with the dietary reference
values for each nutrient for pregnant women [30]. Percentages of the relative difference from the values were near or above the dietary reference values. Some micronutrients doubled or tripled the recommendations, such as vitamin K (268.5%), vitamin C (158.7%), vitamin A (195.6%), molybdenum (188.7%) and phosphorus (194.1%). Conversely, other nutrients such as iodine (−35.4%), vitamin D (−72%) and folate (−27%) were notably below the recommended values.
Figure 2. Percentage of the relative difference between the mean of nutrient intakes during preg-nancy and the recommended values. Percentage of the relative difference from the mean of nutrient intakes during pregnancy of FFQs compared with dietary reference values established for each nu-trient by the European Food Safety Authority (EFSA).
Table 5 shows the comparison of our results with seven other studies carried out on pregnant women. Although some nutrients show a wide difference, our results are within the ranges shown by other studies. Nutrient intakes were similar and comparable with other studies, especially of Spanish populations.
Figure 2. Percentage of the relative difference between the mean of nutrient intakes during pregnancy and the recommendedvalues. Percentage of the relative difference from the mean of nutrient intakes during pregnancy of FFQs compared withdietary reference values established for each nutrient by the European Food Safety Authority (EFSA).
Table 5. Comparison of the daily average intake of energy and nutrients based on food frequency questionnaires (FFQ1 andFFQ2) with results obtained by other studies.
Nutrients Our Study 1 2 3 4 5 6 7
Energy (kcal) 2226 2304 1923 2221 2021 1754 1744Protein (g) 96.6 102 70 86 78.9 56 59Total fat (g) 101.6 99 85.7 75 53.9 51 56Carbohydrate (g) 248.6 261 228.3 300 306.4 263 242Saturated fat (g) 22.6 31 32.9 18Cholesterol (mg) 319.8 340 223.8 347 238Fiber (g) 32.5 24 33.7 29 7 15 11Alcohol (g) 1.1 3 0.1Sodium (mg) 2407 3411 2417 2586 481 3013Potassium (mg) 4939 2532 3800 1647 2481 2454Calcium (mg) 1112 1289 715.2 930 830.6 608 519Magnesium (mg) 443.2 387 235.2 380 297 230Phosphorus (mg) 1617 1153 1600 967.7 941 945Iron (mg) 17.4 21 11.2 13 20.3 19 6.9Zinc (mg) 12.3 28 7.8 11 9.5 7.2Manganese (µg) 3520 1800 2500

Nutrients 2021, 13, 3032 11 of 15
Table 5. Cont.
Nutrients Our Study 1 2 3 4 5 6 7
Iodine (µg) 129.1 222 79.2 120 15.4 437Molybdenum (µg) 187.7Chromium (µg) 61.7Cobalt (µg) 24.6Vitamin A (µg) 2069 1900 1500 987.7 872 909Vitamin E (mg) 12.3 11.4 8 4.3 10 8Vitamin D (µg) 4.2 3.1 6 2.7 3.3 4.2Vitamin C (mg) 271.6 144 253 73.9 160 127.2 164 111VitaminB1 (mg) 1.6 2 1.5 1.5 1.6 0.9Vitamin B2 (mg) 2.2 2 1.3 1.8 2 1.1Vitamin B6 (mg) 2.5 2.1 2 2 1.6 1.2Niacin (mg) 25.2 34 18.5 31 15.9 11 13.3Biotin (µg) 46.9 18.2Vitamin K(µg) 331.6 219Vitamin B12 (µg) 6.5 9.9 6 3.5 4.2Folate (µg) 437.5 305 400 229.2 280 133 284
1 Vioque et al., 2013 [15]; 2 Salcedo-Bellido et al., 2017 [31]; 3 Mouratidou et al., 2006 [23]; 4 Brantsaeter et al., 2007 [26]; 5 Loy et al., 2011 [32];6 Zhang et al., 2015 [22]; 7 Ogawa et al., 2017 [25].
4. Discussion4.1. Validation and Reproducibility
The results of this study demonstrate the validity and reproducibility of a 141-itemmodified FFQ based on the one previously validated by Vioque et al. (2013). The originalFFQ was modified to meet the requirements of the target population of the GENEIDAbirth cohort. Despite the use of biomarkers represents the method of preference to validatethe FFQ, it could have some limitations for pregnant women because of the use of foodsupplements. Thus, we decided to validate the FFQ with 24-h dietary recalls.
Overall, the modified FFQ has a good validity and a huge reproducibility for allnutrient intakes during pregnancy. Regarding the external validity of this study, it shouldbe noted that our study population has a medium-low socioeconomic level, with a 15%immigrant population, mainly of Latin American origin; however, the lifestyle of 85% ofthe population is similar to that of other pregnant women from other Spanish regions.Hence, the questionnaire could be used in other studies carried out in Spain, and morespecifically in Andalusian population, showing similar characteristics to the pregnantwomen participating in this study.
In our study, the average correlation coefficients for reproducibility between the firstand second administration of the FFQ was 0.41 for the 32 nutrients intake considered. Thisvalue is lower than that obtained in the INMA-Valencia study in Spain [18], where theaverage of the correlations coefficient was 0.51. The difference may be due to the use ofdifferent correlation coefficients. We have used the Spearman’s correlation coefficient as thevariables analyzed were non-normally distributed, while the INMA-Valencia study usedthe Pearson’s correlation coefficient. On the other hand, our study compared the results ofapplication of the FFQ at two different time-points of the pregnancy and found differentresults, as a clear decrease in the nutrient intake was observed in the third trimester ofpregnancy relative to the first trimester. However, the INMA-Valencia study showed similarresults in the two applications of the FFQ, which can justify their higher correlations. Whenthe means of the classification percentages in the same or adjacent quintile were compared,both studies found similar results, with 71% for INMA-Valencia study and 66% for ourstudy.
The correlation coefficients for most of the nutrients were similar to other validationstudies of FFQ in pregnant women [23,25]. In the current study, although significant correla-tion coefficients were observed for several nutrients, no significant correlations were foundfor proteins, saturated fat, sodium, iron, phosphorus, vitamin B2 or biotin, among others.

Nutrients 2021, 13, 3032 12 of 15
The correlation coefficients obtained for the reproducibility test were better than thosefound for the validation. This is because the reproducibility assessment measures the corre-lation between the same test performed at two different times (first and third trimester ofpregnancy) while the validation assessment measures the correlation between two differenttests used to measure the same event. Hence, correlation studies are not recommended toevaluate the comparability between methods [33]. An alternative analysis was proposed in1983, based on the quantification of the agreement between two quantitative measurements,which is the current widely used method in nutritional epidemiology. The Bland-Altmanmethod has been used to evaluate the agreement between the two methods in severalvalidation studies conducted for pregnant women [22,23]. Therefore, the Bland-Altmananalysis was used to evaluate the agreement between questionnaires regarding validation.Figure 1 shows points distribution within the LoA of some nutrients, both in the validationand in the reproducibility assays. When results are shown in percentages (Table 4), allvalues are above 90%, except for alcohol (83.7%), from which it can be concluded that bothmethods are comparable.
Another appropriate way to access the agreement between two methods is, again, thepercentage of agreement by quintile. According to classification into quintiles of nutrientintakes as estimated by the FFQ and the 24-h dietary recalls, between 44% (energy) and74% (cobalt) of women were classified in the same or adjacent quintile with an average of60%. The results obtained were comparable to those reported in other studies conductedwith pregnant women as well [22,25].
4.2. Nutrients Intake in Pregnant Women
In the current study, pregnant women were not consuming the amounts recommendedfor the gestational period (Figure 2). In this case, deficiency or excess of nutrients wascalculated using dietary reference values established for each nutrient by EFSA [30]. Nu-trients such as total fat, vitamin B2 and chromium were above 50% recommended dailyallowance. Specifically, the intake of some nutrients such as sodium, total fat, saturatedfat or cholesterol were above the reference values recommended. This should be closelymonitored, because a high intake of these nutrients could pose a risk to the health ofpregnant women and the fetus due to e.g., an increased risk of hypertension and cardio-vascular complications [34]. Despite some micronutrients, such as phosphorus, vitamin K,vitamin A, vitamin C and molybdenum were above 150% of the recommendations, none ofthem were close to toxicity values considered harmful to the health of pregnant women.The highest deficiencies in the intake of micronutrients were found for iodine, vitamin D,and folate. These nutrients are essential during pregnancy and fetal development [11] andusual supplementation helps improve the inadequate intake. For example, in our study allparticipants received folate supplementation during pregnancy (400 micrograms/day), asrecommended by public health agencies, which contributed to achieve the recommendedfolate levels despite their dietary deficits. Our study strengthens the idea that supplemen-tation during pregnancy is crucial and that minor modification of the diet can improve allthe deficits found. e.g., the use of iodized salt instead of common salt.
The comparison of these results with those of other studies (Table 5) showed that thenutritional status of pregnant women in South-East of Spain are within the range reportedby other studies, especially if they are from European populations [12,15,22,23,25,26,31,32].For example, percentages of inadequacy for vitamin D and iodine are similar to thoseobserved by other epidemiological studies conducted in Spanish population [12,15,31].The population from Southern Spain is characterized by a high dietary diversity, so itis not unusual to obtain similar values to other studies conducted in different Spanishpopulation [15,31]. Specifically, our study shows similar results for all macronutrientsand some micronutrients such as calcium or vitamin E to those observed for pregnantwomen in Valencia, Spain [15]. Intakes of other vitamins, such as vitamin A or vitamin Cand group B vitamins, were comparable to another study performed in Spanish pregnantwomen [31]. However, for other micronutrients such as B vitamins and some minerals such

Nutrients 2021, 13, 3032 13 of 15
as phosphorus and iodide, the results are close to those found in European studies [23,26].Conversely, results of studies conducted in Asian populations show more disparate values,either higher or lower, than those described in our study [22,25,32].
These variations cannot only be due to differences in servings and type of foodingested but also to the food composition tables used. It should be noted that the presentstudy collects values of the intake of molybdenum, chromium, cobalt or vitamin K, thatare rarely described in studies of pregnant women, so it is difficult to obtain references tocompare the intake of these nutrients. Although this study has some limitations, such asnot using biochemical parameters for validation and the low number of subjects used, theresults obtained are comparable with those of other populations with similar characteristics.Furthermore, the comparisons made with other studies allows us to infer that our resultsare reasonable and therefore the FFQ developed is a useful tool.
5. Conclusions
Overall, this study shows a good validity and reproducibility for measuring most ofnutrient intakes. Thus, the present FFQ becomes a valid tool to collect dietary data forSouth-East Spanish pregnant women. The results of this study suggest that the diet ofpregnant women living in this area ensures a good intake of nutrients and, together withvitamin supplementation, can meet the necessary nutritional requirements to guarantee thehealth of the fetus. In addition, we have included data for some nutrients like vitamin K,chromium, cobalt, or molybdenum, which are not commonly reported in studies onpregnant women. Finally, the population of this study is very similar in terms of nutrientsintake to other Spanish populations of pregnant women.
Author Contributions: Study Design, Methodology, Data Interpretation, Writing—Review & Edit-ing (M.L., J.Á.R.-H. and B.G.-A.), Methodology, Statistical Analysis, Data Interpretation, Writing—Original Draft & Editing (D.H.-N.), Statistical Analysis, Data interpretation, Writing—Review &Editing (D.R.-M.) Coordination of Field Work, Administration of Questionnaires, Data interpretation,Review & Editing (M.J.G.-A.). Data interpretation, Writing—Review & Editing (I.L.-F., A.F.H. andS.P.d.l.C.). All authors have read and agreed to the published version of the manuscript.
Funding: This research was funded by the Institute of Health Carlos III (PI13/01559), including TheEuropean Regional Development Fund (FEDER). Regional Health Council of Andalusia (Spain) (PI-045-2014). This manuscript was also supported by the Plan propio de Investigación y Transferenciaof the University of Granada under the program “Intensificación de la Investigación, modalidad B”.
Institutional Review Board Statement: The study was conducted according to the guidelines of theDeclaration of Helsinki, and the protocol was approved by the Hospital Ethics Committee, the EthicsCommittee of “Consejería de Salud y Familias, Junta de Andalucía” (PI-0405-2014). and “Consejeríade Igualdad, Salud y Políticas Sociales, Junta de Andalucía” (PI13/01559). We follow the standardsdescribed in Andalusian and Spanish laws of personal data protection and biomedical research forthe treatment of information and biological samples of human origin.
Informed Consent Statement: Written informed consent was obtained from all participants or thelegally responsible before they participated in the study.
Acknowledgments: This work is part of the thesis of Daniel Hinojosa-Nogueira to obtain the PhD inthe Nutrition and Food Sciences program at the University of Granada. The authors thank to theteam of the i-Diet software for their support in the estimation of daily energy and nutrient intake.Likewise, a special mention to the pregnant women who participated in this study and the healthprofessionals from El Poniente Hospital, Almeria.
Conflicts of Interest: The authors declare no conflict of interest.
References1. Costantine, M.M. Physiologic and pharmacokinetic changes in pregnancy. Front. Pharmacol. 2014, 5, 65. [CrossRef]2. Picciano, M.F. Pregnancy and Lactation: Physiological Adjustments, Nutritional Requirements and the Role of Dietary Supple-
ments. J. Nutr. 2003, 133, 1997S–2002S. [CrossRef]

Nutrients 2021, 13, 3032 14 of 15
3. Poston, L.; Harthoorn, L.F.; van der Beek, E.M. Obesity in Pregnancy: Implications for the Mother and Lifelong Health of theChild. A Consensus Statement. Pediatric Res. 2011, 69, 175–180. [CrossRef]
4. Emond, J.A.; Karagas, M.R.; Baker, E.R.; Gilbert-Diamond, D. Better Diet Quality during Pregnancy Is Associated with a ReducedLikelihood of an Infant Born Small for Gestational Age: An Analysis of the Prospective New Hampshire Birth Cohort Study. J.Nutr. 2018, 148, 22–30. [CrossRef]
5. Morrison, J.; Regnault, T. Nutrition in Pregnancy: Optimising Maternal Diet and Fetal Adaptations to Altered Nutrient Supply.Nutrients 2016, 8, 342. [CrossRef] [PubMed]
6. Willett, W.C.; Sacks, F.; Trichopoulou, A.; Drescher, G.; Ferro-Luzzi, A.; Helsing, E.; Trichopoulos, D. Mediterranean diet pyramid:A cultural model for healthy eating. Am. J. Clin. Nutr. 1995, 61, 1402S–1406S. [CrossRef]
7. Saunders, L.; Guldner, L.; Costet, N.; Kadhel, P.; Rouget, F.; Monfort, C.; Thomé, J.-P.; Multigner, L.; Cordier, S. Effect of a Mediterranean Diet during Pregnancy on Fetal Growth and Preterm Delivery: Results From a F rench Caribbean Mother–ChildCohort Study (TIMOUN). Paediatr. Perinat. Epidemiol. 2014, 28, 235–244. [CrossRef] [PubMed]
8. Chatzi, L.; Rifas-Shiman, S.L.; Georgiou, V.; Joung, K.E.; Koinaki, S.; Chalkiadaki, G.; Margioris, A.; Sarri, K.; Vassilaki, M.;Vafeiadi, M.; et al. Adherence to the Mediterranean diet during pregnancy and offspring adiposity and cardiometabolic traits inchildhood: Mediterranean Diet and Child Adiposity. Pediatric Obes. 2017, 12, 47–56. [CrossRef]
9. Chatzi, L.; Mendez, M.; Garcia, R.; Roumeliotaki, T.; Ibarluzea, J.; Tardón, A.; Amiano, P.; Lertxundi, A.; Iniguez, C.; Vioque, J.Mediterranean diet adherence during pregnancy and fetal growth: INMA (Spain) and RHEA (Greece) mother–child cohortstudies. Br. J. Nutr. 2012, 107, 135–145. [CrossRef]
10. Fernández-Barrés, S.; Romaguera, D.; Valvi, D.; Martínez, D.; Vioque, J.; Navarrete-Muñoz, E.M.; Amiano, P.;Gonzalez-Palacios, S.; Guxens, M.; Pereda, E.; et al. Mediterranean dietary pattern in pregnant women and offspringrisk of overweight and abdominal obesity in early childhood: The INMA birth cohort study: Maternal diet and childhood obesity.Pediatric Obes. 2016, 11, 491–499. [CrossRef] [PubMed]
11. Navarrete-Muñoz, E.M.; Giménez Monzó, D.; García de La Hera, M.; Climent, M.D.; Rebagliato, M.; Murcia, M.; Iñiguez, C.;Ballester, F.; Ramón, R.; Vioque, J. Ingesta dietética y de suplementos de ácido fólico en mujeres embarazadas de Valencia. Med.Clínica 2010, 135, 637–643. [CrossRef]
12. Rodríguez-Bernal, C.L.; Ramón, R.; Quiles, J.; Murcia, M.; Navarrete-Munoz, E.M.; Vioque, J.; Ballester, F.; Rebagliato, M. Dietaryintake in pregnant women in a Spanish Mediterranean area: As good as it is supposed to be? Public Health Nutr. 2013, 16,1379–1389. [CrossRef]
13. Cuervo, M.; Sayon-Orea, C.; Santiago, S.; Martínez, J. Dietary and health profiles of Spanish women in preconception, pregnancyand lactation. Nutrients 2014, 6, 4434–4451. [CrossRef]
14. Murphy, S.P.; Barr, S.I.; Poos, M.I. Using the New Dietary Reference Intakes to Assess Diets: A Map to the Maze. Nutr. Rev. 2002,60, 267–275. [CrossRef]
15. Vioque, J.; Gimenez-Monzo, D.; Navarrete-Muñoz, E.M.; Garcia-de-la-Hera, M.; Gonzalez-Palacios, S.; Rebagliato, M.; Ballester, F.;Murcia, M.; Iñiguez, C.; Granado, F.; et al. Reproducibility and Validity of a Food Frequency Questionnaire Designed to AssessDiet in Children Aged 4-5 Years. PLoS ONE 2016, 11, e0167338. [CrossRef]
16. Žvorc, Z.; Mrljak, V.; Sušic, V.; Pompe Gotal, J. Haematological and biochemical parameters during pregnancy and lactation insows. Vet. Arh. 2006, 76, 245–253.
17. Kiziltan, G.; Karabudak, E.; Tuncay, G.; Avsar, F.; Tuncay, P.; Mungan, O.; Meral, P. Dietary intake and nutritional status of Turkishpregnant women during Ramadan. Saudi Med. J. 2005, 26, 1782–1787.
18. Vioque, J.; Navarrete-Muñoz, E.-M.; Gimenez-Monzó, D.; García-de-la-Hera, M.; Granado, F.; Young, I.S.; Ramón, R.; Ballester, F.;Murcia, M.; Rebagliato, M.; et al. Reproducibility and validity of a food frequency questionnaire among pregnant women in aMediterranean area. Nutr. J. 2013, 12, 26. [CrossRef]
19. Willett, W. Nutritional Epidemiology; Oxford University Press: Oxford, UK, 2012.20. Rivas, A.; Romero, A.; Mariscal, M.; Monteagudo, C.; Hernández, J.; Olea-Serrano, F. Validación de cuestionarios para el estudio
de hábitos alimentarios y masa ósea. Nutr. Hosp. 2009, 24, 521–528.21. Barbieri, P.; Crivellenti, L.C.; Nishimura, R.Y.; Sartorelli, D.S. Validation of a food frequency questionnaire to assess food group
intake by pregnant women. J. Hum. Nutr. Diet. 2015, 28, 38–44. [CrossRef]22. Zhang, H.; Qiu, X.; Zhong, C.; Zhang, K.; Xiao, M.; Yi, N.; Xiong, G.; Wang, J.; Yao, J.; Hao, L.; et al. Reproducibility and relative
validity of a semi-quantitative food frequency questionnaire for Chinese pregnant women. Nutr. J. 2015, 14, 56. [CrossRef]23. Mouratidou, T.; Ford, F.; Fraser, R.B. Validation of a food-frequency questionnaire for use in pregnancy. Public Health Nutr. 2006,
9, 515–522. [CrossRef]24. de la Fuente-Arrillaga, C.; Vázquez Ruiz, Z.; Bes-Rastrollo, M.; Sampson, L.; Martinez-González, M.A. Reproducibility of an FFQ
validated in Spain. Public Health Nutr. 2010, 13, 1364–1372. [CrossRef]25. Ogawa, K.; Jwa, S.-C.; Kobayashi, M.; Morisaki, N.; Sago, H.; Fujiwara, T. Validation of a food frequency questionnaire for
Japanese pregnant women with and without nausea and vomiting in early pregnancy. J. Epidemiol. 2017, 27, 201–208. [CrossRef]26. Brantsaeter, A.L.; Haugen, M.; Alexander, J.; Meltzer, H.M. Validity of a new food frequency questionnaire for pregnant women
in the Norwegian Mother and Child Cohort Study (MoBa): Validity of a new FFQ for pregnant women. Matern. Child Nutr. 2007,4, 28–43. [CrossRef]

Nutrients 2021, 13, 3032 15 of 15
27. Martin Bland, J.; Altman, D.G. Statistical methods for assessing agreement between two methods of clinical measurement. Lancet1986, 327, 307–310. [CrossRef]
28. Cade, J.; Thompson, R.; Burley, V.; Warm, D. Development, validation and utilisation of food-frequency questionnaires—A review.Public Health Nutr. 2002, 5, 567–587. [CrossRef]
29. S.L. Gestión de Salud y Nutrición. I-Diet Food Composition Database, Updated from Original Version of G. Martín Peña FCD,2019.
30. European Food Safety Authority (EFSA). Dietary Reference Values for nutrients Summary report. EFSA Supporting Publ. 2017, 14,e15121E.
31. Salcedo-Bellido, I.; Martínez-Galiano, J.; Olmedo-Requena, R.; Mozas-Moreno, J.; Bueno-Cavanillas, A.; Jimenez-Moleon, J.;Delgado-Rodríguez, M. Association between Vitamin Intake during Pregnancy and Risk of Small for Gestational Age. Nutrients2017, 9, 1277. [CrossRef]
32. Loy, S.L.; Marhazlina, M.; Azwany, Y.; Jan, J.M. Development, validity and reproducibility of a food frequency questionnaire inpregnancy for the Universiti Sains Malaysia birth cohort study. Malays. J. Nutr. 2011, 17, 1–18. [PubMed]
33. Giavarina, D. Understanding bland altman analysis. Biochem. Med. 2015, 25, 141–151. [CrossRef] [PubMed]34. Guelinckx, I.; Devlieger, R.; Beckers, K.; Vansant, G. Maternal obesity: Pregnancy complications, gestational weight gain and
nutrition. Obes. Rev. 2008, 9, 140–150. [CrossRef] [PubMed]